geomaterial characterization sub-topics
TRANSCRIPT

Geomaterial Characterization
Sub-topics
• Chemical characterization
pH, TDS, EC, BOD, COD
Sulphite and Chloride contents
Cation-Exchange Capacity
Pore-solution sampling
Corrosion potential
Sorption-Desorption
• Thermal Characterization
• Electrical Characterization

Pore Solution Extraction by Centrifugation
Laboratory technique
• Soil sample mixed with immiscible liquid (CCl4)
• Centrifuged in a tube at a particular rotational speed
• Pore solution is displaced by CCl4
Pore solution could be extracted even from dry soils
Quantity of pore solution extracted depends on soil type
Results obtained cannot be generalized

Importance of Lysimetric studies
Field studies No control of boundary conditions,
cost and time intensive
Laboratory studies Cannot simulate field conditions, Spatial variability cannot be taken into account
Lysimetric study Intermittent approach Simulates In-situ conditions with
better control on boundary conditions
Lysimeter Device which creates a control volume of soil
for studying various contaminant transport
mechanisms under in-situ conditions
Lysimeter identified as a potential tool for studying radioactive contaminant
Interaction and migration in Geoenvironment

R is the soil spiked
(with Cs, Co & Tritium)
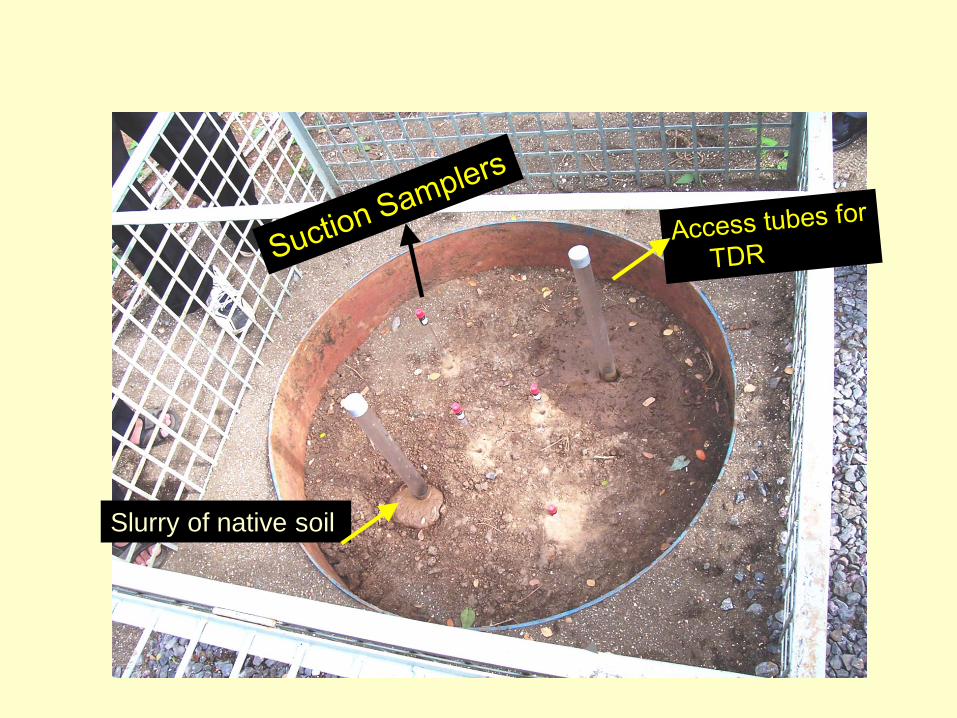
Slurry of native soil
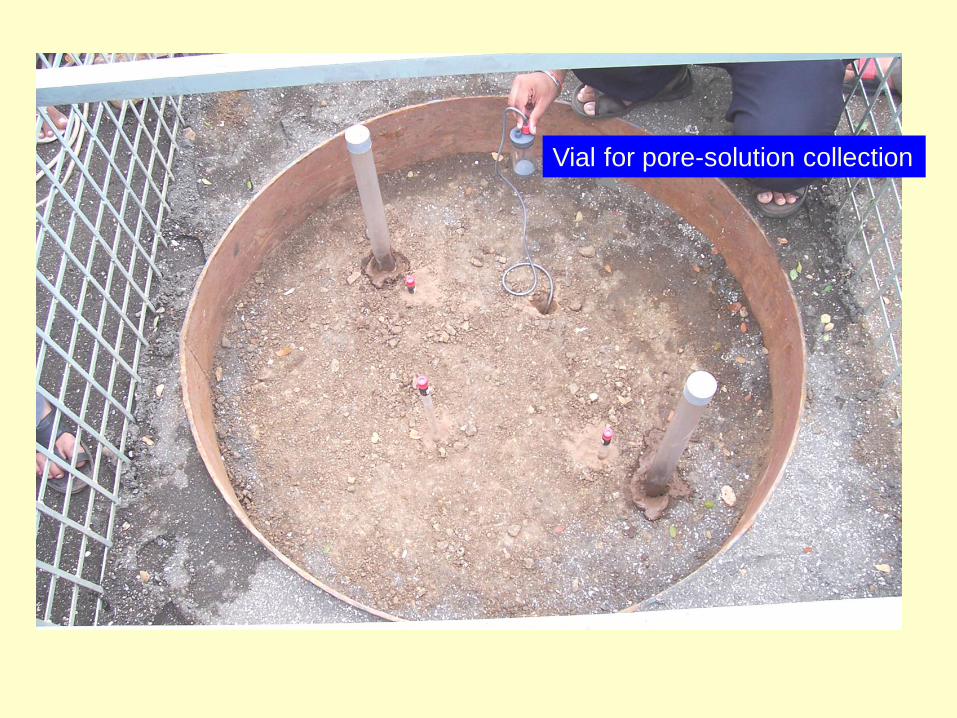
Vial for pore-solution collection

Details of the suction sampler
Stopper
Sample Collector
Flexible rubber tube
To the
vacuum
Pump
Ceramic thimble
Perspex tube
Soil slurry
Screw cap

Activities at a Glance

TDR studies
200
180
160
140
120
100
80
60
40
20
0
0.0 0.1 0.2 0.3 0.4 0.5
De
pth
(cm
)
15/06/05 20/06/05
05/07/05 14/07/05 18/07/05
26/7 flash floods
26/08/05 27/09/05GSL
Hanumantha Rao, B, Sridhar, V., Rakesh, R.R., Singh, D.N., Narayan, P.K. and
Wattal, P.K., “Application of In-situ Lysimetric Studies for Determining Soil Hydraulic
Conductivity”, Geotechnical and Geological Engineering, 2009, DOI 10.1007/
s10706-009-9260-5. Published Online: 13 May 2009.
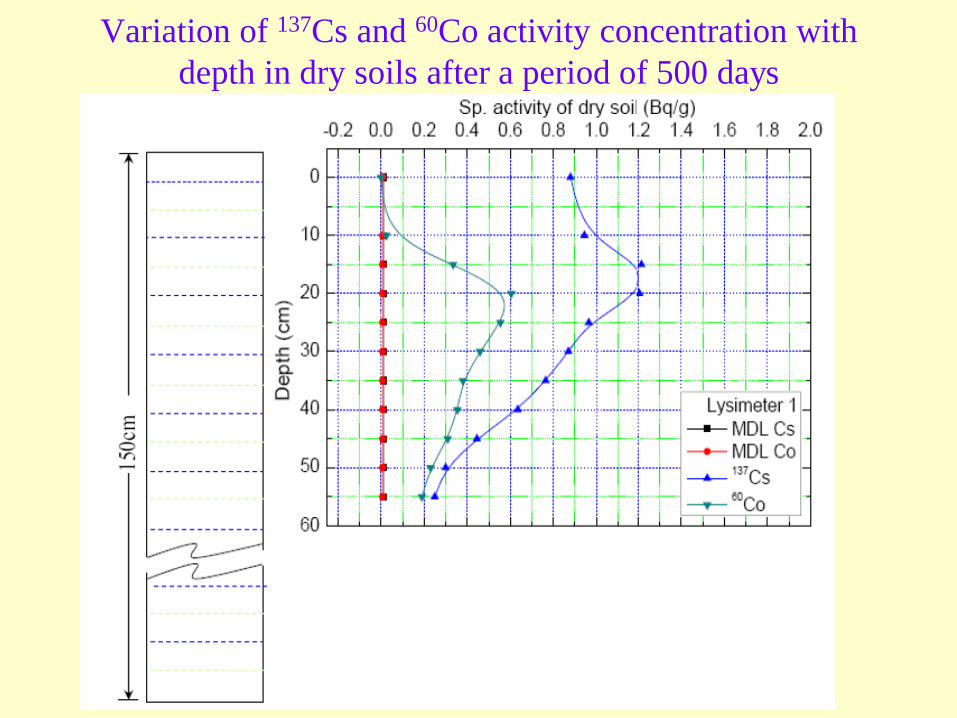
Variation of 137Cs and 60Co activity concentration with
depth in dry soils after a period of 500 days

Pressure Membrane Extractor
S PG
PME
A
P PG
C R
RU
B
Air inlet Pressure gauge
Drain
Expelled water to the sampling bottle
Air pressure
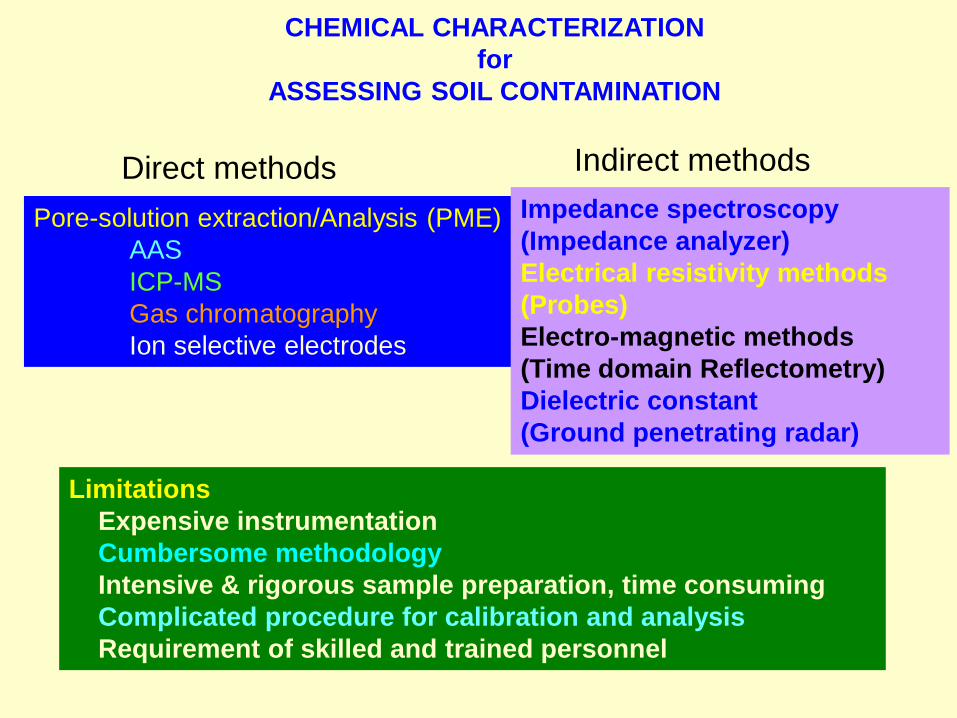
Limitations
Expensive instrumentation
Cumbersome methodology
Intensive & rigorous sample preparation, time consuming
Complicated procedure for calibration and analysis
Requirement of skilled and trained personnel
Pore-solution extraction/Analysis (PME)
AAS
ICP-MS
Gas chromatography
Ion selective electrodes
Impedance spectroscopy
(Impedance analyzer)
Electrical resistivity methods
(Probes)
Electro-magnetic methods
(Time domain Reflectometry)
Dielectric constant
(Ground penetrating radar)
CHEMICAL CHARACTERIZATION
for
ASSESSING SOIL CONTAMINATION
Direct methods Indirect methods

Used for measuring soil suction and characterizing unsaturated soil
Soil Suction Matric(x) suction (soil matrix)
Osmotic suction (salts)
Total
Suction
Soil-water characteristic curve (SWCC)
w
AEV
wr
w : water content
: Soil suction
Exploring the possibility of WP4 (dewpoint potentiameter)
AN INDIRECT METHODOLOGY
FOR ASSESSING SOIL CONTAMINATION
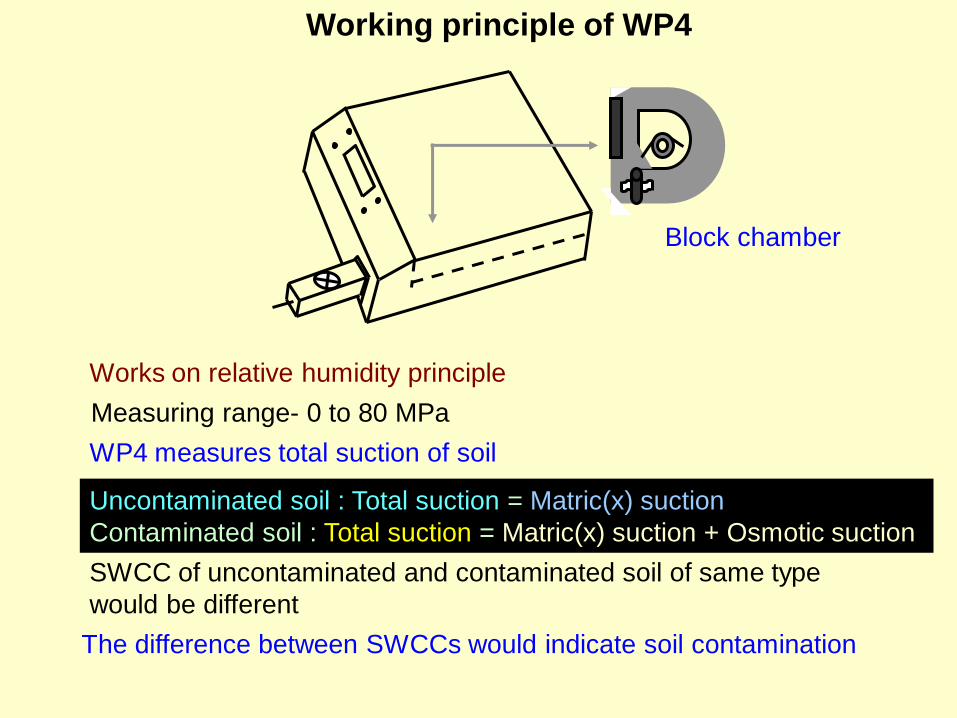
Block chamber
Working principle of WP4
Measuring range- 0 to 80 MPa
Works on relative humidity principle
WP4 measures total suction of soil
Uncontaminated soil : Total suction = Matric(x) suction
Contaminated soil : Total suction = Matric(x) suction + Osmotic suction
SWCC of uncontaminated and contaminated soil of same type
would be different
The difference between SWCCs would indicate soil contamination
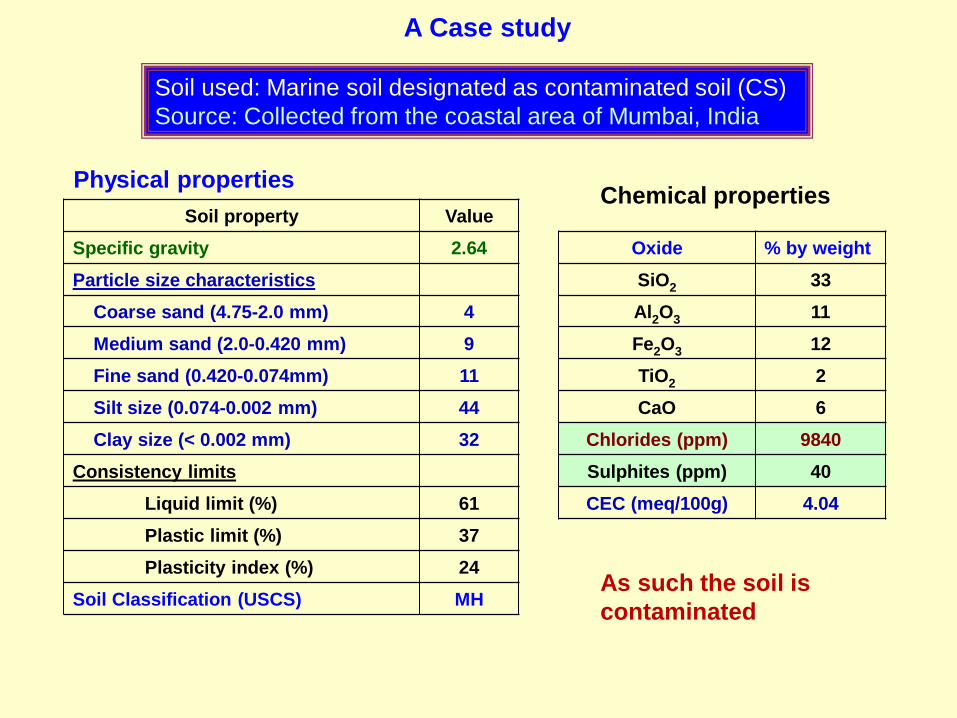
A Case study
Soil used: Marine soil designated as contaminated soil (CS)
Source: Collected from the coastal area of Mumbai, India
Soil property Value
Specific gravity 2.64
Particle size characteristics
Coarse sand (4.75-2.0 mm) 4
Medium sand (2.0-0.420 mm) 9
Fine sand (0.420-0.074mm) 11
Silt size (0.074-0.002 mm) 44
Clay size (< 0.002 mm) 32
Consistency limits
Liquid limit (%) 61
Plastic limit (%) 37
Plasticity index (%) 24
Soil Classification (USCS) MH
Oxide % by weight
SiO2 33
Al2O3 11
Fe2O3 12
TiO2 2
CaO 6
Chlorides (ppm) 9840
Sulphites (ppm) 40
CEC (meq/100g) 4.04
Physical properties Chemical properties
As such the soil is
contaminated
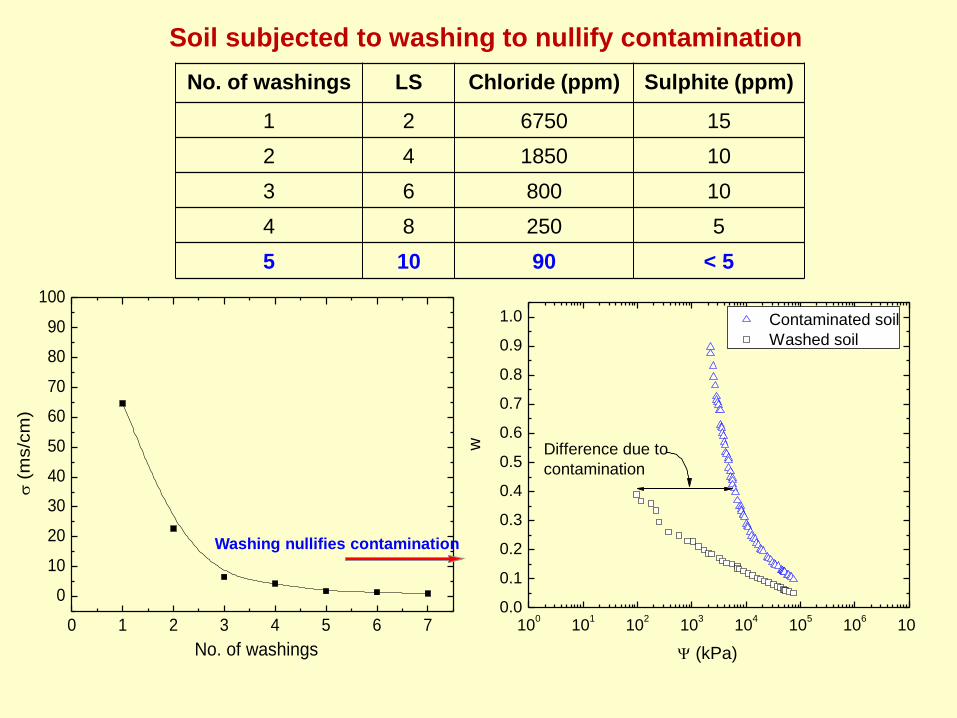
Soil subjected to washing to nullify contamination
No. of washings LS Chloride (ppm) Sulphite (ppm)
1 2 6750 15
2 4 1850 10
3 6 800 10
4 8 250 5
5 10 90 < 5
0 1 2 3 4 5 6 7
0
10
20
30
40
50
60
70
80
90
100
(
ms/c
m)
No. of washings
Washing nullifies contamination
100
101
102
103
104
105
106
107
0.0
0.1
0.2
0.3
0.4
0.5
0.6
0.7
0.8
0.9
1.0
(kPa)
w
Contaminated soil
Washed soil
Difference due to
contamination

For geotechnical engineers, it’s very important subject
Metal corrosion in undisturbed soils is generally very low regardless of
the soil composition (e.g. metal piles, reinforcement of foundation etc.)
Corrosion of metal (steel) in disturbed soils (e.g., buried pipelines that
are backfilled) is strongly affected by soil conditions & properties.
Soil changes its chemical and physical nature continuously over time
and seasonally.
Corrosion Potential of Soils
Pipeline damage
from pitting/corrosion
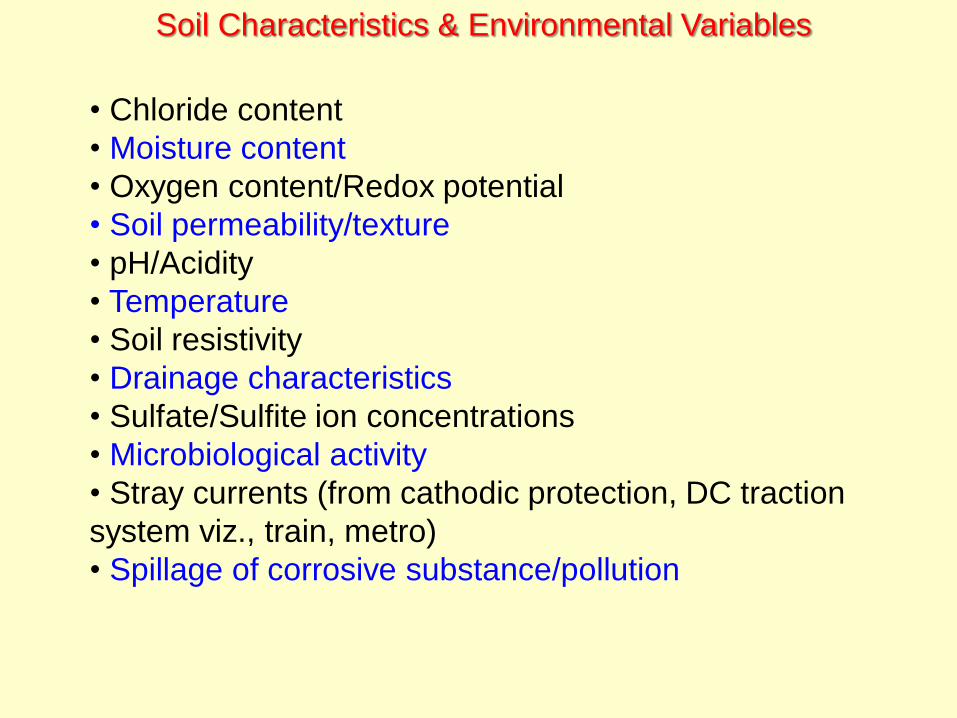
• Chloride content
• Moisture content
• Oxygen content/Redox potential
• Soil permeability/texture
• pH/Acidity
• Temperature
• Soil resistivity
• Drainage characteristics
• Sulfate/Sulfite ion concentrations
• Microbiological activity
• Stray currents (from cathodic protection, DC traction
system viz., train, metro)
• Spillage of corrosive substance/pollution
Soil Characteristics & Environmental Variables

Clay in the soil mass reduces movement of air (oxygen) and water, i.e.
low aeration, when wet, and hence increase in local (pitting) corrosion.
High plasticity of clay (swelling/shrinking soils) can pull off susceptible
coatings on the structures.
Clay is susceptible to cracking (during wetting-drying cycles) which
helps transport of air and moisture to the structures buried in it.
Sand promotes aeration and moisture distribution & hence, soluble
salts and gases (air/oxygen) are easily transported to structures,
causing greater general corrosion but less pitting.
Soil Classification/Texture

Bored Cast in-situ piles
Reinforcement in concrete pile exposed due to leaching of concrete
Chloride and Sulphate content of water found well within prescribed
limit & hence water not corrosive.
Ryzner index (RI) of water was found out to be 7.7 & hence water is
corrosive and unsaturated

pH scale for Soils
Langelier Saturation Index (LI)
Determines if calcium carbonate will precipitate or not
LI = pH – pHs
pH = actual pH value measured in the water
pHs = pH of the water in equilibrium with solid CaCO3
If LI > 0 calcium carbonate will precipitate
If LI < 0 calcium carbonate won’t precipitate
The CaCO3 layer deposited on surfaces acts as a protective coating.
Ryznar Index
Determines the degree of scale formation
RI = 2 pHs – pH
RI < 5.5 heavy scale will form
5.5 < RI < 6.2 scale will form
6.8 < RI < 8.5 water is corrosive
RI > 8.5 water is very corrosive
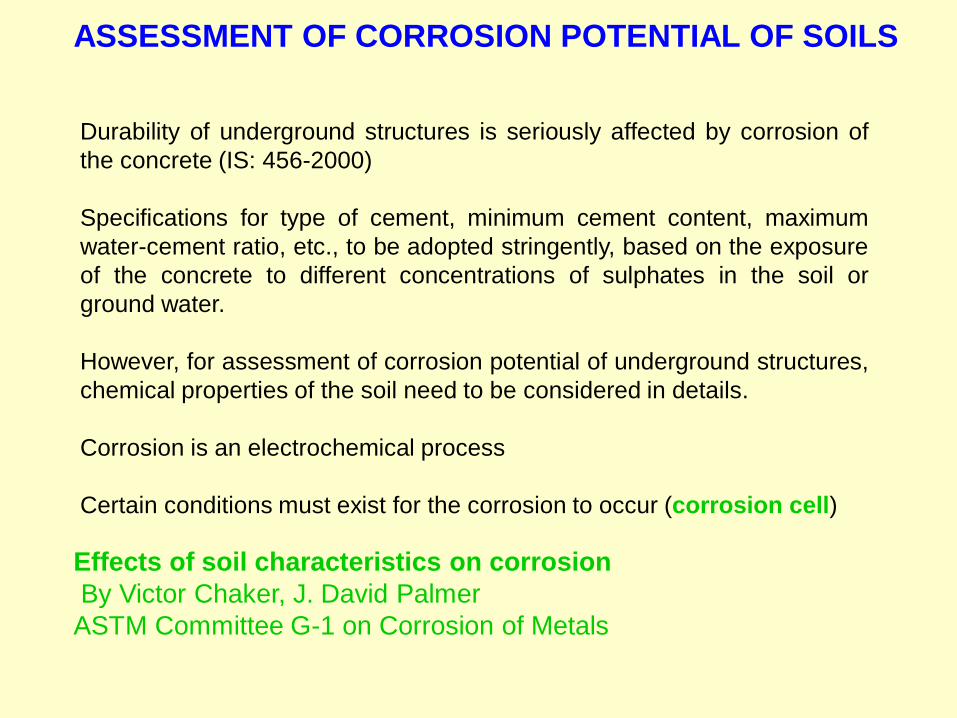
ASSESSMENT OF CORROSION POTENTIAL OF SOILS
Durability of underground structures is seriously affected by corrosion of
the concrete (IS: 456-2000)
Specifications for type of cement, minimum cement content, maximum
water-cement ratio, etc., to be adopted stringently, based on the exposure
of the concrete to different concentrations of sulphates in the soil or
ground water.
However, for assessment of corrosion potential of underground structures,
chemical properties of the soil need to be considered in details.
Corrosion is an electrochemical process
Certain conditions must exist for the corrosion to occur (corrosion cell)
Effects of soil characteristics on corrosion
By Victor Chaker, J. David Palmer
ASTM Committee G-1 on Corrosion of Metals
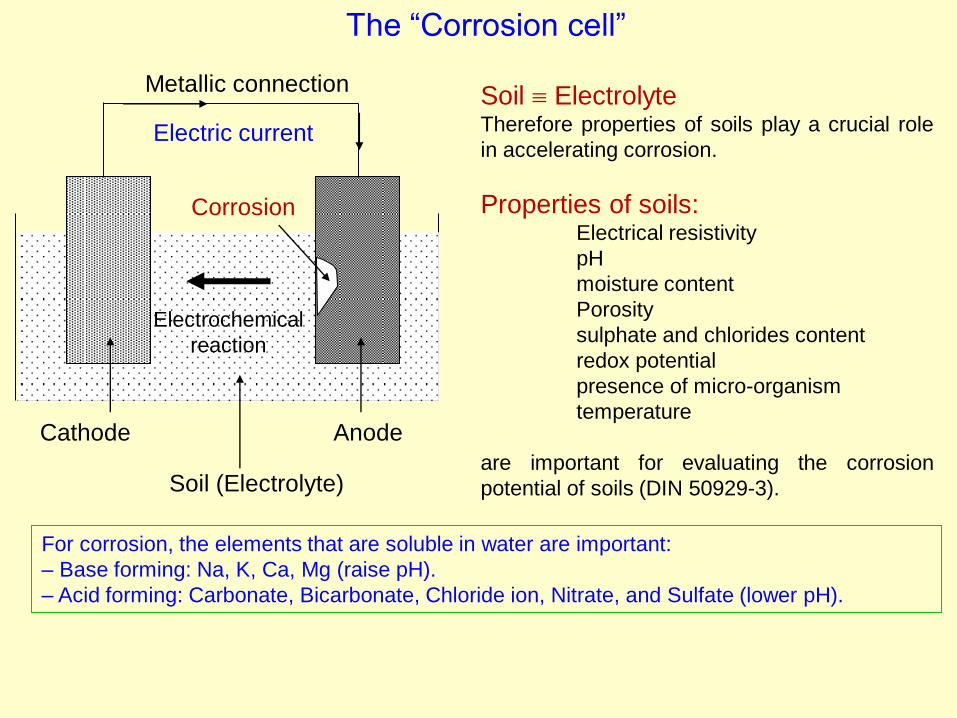
Soil (Electrolyte)
Metallic connection
Anode Cathode
Electric current
Electrochemical
reaction
Corrosion
The “Corrosion cell”
Soil Electrolyte Therefore properties of soils play a crucial role
in accelerating corrosion.
Properties of soils: Electrical resistivity
pH
moisture content
Porosity
sulphate and chlorides content
redox potential
presence of micro-organism
temperature
are important for evaluating the corrosion
potential of soils (DIN 50929-3).
For corrosion, the elements that are soluble in water are important:
– Base forming: Na, K, Ca, Mg (raise pH).
– Acid forming: Carbonate, Bicarbonate, Chloride ion, Nitrate, and Sulfate (lower pH).

Rating based on the soil fraction
Rating based on the electrical resistivity
Rating based on the pH
Rating Based on the ground water status
Rating based on the sulphite content
Rating based on the chloride content
Based on different soil characteristics, a certain rating (R1 to
R6) for the soils has been assigned and the sum of these
ratings is a measure of the overall soil corrosivity.
Rating based on the soil fraction
Soil fraction % by
weight R1
Clay & silt <10 +4
10 to 30 +2
30 to 50 0
50 to 80 -2
>80 -4
Organic matter, e.g.:
muddy or swampy
soils:
peat, mud, marsh
>5 -12
Severely polluted:
due to fuel ash, slag
coal, coke, refuse,
rubbish or waste water
- -12
Rating based on the electrical resistivity
Resistivity (.m) R2
>500 +4
200 to 500 +2
50 to 200 0
20 to 50 -2
10 to 20 -4
<10 -6
Rating based on the pH
PH R3
>9 +2
5.5 to 9 0
4.0 to 5.5 -1
<4 -3
Higher conductivity: high corrosion rate
(efficient electrolyte)

Rating Based on the ground water status
Ground water status R4
No groundwater 0
Groundwater -1
Groundwater at times -2
Rating based on the sulphite content
Sulphite content (g/l) R5
<0.15 0
0.15 to 1 -2
1 to 2 -4
>2 -6
Rating based on the chloride content
Chloride content (ppm) R6
<100 0
100-2000 -2
2000-10000 -4
>10000 -6
Total assessment of the corrosion potential
Summation of R1- R6
R
Corrosion
potential
0 Virtually not
corrosive
-1 to -4 Slightly
corrosive
-5 to -10 Corrosive
< -10 Highly
corrosive
Chloride ions: Cause pitting of steel
and decrease soil resistivity.
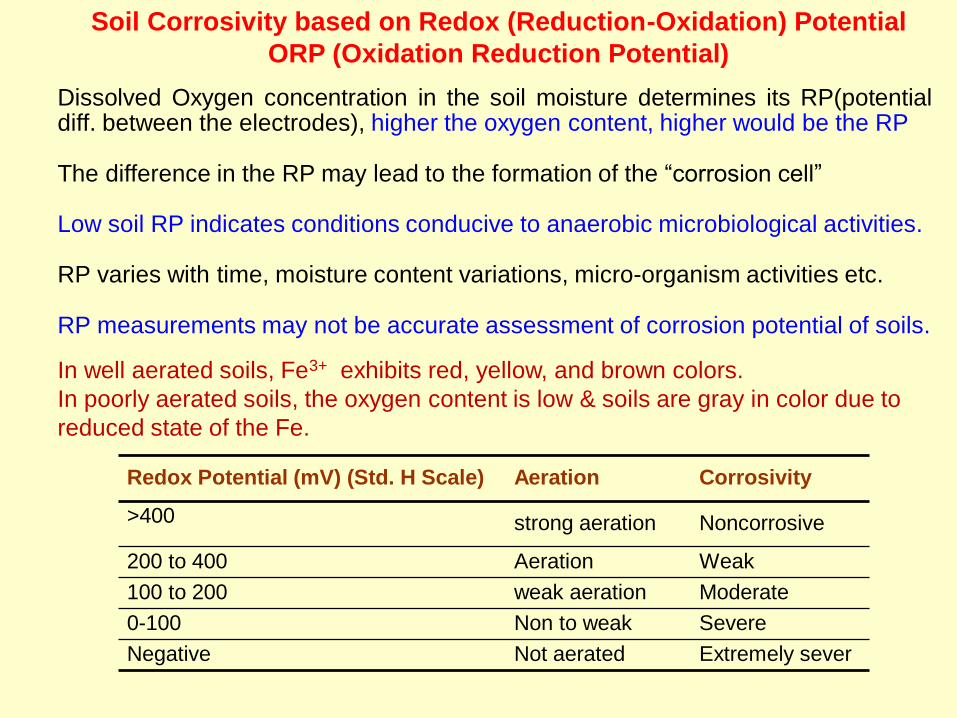
Dissolved Oxygen concentration in the soil moisture determines its RP(potential diff. between the electrodes), higher the oxygen content, higher would be the RP The difference in the RP may lead to the formation of the “corrosion cell” Low soil RP indicates conditions conducive to anaerobic microbiological activities. RP varies with time, moisture content variations, micro-organism activities etc. RP measurements may not be accurate assessment of corrosion potential of soils.
Redox Potential (mV) (Std. H Scale) Aeration Corrosivity
>400 strong aeration Noncorrosive
200 to 400 Aeration Weak
100 to 200 weak aeration Moderate
0-100 Non to weak Severe
Negative Not aerated Extremely sever
Soil Corrosivity based on Redox (Reduction-Oxidation) Potential
ORP (Oxidation Reduction Potential)
In well aerated soils, Fe3+ exhibits red, yellow, and brown colors.
In poorly aerated soils, the oxygen content is low & soils are gray in color due to
reduced state of the Fe.