geological hazard assessment in georgia - cenndrm.cenn.org/hazard_assessment_files/eng/report...2 1....
TRANSCRIPT

Geological hazard assessment in
Georgia
George Gaprindashvili
National Environmental Agency
September 2011

2
1. The Study area
Georgia is a sovereign state in the Caucasus region of Eurasia (shown in Fig. 1). Situated at the
juncture of Eastern Europe and Western Asia it is bounded to the west by the Black Sea, to the
north by Russia, to the southwest by Turkey, to the south by Armenia, and to the southeast by
Azerbaijan. Georgia covers a territory of 69,700 km² and its population is almost 4.5 million.
The Greater Caucasus Mountain Range is much higher in elevation than the Lesser Caucasus
Mountains, with the highest peaks rising more than 5,000 meters above sea level.
Georgia is divided into two autonomous republics (Adjara and Apkhazeti) and nine regions
(shown in Fig. 2). The nine regions are Guria, Imereti, Kakheti, Kvemo Kartli, Mtskheta-
Mtianeti, Racha-Lechkhumi and Kvemo Svaneti, Samegrelo-Zemo Svaneti, Samtskhe-Javakheti,
and Shida Kartli.
The Study area – Georgia (Source: Google Earth)
Administrative map of Georgia

3
Despite its small area, Georgia has one of the most varied topographies of the Eastern
Europe. Georgia lies mostly in the Caucasus Mountains, and its northern boundary is
partly defined by the Greater Caucasus range. The Lesser Caucasus range, which runs
parallel to the Turkish and Armenian borders, and the Surami and Imereti ranges, which
connect the Greater Caucasus and the Lesser Caucasus, create natural barriers that are
partly responsible for cultural and linguistic differences among regions. Because of their
elevation and a poorly developed transportation infrastructure, many mountain villages
are virtually isolated from the outside world during the winter. Earthquakes and
landslides in mountainous areas present a significant threat to life and property.
Georgia has about 26,000 rivers. Drainage is into the Black Sea to the west and through
Azerbaijan to the Caspian Sea to the east. The largest river is the Mtkvari, which flows
1,364 km from northeast Turkey across the plains of eastern Georgia, through the capital,
Tbilisi, and into the Caspian Sea. The Rioni River, the largest river in western Georgia,
rises in the Greater Caucasus and empties into the Black Sea at the port of Poti.
The climate of Georgia is extremely diverse, considering the country's small size. There are two
main climatic zones, roughly separating Eastern and Western parts of the country. The Greater
Caucasus Mountain Range plays an important role in moderating Georgia's climate and protects
the country from the penetration of colder air masses from the north. The Lesser Caucasus
Mountains partially protect the region from the influence of dry and hot air masses from the
south as well.
Much of western Georgia lies within the northern periphery of the humid subtropical zone with
annual precipitation ranging from 1000–4000 mm. The climate of the region varies significantly
with elevation and while much of the lowland areas of western Georgia are relatively warm
throughout the year, the foothills and mountainous areas experience cool, wet summers and
snowy winters (snow cover often exceeds 2 meters in many regions).
Adjara is the wettest region of the Caucasus, where the Mt. Mtirala rainforest, east of Kobuleti
receives around 4500 mm of precipitation per year. Midwinter average temperature in West
Georgia is 5 C and the midsummer average is 22C.
Eastern Georgia has a transitional climate from humid subtropical to continental. The region's
weather patterns are influenced both by dry, Central Asian/Caspian air masses from the east and
humid, Black Sea air masses from the west. The penetration of humid air masses from the
Black Sea is often blocked by several mountain ranges (Likhi and Meskheti). Annual
precipitation is considerably less than that of western Georgia and ranges from 400–1600 mm.
The wettest periods generally occur during spring and autumn while winter and the Summer
months tend to be the driest. Much of eastern Georgia experiences hot summers (especially in
the low-lying areas) and relatively cold winters. As in the western parts of the country,
elevation plays an important role in eastern Georgia where climatic conditions above 1500
meters are considerably colder than in the low-lying areas. The regions that lie above 2000
meters frequently experience frost even during the summer months. The average temperature in
summer here is 20-24 degrees of Celsius, in winter 2-4 degrees of Celsius. Humidity is lower.
In Georgia a strong influence of natural hazards (earthquake, floods, flashflood landslide,
mudflow, rockfall, avalanche and etc) is experienced by thousands of populated areas, plots of
field, roads, oil and gas pipes, high-voltage electric power transmission towers, hydraulic
structures and reclamation constructions, mountain and tourist complexes, etc.
Many environmental factors, related to the fields of geology, geomorphology, topography and
land use, have the potential to affect land sliding (Clerici et al., 2002). Moreover, most of the
quantitative risk assessment methods that have been developed elsewhere are case-specific and

4
require many types of data, on landslide occurrence and impact, most of which, however, are
not yet available in Georgia.
The objectives of this project are as follows:
Define and justify a relevant set of spatial criteria for this case of Geological hazard
assessment.
Develop a mass movement initiation model based on Spatial Multi Criteria Evaluation.
Analyze the relevant factors related to the occurrence of landslides based on expert
knowledge from literature and local landslide experts
Generate landslide susceptibility map for whole country.
2. Data Description
In order to assess the landslide hazard in the Georgia area, the following dataset were utilized:
Topographic map data at 1:50,000 scale
Geology map of Georgia (scale 1:500 000)
Faults (from Geology map scale 1:500 000)
Roads (from topographic map scale 1:200 000)
Landcover Data (scale: 1:500 000)
Geomorphology map (scale 1:500 000)
Physical-Geographical Zoning map (scale 1:500 000)
Hydrography (from topographic map scale 1:25 000)
PGA map – national building codes of Georgia (2009)
Landslide inventory map
Mudflow inventory map
Rockfall inventory map

5
3. Methodology
The landslide risk index method started with the selection of indicator maps, the way the
criteria are going to be structured and the selection of standardisation and weighting methods.
As mentioned above, in Georgia, the landslide inventory maps in digital format are still under
development and does not have a full national coverage yet. If a complete landslide database
would have been available, it could have served as the main input in the landslide risk index, as
landslide density of landslides per municipality could then have been used as the main hazard
indicators and the landslide damage per municipality as the main vulnerability indicator.
For implementing the model the SMCE module of ILWIS-GIS was used. SMCE application
assists and guides users in doing multi-criteria evaluation in a spatial manner. The input is a set
of maps that are the spatial representation of the criteria. They are grouped, standardized and
weighted in a ‘criteria tree.’ The output is one or more ‘composite index map, which indicates
the realization of the model implemented. The theoretical background for the multi-criteria
evaluation is based on the analytical hierarchical process (AHP) developed by Saaty (1980).
The AHP has been extensively applied on decision-making problems (Saaty and Vargas 2001),
and only recently, some research has been carried out to apply AHP to landslide susceptibility
assessment (fig. 3).
Schematic procedure for spatial multi-criteria evaluation based on the analytical
Hierarchical process

6
3.1 Standardization, weighting
To make spatial multi-criteria analysis possible, the input layers need to be standardized from
their original values to the value range of 0–1. There was provided different standardization in
the SMCE module of ILWIS (ITC 2001). For standardizing value maps, a set of equations can
be used to convert the actual map values to a range between 0 and 1. The class maps use an
associated table for standardisation where a column must be filled with values between 0 and 1.
In Section Indicator Analysis, a detailed description of the indicator maps and their
standardization is given. The next step is to decide for each indicator whether it is favourable or
unfavourable in relation to the intermediate or overall objective.
The most important constraint indicator used for the national landslide risk assessment is the
slope angle. In areas that have very gentle or flat slopes, landslides are not expected or occur
only under very specific conditions. After selecting the appropriate indicators, defining their
standardisation and the hierarchical structure weights were assigned to each criteria and
intermediate result. For weighting, 3 main methods can be used: direct method, pairwise
comparison and rank order methods. Finally landslide index map was created by direct method.
4. Parameter maps
4.1 Slope gradient
Topography is one of the most important factors in landslide, mudflow and rockfall
susceptibility assessment. The slope angle is directly related to the geological hazards, it is
frequently used in preparing geological susceptibility maps. The slope map of the study
area was divided into 9 slope categories.
Based on literature study (Berti, Genevois et al., 2000; Catani, Casagli et al., 2005; Dai & Lee,
2002; Thiery, Malet, et al., 2007) the following standardized values for slope classes were used
in this analysis, ranging from 0 to 10, where 10 means high susceptible area for landslide and 0
none susceptible (Tab. 1 and Fig. 2). Later these values were converted to a range 0 to 1.
Slope weight map

7
4.2 Geology
The landslide, mudflow, rockfall phenomenon, a part of then geomorphologic studies and
research, is related to the lithology and weathering properties of the material of the land. There
are many previous studies showing the correlation of geological hazards frequency with
lithology.
Within each stratigraphical unit, there are 145 lithological units. These units were given a value
for the likelihood of hazards, with values ranging from 0 to 10, in which 10 means very prone
to hazards, and 0 means not prone to hazards. Which later were on converted to a range
between 0 and 1 (Table 2 and fig. 6).
Table 2. Normalized weight assigned of Lithology (not all geological units are displayed)
ID index Lithology Value
63 K2t-m
Turoian, Coniacian, Santonian, Campanian and Maastrichtian stages.
Adjara-Trialetian zone: thinbedded red-coloured and pink limestones
and marls, bedded lithorgaphic limestones with interscalations of
bentonitic clays, sandy and marly limestones, sandstones, rarely lenses
of conglomerates
3
75 K1b-h1 Berriasian and Valanginian stages and lower substage of Hauterivian
stage. Mestia-Tianeti zone: clastic-limestone and sandstone turbidites,
pelagic marls, limestones, argillites and clay shales 5
76 J2
Middle Jurassic (undismembered). Kazbegi-Lagodekhi and Ckhalta-
Laila zones: clay and sandy shales, argillites, sandstones and siltstones,
lavas and tuffs of tholeiitic basalts
4
Geology Weight map.

8
4.3 Landcover
Landcover was chosen as another criterion. According to other studies (Dilley, Chen et al.,
2005; Hong, Adler, et al., 2007), the geological hazards susceptibility for global land cover are
assigned with numerical values In our study area Georgia, there are 31 types of land cover.
Table 3 and figure 7 shows the standardized values that were used based on the literature and
expert weighting by several experts.
Table 3. Numerical value assigned to each land type
Standardize
d value
Landcover type
0 Lake, glacier, water reservoir, large river, wetland
1 Bare glacial moraine, badland, rocky
2 Dense forest
3 Open forest, park
4 Orchard , Scrub
5 Urban park
6 Vineyard
7 Grass land, Island
8 Agriculture land
9 Bare river sand
10 Settlement area, urban area, cemetery, railway
Landcover weight map

9
4.4 Distance to the road network
Construction of roads also influences the density of geological hazards, especially in sloping
areas where road cuts are made. In this study, roads that are located on areas with slopes steeper
than 20 degree and that are close to a road are taken into account with the value of 1, other
areas are assigned value of 0.
4.5 PGA
The maximum peak ground acceleration (PGA) with a 50 year return period was used as an
indicator map in a study. The PGA values obtained for Georgia ranges between 0.05 and 0.51g,
with a mean of 0.25 (0.11SD).

10
4.5 Distance from Faults
Distance from major Faults was chosen as another criterion. There are several major Faults in
our study area, but only major active Faults cause hazards in Georgia. It was created buffer
zones. Threshold magnitudes, minimum shaking intensities, and relations between M and
distance from epicenter or fault rupture were used to define relative levels of shaking that
trigger landslides in susceptible materials.

11
4.5 Distances from Hydrography – river were grouped by classes.
4.6 Geomorphology map – map was digitized from national atlas of Georgia (1964) scale was
1:500 000.
4.7 Physical-Geographical Zoning map – map was digitized from national atlas of Georgia
(1964) scale 1:500 000.
4.8 Hazard inventory maps – created from NEA formational bulletins since 2004.
12
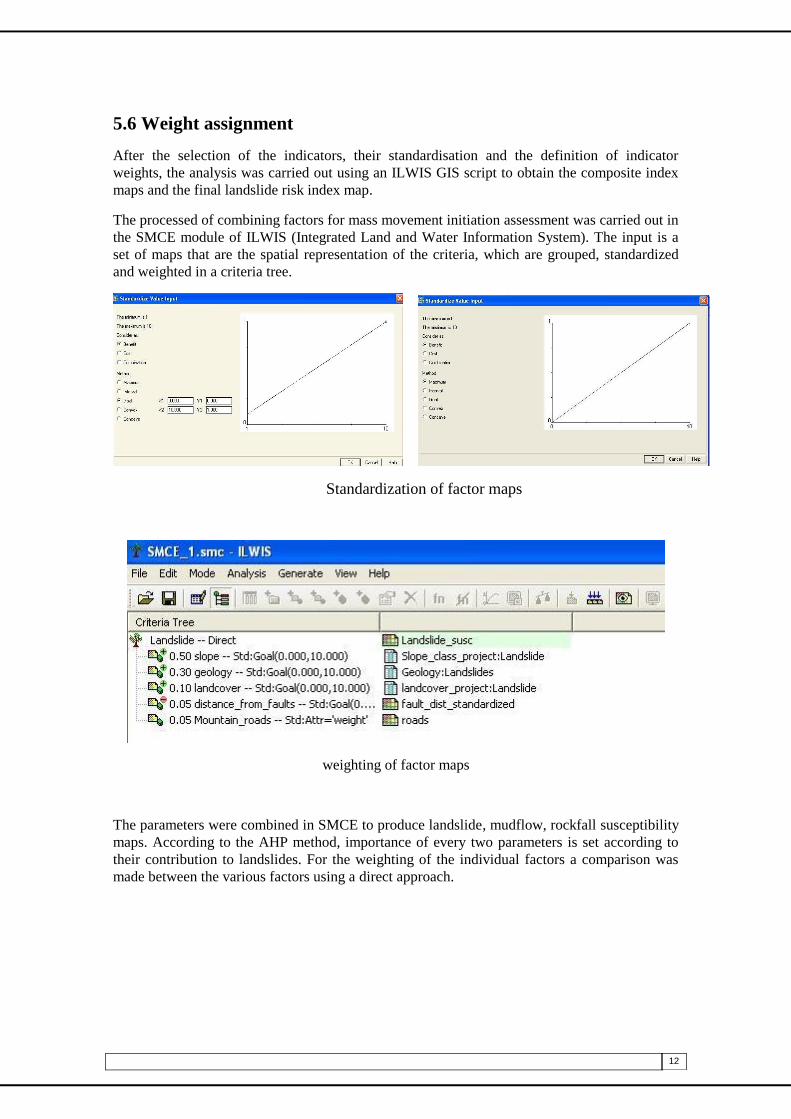
5.6 Weight assignment
After the selection of the indicators, their standardisation and the definition of indicator
weights, the analysis was carried out using an ILWIS GIS script to obtain the composite index
maps and the final landslide risk index map.
The processed of combining factors for mass movement initiation assessment was carried out in
the SMCE module of ILWIS (Integrated Land and Water Information System). The input is a
set of maps that are the spatial representation of the criteria, which are grouped, standardized
and weighted in a criteria tree.
Standardization of factor maps
weighting of factor maps
The parameters were combined in SMCE to produce landslide, mudflow, rockfall susceptibility
maps. According to the AHP method, importance of every two parameters is set according to
their contribution to landslides. For the weighting of the individual factors a comparison was
made between the various factors using a direct approach.

13

14
5.7 Susceptibility assessment
Based on the weights assignment, we carried out the susceptibility assessment. The final
weights of the resulting map ranged from 0.06-0.93 (landslide), 0.0-0.96 (mudflow), 0.0-0.9
(rockfall).

15
Landslide susceptibility map of Georgia
Mudflow hazard map of Georgia

16
rockfall hazard map of Georgia