geological and satellite data analysis to define a not
TRANSCRIPT

1
Geological and Satellite data analysis to define a not-discovered Porphyry-Copper Systems in Peru:
By IGT-Team:
Andrey F. Chitalin1, Polina Mikhaylyukova2, Dmitry V. Sivkov1, Sergey S. Popov1
(1) Institute of Geotechnology LLC, Moscow Russia (2) LMSU Marine Research Center, Moscow Russia
Prepared for
Copa de Cobre
OZ Minerals Challenge
8 Oct 2020 - 20 Nov 2020

2
TABLE OF CONTENT Executive Summary ……………………………………………………………………………………………………..…3
1. Introduction ……………………………………………………………………………………………..…………………….3
2. Methodology ……………………………………………………………………………………………..……………….....3
3. Geological analysis of Peruvian copper and associated deposits ………………..……………………3
3.1. Regional structural control of the copper deposits in the Andes …………..………………….3
3.2. Structure of the deposits…………………………………………………………………………………………..7
3.3. Metasomatic minerals and their reflections on multispectral satellite images ..………..10
4. Spectral analysis of satellite data …………………………………………………………………………………….15
4.1. Analysis of spectral properties of alteration minerals …………………….....……….………15
4.2. Sentinel-2/ image interpretation based on spectral bands ………………………………….17
5. Interpretation of Lineament Density Maps Extracted Using LESSA Software ……………………22
5.1. Research Methodology …………………………………………………………………………………22
5.2. Structural interpretation of lineaments density trends and nodes. Structural control of
deposit localization ……………………………………………………………………………………….27
6. Forecasting of Porphyry Copper deposits …………………………………………………………………………29
6.1. Porphyry Copper Systems identified by spectral anomalies…………………….29
6.2. Correlation results between Spectral Anomalies and Lineament Density
Anomalies ……………………………………………………………………………………………….…….33
7. Conclusion ………………………………………………………………………………………..……………………….…….36
8. List of references ………………………………………………………………………………………………….………….36
9. Appendices …………………………………………………………………………….………………………………………..37

3
Executive Summary
IGT's approach to predicting the Porphyry Copper Systems has been implemented using satellite images processing methods including spectral analysis and lineament analysis and geological interpretation of results based on the most informative geological data reflecting the main features of the deposits.
1. Introduction
The goal is to identify new regions in Peru that could host copper deposits using the publicly available
country-scale satellite data which has been collected and made. This challenge is to use that data to
generate feature maps that highlight the geological patterns, that can then be used to help OZ Minerals
in their exploration efforts.
Since the Porhyry Copper type deposits are the most important for copper production around the
world, and most of Peruvian copper deposits are the Porphyry type, we decide that the main goal should
be to search for Porphyry Copper deposits. And we concentrated on southern Peru where some porphyry-
copper deposits are exploring and mining for many years.
When searching for Porphyry-Cu deposits, associated copper, gold, silver and base metals deposits of
different types can be discovered at the same time.
2. Methodology
Our methodology for forecasting Porphyry Copper deposits consists in the combined use of geological
analysis of the features of deposits that we predict, and spectral and lineament analysis of multispectral
satellite images.
3. Geological analysis of Peruvian copper and associated deposits
The published literature on copper deposits in Peru, as well as on associated deposits was analyzed.
We used publications of Economic Geology over the past 46 years (since 1974 up to 2020).
3.1. Regional structural control of the copper deposits in the Andes
The significant part of the Peru`s territory is located in the Andes. There are many copper and gold
deposits in the mountainous part of the country. Geologically, zoning can be traced: from West to East,
in narrow bands parallel to the coastline, intrusive rocks successively replaced by volcanic and
sedimentary rocks (Fig. 3.1).
In the Andes, in Mesozoic-Cenozoic time the situation of sub-latitudinal compression is dominated.
The main tectonic structure run parallel to the coastline and have a North-Western orientation. On the
local level (the Yanacocha, the Cordillera Blanca field, San Rafael) the situation of the left shift during sub
latitudinal compression is established.
In the Peruvian and Chilean Andes, copper-porhyry deposits as well as associated deposits are
controlled by regional NNW trending reverse faults and thrusts, as well as by transverse and diagonal
strike-slip faults. A lot of large deposits are localized at fault junctions (Fig. 3.3)

4
Figure 3.1. Schematic map showing the geology of western Peru and general location of the Yanacocha
mining district (from Teal&Benavides, 2010).

5
Figure 3.2. Geological sketch map of the Central Andes showing the locations of major Cu and Au
deposits (from Sillitoe, 1992) and their spatial relationships to the West Fissure Zone and its intersections
with cross-orogen lineaments (from Salfity, 1985). Modified from Richards (2000).

6
Figure. 3.3. Geologic map of the Pataz province with location of the main gold deposits (from Haeberlin
et al., 2004).

7
3.2. Structure of the deposits
The deposits have mineral zoning – metasomatic and ore. Ore bodies have a distinct structural control. Copper-bearing base metal Cerro de Pasco deposit.
Ore bodies are controlled by N/NW and E/NE trending faults. Echelon-like locations of some ore
bodies can be interpreted as structures of local extension in the zones of right-hand shear zone trending ENE (Fig. 3.4.).
Figure 3.4. Modified Geologic map of the Cerro de Pasco open pit, showing the rock units, the structure, and the different mineralization stages, based on maps of the Cerro de Pasco Geology staff, (from Baumgartner et al., 2008). Red lines show ore controlling fault zones.

8
Morococha cluster
The Porphyry Cu-Mo stockworks and veins are localized at the intersection of conjugate strike-slip faults - a dextral of NNW strike and a sinistral of WNW strike (Fig. 3.5).
Figure 3.5. Geological map of the Morococha district, (from Catchpole et al., 2015), with IGT`s interpretation: red lines limits the structural mineralized trends with strike-slip kinematics. Veins fills a Riedel faults R and R’
The relationship of the concentric mineral zoning of the porphyry-copper system, massive sulfide ores, and ore-bearing veins is shown in Fig. 3.6.
Figure 3.6. Geological map of mining level 400 (4,375 m.a.s.l.) showing the distribution of massive sulfide mineralization (compiled from multiple levels) in the central Morococha district, [from Catchpole et al., 2015] with IGT`s interpretation: red lines - boundaries of mineralized structural trends of strike-slip kinematics. Massive sulfide ore bodies and ore-bearing veins fills Riedel chips
9
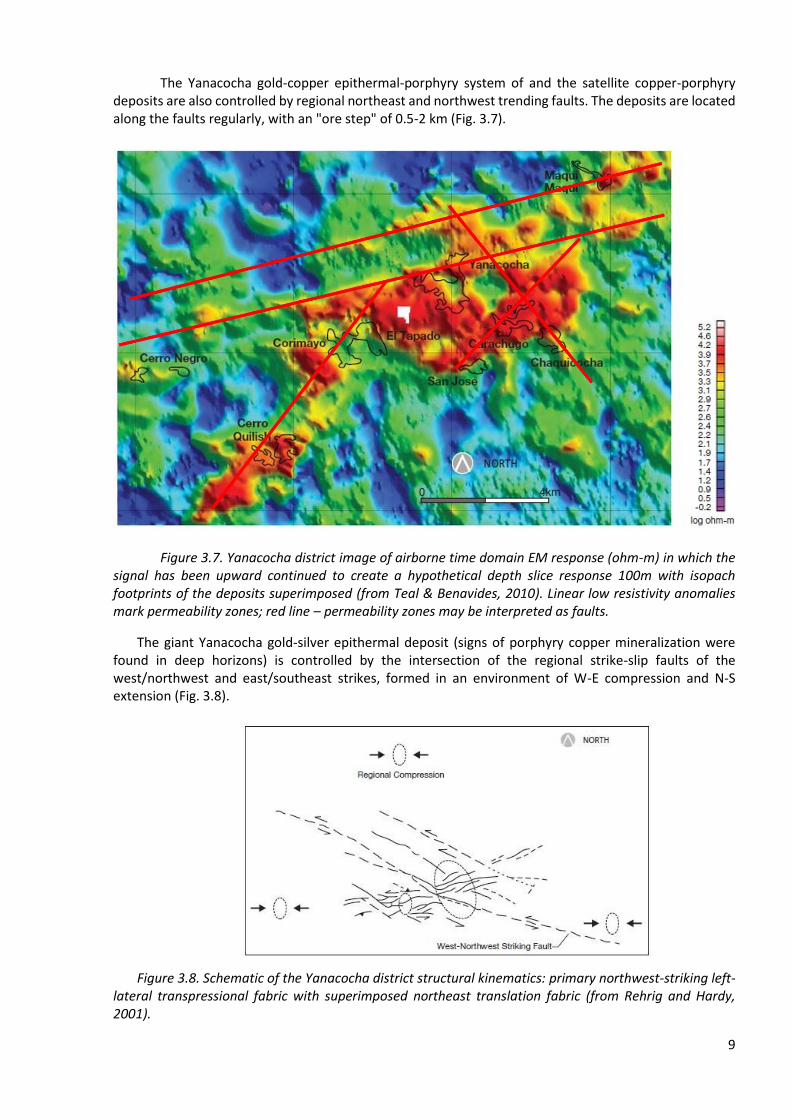
The Yanacocha gold-copper epithermal-porphyry system of and the satellite copper-porphyry deposits are also controlled by regional northeast and northwest trending faults. The deposits are located along the faults regularly, with an "ore step" of 0.5-2 km (Fig. 3.7).
Figure 3.7. Yanacocha district image of airborne time domain EM response (ohm-m) in which the signal has been upward continued to create a hypothetical depth slice response 100m with isopach footprints of the deposits superimposed (from Teal & Benavides, 2010). Linear low resistivity anomalies mark permeability zones; red line – permeability zones may be interpreted as faults.
The giant Yanacocha gold-silver epithermal deposit (signs of porphyry copper mineralization were found in deep horizons) is controlled by the intersection of the regional strike-slip faults of the west/northwest and east/southeast strikes, formed in an environment of W-E compression and N-S extension (Fig. 3.8).
Figure 3.8. Schematic of the Yanacocha district structural kinematics: primary northwest-striking left-lateral transpressional fabric with superimposed northeast translation fabric (from Rehrig and Hardy, 2001).

10
Gold-bearing epithermal veins fill the structures of tension and are controlled by conjugate shifts formed in the conditions of regional northeast-southwest compression and northwest-southeast stretching (Fig. 3.9).
Figure 3.9. System of gold-bearing veins of the Pataz deposit and their kinematics (Haeberlin et al., 2004).
Conclusions
In the Peruvian Andes, copper-porphyry deposits and associated copper and gold deposits are controlled by longitudinal nortwest and transverse east/northeast faults and their intersection points.
Lineament analysis of satellite images will help to identify such faults and nodes. Their coincidence
with the spectral anomalies of metasomatic minerals (see below) will indicate the presence of an ore-bearing system (deposit).
3.3. Metasomatic minerals of the deposits and their reflections on multispectral satellite images
Ore deposits of the Peruvian Andes were formed after the intrusion of medium and acidic magmas into sedimentary strata of Mesozoic/Paleozoic age and further hydrothermal processing of crystallized Intrusive bodies and host rocks. Metasomatic alteration was widely manifested at the pre-ore and syn-ore stages. Mineral indicators of the mineralization zones are metasomatic minerals. These minerals can be defined by their spectral characteristics on multispectral satellite images and the detected anomalies can be used for forecasting deposits.
The Table 1, based on the available literature data, was compiled for the presence of metasomatic
indicator minerals in copper deposits in Peru. The minerals are grouped into different alteration associations.

11
a) a) WorldView-3 kaolinite alteration. Red = probable kaolinite, blue = possible kaolinite
b) WorldView-3 sericite alteration. Red = probable sericite, blue = possible sericite. Sericite may be any combination of the mica minerals: muscovite, illite, paragonite. PhotoSat cannot differentiate between these mica minerals with WorldView-3
c) c) WorldView-3 jarosite alteration. Red = probable jarosite, blue = possible jarosite
d) WorldView-3 goethite alteration. Red = probable goethite, blue = possible goethite
Figure 3.10. Example of spectral mapping of indicator minerals at Cerro Casale copper-gold-porphyry Deposit, Chile (By Gerry Mitchell, 2020. www. photosat.ca)

12
Table 1.Metasomatic minerals of the copper and associated deposits
Main metal
Deposit Type Deposit Name Source
1 Cu Porphyry Cu-Mo Cerro Verde Quang et al., 2003;
2 Cu Porphyry related Cu-Fe skarn Coroccohuayco Chelle-Michou et al., 2015;
3 Cu Cu-Zn skarn Antamina
Mrozek et al., 2020; Love et al., 2004;
4 Cu
Iron Oxide-Copper-Gold(IOCG-type)
Marcona, Raúl-Condestable
Vidal et al., 1990; Chen et al., 2010;
5 Cu Cu stratabound Raul Mine
Haller et al., 2006, 2009; Ripley&Ohmoto, 1977;
6 Cu
Cu-Au High-Sulfidation Epithermal Enargite-Gold Deposits
Marcapunta Vidal, 2005
7
Cu
Cordilleran Epithermal Cu-Zn-Pb-(Au-Ag) Mineralization_replacement body (Manto type)
Colquijirca District
Bendezu&Fontbote, 2009;
8 Cu Cu-Pb-Zn-Ag Vein Quiruvilca Bartos, 1987;
9 Au (Cu)
Au_High-Sulfidation Epithermal Deposits - Porphyry Cu related
Yanacocha Longo et al., 2010; Teal&Benavides, 2010;
10 Au
Au_Carlin Type (rock-hosted disseminated gold)
Purisima Concepcion
Alvarez&Noble, 1988;
11 Au Orogenic Gold deposits Pataz
Haeberlin et al., 2004; Witt et al., 2016;
12 Au Au-Ag(PbZn) Epithermal Vein Chapi Chiara prospect
Carrino et al., 2015
13 Au Au mesothermal Q-Ca-Sulf vein N.Pataz District Witt et al., 2016
14 Ag Ag(PbZn) Epithermal Vein Cayloma District Echavarria et al., 2006;
15 Ag Ag Epithermal Vein Arcata Condiotti et al., 1990;
16 Pb-Zn (Cu)
Porphyry Cu-Mo related PbZn vein and replacement mineralization
Morococha district, central Peru,
Catchpole et al., 2015
17 Pb-Zn-Cu
Zn-Pb-Cu stratabound Huanzala Imai et al., 1985;
18 Pb-Zn
Zn-Pb-Ag Kuroko Type (massive sulfide and stockwork)
Lima region Haller et al., 2009
19 Pb-Zn Zn-Pb Mississippi Valley-Type San Vicente Fontbote&Gorzawski, 1990;
20
Pb-Zn
Epithermal Zn-Pb-Ag-Cu-Bi mineralization (massive sulfide replacement body in carbonate rocks
Cerro de Pasco, Casapalca, Corani
Baumgartner et al., 2008, 2009; Rottier et al., 2018;
21 Pb-Zn-Cu
Volcanic Massif Sulfides (VMS) deposits
NW Peru Winter et al., 2010;
22 Pb-Zn (Cu)
nonsulfide Zn-Pb deposit (associated to CuPbZn mineraliation near porphyry copper deposit)
Acca, Yanque Mondillo et al., 2014
23 W W-Veins San Judas Tadeo Clark et al., 1990;

13
24 Sn-Cu Sn-Cu-Pb-Zn veins Pasto Buena Landis&Rye, 1974;
25 Sn-Cu Sn-Cu lode San Rafael
Wagner et al., 2009; Harlaux, 2020;
26 Mo Porphyry Mo Tamboras Heintze, 1985;
27 Cu Porphyry Cu(-Mo) Toquepala Clark, 1990;

14

15
Analysis of the table shows that the same metasomatic minerals are found in deposits of different types, which obviously reflects approximately the same composition of ore-bearing hydrotherms and similar P-T conditions of metasomatism and ore formation.
As is known, the most significant copper reserves are in a porphyry copper deposits. Therefore, it is
advisable to focus on the search for such deposits. The following main metasomatic minerals are found in copper-porphyry, associated copper-skarn and
epithermal gold-silver deposits, stratiform copper-containing lead and zinc deposits: chlorite, epidote, K-spar, biotite, silica, quartz, mica minerals (sericite, muscovite, illite), kaolinite, montmorillonite, alunite, jarosite, goethite, hematite. On satellite images, the spectral characteristics should be used to determine the areas of their propagation. Then, by the characteristic concentric mineral zoning copper-porphyry systems and epithermal-porphyry systems can be determined.
Conclusion: For the forecast a Porphyry Copper and related deposits on space images, it is advisible to use both
the Lineament Analysis (to identify faults and structural trends) and the Multispectral Analysis (to identify zonal metasomatic halos).
4. Spectral analysis of satellite data
4.1. Analysis of spectral properties of minerals
Interpretation of optical satellite images for geological research based on a preliminary analysis of the minerals spectral properties. Figure 4.1 displays spectral line for main minerals which distribution we expect across area of interest. Spectral lines characterize the intensity of solar radiation reflectance in the ranges of the electromagnetic spectrum in which satellite imagery is performed. The analysis of lines shows a significant difference in the reflectivity of objects and is the basis for their distinguishability from satellite images. For example, jarosite and kaolinite have a maximum of reflection in comparison with limonite, goethite and hematite in the short-wave infrared range. It is possible to distinguish jarosite from kaolinite by using the near-infrared channel, where jarosite has a local minimum, and kaolinite, on the contrary, has a maximum. The reflectivity of hematite differs well from limonite and goethite in the short-wave infrared band at wavelengths of 2-2.6 µm.
Goethite Hematite

16
Jarosite Kaolinite
Epidote Chlorite
Figure 4.1 Spectral lines of minerals
Sentinel-2 / MSI acquire images in bands of the visible, near and short-wave infrared, where differences in the reflectance of rocks and vegetation are maximum. But in comparison with other sensors (for example, ASTER), two short-wave infrared bands of Sentinel-2/MSI with a large width of 0.9 and 1.8 µm do not allow identifying different types of minerals. For instance, epidote and chlorite are very similar for Sentinel-2 bands. That's why we couldn't separate these minerals from each other.

17
4.2. Sentinel-2/ image interpretation based on spectral bands
To classify rocks, we used our own mosaic of Sentinel-2/MSI images from 5.11.2020 (Fig. 4.2). This
is springtime in Peru and vegetation is just beginning to develop.
Figure 4.2. Sentinel-2/MSI mosaic
Satellite images interpretation based on spectral properties include several steps:
1. Because of vegetation is a limiting factor in geological interpretation, it must be masked to improve the accuracy of rock classification. Vegetation mask based on NDVI calculation. Normalized Difference Vegetation Index (NDVI) is used for analyzing the state of vegetation cover. Formula for NDVI calculation:
𝑁𝐷𝑉𝐼 =𝑁𝐼𝑅 − 𝑅𝐸𝐷
𝑁𝐼𝑅 + 𝑅𝐸𝐷
Where NIR – radiance in near-infrared band, RED – radiance in red band.
Expert analysis shows that vegetation in southern Peru is characterized by NDVI values from 0.25 above. Therefore, based on the condition NDVI > 0.25, a binary mask was created, where 1 is the

18
boundaries of the vegetation cover, and 0 is the rest of the territory. The mask was then used to cut out areas
of vegetation from satellite images.
2. Cloud extraction was performed using segmentation – all clouds was extracted from Sentinel-2
mosaic. Result image which was used to further classification is shown in figure 4.3.
Figure 4.3. Result Sentinel-2 image after mask extraction. Top – original mosaic. Bottom – mosaic after cloud and vegetation extraction
3. Image supervised classification which includes four steps:
a) Creation of training sample for different types of rocks. In total 29 samples were collected. It includes
different types of rock in the key area - goethite, jarosite, clay, etc.
b) Spectral Angle Mapper classification.

19
c) Verification of classification map based on expert analysis via visual interpretation.
d) Selection of minerals classes for map creation. An archive with raster files in GeoTIFF format is
attached to the report. One file corresponds to one class of selected minerals. Classes fragments are
shown in figure 4.4. The title in the left column in figure 4.4 (for example, Class_1_GH)
corresponds to the name of the raster file. A fragment of the result map and their interpretation are
shown in figure 4.5.
Raster file name – Class_1_GH
Goethite+Hematite
Raster file name – Class 2 G
Goethite
Raster file name – Class 3 GJ
Goethite+Jarosite

20
Raster file name – Class 4 P
Probably Propylites
Raster file name – Class 5 JK
Jarosite + prorbably Kaolinite
Raster file name – Class 6 Cl
Clay minerals

21
Raster file name – Class 7 GHJ
Goethite+Hematite+Jarosite
Figure 4.4. Result classes of alteration minerals
Figure 4.5. A fragment of the result map. The greyscale image – Sentinel-2, band 11. Black color –
water and clouds IGT-interpretation: it is an epithermal-porphyry Cu-(Au) system with mineral alteration zonation – the marsh green propylite shell surrounds the orange goethite/pyrite hallo: hematite is in the core of the system. Hematite can indicate the existing a copper enrichment blanket below the oxidation zone. There is a clay alteration in the southern part of the system.

22
5. Interpretation of Lineament Density Maps Extracted Using LESSA Software
The purposes of the research are:
• to detect using space imagery the lineaments of different orders and high-density zones of lineaments which represent faults and fracture zones of different directions, fault intersection nodes;
• to analyze the spatial connection with regional faults of copper-porphyry deposits and associated copper, gold, silver, and base metals deposits;
• to identify different structural trends and nodes which are favorable for new deposits searching.
5.1. Research Methodology
To increase the contrast of the rocks geological structure on the ground surface imagery, two Sentinel-2A SWIR bands were used in this research: band 11 with a central wavelength of 1613.7 nm and a bandwidth of 90 nm, and band 12 with a central wavelength of 2202.4 nm and a bandwidth of 180 nm (fig.5.1, 5.2). Among all presented Sentinel-2A bands, these two channels are characterized by the wavelength closest to the thermal radiation spectrum of the middle (λ = 2.5-50 μm) and far (λ = 50-2000 μm) sections of the infrared spectrum, and also have the widest channel width. Images in these ranges are also characterized by high spatial resolution (20 m).
Remote sensing results in these two ranges were used to obtain an image reflecting different intensity of radiation in the mid-infrared range, which, in our assumption,
indirectly characterizes the degree of heating by solar radiation of the earth's surface (mainly rocks outcrops). Various lithologic and petrographic differences in rocks due to various physical and mechanical characteristics absorb solar radiation differently and therefore emit it differently. Thus, the texture-structural features of rocks that were poorly distinguishable or even indistinguishable in the visible range become more contrasting to the perception of the human eye. Bands 11 and 12 also have well-defined cones and pits of modern "warm and hot" volcanoes, particularly Ampato and its satellites in southern Peru (Fig. 5.3).
Figure 5.1. Sentinel-2A bands characteristics
Figure 5.2. Infrared thermal radiation spectrum

23
Figure 5.3. Ampato volcano in the visible spectrum (left) and in the image reflecting the different intensity of radiation (right)
To obtain an image reflecting the different intensity of radiation using ESRI ArcGIS the difference between images obtained in band 12 and band 11 was calculated. The result of the operation is shown on the central image in Fig. 5.4. The obvious advantage of this approach is the prompt detection of contrasting rock areas with a corresponding decrease in contrast on those parts of the image which are not of interest from the point of view of bare rocks studying (development of loose modern sediments, dense vegetation). Another characteristic indirectly determined by such images is the rocks watering degree - rocks saturated with ground and/or atmospheric waters will be characterized by lower intensity of radiation than their "dry" counterparts. This allows identifying large disintegration zones with increased permeability within the rocks outcrops. Similar characteristics of the obtained image allow using it for linear objects detecting by images texture characteristics. The LESSA (Lineament Extraction and Stripe Statistical Analysis) software was used to perform such a procedure.
Figure 5.4. Algorithm of imagery preparation for strokes identification using LESSA software. About LESSA [Zlatopolsky, 1992]: The LESSA software - Lineament Extraction and Stripe Statistical
Analysis - automatically extracts linear image features and analyzes their orientation and spatial distribution. LESSA provides picture (texture) description in the way common for the geological research: rose-diagrams, densities of features with a certain orientation, schemes of long lineaments, and several new descriptors of the rose-diagram features are also provided: vectors and lines of elongation, local rose diagrams difference, and the others. LESSA methods could be applied to different types of data - gray tone image, binary schemes (drainage network, for example), digital terrain map (DTM) - giving territory
24
description in a common way. The proposed algorithm is based on the linear image features analysis (so-called "stripes"). LESSA automatically detects stripes and determines their direction (16 directions). The stripes detected at the first step are combined into the straight lines – lineaments).
Using the LESSA software within three representative clusters of Cusco, Moquegua, and Huancavelica
(named for the administrative regions of the same name) multiple differently oriented short lineaments - strokes - were identified (Fig. 5.4, right).
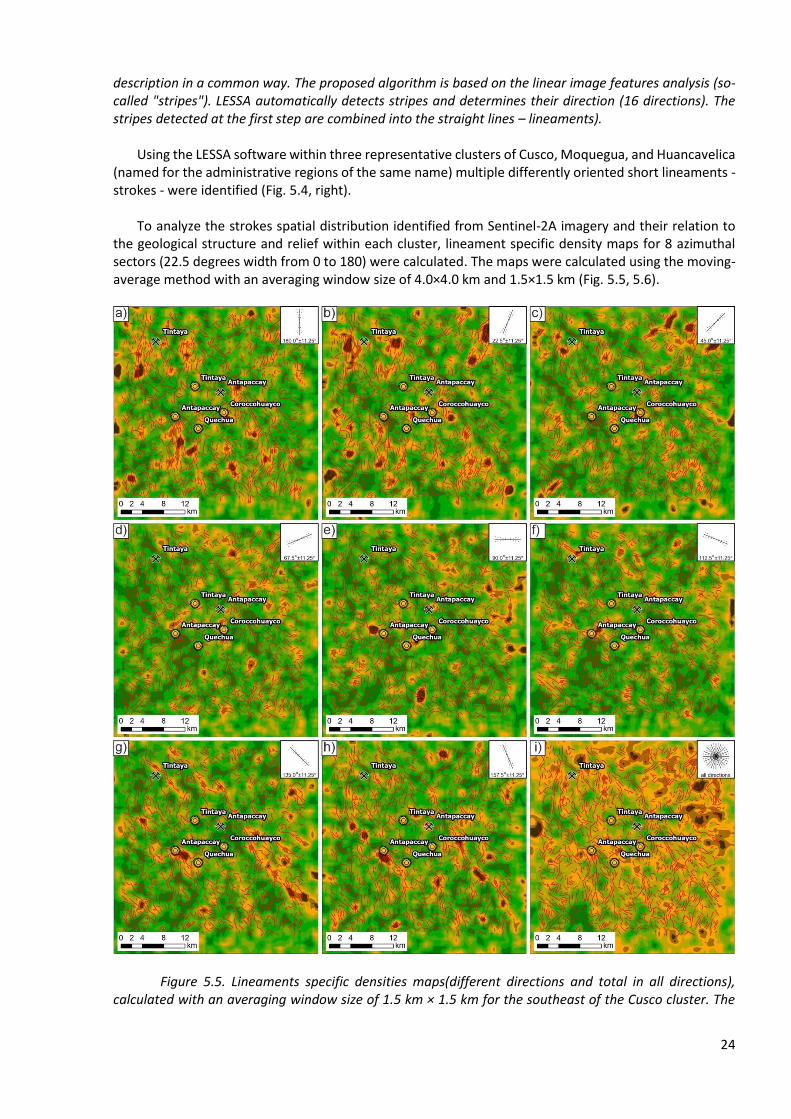
To analyze the strokes spatial distribution identified from Sentinel-2A imagery and their relation to
the geological structure and relief within each cluster, lineament specific density maps for 8 azimuthal sectors (22.5 degrees width from 0 to 180) were calculated. The maps were calculated using the moving-average method with an averaging window size of 4.0×4.0 km and 1.5×1.5 km (Fig. 5.5, 5.6).
Figure 5.5. Lineaments specific densities maps(different directions and total in all directions), calculated with an averaging window size of 1.5 km × 1.5 km for the southeast of the Cusco cluster. The

25
relatively low specific density areas on the maps are painted in dark green, high - in dark brown, red lines represent identified strokes.
Specific density maps determine two main directions of lineament concentration linear zones
(structural trends): prevailing NNW direction (157.5±11.25°, Fig. 5.5h) and ENE direction (67.5±11.25°, Fig. 5.5d). Both of these directions are well distinguishable on all the directions strokes density map (Fig. 5.5i) - the deposits are concentrated at the two trends intersection nodes.
Figure 5.6. Lineaments specific densities maps(different directions and total in all directions) of the Cusco cluster, calculated with an averaging window size of 4.0 km × 4.0 km. The relatively low specific density areas on the maps are painted in dark green, high - in dark brown. The red contour shows the detailing area (see Fig. 5.5).
It should be noted that the maps for each azimuthal sector highlight not only linear anomalies in the
density of lineaments with extension within the sector but also linear anomalies of other directions. This indicates that the lineaments direction within the density trends may not coincide with the direction of such trends. This is probably an indication of the lineament concentration zones shear nature - it is known

26
that conjugated orthogonal strike-slip faults - longitudinal R and transverse R' - as well as diagonal stretching and compression discontinuities - can form in the shear zones (Fig. 5.7).
For the analysis and regularities revealing of lineaments density zones and anomalies spatial
distribution at the regional scale the maps with 4×4 km averaging window size were used (Fig. 5.6). In some cases, linear lineaments density trends correspond to the valleys of watercourses: it is
assumed that in such cases, rivers and streams inherit the surface tectonic disturbances - in areas of destroyed rocks. Isometric high-density nodes may correspond to the intersection of variously-directed tectonic disturbances or dikes. Low-contrast anomalies may also correspond to the intersection nodes of faults - at such areas, the rocks may be severely fragmented (especially in the stretching structures), may exhibit metasomatosis processes, in particular, argillization. The high degree of rocks disintegration will lead to the formation of loose material, which radiation intensity in the obtained images (Fig. 5.4) is much lower than in undisturbed rocks. The areas of crushing covered by disintegrated material on the density maps are probably not distinguished by positive anomalies of lineaments density.
Figure 5.7. Typical Riedel faults (R and R') and tear-off fractures (T) in shear zone (Goncharov et al., 2008).

27
5.2. Structural interpretation of lineaments density trends and nodes. Structural control of
deposit localization
The interpretation of identified shift zones within the Cusco and Moquegua clusters is shown in the Fig. 5.8, 5.9.
Figure 5.8. Structural interpretation of the lineaments high-density trends and nodes for Cusco cluster.
Figure 5.9. Structural interpretation of the lineaments high-density trends and nodes for Moquegua cluster.

28
Different Riedel faults systems may prevail in different parts of the shift zone (Fig. 5.10, 5.11), which may be due to different mechanical properties of the rocks or deformation conditions (Dooley, Schreus, 2012, Frolova, 2016, Frolova et al 2019).
Lineaments density nodes of meridional direction (supposed tension faults formed at latitudinal
regional and local - in shear zones - tension) can play the role of structural traps for copper-porphyry type stockwork deposits
Figure 5.10. The prevalence of R or R' faults in the shear zone depending on the plasticity of the model material (Dooley, Schreus, 2012). Experiment using clay with different water contents, (a) Kaolin, 56% water content; (b) kaolin, unspecified water content, but lower than in a, between 45 and 54%. Note that the R' shears obtain a slightly sigmoidal shape as central segments rotate counter-clockwise with increasing displacement along the basement fault.
Figure 5.11. Analog physical simulation of the sinistral strike slip: (a) non-uniform R or R' faults development in the shear zone, (b) fracture (faults) density (Frolova, 2016, Frolova et al, 2019).
b
a

29
Conclusion: Porphyry Copper deposits, known in the area, are localized mainly within the identified shear zones,
in the lineaments density nodes. These nodes are placed in steps of 4-8 km, demonstrating faults and fractures high density areas.
The uneven distribution of intensive fracture zones was repeatedly modeled on analog physical
models of shear zones and explained theoretically from the fracture mechanics position.
6. Forecasting of Porphyry Copper deposits
6.1. Porhyry Copper Systems identified by spectral anomalies
A Porphyry Copper-Systems are distinguished by the most saturated anomalies in the spectra of hematite, jarosite, kaolinite, other clay minerals and minerals of propylite group (epidote and chlorite). Anomalies are shown in Fig. 6.1.
Complex anomalies often have a zonal structure – their central part is composed of hematite, the
marginal part of jarosite and kaolinite. Propylites are developed along the periphery of the anomalies. Supergene jarosite was probably formed over pyrite hallo of the porphyry systems. Supergene goethite could have formed on copper sulfides (chalcopyrite, bornite) of ore stockwork. Supergene hematite could have formed on the hydrothermal magnetite and hematite in the central
part of the Porphyry Copper system, as well as on the chalcocite of the enrichment blanket, as it was established at the Porphyry Copper deposits in Arizona, Chile, and Peru.
Class 7 anomalies (mixture of goethite, hematite and jarosite) are characteristic of the southern part
of the test site. They are developed in the lower parts of the slopes of modern volcanoes. When identifying ore systems, the presence of ring structures was taken into consideration, which
are deciphered on a satellite image. The valley anomalies were not taken into account. The analysis also excluded extensive class 7 anomalies on gentle slopes composed of loose Quaternary formations.
The identified ore systems have isometric, elliptical and linear shapes, elongated in the meridional,
northwest and northeast directions (Fig. 6.2). On the regional geological map, most of the identified ore systems are located in the area of
development of Paleogene volcanic and intrusive rocks.
The sizes of ore systems are measured in the first tens of kilometers. Within their limits, individual centers (Porphyry-Copper deposits) can be identified that correspond to potential deposits (Fig. 6.3).
Ore systems form linear trends along faults and fractured zones. Ore clusters form at the intersection
of trends and faults. The Porphyry Copper deposits of Constancia, Tintaya, Antapaccay, Coroccohuayco, Quechua, San
Salvador de Patilani known in the test area are located within the identified ore systems. However, these deposits are poorly reflected in the spectral anomalies, possibly because they have already been mined by quarries below the oxidation zone, where supergene minerals exist.
The ore systems with abundant occurrence of jarosite and goethite in spectra probably have a shallow
erosional cut at the level of the pyrite hallo, and all ore must be at a shallow depth.

30
Isolated anomalies expressed in the spectra of propylites may indicate blind porphyry copper stockworks not exposed by erosion.
1. Goethite + Hematite
2. Goethite
3. Goethite + Jarosite
4. Prophylite (Epidote+Chlorite)
5. Jarosite + Kaolinite
6. Clay
7. Goethite + Hematite + Jarosite
Figure 6.1. Spectra anomalies. Red stars marks are copper-porphyry deposits (by USGS data)

31
1. Goethite + Hematite
2. Goethite
3. Goethite + Jarosite
4. Prophylite (Epidote+Chlorite)
5. Jarosite + Kaolinite
6. Clay
7. Goethite+Hematite + Jarosite
Figure 6.2. Forecasted Porphyry Copper Systems distinguished by spectral anomalies

32
Figure 6.3. Forecasted Porphyry Copper Systems on the regional geological map

33
6.2. Correlation results between Spectral Anomalies and Lineament Density Anomalies
In Fig. 6.4 (left), in the central part, a ring structure with radial lineaments density trends is fixed. The
Colquemarca deposit is localized in the center of this ring structure. Some of the ore systems identified using imagery spectral bands coincide with the position of the lineament density trends axes, which we interpret as tectonic faults.
The location of some other ore systems coincides with the lineament minimum density nodes
location. Such low-density areas may represent the areas of distribution of quarter loose geological formations in the depressions that mask the faults. Some local density minimums can show the position of modern volcanoes, which also masking the faults of older age.
We assume that there is a stable correlation between the deposits spatial position and large tectonic
faults, which are usually expressed in the Earth's surface relief. Another factor that controls the deposits spatial localization is metasomatosis, namely, the areas of metasomatite distribution. This assumption underlies the interpretation of forecasted ore systems areas.
Thus, the intersection of forecasted by spectral anomalies Porphyry Copper systems areas with
tectonic faults is the most promising in terms of field prospecting.
Figure 6.4. Positive and negative spatial correlation between forecasted ore systems areas and low-density areas of differently directed linear objects on density maps calculated by averaging window of different sizes: on the left - 4.0×4.0 km, on the right - 2.0×2.0 km.

34
Figure 6.5. Spatial correlation between the Class 4 "Prophylite" areas and the maximum density of NE (45.0±11.25°) linear objects on the density maps calculated by an averaging window of 1.5×1.5 km. The red circles show the position of the supposed copper-porphyry stockwork systems.
Lineament density trend axes, which are interpreted by us as faults, intersect prophylite distribution areas identified by imagery spectral bands in various locations. We believe that such intersections demonstrate the spatial position of copper-porphyry stockwork deposits that were not eroded. The position of such areas in Fig. 6.5. is shown in red circles. Single spectral analysis does not demonstrate the position of copper porphyry systems, but the using of lineament analysis together with spectral analysis allows us to identify potential areas in terms of search for copper porphyry deposits.
It is understood that the development of the porphyry system is directly related to tectonic activity
near the faults and metasomatic activity of fluids. These two factors are the basis for identifying areas of interest in terms of porphyry systems localization, an example of which is shown in Fig. 6.5.

35
Figure 6.6. Spatial correlation between the Class 4 "Prophylite" areas: on the left - with the maximum density of the differently directed lineaments on the density maps, calculated by an averaging window of 1.5×1.5 km; on the right - with the strokes identified on the images reflecting the different intensity of radiation.
Fig. 6.6. (left) shows the ring structure in the river valley. We assume that this structure may correspond to the buried porphyry system. As mentioned earlier, this porphyry system, like other similar systems, is not detected by imagery spectral analysis because it is overlapped by overlying sediments. However, the spatial position of the propylite distribution area at the periphery of this ring structure, as well as the existence of radial and transverse lineaments (tectonic faults) in the center of this structure allow us to speak about the possibility of existence at a depth of copper-porphyry system.
We believe that a combined approach that takes into account many factors is important for
forecasting the deposits spatial position. Fundamental among them are lineament analysis and spectral analysis. In the context of this research, the functionality of the lineament analysis allowed us to predict the regional faults spatial positions, which are one of the factors controlling the localization of ore mineralization. Imagery spectral analysis allowed us to predict areas of metasomatites (prophylites, in particular) distribution, which in some cases are a direct sign of copper porphyry systems localization.

36
7. Conclusion
Forecasting Porphyry Copper deposits based on multispectral satellite imagery data is most efficiently performed by combining three methods:
1) Analysis of regional geology and tectonics, study of the structure and metasomatic zoning of reference deposits. This will make it possible to identify the main prospecting signs of deposits, which should be taken into account when analyzing satellite images and forecasting.
2) Isolation of spectral anomalies in satellite images, characteristic of metasomatic minerals of porphyry copper deposits, identification of metasomatic zoning - both hypogen and supergene ones. This makes it possible to identify a Porphyry Copper systems and associated Epithermal Gold mineralization, localize their centers and estimate the level of erosion of the ore system.
3) Computer lineament analysis - identification of lineaments of different ranks, directions and kinematics, an areas of high lineament density. This allows to define a main faults, which controlling the mineralization. The intersections of large faults and structural trends, which coincides with strong favorable spectra anomalies are the best areas for prospecting large Porphyry Copper deposits.
8. List of References
Baumgartner, R., Fontboté, L, and Vennemann, T., 2008, Mineral zoning and geochemistry of epithermal polymetallic Zn-Pb-Ag-Cu-Bi mineralization at Cerro de Pasco, Peru: ECONOMIC GEOLOGY, v. 103, p. 493–537.
Catchpole, H., Kouzmanov, K., Putlitz, B., Seo, J., H., and Fontbote, L., 2015, Zoned Base Metal Mineralization in a Porphyry System: Origin and Evolution of Mineralizing Fluids in the Morococha District, Peru: Economic Geology, vol.110. pp.39-71.
Dooley, T.P., and Schreurs G., 2012, Analogue modelling of intraplate strike-slip tectonics: A review and new experimental results: Tectonophysics, V. 574–575. p. 1–71.
Frolova, N.S., Korbutyak A.N., Mishakina A.A. and Korpach S.V., 2016, Deformation in shear zone: results of physical modelling using sand: Fourth tectonophysics conference in IPE RAS. Tectonophysics and actual question of Earth science: Reports of the Russian conference. IPE. V. 2. p. 385–392 (in Russian).
Frolova NS., Kara T.V., and Chitalin, A.F., 2019, Tectonophysics modeling of Baimka Ore zone (Western Chukotka North-East Eurasia): Conference: Proceedings of the 2nd Conference of the Arabian Journal of Geosciences (CAJG-2), Tunisia 2019.
Goncharov M.A., Frolova N.S., Koronovsky N.V., 2008, Structural paragenesis in the cover due to shifts in the foundation: the role of horizontal shift along the horizontal plane (in Russian) // Lomonosovskie Chteniya Scientific Conference. Section Geology. (Abstracts) - Lomonosov Moscow State University.
Haeberlin, Y., Moritz, R., Fontbote, L., and Cosca, M., 2004, Carboniferous Orogenic Gold Deposits at Pataz, Eastern Andean Cordillera, Peru: Geological and Structural Framework, Paragenesis, Alteration, and 40Ar/39Ar Geochronology: Economic Geology, vol.99. pp.73-12.
Teal, L.B. and Benavides, A., 2010, History and geologic overview of the Yanacocha mining district, Cajamarca, Peru: ECONOMIC GEOLOGY, p. 1173–1190.

37
9. Appendices
Number File Name Description
A Class_1_GH.tif, Class_1_GH.lyr, Class_2_G.tif, etc.
Areas of most saturated anomalies in the spectra of hematite, jarosite, kaolinite, other clay minerals and minerals of
propylite group: Cl. 1.Goethite + Hematite; Cl. 2.Goethite; Cl. 3.Goethite + Jarosite; Cl. 4.Prophylite (Epidote+Chlorite); Cl. 5. Jarosite + Kaolinite; Cl. 6.Clay; Cl. 7. Goethite + Hematite + Jarosite. ESRI ArcGIS Lyr files & TIFF images
B Forecasted ore systems.shp Areas of ore systems identified using imagery spectral bands. ESRI ArcGIS Shape file.
C b11_b12_diff_Cusco_dens_map_11.25-33.75_24pix.tif, b11_b12_diff_Cusco_dens_map_33.75-56.25_32pix.tif, b11_b12_diff_Moquegua_dens_map_56.25-78.75_64pix.tif, etc
Lineaments density maps images calculated for three clusters, where ("b11_b12_diff_Cusco_dens_map_11.25-33.75_24pix.tif" as an example): "...Cusco_dens_map_..." - is a density map calculated for the Cusco cluster; «…11.25-33.75_...» - density map calculated for lineaments oriented at azimuth from 11.25° to 33.75°; "...24pix" - density map is calculated by the averaging window method with the size of window equal 1.5×1.5 km (based on the spatial resolution of the original image 65 m per 1 pixel, 24 pix × 65 m ~ 1.5 km). TIFF images.
D LESSA_strokes.shp The strokes identified on the images reflecting the different intensity of radiation. ESRI ArcGIS Shape file.
E b11_b12_diff_img.tif Image reflecting the different intensity of radiation. TIFF image