geological and geotechnical characterisation of ... and geotechnical characterisation of ramagundam...
TRANSCRIPT
G. Uday Bhaskar, A. Srinivasa Rao, G. V. S. Prasad and B. Shravan Kumar
386
Geological and Geotechnical Characterisation of Ramagundam Opencast-II of Singareni Collieries using Geophysical Logs
G. Uday Bhaskar*1, A. Srinivasa Rao2, G. V. S. Prasad2 and B. Shravan Kumar3
1DGM (Geophysics), Exploration Division, SCCL, Kothagudem 507 101, 2Superintending Geophysicist, 3Senior Geophysicist, Exploration Division, SCCL, Godavarikhani – 505 214*Corresponding Author: [email protected]
ABSTRACTDeep and large opencast coal mines of 400m to 450m depth are considered important to increase the coal production of India. Planning and managing such large open pits depends upon a thorough understanding of geological and geotechnical aspects of the rock strata comprising the overburden column. The experiences of Singareni Collieries Company Limited (SCCL) located in Telangana, India document borehole geophysical logging as an effective means to generate a continuous description of geological and geotechnical strata features from the surface to total drilled depth. Conventional geophysical logs are used to identify the basic lithologies and construct geological maps of overburden strata. The uniaxial compressive strength (UCS) of sandstones is empirically estimated by correlating P wave velocities (Vp) obtained from sonic logs with the laboratory determined UCS value. Acoustic images help determine the location and trend of fractures and minimum horizontal stress directions. Together, these data provide the basis for characterisation of the rock mass and form the foundation for the effective design of stable pit walls in deep sedimentary strata. This paper presents usage of different geophysical logs at the proposed deep pit at Opencast-II Expansion Project of Ramagundam, SCCL.
INTRODUCTION
Deep and large opencast coal mines rely upon the stability of pit slopes and high walls. At depths less than 200m the stability of pit walls is largely governed by the identification and control of structurally determined kinematic failures. However, with increasing depth the insitu ground stresses may approach the strength of the rock mass. As such a development may lead to structural failure problems, one needs to take into consideration deep seated mass failure modes to overcome the possible instability. These possible failure modes include a failure path transversing strata bedding, defects and transecting intact rock bridges. Traditional design tools that make simplifying assumptions of the physical processes driving the failure modes become inadequate in the design of deep pit slopes. Advanced numerical tools suitable for deep pit design rely on the quality of their input data, not only the geological strata description but rock mass strength (a combination of intact strength and joint set density and orientation), large scale fault strength and location, pore pressures from the ground water, hydrogeological model etc.
Franz (2009) remarked that pit slope behaviour must be predicted accurately because any small change of slope angle can have serious technical and economic consequences. The failure mechanisms in deep pits are more complex than could be considered through conventional slope design methods and may involve a failure surface traversing defects and transecting intact rock bridges. To support the design of deep pits in sedimentary rocks, Franz recommended a comprehensive evaluation of the rock mass characterisation
data and identification and delineation of those attributes that control the strength of the structured rock mass as it deforms and the candidate failure surfaces propagates. Read and Stacey (2009) found that the majority of slope failures are structurally controlled. A geological model depicting the rock type boundaries should therefore form the starting point and basic layer of the geotechnical model. The physical and mechanical rock properties used in design analyses require a strong geological framework. In building the geotechnical model, layers of information such as rock mass weathering, structural data, rock mass properties as well as hydrogeological data should be added step by step as data becomes available.
Karparov and Handley (2005) remarked that the knowledge of stresses acting on the pit slopes is also essential to understand the mechanics of slope behaviour. Simmons and Simpson (2006) reviewed that excavation is a process of extensional deformation producing significant changes in stress condition within rock mass and sudden collapses occur when these stresses exceed a critical state. These sudden collapses are composite rock mass failures involving both intact rock material and fracture and shear on existing defects. Simmons and Simpson (2006) also observed similar such sudden collapses in underground mines. From their experiences they have concluded that experiences of underground mining can help in understanding processes of pre-failure deformations to develop more reliable risk management controls in opencast mines. They further remarked that triaxial rock tests providing information on both deformability and material strength should be preferred over conventional tests that
J. Ind. Geophys. Union ( October 2015 )v.19, no.4, pp:386-400

Geological and Geotechnical Characterisation of Ramagundam Opencast-II of Singareni Collieries using Geophysical Logs
387
provide only uniaxial/unconfined compressed strengths (UCS). However, these laboratory tests require careful selection of samples and proper preservation of fragile structures and weak rocks to get useful values. Simmons and Simpson (2006) used geophysical logs to overcome these uncertainties produced by core samples. Cunningham (2005) noticed that elastic modulus obtained from sonic wave velocities are good enough to distinguish weak and strong rocks and determination of UCS can be limited to those rocks whose Young's Modulus is greater than 50GPa.
In an overview of geophysics in coal mines, Hatherly (2013) noted that the Australian coal industry relies on geophysical logs to generate the geological and geotechnical information in the design and operation of large opencast mines. In addition to identifying the rock lithological characteristics, the sonic and acoustic image logs have the additional advantage of estimating rock strength and determining stress directions, respectively. In India, SCCL uses geophysical logs and carries out rotary drilling of the Middle Permian non coal-bearing Barren Measure Formation (the overburden strata of deep and large opencast mines) in extracting coals of Early Permian Barakar Formation. Geophysical logs therefore act as one of the fundamental tools in the present study of the Opencast-II Expansion Project of Ramagundam region.
Geological Setting
The OCP-II Expansion project lies in the southwestern part of Ramagundam coalbelt located on the western
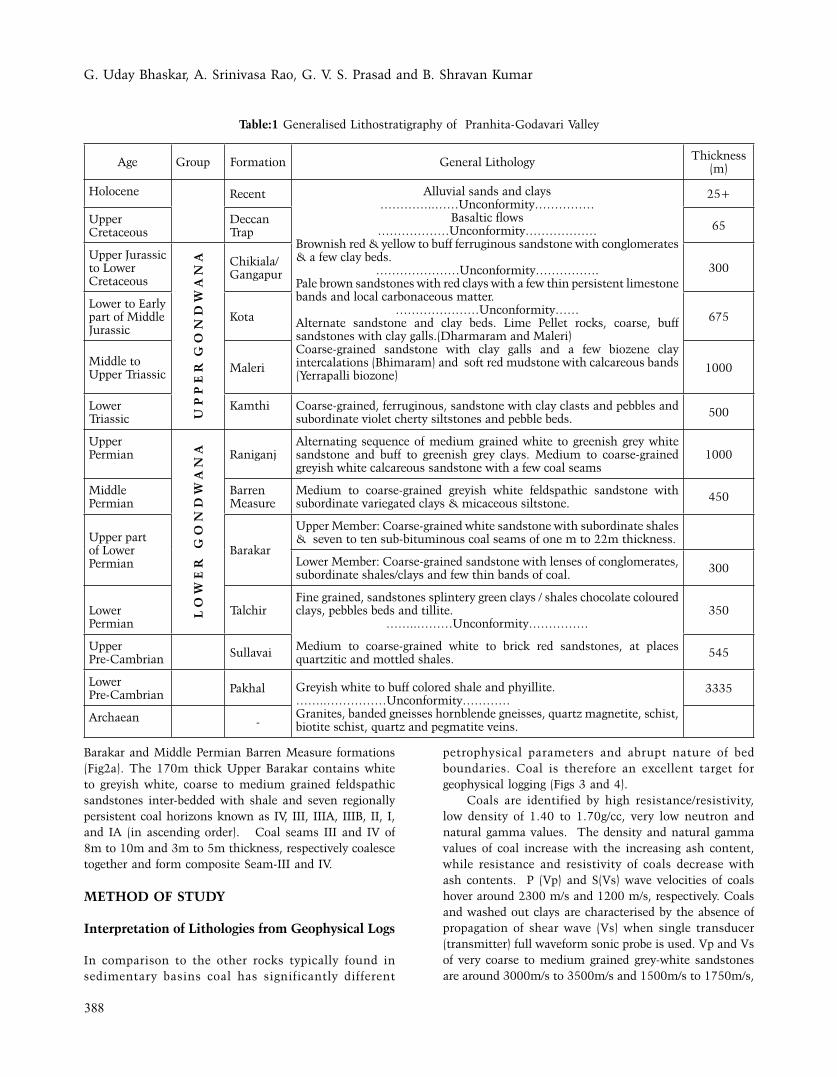
margin of NNW-SSE trending Pranhita Godavari Valley, situated on the Precambrian platform (Figs 1 and 2). The Godavari Valley extends over 470 km in strike length from Eluru on the east coast of Andhra Pradesh in the SE through the state of Telangana in the central parts up to Boregaon of Maharashtra in the NW (Fig1a). It is a ‘Crevice’ type of platform rift zone containing 4,000 m to 5,000 m fluviatile sediments of Early Permian to Early Cretaceous. It is considered the largest single Gondwana basin belt in India. Based on geological and geophysical data the valley is divided into four sub-basins from north to south as Godavari, Kothagudem, Chintalpudi and Krishna-Godavari (Ramana Murty and Parthasarathy, 1988). Table-1 describes the generalised stratigraphy of the valley. Seven to ten coals of 1m to 22m thickness are present in the Barakar Formation located along the western margin and at some places on the eastern margin of the valley. Intercalated carbonaceous horizons are located in the Late Permian Raniganj Formation.
The OCP-II block lies between latitudes N18o38'25'' and 18o 39'30'' and longitudes E79 o 33'30'' and E79 o 34'35'' and falls in the Survey of India Toposheet No 56N/10. The general strike of the block is NNW-SSE with northeasterly dips of 10 o to 13 o. The block is mostly covered by soil followed by about 250m thick Middle Permian Barren Measures made up of green to greenish grey, coarse to very coarse grained feldspathic and kaolinised sandstones intercalated with shales and variegated clays. A clay bed of approximately 6m thickness occurring 20m above Seam-IA is considered the formational contact of Early Permian
Figure 1. (a) Pranhita-Godavari Valley showing Ramagundam and (b) Geological Map of Ramagundam Coalbelt showing Ramagundam Opencast Project-2 (RG OC-2), the study area.
G. Uday Bhaskar, A. Srinivasa Rao, G. V. S. Prasad and B. Shravan Kumar
388
Barakar and Middle Permian Barren Measure formations (Fig2a). The 170m thick Upper Barakar contains white to greyish white, coarse to medium grained feldspathic sandstones inter-bedded with shale and seven regionally persistent coal horizons known as IV, III, IIIA, IIIB, II, I, and IA (in ascending order). Coal seams III and IV of 8m to 10m and 3m to 5m thickness, respectively coalesce together and form composite Seam-III and IV.
MeThOD OF STUDy
Interpretation of Lithologies from Geophysical Logs
In comparison to the other rocks typically found in sedimentary basins coal has significantly different
petrophysical parameters and abrupt nature of bed boundaries. Coal is therefore an excellent target for geophysical logging (Figs 3 and 4).
Coals are identified by high resistance/resistivity, low density of 1.40 to 1.70g/cc, very low neutron and natural gamma values. The density and natural gamma values of coal increase with the increasing ash content, while resistance and resistivity of coals decrease with ash contents. P (Vp) and S(Vs) wave velocities of coals hover around 2300 m/s and 1200 m/s, respectively. Coals and washed out clays are characterised by the absence of propagation of shear wave (Vs) when single transducer (transmitter) full waveform sonic probe is used. Vp and Vs of very coarse to medium grained grey-white sandstones are around 3000m/s to 3500m/s and 1500m/s to 1750m/s,
Table:1 Generalised Lithostratigraphy of Pranhita-Godavari Valley
Age Group Formation General Lithology Thickness (m)
Holocene Recent Alluvial sands and clays…………..……Unconformity……………
Basaltic flows ………………Unconformity………………
Brownish red & yellow to buff ferruginous sandstone with conglomerates & a few clay beds.
…………………Unconformity…………….Pale brown sandstones with red clays with a few thin persistent limestone bands and local carbonaceous matter.
…………………Unconformity……Alternate sandstone and clay beds. Lime Pellet rocks, coarse, buff sandstones with clay galls.(Dharmaram and Maleri)Coarse-grained sandstone with clay galls and a few biozene clay intercalations (Bhimaram) and soft red mudstone with calcareous bands (Yerrapalli biozone)
25+
Upper Cretaceous
Deccan Trap 65
Upper Jurassic to Lower Cretaceous
U P
P e
R G
O N
D W
A N
A Chikiala/Gangapur 300
Lower to Early part of Middle Jurassic
Kota 675
Middle to Upper Triassic Maleri 1000
LowerTriassic
Kamthi Coarse-grained, ferruginous, sandstone with clay clasts and pebbles and subordinate violet cherty siltstones and pebble beds. 500
Upper Permian
L O
W e
R
G O
N D
W A
N A Raniganj
Alternating sequence of medium grained white to greenish grey white sandstone and buff to greenish grey clays. Medium to coarse-grained greyish white calcareous sandstone with a few coal seams
1000
MiddlePermian
Barren Measure
Medium to coarse-grained greyish white feldspathic sandstone with subordinate variegated clays & micaceous siltstone. 450
Upper part of Lower Permian
Barakar
Upper Member: Coarse-grained white sandstone with subordinate shales & seven to ten sub-bituminous coal seams of one m to 22m thickness.
Lower Member: Coarse-grained sandstone with lenses of conglomerates, subordinate shales/clays and few thin bands of coal. 300
Lower Permian
TalchirFine grained, sandstones splintery green clays / shales chocolate coloured clays, pebbles beds and tillite.
……..………Unconformity……………350
UpperPre-Cambrian Sullavai Medium to coarse-grained white to brick red sandstones, at places
quartzitic and mottled shales. 545
LowerPre-Cambrian Pakhal Greyish white to buff colored shale and phyillite.
……..……………Unconformity…………Granites, banded gneisses hornblende gneisses, quartz magnetite, schist, biotite schist, quartz and pegmatite veins.
3335
Archaean -

Geological and Geotechnical Characterisation of Ramagundam Opencast-II of Singareni Collieries using Geophysical Logs
389
respectively, while the bulk density ranges from 2.30g/cc to 2.50g/cc. Hard and strong sandstones marked ‘HS’ are characterised by high resistance/resistivity, high neutron count rates, density of 2.65g/cc to 2.80g/cc and Vp of 4500m/s to 5500m/s. Fine grained sandstones, shales, sandy shales and clays show low neutron and high gamma values and densities of 2.20g/cc to 2.50g/cc. Some of the clays and shales are prone to caving during the drilling process as observed from an increase in borehole diameter on the caliper log (Figs 4 and 5). Young's Modulus computed from the arrival times of P and S waves and density indicate that Young's Modulus of clays is around 3GPa to 8GPa. These values decrease with increasing caving of clays. Coals have around 8GPa to 10GPa while those of shales/sandy shales and sandstones are 15GPa and 10GPa to 20GPa, respectively. Cunningham (2005) considers these sandstones as weak rocks. Fine grained hard and strong sandstones have higher Young's Modulus of 40GPa to 50 GPa. The dynamic modulus values obtained from geophysical logs are usually twice the static values, obtained on core samples at laboratory. These variations are presumed to be due to rocks appearing stiffer when the strains are very small.
Acoustic amplitude images indicate shales, sandy shales and fine grained sandstones with brighter shades, while sandstones with dark shades. Acoustic images are used to pick up the palaeodips of bedding planes and fractures/
joints, while the stress direction can be inferred from traces on the acoustic image. These palaeo-dips picked up from acoustic images are plotted as tadpoles, whose arrows are marked towards north. 'AMA' is the log version of acoustic amplitude image measuring the acoustic mean amplitude and acoustic impedance contrast of various lithounits. Uday Bhaskar (2006), Sharma et al. (2014), Shanmukha Rao et al. (2015) and Shanmukha Rao and Uday Bhaskar (2015) also reviewed interpreting various lithounits of Permian stratigraphic sequences of Godavari Valley.
Litho-Sequential Analysis
SPR and neutron logs usually form the basis to establish bed-wise correlation and sequential analysis of Permian sequences (Fig4). SPR and neutron logs show similar responses and trends/patterns but for coal seams. The neutron logs show minimum count rates against coal seams, where as SPR shows moderate to higher ranges depending upon the shale/ash content of coals (Figs 2 and 5). The increasing shale content of coals decreases the resistance values. The caliper logs indicate the magnitude of caving undergone by clay beds. These SPR and neutron logs also have the additional advantage of distinct patterns/trends, which help in identifying their mode of deposition of various lithounits and sequences and associated sedimentary environments (Uday Bhaskar, 2006). Vp and natural gamma logs easily distinguish clays
Figure 2. (a) Lithostratigraphy of Ramagundam Coalbelt using single Point Resistance log and (b) Floor Contour Map of Seam-III of part of Ramagundam Opencast Project-2 the study area.

G. Uday Bhaskar, A. Srinivasa Rao, G. V. S. Prasad and B. Shravan Kumar
390
and sandstones Caving of clays lowers Vp from 2200m/s to 2000m/s. Vp of these sandstones of Barren Measure are around 3000m/s to 3200m/s. Clays and sandstones also have appreciable contrast on natural gamma logs, with clays producing higher count rates than sandstones. However, the sandstones being feldspathic and micaceous show count rates similar to those of clays at places. The caving of clays also lowers gamma count rates. As such, corrections are applied to these logs by considering amount of caving from caliper logs. The bed-wise and sequence-wise geological details of Barakar and Barren Measure forming the overburden of block are therefore brought out from SPR and neutron logs. Fig5 drawn with roof of Seam-III as datum shows that Barren Measure is made up succession of upward fining and massive sandstone sequences
constituting the point bars and channel fills of the fluvial system (Galloway and Hobday, 1983). These logs also indicate significant changes in the sub-environments of the fluvial system through time and space leading to latero-vertical variations in lithofacies. Casshyap and Tewari (1984) made similar conclusions at Son-Mahanadi and Koel-Damodar valley basins, India.
estimation Of UCS From Vp
The sonic log is a function of rock elasticity and therefore has an indirect relationship with rock strength. Empirical relationships between velocity and sandstone rock strength are well established in the coal industry (Hatherly, 2013) and provide valuable data for the geotechnical model.
Figure 3. Geophysical Logs of part of Coal-bearing Barakar Formation, Borehole 1292

Geological and Geotechnical Characterisation of Ramagundam Opencast-II of Singareni Collieries using Geophysical Logs
391
Figure 4. Interpretation of Clays and Sandstones and Litho-Sequences from Geophysical Logs, Borehole 1296.
These relationships have been derived by correlating Vp with lab determined Uniaxial Compressive Strength (UCS). The entire Australian coal industry considers the sonic logs very important and a key component in predicting roof conditions and roof support requirements of underground coal mines and assessing the blasting requirements and rippability studies in the open cast mines. Hatherly (2013) concluded that site specific empirical estimates of Vp-UCS are established all over Australia and in some parts of USA. SCCL has taken the lead in India and introduced sonic and acoustic logging to generate the continuous strength spectrum of overburden strata of coals. Shanmukha Rao et al. (2015) provide the basis for these empirical studies. Correlation of Vp obtained from sonic logs with the laboratory determined UCS of predominantly sandstone
samples has shown that these are related by the following equation.
UCS=7*(10-6)*{Vp2}-0.0053*{Vp}-38.097---(1) (R2=0.95)Where UCS is in MPa and Vp in m/s.
Fig3 shows that the Vp derived and lab determined UCS values (histograms) of sandstones tally very well with each other. UCS of most of the sandstones is around 20 MPa and classified as 'Medium Strength' rocks (Larkin and Green, 2012). Fine grained hard and strong (HS) sandstones having higher UCS values of 130MPa to 160MPa are considered 'Extremely High Strength' rocks. In a similar way, separate equations need to be computed for shales and coals. In general the lab determined UCS values of

G. Uday Bhaskar, A. Srinivasa Rao, G. V. S. Prasad and B. Shravan Kumar
392
shales and coals would be greater than UCS values derived using equation (1).
The present studies and also those of Shanmukha Rao et al. (2015) indicate that Vp of Permian sandstones of Godavari Valley are similar to those of Permian sandstones of Australia (McNally, 1987, 1990) and Cretaceous sandstones of USA, respectively (Oyler et al., 2008). However, UCS values of Godavari Valley are considerably lower than those of Australia and USA for a given range of Vp. The reasonably higher velocities could indicate that sandstones are strong at insitu conditions, while the intact strength of core samples could be reduced because of core discing.
Xing et al. (2013) reviewed that core discing breaks
core samples into pieces of different lengths along the major horizontal stress direction due to the release of locked in stresses. The process of core discing therefore lowers UCS obtained on core samples. Release of stresses also breaks kaolinite in sandstone and results in lower UCS values for core samples. Degradation of clay in dry rock samples could probably be responsible for lower UCS values. Karzulovic and Read (2009) reviewed that core samples from zones of poor recovery produce lesser strengths than those selected from zones of higher core recoveries. Best core samples exaggerate intact strength values. These studies conclude that nature of core samples influence UCS values. Simmons and Simpson (2006) also made similar conclusions at Bowen basin, Australia.
Figure 5. Litho-Sequential Analysis of part of Barren Measure and Barakar formations. Logs are stacked over one another from left to right.

Geological and Geotechnical Characterisation of Ramagundam Opencast-II of Singareni Collieries using Geophysical Logs
393
Rock Quality Designation (RQD)
The Rock Quality Designation (RQD) as proposed by Deere et al. (1967) is a modified core recovery percentage and an index of rock quality. RQD describes the degree of fracturing but not the over all competency of rocks. RQD is a simple measure of the percentage of ‘good’ rock recovered from an interval of drill hole, and is defined by, RQD (%) = Σ length of core pieces > 10cm / total core length--------------- (2)
RQD plotted in Fig3 indicates that most of the sandstones have RQD of 75% to 100% classifying them as 'good to excellent' rocks. The higher percentages of RQD would also indicate that these sandstones are less fractured/jointed and massive in nature. Similar conclusions can also be made from uniform behaviour of acoustic and sonic arrival times. The hard and strong sandstones (HS), however, have lower RQD of about 60%, indicating them as 'fair' rocks. The relatively lower ranges of RQD could indicate that these sandstones could be fractured. RQD of coals are usually not computed because the core samples of coals break down into pieces of less than 10cm due to core discing.
Geophysical Strata Rating (GSR)
The rocks of contrasting geological make up can still have similar and identical UCS values due to which the UCS value on its own can not ascertain the overall competency of the rock. Similarly, the Rock Quality Designation (RQD) of Deere et al, (1967) describes the degree of fracturing but not the strength of rock. As such, the rocks considered excellent by RQD can be very poor on UCS rating systems. The classification based solely on UCS or RQD would not provide meaningful results in an overall context and can even have serious implications on mine planning. Beiwanski (1976) and Molinda and Mark (1994), therefore, considered both geological, hydrogeological and geotechnical aspects to define the overall competency of rock and proposed RMR and CMRR systems, respectively. However, these studies are carried out only in underground mines but not at exploration stage in India. Hatherly et al. (2008) and Hatherly (2013) introduce an empirical scheme for assessing the quality of clastic rock at the exploration stage itself and called it the Geophysical Strata Rating (GSR). As with other rating schemes such as the Rock Mass Rating (Bieniawski, 1976) and Coal Mine Roof Rating (Mark and Molinda, 2005), GSR gives a rating in a range of approximately 15 (very poor quality rock) to 100 (very good quality rock). It is largely based on sonic logging data, which is corrected for depth. Scores are also added according to the clay content (determined from other geophysical logs
such as natural gamma), the porosity (usually determined from density log) and the defect and bedding frequency determined from the variability in the geophysical logs. GSR provides better strata characterisation than that based on surface seismic reflection data or on the geotechnical testing of core samples. Medhurst et al. (2014) classified Australian rocks on the basis of GSR and established relationship between strata characteristics and longwall caving behaviour. GSR is now computed to classify the overburden strata by following Medhurst et al. (2014). It is expected that GSR can be a good indicator of rock competency in the absence of RMR or CMRR studies. GSR log shown in Fig3 indicates that most of the sandstones have GSR of 50% and are good rocks. 'HS' beds having GSR of 60%to 80% are rated as very good rocks.
DISCUSSION OF ReSULTS
Geological And Geotechnical Maps Of Overburden Strata
For the design of stable slopes in deep pits it is important to build the geological model describing the distribution of the various rock types and identify the unique strata characteristics that will impact on wall stability. For example clay units are likely to be weak in both tension and shear providing parting planes (more important in underground mining) and potential planes for the mass mobilisation of the pit face. In addition, due to the slakability of clay units, their strength may deteriorate significantly with exposure to the atmosphere such that a pit designed for strength 'A', excavated and stable at construction may become unstable after a period of time when the clay unit deteriorates to a lower strength of 'B'.
With a low permeability, the distribution of clay strata will impact the pore pressure distribution forming aquitards reducing the natural draw down of the water table with pit excavation. Furthermore the excavation of large quantities of clay rich strata and emplacement in overburden dumps may impact on the stability of these dumps. Similar and different considerations are relevant to shale and sandstone units and together they highlight the importance of identifying the nature and characteristics of the overburden strata.
Different levels of kaolinisation of sandstones of Barren Measures would increase clay and hydrogen contents in different proportions, making the sequences distinct and easy to identify on geophysical logs. Sandstones of Barakar being less kaolinised/clayey would be less conductive with lower hydrogen content. These units also manifest different levels of compaction and cementing, thereby producing varied levels of porosity and water content. Neutron and Vp logs being easy to quantify are used to construct geological maps.

G. Uday Bhaskar, A. Srinivasa Rao, G. V. S. Prasad and B. Shravan Kumar
394
Figure 6. Neutron Based Geological Map of Overburden Strata, OCP-II, Ramagundam.
Figure 7. Vp Based Geological Map of Overburden Strata, OCP-II, Ramagundam

Geological and Geotechnical Characterisation of Ramagundam Opencast-II of Singareni Collieries using Geophysical Logs
395
Figure 8. Vp Based UCS Map of Overburden Strata, OCP-II, Ramagundam
Figure 9. Geophysical Strata Rating Map of Overburden Strata, OCP-II, Ramagundam.

G. Uday Bhaskar, A. Srinivasa Rao, G. V. S. Prasad and B. Shravan Kumar
396
Barren Measure Formation
Geological maps constructed using neutron and Vp logs sub-divide the Barren Measures into Upper and Lower Sequences (Figs 6 and 7). The Upper Sequence of Barren Measures is further sub-classified into Top and Bottom sub-sequences, respectively. The Top sub-sequence located from the surface to 100m depth, contains sandstones that are extensively kaolinised, less consolidated and friable and without cement. Vp of these formations range between 2750m/s to 3000m/s. This places these units as rocks of medium strength as per the classification of Hanson et al. (2005) shown in Fig5. Clay beds separating sandstone sequences having Vp of 2000m/s to 2300m/s are very easy to cave and are low strength rocks, whose magnitude of caving can be noticed from calliper logs shown in Fig4. The Top sub-sequence contains thirteen clay beds; of which five beds each fall in the thickness range of 0.36m to 0.80m and 1.70 to 1.96m, respectively. Another three beds fall in the thickness range of 2.28m to 6.10m (Fig5). The stratigraphic column of 20m extending from a depth and elevation of 66.72m to 92.18 m and 789.62m to 764.16m respectively, containing three clay beds separated by sandstones of 8m to 10m thickness, intersected in borehole 1292 might also be a weak zone. This almost outcrops at borehole 1296 (Figs 5, 6 and 7).
Uniform neutron and Vp values constitute the upper part of Bottom sub-sequence of Barren Measure extending from an elevation of 700m to 650m of BH 1296 and is called the Green bed. These, together with a succession of sandstone sequences displaying decreasing neutron and Vp values make up the lower part of Bottom sub-sequence, extending from an elevation of 680m to 630m of BH 1296. Twelve clay beds, of which seven beds falling in the thickness range of 0.36m to 0.96m, three in 1.12m to 1.98m, and another two clay beds of 2.64m and 5.14m thickness respectively are also present in the lower part of Bottom Sub-sequence of Barren Measure. Most of these beds are likely to weather along the updip and lose their strength as concluded from decreasing values of Vp along the dip. The Bottom sub-sequence contains 5.14m thick clay bed located from a depth and elevation of 202.50m to 207.64m and 646.70m to 641.56m respectively of borehole 1296 could be considered a major weak bed (Figs 5, 6, 7 and 8). All these beds extend from one borehole to another.
Sandstones of the Lower Sequence of Barren Measures have neutron count rates of 375 cps to 500 cps and Vp of 3000m/s to 3250m/s and are medium strong. These sandstones are separated by clays of low residual strength having 0.52m to 1.42m thickness. The knowledge of placement of these clay beds in the overburden strata will assist in overburden dump stability management. Clay of 4.22m thickness considered the BM/B contact is also a potential weak bed and may impact on local wall stability.
Barakar Formation
Medium to coarse grained white-grey sandstones and seven regionally persistent coal seams make up the 200m thick coal-bearing Upper Barakar Formation. Distinct fining upward sandstones named SS-90, SS-80 and SS-70 are present in the upper strata of the formation. These sandstones have a neutron count rate increasing from 375cps at the top to around 500cps at the sequence base. Vp of these formations hover around 3000m/s. SS-60, SS-50, SS-40 and SS-30 constituting the bottom set of sandstones have a higher neutron count rate of 500 cps and Vp of 3250m/s to 3500m/s. SS-30 has maximum neutron count rate of value of 500cps to 600cps and Vp of 3750m/s to 4000m/s. Thus, the bottom set of sandstones could be more compact with lesser porosity than the top set of sandstones. Hanson et al. (2005) classifies these as medium strong sandstones and SS-30 as high strength rock.
Upper parts of the Lower Sequence of Barren Measure of 60m thickness contain sandstones having Vp of 3100m/s to 3250m/s, similar to those of the lower set of sandstones of Barakar Formation. Sandstones in the lower parts of Lower Sequence of Barren Measure and the top set of sandstones of Barakar have similar Vp of 2750m/s to 3100m/s. These sequences contain thin inter beds of varying velocities. Hanson et al. (2005) classifies these as medium strong sandstones.
Uniaxial Compressive Strength (UCS) Map
The UCS map shown in Fig 8 is prepared after correlating the log derived and SCCL lab determined UCS values. Sandstones of 25MPa to 50MPa are considered 'High Strength' rocks.
The Top and Bottom sub-sequences of Upper Sequence of Barren Measures contain very low strength rocks of 3MPa to 5MPa UCS and very low to low strength rocks of 3MPa to 10MPa, respectively (Larkin and Green, 2012). The upper portions of Lower Sequence of Barren Measure contain medium strength rocks separated (10MPa to 25MPa) by very low strength clay beds. The lower portions of Lower Sequence of Barren Measures and upper parts of Barakar containing the overburden strata of Seam-IA and Seam-I have similar and lower UCS ranges of 3MPa to 5MPa. There upon the sandstones of Barakar are mostly categorised under medium strength rocks having UCS of 10MPa to 25MPa. The overburden strata resolved into various sequences have distinct ranges of UCS, increasing from 3MPa to 5MPa along the shallow depths of 100m from the surface to 25MPa at deeper depths. The overburden strata of Seam-IV are high strength rocks, whose UCS ranges from 25MPa to 50MPa. In addition, the interburden strata of coals and Barren Measure contain 1m to 2m thick lenses of very fine grained sandstones/silicified sandstones,

Geological and Geotechnical Characterisation of Ramagundam Opencast-II of Singareni Collieries using Geophysical Logs
397
having very high neutron counts of 500cps to 1000cps, Vp of 4500m/s to 6000m/s and UCS of 100MPa to 200MPa.They come under extremely high strength rocks category. The rock classification system of ISRM (Bieniawski, 1984) considers the Barren Measure and Barakar as very low to low and low strength rocks, respectively.
The classification of rocks is usually indirect, empirical and suits the local geological and geotechnical conditions. It is therefore opined that similar classification system should also be established for Permian sequences of Godavari Valley.
Geophysical Strata Rating (GSR) Map
Fig9 indicates that the strata of Top and Bottom sub-sequences of Barren Measure have GSR of 0% to 30% and 15% to 45%, respectively. 30% to 60% is the range of GSR of the sandstones making up the 50m column of upper parts of Lower Sequence of Barren Measure, which are followed by alternating beds whose GSR ranges from 15% to 45%. Similar ranges of 15% to 45% are also displayed by the top set of sandstones of Barakar Formation. 30% to 60% is the range of GSR values of the bottom set of sandstones of Barakar, extending from the floor of Seam-II and up to the roof of Seam-III. The GSR of sandstones
underlying the Seam-III and Seam-IV ranges from 45% to 60% and clay beds have minimum GSR of 0% to 15%.
The classification of rock types proposed by Medhurst et al. (2014) would consider clays as very poor rocks because of very low GSR of 0% to 15%. These clays are also prone to easy weathering. Poor and fair rocks make up the Top and Bottom sub-seqeuences, respectively. The upper parts of Lower Sequence of Barren Measure and lower parts of Barakar Formation contain fair and good rocks The Barakar shows progressive increase in GSR values from top to bottom. Good rocks can be observed from the floor of Seam-II onwards. SS-30 and SS-20 forming the roof and floor of Seam-IV are made up of good rocks.
The classification thus proposed on Australian experiences may or may not represent local geological conditions of SCCL. It is therefore necessary to develop a similar GSR classification system to suit local geological conditions.
Fractures/ Joints And Stress Direction
The acoustic images enabled identifying the dip azimuth of fractures along N345o to N360o direction. The sinusoidal shapes observed on the acoustic amplitude images are
Figure 10. (a) Acoustic Amplitude Images of high angled sedimentary features considered Fractures/Joints. (b) Rosette Diagram of Dip Magnitude of Fractures/Joints. (c) Rossette Diagram of Dip Azimuth of Fractures/Joints.

G. Uday Bhaskar, A. Srinivasa Rao, G. V. S. Prasad and B. Shravan Kumar
398
interpreted as high angled sedimentary features/fractures/joints. The acoustic images of such features identified in borehole 1292 are shown in Fig-10a. The sedimentary features having high dips of 45o to 75o, perhaps similar to fractures/joints are having dip azimuth of N345o to N360o
(Fig10b and 10c). Small brittle fractures occur in the borehole wall around
a rotating bit because of the unequal horizontal stress regime in the formation. These fractures align along the Minimum Horizontal Stress direction. Borehole breakouts appear as diametrically opposed pairs of bands with high travel times and low amplitude, parallel to the borehole axis (Fig11). The borehole breakouts of 20mm to 60mm length enabled identification of the minimum horizontal stress direction oriented along N70o±10o direction.
SUMMARy AND CONCLUSIONS
The present study which is first of its kind in India indicates that geophysical logs provide the basic geological and geotechnical inputs to understand the mechanisms of slope failure in overburden dumps and deep opencast mines of 400m to 450m depth. It is also conceivable that the strength of intact rocks and insitu strength have
several implications on planning and managing overburden dumps and deep opencast mines. These studies have therefore made use of different classification methods based on petrophysical and physicomechanical properties to understand overall competency of rocks. All these methods make more or less similar conclusions.
The 200m to 250m thick overburden column of Barren Measures is succession of 10m to 15m thick conformable massive and fining upward kalonised sandstone sequences, terminating against clays of varying thicknesses. The stratigraphic placement of these low residual clay beds now being mapped will assist in overburden dump stability management. These anisotropic fining upward sequences are easy to cave and weathering along the upper portions. The 75m to 100m thick upper portions of Upper Sequence of Barren Measure are made up of very low to low strength rocks of 3MPa to 5MPa resting on 50m thick column containing low to medium strength sandstones, whose UCS ranges from 3MPa to 10 MPa. GSR considers these as poor to fair rocks (30% to 45%), separated by very poor and low residual strength and very easy to cave clays. The 50 thick upper column of Lower Sequence of Barren Measures is made up of medium strength (10MPa to 25MPa) massive sandstones separated by clays. GSR considers these as fair
Figure 11. (a) Caliper plots of Borehole Breakouts along with Minor Horizontal Stress Direction (Shmin). (b) Acoustic Amplitude Images of Borehole Breakouts, (c) Minor/Minimum Horizontal Stress Directions, Borehole RG 1292, OCP-II, Ramagundam.

Geological and Geotechnical Characterisation of Ramagundam Opencast-II of Singareni Collieries using Geophysical Logs
399
(30% to 45%) to good (45% to 60%) rocks. The 50m thick lower parts of Lower Sequence of Barren Measures is made up of low to good strength rocks (5MPa to 10MPa) and are considered fair rocks by GSR (45%).
The 150m to 200m thick Barakar Formation is a succession of massive sandstones separated by coals of varying thickness. These coals in general rest on anisotropic fine grained sandstones micaceous /sandy shales/ shales micaceous. The overburden strata of Seam-IA and Seam-I is mostly made up of low to good strength and good to medium strength rocks. The overburden strata of underlying coals are made up of medium strength rocks, while high strength rocks make up the overburden strata of Seam-IV.
The UCS and GSR maps being driven by Vp should be much more similar but for the reason that Larken and Green (2012) chose a non-linear scale to classify rocks on the basis of UCS values and Medhurst et al. (2104) chose a linear scale to classify rocks on the basis of GSR values. Sandstones classified as medium strong on the basis of UCS are classified as fair rocks on the basis of GSR.
The classification thus proposed on Australian expereinces may or may not represent local geological conditions of SCCL. It is therefore neessary to develop similar UCS and GSR classification systems to suit local geological conditions. Triaxial tests providing information on both deformability and material strength should be preferred over conventional tests providing material strength only.
These studies being focused to a small area can now be extended to the entire block considered for opencast mining.
ACKNOWLeDGMeNTS
Authors are grateful to the management of Singareni Collieries Company Limited for according permission to publish the paper. They are thankful to K. K. Sharma GM (Exploration) for his encouragement and providing necessary facilities. And special thanks to Brett Poulsen, CSIRO, Australia for reviewing the paper. They are also thankful to Rao Balusu, Binzhong Zhou and Deepak Adhikary of CSIRO, Australia. Authors are immensely grateful to the reviewers whose critical observations and suggestions significantly improved quality of the paper. Authors are grateful to Editor of JIGU for his support and useful suggestions. The opinions expressed in the paper are personal to the authors and may not coincide with the views of the management of their company.
ReFeReNCeS
Bieniawski, Z. T., 1976. Rock mass classifications in rock
engineering. Exploration for Rock Engineering v.1, pp:
97–106.
Bieniawski, Z.T., 1984. Rock Mechanics Design in Mining and
Tunnelling, Balkema, Rotterdam., pp: 272.
Casshyap, S. M. and Tewari, R. C., 1984, Fluvial models of
the Lower Permian Coal Measures of Son-Mahanadi and
Koel-Damodar Valley basins, India, in R. A. Rahmani
and R. M. Flores, eds., Sedimentology of coal and coal-
bearing sequences, Special Publication of the International
Association of Sedimentologists v.7, pp:121-148.
Cunningham, C.V.B., 2005, The Kuz-Ram fragmentation
model – 20 years on, Brighton Conference Proceedings
2005, European Federation of Explosives Engineers, ISBN
09550290-0-7, pp: 201-210
Deere, D.U., Hendron, A.J., Patton, F.D. and Cording, E.J. 1967.
Design of surface and near surface construction in rock.
In Failure and breakage of rock, proc. 8th U.S. symp. rock
mech., (ed. C. Fairhurst). New York: Soc. Min. Engrs, Am.
Inst. Min. Metall. Petroleum Engineers., pp:237-302.
Franz, J., 2009, An Investigation of Combined Failure Mechanisms
in Large Scale Open Pit Slopes, Thesis Submitted to School
of Mining Engineering, The University of New South Wales,
Australia (Unpublished).Galloway, W.E. and Hobday, D. K., 1983, Terrigenous clastic
depositional systems, Springer, New York.
Hanson, C., Thomas, D. and Gallagher, B., 2005, The Value
of Early Geotechnical Assessment in Mine Planning,
Underground Coal Operators Conference, University of
Wollongong, The Australasian Institute of Mining and
Metallurgy & Mine Managers Association of Australia,17-30,
http://ro.uow.edu.au/coal/65.
Hatherly, P, Medhurst, T, and MacGregor, S., 2008, Geophysical
Strata Rating, ACARP Project C15019.
Hatherly, P., 2013, Overview on the application of geophysics in
coal mining, International Journal of Coal Geology, http://
dx.doi.org/10.1016/j.coal.2013.02.006
Karparov, K.N. and Handley, M.F., 2005, Engineering application
of thrust block analysis in slope stability problems in open
pit mines, The Journal of The Southern African Institute
of Mining and Metallurgy, v.109, pp: 309-327.
Karzulovic, A, and Read, J., 2009, Rock mass model in 'Guidelines
for open pit slope design', (eds) Read, J, and Stacey, P., CSIRO
publishing, Melbourne, pp: 83.
Larkin, B. J. and Green, D. R., 2012. Borehole data standard for
Australian coal –industry (CoalLog Manual, version 1.1),
ACARP Project C21003, pp: 80-81.
Mark, C. and Molinda, G.M., 2005. The Coal Mine Roof Rating
(CMRR) — a decade of experience. International Journal of
Coal Geology v.64, pp: 85–103.
McNally, G.H., 1987, Estimation of coal measures rock strength
using sonic and neutron logs, Geoexploration, v.24, no.4-5,
pp: 381–395.
McNally, G.H, 1990, The prediction of geotechnical rock properties
from sonic and neutron logs, Exploration. Geophysics. v.21,
pp: 65–71.
Medhurst, T., Hatherly, P., and Hoyer, D., 2014, Investigation
of the relationship between strata characteristics and
longwall caving behaviour, 14th Coal Operators' Conference,

G. Uday Bhaskar, A. Srinivasa Rao, G. V. S. Prasad and B. Shravan Kumar
400
Dr. Gudlavalleti Uday Bhaskar obtained M. Sc (Tech) degree in Applied Geophysics from Andhra University in 1980 and Ph.D. from Indian School of Mines in 2001. He has solved several geological and stratigraphic complexities of Pranhita-Godavari Valley and now establishing coal seam-wise geomining conditions using geophysical logs.
A. Srinivasa Rao passed M. Sc (Tech), Applied Geophysics from Andhra University, Visakhapatnam, India in 1983.He is presenly working as Superintending Geophysicist, Singareni Collieries Company Ltd., Godavarikhani, India. He has significant experience in Borehole Geophysical logging and Surface Resistivity surveys. Involved in geophysical log interpretation and processing of sonic and acoustic data to assess geotechnical characters of roof and floor rocks of coal seams.
G. V. S. Prasad received M. Sc (Tech), Applied Geophysics from Andhra University, Visakhapatnam, India in 1983.He worked for 3 years in Govt Sector, under World Bank Project for Salinity Ingression Control by Geophysical Methods in Gujarat State, India. He is presenly working as Superintending Geophysicist, Singareni Collieries Company Ltd., Godavarikhani, India. He is closely involved in establishing strata behavior studies of different blocks.
B. Sravan Kumar passed M. Sc (Geophysics) from Osmania University, Hyderabad, India in 2009. Well exposed to Intellex software for well log oil exploration data processing for 2 years through an MNC for Chevron. Presently working for Coal Exploration by Geophysical Logging and deeply involved in data generation and processing.
University of Wollongong, The Australasian Institute of
Mining and Metallurgy & Mine Managers Association of
Australia, pp: 51-62.
Molinda, G.M. and Mark, C., 1994, Coal mine roof rating
(CMRR): a practical rock mass classification for coal mines.
Pittsburgh, PA: U.S. Department of the Interior, Bureau of
Mines, IC 9387.
Oyler, D.C., Mark, C. and Molinda, G., 2008, Correlation of sonic
travel time to the uniaxial compressive strength of U.S.
coal measure rocks. Proceedings of the 27th International
Ground Control in Mining Conference, Morgantown, WV,
pp:338–346.
Ramana Murty, B.V. and Parthasarathy, E.V.R., 1988, On the
evolution of the Godavari Gondwana graben based on
LANDSAT imagery interpretation, Journal of Geological
Society of India, v.32, no.5, pp: 417-425.
Read, J. and Stacey, P. F., 2009, Guidelines for Open Pit Design,
CSIRO Publishing, Melbourne.
Shanmukha Rao, M, Uday Bhaskar, G and Shivakumar Karekal.,
2015, Estimation of Uniaxial Compressive Strength of Coal
Measures of Pranhita-Godavari Valley, India Using Sonic Logs,
15th Coal Operators' Conference, University of Wollongong,
The Australasian Institute of Mining and Metallurgy and
Mine Managers Association of Australia, pp: 36-47.
Shanmukha Rao, M, and Uday Bhaskar, G., 2015. Geological and
Geotechnical Characterisation Using Geophysical Logs –
An Example from Adriyala Longwall Project of Singareni
Collieries, Telangana, India, Journal of Indian Geophysical
Union, v.19(3)., pp: 270-281.
Sharma, K. K., Uday Bhaskar, G. and Srinivasa Rao, A., 2014.
Geological and Geotechnical Characterisation Studies
using Geophysical Logs-Experiences of Singareni Collieries,
Telangana, Proceedings of All India Exploration Geologists
Meet, Organised by Mining Engineers Association of India,
Hyderabad, India, pp: 254-270.
Simmons, J.V. and Simpson, P.J., 2006, Composite failure
mechanisms in coal measures’ rock masses—myths and
reality, The Journal of the South African Institute of Mining
and Metallurgy, v.106, pp:459-469.
Uday Bhaskar, G., 2006, Electro lithofacies analysis for depositional
history and stratigraphy of Manuguru Coalfield using
geophysical logs, Journal of Indian Geophysical Union, v.
10(3)., pp: 241-254.
Xing, H., Fan, P., Jiang, K. and Li, A., 2013. Review on Failure
Mechanism and Stress Condition of Rock Core Discing,
EJGE, v.18, pp: 4201-4216.