geol. mag. 145 5 , 2008, pp. 702–713. doi:10.1017
TRANSCRIPT
Geol. Mag. 145 (5 ), 2008, pp. 702–713. c© 2008 Cambridge University Press 702doi:10.1017/S0016756808004950 Printed in the United Kingdom
40Ar–39Ar isotope constraints on the age of deformationin Charnwood Forest, UK
J. N. CARNEY∗†, P. ALEXANDRE‡, M. S. PRINGLE§, T. C. PHARAOH∗,R. J. MERRIMAN∗ & S. J. KEMP∗
∗British Geological Survey, Kingsley Dunham Centre, Keyworth, Nottingham NG12 5GG, UK‡Scottish Universities Environmental Research Centre, Rankine Avenue, East Kilbride, Scotland G75 OQF, UK
§Massachusetts Institute of Technology, Dept. Earth, Atmospheric and Planetary Sciences,Cambridge, MA 02139-4307, USA
(Received 3 May 2007; accepted 30 October 2007; First published online 20 May 2008)
Abstract – 40Ar–39Ar dating by a combination of spot analysis and step-heating has been carriedout on mica fabrics from slaty cleavage and a shear zone in the Neoproterozoic to Cambrian rocksof Charnwood Forest, Leicestershire. The results indicate that crust adjacent to the eastern marginof the Midlands Microcraton was affected by localized epizonal metamorphism and penetrativedeformation between 425 and 416 Ma (Silurian to earliest Devonian), somewhat earlier than theAcadian Phase of the Caledonian orogeny recorded elsewhere in southern Britain. The Charnwoodcleavage geometry suggests that the deformation arose within a dextral transpressional regime alongthe eastern margin of the Midlands Microcraton. This tectonism may have overlapped with pre-Acadiansinistral transtensional movements documented for the Welsh Basin and Lake District areas, to thewest and north of the Midlands Microcraton.
Keywords: argon, Acadian, Caledonian, deformation.
1. Introduction
Charnwood Forest forms the westernmost edge of abasement domain known in England as the ‘EasternCaledonides’ (Pharaoh et al. 1987). This domain iscontiguous with the Caledonian terranes concealedbeneath eastern England and the North Sea, andexposed in NW Europe within the Brabant and Ar-dennes massifs of Belgium (Pharaoh, 1999), attributedto the Anglo-Brabant Deformation Belt (Winchester,Pharaoh & Verniers, 2002). The study area (Fig. 1a)borders a major tectonic interface with the MidlandsMicrocraton, a triangular-shaped crustal block (Turner,1949) bounded by major faults and mainly composedof latest Neoproterozoic igneous and volcaniclasticrocks overlain by strata of Early Palaeozoic through toMesozoic age. In plate tectonic terms, the microcratonforms a relatively rigid structural entity that separatesthe Eastern Caledonides from the Neoproterozoic andEarly Palaeozoic basement terranes of England, Walesand SW Ireland, which prior to the opening of theAtlantic Ocean were contiguous with the ‘Avalonian’provinces of eastern Canada and the USA.
The microcraton interior has escaped widespreadpenetrative deformation internally, but against its east-ern margin, in Charnwood Forest, there is developeda pervasive cleavage fabric that up until now hasnot been the subject of a specific geochronologicalstudy. K–Ar whole-rock ages determined previously forvarious Charnian units (Meneisy & Miller, 1963) haveyielded a broad spread of values, ranging from Neo-
†Author for correspondence: [email protected]
proterozoic (684 ± 29 Ma to 574 ± 25 Ma) through toOrdovician (472 ± 21 Ma to 438 ± 20 Ma), Silurian–Devonian (416 ± 19 Ma to 378 ± 17 Ma), and Permo-Carboniferous (318 ± 29 Ma to 260 ± 15 Ma). Thefact that the Charnwood cleavage is imprinted on rocksthat include the Swithland Formation, which is nowthought to be Early Cambrian in age, indicates that itmust be part of a Phanerozoic tectonic event.
In terms of a Phanerozoic deformational age, alikely candidate is the Caledonian orogeny, whichin Britain to the south of the Iapetus suture issubdivided by McKerrow et al. (2000) into a numberof discrete tectonic phases. The folding and penetrativecleavage that occurred during their ‘Acadian Phase’are particularly well developed in the paratectonicCaledonides belts of the Welsh Basin, northern Englandand the Lake District, to the west and north of theMidlands Microcraton (Fig. 1a). In the wider platetectonic context, the event has been related to thecollision of some part of the Armorican TerraneAssemblage (e.g. see Winchester, Pharaoh & Verniers,2002) with terranes comprising Laurussia that hadpreviously been docked along the Iapetus closureline (Soper, Webb & Woodcock, 1987; Dewey &Strachan, 2003). In southern Britain, McKerrow, MacNiocaill & Dewey (2000) refer the age of the AcadianPhase to mainly Devonian (Emsian) time. The AcadianPhase was, however, both preceded and accompaniedby large-scale translational deformation (Soper &Woodcock, 2003), and evidence is presented herewhich suggests that similar types of displacementmay have been focused along the eastern edge of theMidlands Microcraton.
CORE Metadata, citation and similar papers at core.ac.uk
Provided by NERC Open Research Archive
Argon dating of Charnwood deformation 703
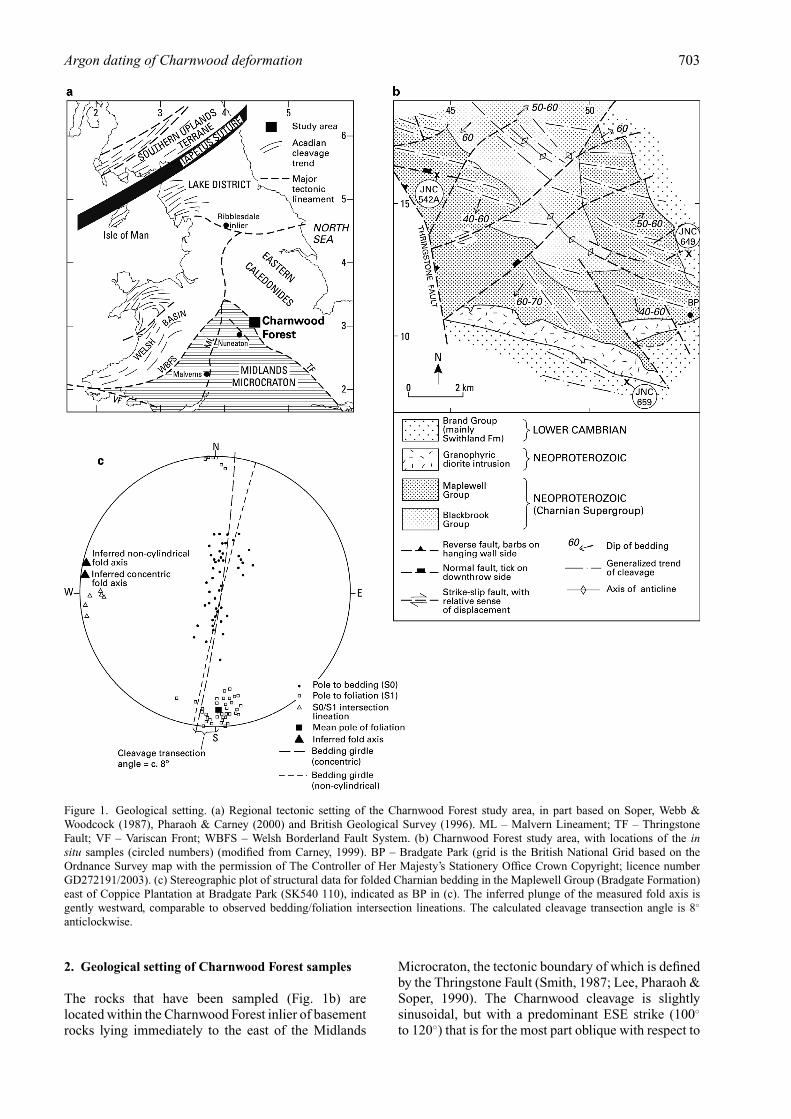
Figure 1. Geological setting. (a) Regional tectonic setting of the Charnwood Forest study area, in part based on Soper, Webb &Woodcock (1987), Pharaoh & Carney (2000) and British Geological Survey (1996). ML – Malvern Lineament; TF – ThringstoneFault; VF – Variscan Front; WBFS – Welsh Borderland Fault System. (b) Charnwood Forest study area, with locations of the insitu samples (circled numbers) (modified from Carney, 1999). BP – Bradgate Park (grid is the British National Grid based on theOrdnance Survey map with the permission of The Controller of Her Majesty’s Stationery Office Crown Copyright; licence numberGD272191/2003). (c) Stereographic plot of structural data for folded Charnian bedding in the Maplewell Group (Bradgate Formation)east of Coppice Plantation at Bradgate Park (SK540 110), indicated as BP in (c). The inferred plunge of the measured fold axis isgently westward, comparable to observed bedding/foliation intersection lineations. The calculated cleavage transection angle is 8◦
anticlockwise.
2. Geological setting of Charnwood Forest samples
The rocks that have been sampled (Fig. 1b) arelocated within the Charnwood Forest inlier of basementrocks lying immediately to the east of the Midlands
Microcraton, the tectonic boundary of which is definedby the Thringstone Fault (Smith, 1987; Lee, Pharaoh &Soper, 1990). The Charnwood cleavage is slightlysinusoidal, but with a predominant ESE strike (100◦
to 120◦) that is for the most part oblique with respect to

704 J. N. CARNEY AND OTHERS
Table 1. Summary petrographical features of the samples
Sample no. NGR and locality Lithostratigraphy Lithology, microfabric, grade Mica typeMica max.
length (mm)
JNC 649 SK 5376 1314The Brand
Swithland Fm.:in situ
Volcaniclastic silty slate, in situ; approximatelybedding-parallel microfabric. Epizone (KI =0.18).
a:b:c ≈ 92:5:3 a: 0.15 b: 0.3
JNC 659 SK 5106 0828Home Farm
Swithland Fm:,in situ
Sandy/silty slate, in situ; spaced disjunctive slatycleavage microfabric. Epizone (KI = 0.23).
a:b:c ≈ 70:10:20 a: 0.08 b: 0.20c: 0.04
JNC 662 SK 5132 0590Ratby Church
Swithland Fm.:headstone
Silty slate (headstone) with numerouschlorite/mica stacks. Intense slaty cleavagewith continuous microfabric.
a:b:c ≈ 90:5:5 a: 0.08 b: 0.08c: 0.06
JNC 663 SK 5132 0590Ratby Church
Swithland Fm.:headstone
Silty slate (headstone) with numerouschlorite/mica stacks. Intense slaty cleavagewith continuous microfabric.
a:b:c ≈ 90:5:5 a: 0.08 b: 0.08
JNC 542A SK 4485 1614Whitwick Quarry
CharnianS’group.:ductile shear
Phyllonite. Continuous microfabric of orientedwhite mica; quartz+ feldspar mosaics alsopartly oriented. Some late veins have poorlyoriented white mica and chlorite. Epizone(KI = 0.24).
a:c ≈ 80:20 a: 0.010 c: 0.006
Mica types: a – fabric-forming; b – detrital; c – replacive.
the SE axial trend of the main Charnwood anticline. Itis imprinted on volcanic and volcaniclastic rocks ofthe Charnian Supergroup (Moseley & Ford, 1985),of latest Neoproterozoic age, as well as on the sequenceof silty mudrocks that comprises the overlying Swith-land Formation (Brand Group). It had long been as-sumed that all of the Charnwood Forest basement rockswere Neoproterozoic in age; however, it is now thoughtthat the Swithland Formation is significantly youngerthan this. In many local churchyards, headstones carvedfrom the Swithland Formation have yielded trace fossils(Teichichnus) indicative of a Phanerozoic, possiblyEarly Cambrian age (Bland & Goldring, 1995; McIlroy,Brasier & Moseley, 1998).
All of the samples are characterized by an intense,millimetre- or micron-scale cleavage, as described inTable 1. It is therefore anticipated that the isotopedeterminations will include the age of the fabric-forming event in both the Swithland Formation and theunderlying Charnian Supergroup. The in situ samples(Fig. 1b) are from three different structural settings.Samples JNC 649 and JNC 659 are silty mudstoneswith abundant detrital quartz and albitized feldspargrains. They were collected from disused quarries inthe Swithland Formation at geographically separatedlocalities, respectively on the eastern and western limbsof the Charnwood anticline, in order to minimizebias caused by local and possibly aberrant lithologicaland/or tectonic conditions. A further in situ sample(JNC 542A, Table 1) is a silvery, strongly foliated andweakly lineated, highly micaceous rock (phyllonite)from a composite brittle/ductile fault zone cuttinga Charnian porphyritic dacite in Whitwick Quarry.The ESE orientation of this fault zone is parallel tothe regional cleavage (Carney, 2005), suggesting thatfaulting and cleavage formation were contemporary,and that strain during the cleavage-forming eventmay have been heterogeneously distributed. The valueof this sample is that, because its protolith was aprimary igneous rock, it will be devoid of detrital micacontaminant grains.
Two further Swithland Formation samples (JNC 662,663; Table 1) are not in situ; they were collected assmall, fresh cleavage flakes from the crumbled cornersof headstones in Ratby churchyard, to the south of theCharnwood study area shown in Figure 1b. They wereincluded in this study because the headstones havebeen quarried from the best quality local slate resource,which we have found to be particularly pure in termsof their high original mud content. In many quarries,such material occurred in narrow, subvertical ‘seams’,less than 5 m wide, which are now inaccessible dueto flooding of the quarries. The headstones are also ofmajor significance to the stratigraphy of CharnwoodForest, as noted previously.
3. Metamorphic conditions
X-ray diffraction (XRD) techniques were used todetermine the Kubler indices of white mica (illite)‘crystallinity’. The Kubler index (KI in �◦2θ) meas-ures small reductions in the half-height width of thedioctahedral mica ∼ 10 AXRD peak resulting fromcrystallite thickening during reaction progress in thesmectite–illite–muscovite series (Merriman & Peacor,1999). White mica crystallite thickness generallyincreases with grade, a process accelerated during slatycleavage development, so that the mean thickness ofepizonal mica would be expected to exceed 520 A,whereas anchizonal white micas have mean thicknessesin the range 230–520 A(Merriman & Peacor, 1999).These crystallographic changes can be used to measurethe progress of advancing metamorphic grade (Merri-man, Roberts & Peacor, 1990; Merriman et al. 1995a;Warr & Rice, 1994). In pelitic rocks, KI values areused to define the limits of a series of metapeliticzones of very low- and low-grade metamorphism:diagenetic zone (KI > 0.42), anchizone (KI 0.42–0.25)and epizone (KI < 0.25) (Kisch, 1990).
For the northern part of the Charnwood Forest areashown in Figure 1b, a metamorphic zonation waspreviously determined by Merriman & Kemp (1997),

Argon dating of Charnwood deformation 705
based on the distribution of mean values and therange of KI data for 71 samples. The near-ubiquitousdevelopment of epizonal KI values, which are seenin the data for the Swithland Formation samplesanalysed for this study (Table 1), reflects the well-developed tectonic fabric of mica-rich rocks in theCharnwood basement, and suggests that white micarecrystallization is strain-enhanced (note that due tothe small size of the samples, KI determinations couldnot be carried out for the headstone rocks JNC 662 and663). The highest grades indicate temperatures of 300–350 ◦C, corresponding to burial depths of up to 10 km.The Charnwood shear zone rock (JNC 542A; Table 1)shows slightly lower grades than the in situ slatesand this may reflect retrogression or comminution ofwhite mica crystallites caused by high strain ratesand sluggish recovery following ductile deformation(Kemp & Merriman, 1995).
4. Petrography and mica fabrics
Three petrographic types of white mica have beendistinguished and their estimated proportions, alongwith other summary data for the samples, are shownin Table 1. Type (a) fabric-forming micas (Fig. 2a–c) are found as intergrowths with chlorite in theorientated microstructural P-domains that define theslaty cleavage (Knipe, 1981). Estimates of theirmaximum length (Table 1) are based on measurementsmade on apparently optically continuous grains. Theuncertainties of resolving crystallographic continuityin mica–chlorite intergrowths on this scale by opticalmethods, however, underlines the approximate natureof the measurements. Type (b) detrital micas (Fig. 2c)include the white mica within chlorite–mica stacks.Although these stacks are of detrital origin, both theirwhite mica and chlorite minerals probably developedduring late diagenesis and burial (e.g. Li et al. 1994).Type (c) replacive white mica was generated by sec-ondary processes pre-dating the fabric-forming event,and does not show a preferred orientation. It includesmica replacing crystal, vitric and lithic volcanic grains,and grain coatings representing recrystallized matrixclay mica.
In terms of their relative ages, type (a) white micasthat define the slaty cleavage microfabric are the mostrecently formed and would be expected to give agesthat approximate to the fabric-forming event. Type(b) detrital micas are assumed to have been derivedfrom contemporary basement outcrop at the time ofsedimentary accumulation and would be expected togive the oldest ages. As the degree of tectonic fabricformation increases with grade, however, more detritalmicas are likely to have recrystallized into the cleavagedomains (e.g. Ho, Peacor & van der Pluijm, 1999; Vande Pluijm et al. 1998) and therefore in epizonal gradesamples such as those from Charnwood Forest, a highproportion of the detrital mica population is likely tohave isotopically equilibrated under the metamorphicconditions that generated the tectonic fabric-forming
Figure 2. Photomicrographs of dated samples of Charnianslates and phyllonite. (a) Sample JNC 542A: continuous, non-domainal slaty cleavage in phyllonite. Note penetration offabric into fractures in quartz phenocryst; crossed polarizers.(b) Sample JNC 542A: continuous, anastomosing slaty cleavagein phyllonite matrix; crossed polarizers. (c) Sample JNC 649:domainal cleavage in siltstone sample JNC 649; many of thelarger, detrital clasts show pressure-solution textures; crossedpolarizers.
micas (e.g. Dong et al. 1997). It is noted that themuscovite closure temperature for argon is generallyabout 500 ◦C (Villa, 1998); however, given that thegrains measured for this study are relatively small(typically less than 100 μm; Fig. 2 and Table 1), theclosure temperature for the studied micas would be
706 J. N. CARNEY AND OTHERS
somewhat lower, for instance, 400 to 450 ◦C, or evenlower (300 to 350 ◦C) if the calculations of Parryet al. (2001) are to be followed. These estimates forthe closure temperature of the dated muscovite aretherefore similar or to higher than the metamorphictemperatures. The detrital population may not becompletely reset, however, as indicated by previouslydetermined age ranges for Welsh Basin epizonal slatesreviewed by Sherlock et al. (2003). As already noted,detrital mica will be absent from the ductile shearzone sample (JNC 542A), which cuts dacitic rocksof primary igneous origin. Type (c) replacive whitemica, because of its very fine grain size, has almostcertainly equilibrated to the metamorphic conditionsprevailing during fabric formation. In terms of 40Ar–39Ar isotope systematics, this type of mica would haveformed closed systems at the same time as the fabric-forming mica.
All samples possess an intense slaty cleavagemicrofabric comprising orientated intergrowths ofwhite mica and chlorite. In the phyllonite (ductileshear) sample JNC 542A, a continuous non-domainalfabric is developed, which may penetrate fractures insome granulated, relict quartz phenocrysts (Fig. 2a).Although the cleavage is domainal in character inthe siltstone sample JNC 649, pressure-solution haselongated most detrital grains into the penetrativefabric (Fig. 2c). The penetrative development of themicrofabric is reflected in the epizonal grade ofthe Charnwood samples, and in the relatively lowproportions of type (b) and type (c) micas (less than10 % and 20 %, respectively; Table 1). Nevertheless, afew detrital micas have survived in the slates (Fig. 2c).
5. Analytical methods
Thin slices of about 5 × 10 × 0.2 mm were cut from thevarious lithologies, polished on one side, and cleaned inacetone in an ultrasonic bath. They were then wrappedindividually in aluminium foil, and irradiated for 120hours in the Oregon State University TRIGA reactor.The neutron flux was measured with mineral standardswrapped in aluminium foil and surrounding andintercalated between the sample packets. Its variabilityis known down to approximately ± 0.3 % relative (1σ )at any point on the rock slices, and is mainly due tothe horizontal flux gradient across the sample rockslice. The uncertainty of the measured neutron fluxis propagated into the final weighted average ages(for spot fusion) and plateau ages (for incrementalheating) and typically contributes to less than 30 % ofthe age uncertainty. Absolute ages are reported relativeto the biotite standard GA1550 (98.79 ± 0.96 Ma;McDougall & Roksandic, 1974; Renne et al. 1998).
Argon was extracted from the samples by both laserspot fusion and incremental heating techniques at theScottish Universities Environmental Research Centre.For the spot fusion analyses, argon was extractedfrom up to 12 spots per sample, chosen in areas ofthe rock slices with the finest grain sizes (to avoid
detrital micas) and highest mica contents (to avoidother mineral phases). Heating was accomplished witha 65W CW Nd-YAG laser beam focused througha modified petrographic microscope and shutteredexternally in 5 to 10 bursts of 0.1 second to minimizeheating of the surrounding sample. The resulting fusionpits were generally less than 200 μm in diameter andwent through the thickness of the rock slice. For theincremental heating analyses, carefully selected chipsof the rock slices measuring about 0.5 mm2 were heatedfor 120 seconds for each step with a defocused 25WCO2 laser beam of about 1.5 mm in diameter. Powerlevels for each step ranged from a nominal 1.3 to 8.0 %of full power, corresponding to 0.3 to 2 W.
The released gas was purified after heating for 7to 8 minutes with two SAES Zr–Al GP50 getters,one operated at about 400 ◦C and the other at roomtemperature, as well as with an off-line stainless steelfinger cooled with an acetone and dry ice slush. For thespot fusion analyses, the cleaned gas was measuredwith a MAP-215 mass spectrometer using a fixedslit giving a resolution of about 300, and an electronmultiplier operated at a gain of about 4000. For theincremental heating analyses, the cleaned gas wasmeasured with a MAP-215/50 mass spectrometer usingan adjustable slit set to a resolution of about 600 anda Johnson MM-1 electron multiplier operated at a gainof about 15 000. The raw argon data were corrected fortotal system blank, reactor-induced mass interferences,mass fractionation and 39Ar and 37Ar decay. Individual40Ar–39Ar age and error calculations follow Dalrympleet al. (1981), and all analytical uncertainty margins arereported at the 1σ level.
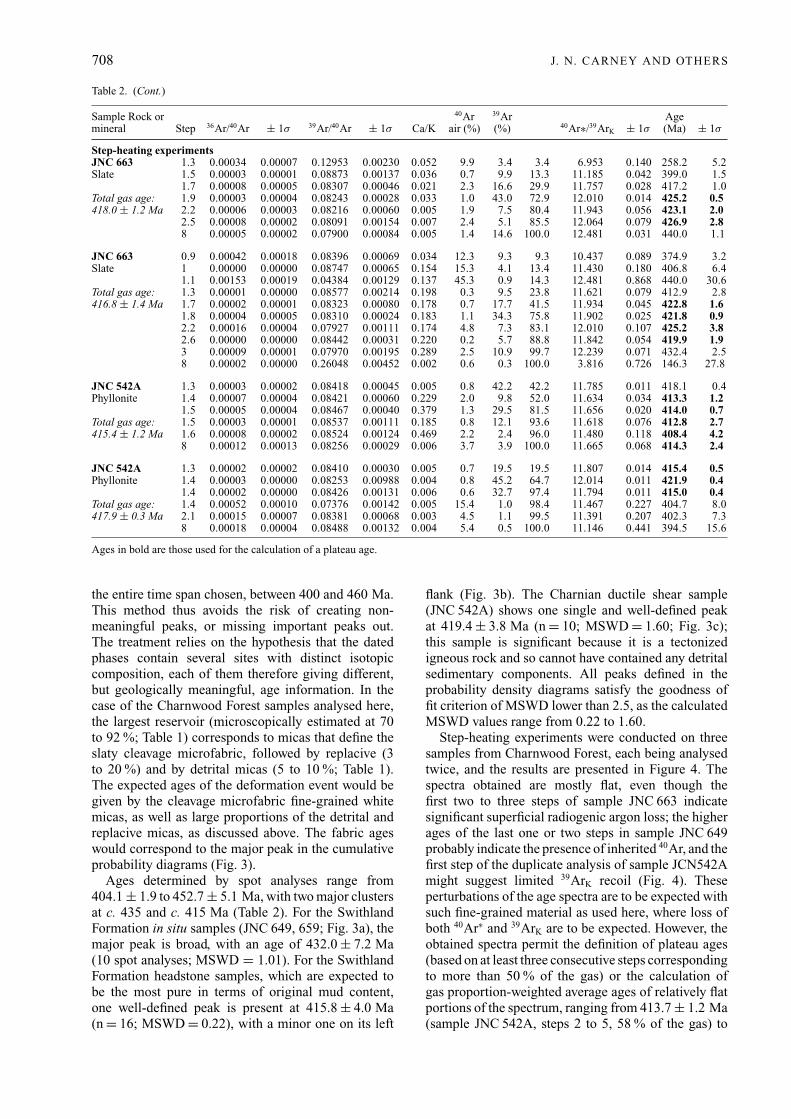
6. 40Ar–39Ar analytical data
The full analytical data are presented in Table 2and are separated into two groups as a functionof the extraction method: 52 spot fusion analyses(summarized in Fig. 3) and six step heating analyses(Fig. 4). The ages (at the 1σ confidence level)are hereafter presented, treated, and compared onthe basis of a separation into: Swithland Formationin situ rocks (JNC 649 and JNC 659), SwithlandFormation headstones (JNC 662 and JNC 663), and theCharnian ductile shear zone phyllonite (JNC 542A).The statistical treatment used for the spot fusion resultswas the cumulated probability analysis (e.g. Alexandreet al. 2004); it was used in order to obtain age groupdistributions and therefore age information. One of theadvantages of this method is that there is no choiceof bin width, as in classical histograms, but of howoften the probability is calculated, the only effect ofwhich is the smoothness of the final curve. In our case,probability was calculated every 1 Ma, ensuring thatthe overall shape of the curve is not affected at allby any calculation bias, as the error margin of eachage used for the calculation is significantly higherthan 1 Ma (Table 2). The individual age probabilities(assuming Gaussian distribution) were integrated over

Argon dating of Charnwood deformation 707
Table 2. Results of the 40Ar/39Ar analyses of the samples from the studied Charnwood samples
Sample Rock ormineral Step 36Ar/40Ar ± 1σ 39Ar/40Ar ± 1σ Ca/K
40Arair (%)
39Ar(%) 40Ar∗/39ArK ± 1σ
Age(Ma) ± 1σ
Total fusion spot experimentsJNC 649 TF1 0.00009 0.00001 0.07937 0.00239 0.287 2.5 1.5 1.5 12.283 0.252 433.8 8.9Siltstone TF2 0.00008 0.00000 0.07586 0.01836 0.173 2.2 2.7 4.2 12.888 0.145 452.7 5.1
TF3 0.00007 0.00004 0.08113 0.00048 0.184 2.1 2.5 6.7 12.073 0.155 427.2 5.5Average age: TF4 0.00011 0.00004 0.07872 0.00072 0.211 3.0 2.9 9.6 12.318 0.161 434.9 5.7424.4 ± 1.5 Ma TF5 0.00012 0.00010 0.07927 0.00034 0.199 3.4 3.0 12.6 12.185 0.136 430.7 4.8
TF6 0.00013 0.00008 0.07911 0.00045 0.174 3.7 3.1 15.7 12.169 0.133 430.2 4.7TF7 0.00003 0.00002 0.08097 0.00033 0.135 0.8 4.7 20.4 12.251 0.099 432.8 3.5TF8 0.00003 0.00004 0.08371 0.00024 0.250 0.8 9.9 30.3 11.858 0.056 420.4 2.0TF9 0.00006 0.00005 0.08114 0.00037 0.145 1.8 4.9 35.2 12.099 0.088 428.0 3.1TF10 0.00006 0.00007 0.08264 0.00027 0.208 1.7 64.7 100.0 11.893 0.042 421.5 1.5
JNC 659 TF1 0.00004 0.00005 0.08148 0.00022 0.068 1.2 1.0 1.0 12.124 0.170 428.8 6.0Siltstone TF2 0.00107 0.00118 0.05504 0.00018 0.051 31.7 1.3 2.3 12.408 0.181 437.7 6.4
TF3 0.00150 0.00087 0.04735 0.00029 0.053 44.3 0.5 2.8 11.769 0.581 417.6 20.6Average age: TF4 0.00002 0.00003 0.07974 0.00023 0.018 0.7 0.9 3.7 12.456 0.170 439.2 6.0434.6 ± 1.5 Ma TF5 0.00012 0.00009 0.08126 0.00040 0.082 3.5 0.7 4.4 11.874 0.257 420.9 9.1
TF6 0.00009 0.00011 0.07697 0.00023 0.045 2.8 1.3 5.7 12.632 0.148 444.7 5.2TF7 0.00007 0.00005 0.07939 0.00038 0.060 2.0 62.4 68.1 12.347 0.040 435.8 1.4TF8 0.00003 0.00003 0.07943 0.00028 0.056 0.8 25.0 93.1 12.481 0.043 440.0 1.5TF9 0.00006 0.00001 0.08651 0.00256 0.049 1.8 6.8 100.0 11.345 0.053 404.1 1.9
JNC 662 TF1 0.00007 0.00004 0.08442 0.00047 0.028 2.0 1.5 1.5 11.609 0.166 412.5 5.9Slate TF2 0.00009 0.00002 0.08243 0.00150 0.063 2.6 1.6 3.1 11.811 0.135 418.9 4.8
TF3 0.00002 0.00001 0.08519 0.00037 0.063 0.4 1.6 4.7 11.687 0.113 415.0 4.0Average age: TF4 0.00004 0.00002 0.08386 0.00064 0.049 1.2 1.8 6.5 11.779 0.118 417.9 4.2412.7 ± 1.7 Ma TF5 0.00012 0.00007 0.08384 0.00053 0.056 3.4 1.5 8.0 11.521 0.169 409.7 6.0
TF6 0.00009 0.00005 0.08535 0.00056 0.086 2.7 1.1 9.1 11.395 0.194 405.7 6.9TF7 0.00002 0.00002 0.08493 0.00032 0.058 0.6 2.5 11.6 11.706 0.099 415.6 3.5TF8 0.00001 0.00001 0.08642 0.00024 0.037 0.2 3.0 14.6 11.543 0.068 410.4 2.4TF9 0.00005 0.00004 0.08477 0.00033 0.117 1.4 2.1 16.7 11.634 0.107 413.3 3.8TF10 0.00004 0.00001 0.08626 0.00084 0.072 1.2 83.2 100.0 11.458 0.045 407.7 1.6
JNC 663 TF1 0.00001 0.00000 0.08455 0.00332 0.007 0.4 4.8 4.8 11.779 0.192 417.9 6.8Slate TF2 0.00004 0.00000 0.08471 0.01031 0.027 1.3 4.3 9.1 11.650 0.211 413.8 7.5
TF3 0.00004 0.00003 0.08440 0.00040 0.030 1.3 4.4 13.5 11.697 0.208 415.3 7.4Average age: TF4 0.00001 0.00002 0.08533 0.00025 0.066 0.4 4.8 18.3 11.675 0.189 414.6 6.7416.2 ± 1.5 Ma TF5 0.00002 0.00002 0.08531 0.00024 0.022 0.5 7.4 25.7 11.662 0.127 414.2 4.5
TF6 0.00002 0.00001 0.08458 0.00072 0.023 0.5 7.8 33.5 11.766 0.121 417.5 4.3TF7 0.00001 0.00000 0.08454 0.00065 0.040 0.2 11.4 44.9 11.811 0.087 418.9 3.1TF8 0.00004 0.00003 0.08432 0.00049 0.029 1.3 14.3 59.2 11.703 0.059 415.5 2.1TF9 0.00003 0.00001 0.08464 0.00121 0.038 0.9 19.9 79.1 11.703 0.051 415.5 1.8TF10 0.00005 0.00002 0.08373 0.00067 0.036 1.6 21.0 100.0 11.751 0.048 417.0 1.7
JNC 542A TF1 0.00025 0.00032 0.07861 0.00022 0.004 7.4 4.6 4.6 11.782 0.045 418.0 1.6Phyllonite TF2 0.00011 0.00005 0.08182 0.00072 0.007 3.3 7.0 11.6 11.814 0.042 419.0 1.5
TF3 0.00014 0.00018 0.08091 0.00023 0.005 4.2 5.9 17.5 11.836 0.045 419.7 1.6Average age: TF4 0.00006 0.00002 0.08368 0.00097 0.003 1.8 9.2 26.7 11.732 0.039 416.4 1.4417.1 ± 1.3 Ma TF5 0.00008 0.00008 0.08297 0.00029 0.003 2.5 5.9 32.6 11.757 0.042 417.2 1.5
TF6 0.00003 0.00000 0.08408 0.00201 0.004 0.8 4.3 36.9 11.795 0.045 418.4 1.6TF7 0.00005 0.00000 0.08313 0.00899 0.001 1.3 3.5 40.4 11.867 0.048 420.7 1.7TF8 0.00004 0.00001 0.08300 0.00170 0.000 1.3 5.2 45.6 11.893 0.045 421.5 1.6TF9 0.00007 0.00005 0.08171 0.00043 0.013 2.0 0.6 46.2 12.000 0.186 424.9 6.6TF10 0.00036 0.00004 0.07500 0.00224 0.000 10.6 4.2 50.4 11.918 0.048 422.3 1.7TF11 0.00002 0.00003 0.08365 0.00026 0.003 0.7 5.7 56.1 11.871 0.042 420.8 1.5TF12 0.00003 0.00003 0.08503 0.00026 0.021 0.8 44.1 100.0 11.672 0.039 414.5 1.4
JNC 649 1.4 0.00001 0.00001 0.08088 0.00031 0.272 0.2 6.9 6.9 12.341 0.068 435.6 2.4Siltstone 1.6 0.00005 0.00006 0.08225 0.00027 0.253 1.4 18.7 25.6 11.985 0.031 424.4 1.1
1.7 0.00002 0.00002 0.08225 0.00034 0.180 0.5 26.3 51.9 12.102 0.023 428.1 0.8Total gas age: 2 0.00001 0.00000 0.08183 0.00152 0.274 0.2 8.6 60.5 12.200 0.057 431.2 2.0435.7 ± 1.3 Ma 2.1 0.00027 0.00020 0.07401 0.00036 0.235 8.1 20.1 80.6 12.424 0.040 438.2 1.4
2.2 0.00009 0.00009 0.08039 0.00029 0.275 2.5 8.6 89.2 12.127 0.059 428.9 2.12.5 0.00008 0.00005 0.08037 0.00044 0.221 2.4 4.3 93.5 12.146 0.116 429.5 4.12.6 0.00081 0.00000 0.06249 0.07581 0.218 23.8 2.2 95.7 12.188 0.272 430.8 9.6
10 0.00050 0.00014 0.05290 0.00069 0.224 14.9 4.2 100.0 16.093 0.132 549.6 4.5
JNC 649 1.6 0.00005 0.00006 0.08124 0.00023 0.171 1.4 30.0 30.0 12.140 0.017 429.3 0.6Siltstone 1.7 0.00004 0.00004 0.08120 0.00025 0.177 1.0 4.3 34.3 12.194 0.076 431.0 2.7
1.9 0.00002 0.00001 0.08158 0.00096 0.157 0.5 16.3 50.6 12.200 0.025 431.2 0.9Total gas age: 2.2 0.00003 0.00002 0.08104 0.00042 0.183 0.7 14.0 64.6 12.251 0.025 432.8 0.9437.2 ± 1.2 Ma 2.6 0.00002 0.00003 0.08038 0.00025 0.235 0.6 21.8 86.4 12.363 0.020 436.3 0.7
2.7 0.00005 0.00002 0.08044 0.00074 0.204 1.5 6.3 92.7 12.245 0.051 432.6 1.83 0.00007 0.00003 0.07851 0.00067 0.154 1.9 3.3 96.0 12.491 0.091 440.3 3.23.5 0.00016 0.00007 0.06756 0.00057 0.200 4.8 1.3 97.3 14.098 0.224 489.9 7.88 0.00026 0.00030 0.05399 0.00017 0.192 7.6 2.7 100.0 17.117 0.115 579.5 3.9
708 J. N. CARNEY AND OTHERS
Table 2. (Cont.)
Sample Rock ormineral Step 36Ar/40Ar ± 1σ 39Ar/40Ar ± 1σ Ca/K
40Arair (%)
39Ar(%) 40Ar∗/39ArK ± 1σ
Age(Ma) ± 1σ
Step-heating experimentsJNC 663 1.3 0.00034 0.00007 0.12953 0.00230 0.052 9.9 3.4 3.4 6.953 0.140 258.2 5.2Slate 1.5 0.00003 0.00001 0.08873 0.00137 0.036 0.7 9.9 13.3 11.185 0.042 399.0 1.5
1.7 0.00008 0.00005 0.08307 0.00046 0.021 2.3 16.6 29.9 11.757 0.028 417.2 1.0Total gas age: 1.9 0.00003 0.00004 0.08243 0.00028 0.033 1.0 43.0 72.9 12.010 0.014 425.2 0.5418.0 ± 1.2 Ma 2.2 0.00006 0.00003 0.08216 0.00060 0.005 1.9 7.5 80.4 11.943 0.056 423.1 2.0
2.5 0.00008 0.00002 0.08091 0.00154 0.007 2.4 5.1 85.5 12.064 0.079 426.9 2.88 0.00005 0.00002 0.07900 0.00084 0.005 1.4 14.6 100.0 12.481 0.031 440.0 1.1
JNC 663 0.9 0.00042 0.00018 0.08396 0.00069 0.034 12.3 9.3 9.3 10.437 0.089 374.9 3.2Slate 1 0.00000 0.00000 0.08747 0.00065 0.154 15.3 4.1 13.4 11.430 0.180 406.8 6.4
1.1 0.00153 0.00019 0.04384 0.00129 0.137 45.3 0.9 14.3 12.481 0.868 440.0 30.6Total gas age: 1.3 0.00001 0.00000 0.08577 0.00214 0.198 0.3 9.5 23.8 11.621 0.079 412.9 2.8416.8 ± 1.4 Ma 1.7 0.00002 0.00001 0.08323 0.00080 0.178 0.7 17.7 41.5 11.934 0.045 422.8 1.6
1.8 0.00004 0.00005 0.08310 0.00024 0.183 1.1 34.3 75.8 11.902 0.025 421.8 0.92.2 0.00016 0.00004 0.07927 0.00111 0.174 4.8 7.3 83.1 12.010 0.107 425.2 3.82.6 0.00000 0.00000 0.08442 0.00031 0.220 0.2 5.7 88.8 11.842 0.054 419.9 1.93 0.00009 0.00001 0.07970 0.00195 0.289 2.5 10.9 99.7 12.239 0.071 432.4 2.58 0.00002 0.00000 0.26048 0.00452 0.002 0.6 0.3 100.0 3.816 0.726 146.3 27.8
JNC 542A 1.3 0.00003 0.00002 0.08418 0.00045 0.005 0.8 42.2 42.2 11.785 0.011 418.1 0.4Phyllonite 1.4 0.00007 0.00004 0.08421 0.00060 0.229 2.0 9.8 52.0 11.634 0.034 413.3 1.2
1.5 0.00005 0.00004 0.08467 0.00040 0.379 1.3 29.5 81.5 11.656 0.020 414.0 0.7Total gas age: 1.5 0.00003 0.00001 0.08537 0.00111 0.185 0.8 12.1 93.6 11.618 0.076 412.8 2.7415.4 ± 1.2 Ma 1.6 0.00008 0.00002 0.08524 0.00124 0.469 2.2 2.4 96.0 11.480 0.118 408.4 4.2
8 0.00012 0.00013 0.08256 0.00029 0.006 3.7 3.9 100.0 11.665 0.068 414.3 2.4
JNC 542A 1.3 0.00002 0.00002 0.08410 0.00030 0.005 0.7 19.5 19.5 11.807 0.014 415.4 0.5Phyllonite 1.4 0.00003 0.00000 0.08253 0.00988 0.004 0.8 45.2 64.7 12.014 0.011 421.9 0.4
1.4 0.00002 0.00000 0.08426 0.00131 0.006 0.6 32.7 97.4 11.794 0.011 415.0 0.4Total gas age: 1.4 0.00052 0.00010 0.07376 0.00142 0.005 15.4 1.0 98.4 11.467 0.227 404.7 8.0417.9 ± 0.3 Ma 2.1 0.00015 0.00007 0.08381 0.00068 0.003 4.5 1.1 99.5 11.391 0.207 402.3 7.3
8 0.00018 0.00004 0.08488 0.00132 0.004 5.4 0.5 100.0 11.146 0.441 394.5 15.6
Ages in bold are those used for the calculation of a plateau age.
the entire time span chosen, between 400 and 460 Ma.This method thus avoids the risk of creating non-meaningful peaks, or missing important peaks out.The treatment relies on the hypothesis that the datedphases contain several sites with distinct isotopiccomposition, each of them therefore giving different,but geologically meaningful, age information. In thecase of the Charnwood Forest samples analysed here,the largest reservoir (microscopically estimated at 70to 92 %; Table 1) corresponds to micas that define theslaty cleavage microfabric, followed by replacive (3to 20 %) and by detrital micas (5 to 10 %; Table 1).The expected ages of the deformation event would begiven by the cleavage microfabric fine-grained whitemicas, as well as large proportions of the detrital andreplacive micas, as discussed above. The fabric ageswould correspond to the major peak in the cumulativeprobability diagrams (Fig. 3).
Ages determined by spot analyses range from404.1 ± 1.9 to 452.7 ± 5.1 Ma, with two major clustersat c. 435 and c. 415 Ma (Table 2). For the SwithlandFormation in situ samples (JNC 649, 659; Fig. 3a), themajor peak is broad, with an age of 432.0 ± 7.2 Ma(10 spot analyses; MSWD = 1.01). For the SwithlandFormation headstone samples, which are expected tobe the most pure in terms of original mud content,one well-defined peak is present at 415.8 ± 4.0 Ma(n = 16; MSWD = 0.22), with a minor one on its left
flank (Fig. 3b). The Charnian ductile shear sample(JNC 542A) shows one single and well-defined peakat 419.4 ± 3.8 Ma (n = 10; MSWD = 1.60; Fig. 3c);this sample is significant because it is a tectonizedigneous rock and so cannot have contained any detritalsedimentary components. All peaks defined in theprobability density diagrams satisfy the goodness offit criterion of MSWD lower than 2.5, as the calculatedMSWD values range from 0.22 to 1.60.
Step-heating experiments were conducted on threesamples from Charnwood Forest, each being analysedtwice, and the results are presented in Figure 4. Thespectra obtained are mostly flat, even though thefirst two to three steps of sample JNC 663 indicatesignificant superficial radiogenic argon loss; the higherages of the last one or two steps in sample JNC 649probably indicate the presence of inherited 40Ar, and thefirst step of the duplicate analysis of sample JCN542Amight suggest limited 39ArK recoil (Fig. 4). Theseperturbations of the age spectra are to be expected withsuch fine-grained material as used here, where loss ofboth 40Ar∗ and 39ArK are to be expected. However, theobtained spectra permit the definition of plateau ages(based on at least three consecutive steps correspondingto more than 50 % of the gas) or the calculation ofgas proportion-weighted average ages of relatively flatportions of the spectrum, ranging from 413.7 ± 1.2 Ma(sample JNC 542A, steps 2 to 5, 58 % of the gas) to

Argon dating of Charnwood deformation 709
Figure 3. Cumulative probability diagrams for all 40Ar–39Arspot analyses given in Table 2, organized by groups of datedsamples, as indicated in the text. The age and error margin ofeach individual peak are indicated, together with the number ofindividual ages defining the relevant peak.
429.9 ± 0.5 Ma (sample JNC 649, steps 1 to 3, 51 %of the gas). The ages obtained by double analyses areconsistent, even though they do not overlap at the 1σ
uncertainty level (Fig. 4).In summary, the step-heating results closely reflect
the spot analyses in revealing two age groupings: themain one at c. 425 to 416 Ma (three plateau ages andan average age from samples JNC 542A and JNC 663)and a further one at c. 430 Ma (sample JNC 649). Itis important to note that for sample JNC 649 the step-heating analysis (Fig. 4) and the majority of single spotanalyses (Fig. 3a) give very similar ages of c. 430 Maand 432 Ma, respectively.
7. Discussion and interpretation of the age data
The spread of the 40Ar–39Ar age data gives a Silurianto earliest Devonian age range, between 432 and416 Ma, for Charnwood samples. Of the two agegroupings represented within this cluster, the youngerone, of c. 425 to 416 Ma, which is both well defined(Fig. 3) and present in all dated samples (see also
Figure 4. 40Ar–39Ar step heating age spectra of individual rockfragment slices. Note that the Charnwood samples yielded goodage plateaus (see text for discussion).
Table 2), is interpreted to constrain the age of the maindeformational event, which included metamorphism,folding, ductile shearing and the development of thepenetrative cleavage. This age grouping was obtainedfrom single-spot and step-heating analyses, and itindicates a Silurian (Wenlock) to earliest Devonian(Lochkovian) age on the timescale of Gradstein et al.(2005). It is important to stress that the three purestsamples, in terms of tectonic mica content, arerepresented within this younger age grouping; theywere collected from Swithland Formation headstones(two samples; JNC 662, 663) and a ductile shear zonecutting igneous rocks (one sample; JNC 542A) andthey give well-defined age peaks at 415.8 ± 4.0 and419.4 ± 3.8 Ma, respectively (Fig. 3b, c).
The deformational event at c. 425–416 Ma that isconstrained by the new 40Ar–39Ar determinations doesnot contradict the possibility of an Early Cambrian

710 J. N. CARNEY AND OTHERS
age recently proposed for the Swithland Formation(Bland & Goldring, 1995; McIlroy, Brasier & Moseley,1998). The new age estimate does, however, rule outa recent proposal by Compston, Wright & Toghill(2002) that the cleavage deformation could have arisenduring earliest Cambrian time. A metamorphic hiatus,implying weak deformation, probably did originallyexist between the Neoproterozoic Charnian Super-group and ?Early Cambrian strata of the SwithlandFormation, by analogy with the situation in the MidlandMicrocraton’s interior exposed at Nuneaton (Fig. 1a).There, deep diagenetic zone sedimentary rocks ofEarly Cambrian age unconformably overlie relativelyhigher grade (lower anchizonal) rocks of the Calde-cote Volcanic Formation, equated with the CharnianSupergroup (Bridge et al. 1998; Merriman et al.1993). In Charnwood Forest, however, the evidencefor this metamorphic discontinuity would have beenobliterated by the subsequent epizonal recrystallizationof the Neoproterozoic and Early Cambrian rocksdocumented here.
The older (Silurian) age grouping at c. 432–430 Mafor the in situ Swithland Formation may reflectthe imprint of an earlier thermal event. The muchlower age values, of c. 404 Ma and c. 408 Ma, mostprobably correspond to the effects of argon loss due toperturbations in the isotopic system, as they are definedby a very limited number of analyses.
8. Regional implications
Given the limitations of the whole-rock dating methodsemployed, these data have provided a Silurian toEarly Devonian estimate for the age of Charnwooddeformation, which is significantly older than Acadiandeformational ages recorded elsewhere in southernmainland Britain. For example, within the paratectonicCaledonides belts to the west and north of the MidlandsMicrocraton (Fig. 1a), Sherlock et al. (2003) used40Ar–39Ar laser microprobe analysis to date pressurefringe white mica, giving a mean age of 396.1 ± 1.4 Mafor the Acadian cleavage. Farther north, a similarcleavage age of 397 ± 7 Ma was obtained from aSilurian mid-anchizonal grade metabentonite in theRibblesdale inlier (Fig. 1a) of northern England(Merriman et al. 1995b). There, however, an Rb–Srisochron age of 465 ± 10 Ma has also been determined,suggesting the possibility that earlier, diagenetic ormetamorphic events may survive penetrative cleav-age deformation (Dodson & Robinson, 2006). Thec. 397 Ma age determinations constrain the peak ofAcadian metamorphism and deformation to latestEmsian time, according to the U–Pb chronology forthis part of the Devonian suggested by Kaufmann et al.(2005).
Although more work clearly needs to be carriedout on the Charnwood rocks, our preliminary findingssuggest that their argon reservoirs could have beeninfluenced by the events that accompanied closure ofthe Iapetus Ocean, towards the end of the Silurian
Figure 5. Proposed tectonic setting during the c. 425–416 Madeformation in Charnwood Forest. Major basement terranes are:EC – Eastern Caledonides; BM – Brabant Massif. Structurallineaments are: NC/FH – North Craven/Flamborough Headfault system; DSHFZ – Dowsing–South Hewett Fault Zone.Other information is given in Figure 1a. Data sources are fromcompilations by Pharaoh (1999), Soper & Woodcock (2003) andVan Grootel et al. (1997).
Period. According to Soper & Woodcock (2003), a‘sizeable time gap’ is present between Iapetus closureand the onset of Acadian deformation. Within thispre-Acadian tectonic regime (Fig. 5), a changeoverfrom sinistral convergence to sinistral transtensionoccurred at about 420 Ma in the Welsh Basin andLake District regions of southern Britain (Soper &Woodcock, 2003), roughly coinciding with the youngerestimated age range for the Charnwood deformation.Further afield, the Charnwood event may also haveparallels in a c. 425–414 Ma ‘Neo-Acadian’ tectonicimprint recognized in the Avalonian terranes of theUSA (Robinson et al. 1998). The main Acadiandeformational event in southern Britain has beenattributed to transpression caused by the subsequentcollision of Armorica with the terranes of Laurentia,Avalonia (the Early Palaeozoic microcontinent) andBaltica that had previously been docked along theIapetus closure line (Soper, Webb & Woodcock, 1987;Dewey & Strachan, 2003).
An attempt has been made to clarify the mechanismthat caused the Charnwood deformation, in order tocompare it with Acadian structural styles in the WelshBasin and northern England. The Charnwood cleavageorientation is slightly sinuous, bearing ESE (100◦ to120◦) and cutting obliquely across the SE axial trendof the main Charnwood anticline (Fig. 1b). This wasdescribed by J. Moseley (unpub. Ph.D. thesis, Univ.Leicester, 1979) as an anticlockwise cleavage transec-tion, and in order to constrain it further, detailed meas-urements of fold/cleavage relationships in the CharnianSupergroup were made by TCP and JNC. It was foundthat the fold-girdle representing the best fit to beddingpoles is offset from the mean cleavage pole (andthe regional fold-axis predicted from the fold-girdle

Argon dating of Charnwood deformation 711
likewise offset from the observed bedding on cleavageintersections) by an angle of 8◦, confirming anti-clockwise transection (Fig. 1c). These relationshipssuggest that the Charnwood deformation arose withina prevailing regime of dextral transpression. It is note-worthy that in the paratectonic Caledonides domainsto the west and north of the Midlands Microcraton,the Acadian event produced a transecting cleavagegenerated within a sinistral transpressional regime.These younger, Acadian structures were attributed tothe northwards movement of the Midlands Microcratonas a rigid indenter (Soper, Webb & Woodcock, 1987;Woodcock, 1990).
To account for these different ages and styles oftransection geometry on either side of the MidlandsMicrocraton, it is suggested that the 40Ar–39Ar ageestimate of 425–416 Ma in Charnwood Forest may in-clude the record of early deformation in the assemblageof terranes that, south of the Scottish Highlands,were converging with the Iapetus Ocean suture line(Fig. 1a). It is possible that, as sinistrally obliqueaccretion in the Scottish Southern Uplands was slowingdown (Soper & Woodcock, 2003), dextral transpressivedeformation in Charnwood Forest was commencingalong the NE margin of the Midlands Microcratonindenter, perhaps documenting the latter’s early relativenorthward movement against the Eastern Caledonidesterrane. This involvement of the microcraton is broadlycompatible with the concept (Soper & Woodcock,2003) of sinistral transtension prevailing across Walesand NW England at that time (Fig. 5). Uplift of themicrocraton eastern margin, perhaps commensuratewith the Charnwood deformation, would also be inkeeping with an upwards shallowing of depositionalfacies, reddening of strata and possible cessation ofdeposition of sediments within the East Anglia Basin,in which the youngest biostratigraphically dated strataare of Silurian, late Prıdolı age (Woodcock & Pharaoh,1993), or about 416 Ma on the timescale of Gradsteinet al. (2005). This transition from marine to non-marinedeposition is also seen across the whole of the westernedge of the microcraton, into the Welsh Basin and asfar north as the Lake District, as reviewed in Soper &Woodcock (2003); it is the evidence formerly usedto suggest that the ‘Caledonian Orogeny’ was end-Silurian in age.
It is noteworthy that in the paratectonic Eastern Cale-donides domain immediately to the east of CharnwoodForest (Fig. 1a), Cambro-Ordovician basement rocksintersected in boreholes differ from the Charnwoodrocks in possessing generally weaker tectonic fabricsand lower, anchizonal KI values, corresponding to amaximum burial of approximately 8 km depth (Kemp,1997; Pharaoh et al. 1987; Merriman et al. 1993; VanGrootel et al. 1997). Thus the style of Charnwooddeformation, and its epizonal metamorphism, couldrepresent a narrow zone of relatively deeper burialand stronger compression that was localized along thetectonic boundary between the Eastern Caledonidesand Midlands Microcraton.
Within the continuation of the Eastern Caledonidesbelt in Belgium, dextral transpressive deformationhas been tentatively suggested (Sintubin, Brodkom &Laduron, 1998), and the Charnwood deformationreported here thus fulfils their prediction that sucha tectonic regime should be widespread within the‘Anglo-Brabant fold-belt’, which encompasses theEastern Caledonides and Brabant Massif terranes(Fig. 5). The Brabant deformation appears to havebeen particularly protracted, compared with the areasof southern Britain affected by the Acadian event(Debacker et al. 2005; Woodcock, Soper & Strachan,2007). On the basis of unconformities, a relativelyyoung ‘Acadian’ Brabantian event has been suggested,between earliest Devonian (Late Lochkovian) andGivetian times (Van Grootel et al. 1997). However, ra-diometric age determinations (40Ar–39Ar) on cleavage-parallel micas (Dewaele, Boven & Muchez, 2002;Debacker et al. 2005) indicate an earlier phase ofBrabantian deformation, with one age cluster at 419–412 Ma (Prıdolı and Lochkovian), overlapping withthat seen in Charnwood Forest, and another at 407–401 Ma (Emsian).
9. Conclusions
In Charnwood Forest, spot analysis and step-heatingexperiments suggest the presence of two distinct40Ar–39Ar argon age clusters: an older and diffuseone peaking at around 432–430 Ma (Llandovery) anda younger grouping at 425 to 416 Ma (Wenlock–Lochkovian). The younger grouping is represented inall datasets and is regarded as the best estimate forthe age of the deformation. In three of the samplesit is characterized by well-defined peaks, at 419 and416 Ma (Prıdolı–Lochkovian), the former value havingbeen determined for a cleavage-related ductile shearzone cutting primary igneous lithologies. The cleavagearose within a dextral transpressional regime and wasa consequence of burial and compression localizedwithin or adjacent to the tectonic interface betweenthe Eastern Caledonides structural province and theNE margin of the Midlands Microcraton. A similarage of cleavage deformation has been detected inthe Brabant continuation to the Eastern Caledonidesbelt in Belgium, and this ‘Brabantian’ phase of theCaledonian Orogeny evidently overlaps with a periodof transtension in western Britain. Although furtherwork will be required in order to bracket moreprecisely the timing of Charnwood deformation, theSilurian to earliest Devonian age estimate suggests thatfolding, cleavage and epizonal metamorphism couldbe related to Iapetus closure, perhaps overlapping withthe final stages of that event. The eastern margin of theMidlands Microcraton indenter could therefore havebeen tectonically active some 20–30 Ma before thewidespread Acadian Phase (Devonian: Emsian) of theCaledonian orogeny that occurred further west, inthe Welsh Basin and Lake District.

712 J. N. CARNEY AND OTHERS
Acknowledgements. The analytical work was carried outby MSP at the Argon Isotope Facility at SUERC, whichis supported by the Scottish Universities and NERC Sci-entific Services; the 40Ar–39Ar analyses reported here weresupported by funding under NIGFSC proposal IP/422/0994.We thank the Geological Magazine reviewers, and also D. J.Condon, J. A. Evans, D. I. Schofield and N. H. Woodcockfor their constructive comments and discussions. JNC, TCP,RJM and SJK publish with the approval of the ExecutiveDirector, British Geological Survey (NERC).
References
ALEXANDRE, P., CHALOT-PRAT, F., SAINTOT, A., WIJBRANS,J., STEPHENSON, R., WILSON, M., KITCHKA, A. &STOVBA, S. 2004. 40Ar/39Ar dating of magmatic activ-ities in the Donbas Foldbelt and the Scythial Platforn(Eastern European Craton). Tectonics 23(5), TC5002,15 pp.
BLAND, B. H. & GOLDRING, R. 1995. Teichichnus rectusSeilacher from the Charnian of Leicestershire. NeuesJahrbuch fur Geologie und Palaontologie Abhandlun-gen 195, 5–23.
BRIDGE, D. MCC., CARNEY, J. N., LAWLEY, R. S. &RUSHTON, A. W. A. 1998. The geology of the countryaround Coventry and Nuneaton. Memoir of the BritishGeological Survey Sheet 169 (England and Wales),185 pp.
BRITISH GEOLOGICAL SURVEY. 1996. Tectonic map of Bri-tain, Ireland and adjacent areas, 1:500 000 (compilersT. C. Pharaoh, J. H. Morris, C. B. Long & P. D. Ryan).Keyworth, Nottingham: British Geological Survey.
CARNEY, J. N. 1999. Revisiting the Charnian Supergroup:new advances in understanding old rocks. GeologyToday 15(6), 221–9.
CARNEY, J. N. 2005. Old Cliffe Hill and Whitwick quarries,Charnwood Forest. Mercian Geologist 16, 138–41.
COMPSTON, W., WRIGHT, A. E. & TOGHILL, P. 2002. Datingthe Late Precambrian volcanicity of England and Wales.Journal of the Geological Society, London 159, 323–39.
DALRYMPLE, G. B., ALEXANDER, E. C. JR, LANPHERE,M. A. & KRAKER, G. P. 1981. Irradiation of samples for40Ar/39Ar dating using the Geological Survey TRIGAreactor. U.S. Geological Survey Professional Paper,Report P1176, 55 pp.
DEBACKER, T. N., DEWAELE, S., SINTUBIN, M., VERNIERS,J., MUCHEZ, P. & BOVEN, A. 2005. Timing and durationof the progressive deformation of the Brabant Massif,Belgium. Geologica Belgica 8, 20–34.
DEWAELE, S., BOVEN, A. & MUCHEZ, P. H. 2002. 40Ar/39Ardating of mesothermal, orogenic mineralization in a low-angle reverse shear zone in the Lower Palaeozoic of theAnglo-Brabant fold belt, Belgium. Transactions of theInstitution of Mining and Metallurgy 111, B215–20.
DEWEY, J. F. & STRACHAN, R. A. 2003. Changing Silurian–Devonian relative plate motion in the Caledonides:sinistral transpression to sinistral transtension. Journalof the Geological Society, London 160, 219–29.
DODSON, M. H. & ROBINSON, D. 2006. A mid-OrdovicianRb–Sr isochron age from the Ingleton Group, NorthYorkshire: metamorphism or diagenesis? Proceedingsof the Yorkshire Geological Society 56(2), 81–5.
DONG, H., HALL, C. M., HALLIDAY, A. N., PEACOR,D. R., MERRIMAN, R. J. & ROBERTS, B. 1997. 40Ar/39Ardating of Late Caledonian (Acadian) metamorphism andcooling of K-bentonites and slates from the Welsh Basin,U.K. Earth and Planetary Science Letters 150, 337–51.
GRADSTEIN, F. M., OGG, J. G., SMITH, A. G. et al. 2005.A Geologic Time Scale, 2004. Cambridge UniversityPress, 589 pp.
HO, N.-C., PEACOR, D. R. & VAN DER PLUIJM, B. A. 1999.Preferred orientation of phyllosilicates in Gulf Coastmudstones and relation to the smectite–illite transition.Clays and Clay Minerals 47, 495–504.
KAUFMANN, B., TRAPP, E., MEZGER, K. & WEDDIGE,K. 2005. Two new Emsian (Early Devonian) U–Pbzircon ages from volcanic rocks of the Rhenish Massif(Germany): implications for the Devonian time scale.Journal of the Geological Society, London 162, 363–71.
KEMP, S. J. 1997. The nature and maturity of mudstoneintervals from the Ticknall borehole, Derbyshire. Brit-ish Geological Survey Technical Report WG/97/18,18 pp.
KEMP, S. J. & MERRIMAN, R. J. 1995. White mica (illite)crystallinity of Charnian rocks from the Loughboroughdistrict (1:50000 geological sheet 141). British Geolo-gical Survey Technical Report WG/95/7, 12 pp.
KISCH, H. J. 1990. Calibration of the anchizone: a criticalcomparison of illite ‘crystallinity’ scales used fordefinition. Journal of Metamorphic Geology 8, 31–46.
KNIPE, R. J. 1981. The interaction of deformation andmetamorphism in slates. Tectonophysics 78, 249–72.
LEE, M. K., PHARAOH, T. C. & SOPER, N. J. 1990. Structuraltrends in central Britain from images of gravity andaeromagnetic fields. Journal of the Geological Society,London 147, 241–58.
LI, G., PEACOR, D. R., MERRIMAN, R. J. & ROBERTS, B. 1994.The diagenetic to low-grade metamorphic evolution ofmatrix white micas in the system muscovite–paragonitein a mudrock from Central Wales, U.K. Clays and ClayMinerals 42, 369–81.
MCDOUGALL, I. & ROKSANDIC, Z. 1974. Total fusion40Ar/39Ar ages using the HIFAR reactor. Journal of theGeological Society of Australia 21, 81–9.
MCILROY, D., BRASIER, M. D. & MOSELEY, J. M. 1998. TheProterozoic–Cambrian transition within the ‘CharnianSupergroup’ of central England and the antiquity ofthe Ediacaran fauna. Journal of the Geological Society,London 155, 401–12.
MCKERROW, W. S., MAC NIOCAILL, C. & DEWEY, J. F.2000. The Caledonian Orogeny redefined. Journal ofthe Geological Society, London 157, 1149–55.
MENEISY, M. Y. & MILLER, J. A. 1963. A geochronologicalstudy of the crystalline rocks of Charnwood Forest,England. Geological Magazine 100, 507–23.
MERRIMAN, R. J. & KEMP, S. J. 1997. Metamorphism ofthe Charnian Supergroup in the Loughborough district,1:50000 Sheet 141. British Geological Survey TechnicalReport WG/97/7, 12 pp.
MERRIMAN, R. J. & PEACOR, D. R. 1999. Very low-grademetapelites: mineralogy, microfabrics and measuringreaction progress. In Low-Grade Metamorphism (edsM. Frey & D. Robinson), pp. 1–60. Blackwell Science.
MERRIMAN, R. J., PHARAOH, T. C., WOODCOCK, N. H.& DALY, P. 1993. The metamorphic history of theconcealed Caledonides of eastern England and theirforeland. Geological Magazine 130, 613–20.
MERRIMAN, R. J., REX, D. C., SOPER, N. J. & PEACOR,D. R. 1995b. The age of Acadian cleavage in northernEngland, UK: K–Ar and TEM analysis of a Silurianmetabentonite. Proceedings of the Yorkshire GeologicalSociety 50, 255–65.
MERRIMAN, R. J., ROBERTS, B. & PEACOR, D. R. 1990.A transmission electron microscope study of whitemica crystallite size distribution in a mudstone to slate

Argon dating of Charnwood deformation 713
transitional sequence, North Wales, U.K. Contributionsto Mineralogy and Petrology 106, 27–40.
MERRIMAN, R. J., ROBERTS, B., PEACOR, D. R. & HIRONS,S. R. 1995a. Strain-related differences in the crystalgrowth of white mica and chlorite: a TEM and XRDstudy of the development of metapelitic microfabrics inthe Southern Uplands thrust terrane, Scotland. Journalof Metamorphic Geology 13, 559–76.
MOSELEY, J. & FORD, T. D. 1985. A stratigraphic revisionof the Late Precambrian rocks of the Charnwood Forest,Leicestershire. Mercian Geologist 10, 1–18.
PARRY, W. T., BUNDS, M. P., BRUHN, R. L., HALL, C. M.& MURPHY, J. M. 2001. Mineralogy, 40Ar/39Ar datingand apatite fission track dating of rocks along theCastle Mountain faults, Alaska. Tectonophysics 337,149–72.
PHARAOH, T. C. 1999. Palaeozoic terranes and theirlithospheric boundaries within the Trans-EuropeanSuture Zone (TESZ): a review. Tectonophysics 314,17–41.
PHARAOH, T. C., MERRIMAN, R. J., WEBB, P. C. & BECKIN-SALE, R. D. 1987. The concealed Caledonides of easternEngland: preliminary results of a multidisciplinarystudy. Proceedings of the Yorkshire Geological Society46, 355–69.
PHARAOH, T. C. & CARNEY, J. N. 2000. Introductionto the Precambrian rocks of England and Wales.In Precambrian Rocks of England and Wales (edsJ. N. Carney, J. M. Horak, T. C. Pharaoh et al.),pp. 3–17. Geological Conservation Review Series no.20. Peterborough: Joint Nature Conservation ReviewCommittee.
RENNE, P. R., SWISHER, C. C., DEINO, A. L., KARNER, D. B.,OWENS, T. L. & DEPAOLO, D. J. 1998. Intercalibration ofstandards, absolute ages and uncertanties in 40Ar/39Ardating. Chemical Geology 145, 117–52.
ROBINSON, P., TUCKER, R. D., BRADLEY, D., BERRY, H. N.& OSBERG, P. H. 1998. Palaeozoic orogens in NewEngland, USA. GFF 20, 119–48.
SHERLOCK, S. C., KELLEY, S. P., ZALASIEWICZ, J.,SCHOFIELD, D., EVANS, J., MERRIMAN, R. J. & KEMP,S. J. 2003. Precise dating of low-temperature de-formation: Strain-fringe analysis by 40Ar–39Ar lasermicroprobe. Geology 31, 219–22.
SINTUBIN, M., BRODKOM, F. & LADURON, D. 1998. Cleavage-fold relationships in the Lower Cambrian Tubize
Group, southeast Anglo-Brabant Fold Belt (Lembeek,Belgium). Geological Magazine 135, 217–26.
SMITH, N. J. P. 1987. The deep geology of central England:the prospectivity of the Palaeozoic rocks. In PetroleumGeology of North West Europe (eds J. Brooks & K.Glennie), pp. 217–24. London: Graham & Trotman.
SOPER, N. J., WEBB, B. C. & WOODCOCK, N. H. 1987.Late Caledonian (Acadian) transpression in north-westEngland: timing, geometry and geotectonic significance.Proceedings of the Yorkshire Geological Society 46,175–92.
SOPER, N. J. & WOODCOCK, N. H. 2003. The lost OldRed Sandstone of England and Wales: a record ofpost-Iapetan flexure of Early Devonian transtension?Geological Magazine 140, 627–47.
TURNER, J. S. 1949. The deeper structure of centraland northern England. Proceedings of the YorkshireGeological Society 27, 280–97.
VAN DE PLUIJM, B. A., HO, N.-C., PEACOR, D. R. &MERRIMAN, R. J. 1998. Contradictions of slate formationresolved. Nature 392, 348.
VAN GROOTEL, G., VERNIERS, J., GEERKENS, B., LADURON,D., VERHAEREN, M., HERTOGEN, J. & DE VOSS, W. 1997.Timing of magmatism, foreland basin development,metamorphism and inversion in the Anglo-Brabant foldbelt. Geological Magazine 134, 607–16.
VILLA, I. M. 1998. Isotopic closure. Terra Nova 10, 42–7.WARR, L. N. & RICE, A. H. N. 1994. Interlaboratory standard-
ization and calibration of clay mineral crystallinity andcrystallite size data. Journal of Metamorphic Geology12, 141–52.
WINCHESTER, J. A., PHARAOH, T. C. & VERNIERS, J.2002. Palaeozoic amalgamation of Central Europe: anintroduction and synthesis of new results from recentgeological and geophysical investigations. In Palaeozoicamalgamation of Central Europe (eds J. A. Winchester,T. C. Pharaoh & J. Verniers), pp. 1–18. GeologicalSociety of London, Special Publication no. 201.
WOODCOCK, N. H. 1990. Transpressive Acadian deformationacross the Central Wales Lineament. Journal of Struc-tural Geology 12, 329–37.
WOODCOCK, N. H. & PHARAOH, T. C. 1993. Silurian faciesbeneath East Anglia. Geological Magazine 130, 681–90.
WOODCOCK, N. H., SOPER, N. J. & STRACHAN, R. A. 2007. ARheic cause for Acadian deformation in Europe. Journalof the Geological Society, London 164, 1023–36.