geography toolkit 5 - pearson
TRANSCRIPT

97CHAPTER 5 | GEOGRAPHY TOOLKIT
GLOSSARYaspect the direction a slope faces
contour interval the difference in height between two contour lines on a map
contour lines lines on a map that join places of equal height above sea level
distribution patterns the spatial arrangement of the population or number of objects per unit of area
ecology the study of the environment and how plants, animals and humans live together and affect each other
elevation the height of a point or place above sea level
environment our total surroundings, such as the living and non-living features of the Earth’s surface and atmosphere; this includes features that are altered or created by people
ground-level photographs photographs taken from the ground
legend the part of a map that explains the meaning of the symbols used in the map; sometimes referred to as the key
location the position of a feature or place on the Earth’s surface
oblique photographs photographs taken from above the ground, with the camera pointed at an oblique (slanted) angle to the ground; often a horizon cannot be seen
relief in geography, a term describing the shape of the land, including height and steepness
scale the relationship between distance on a map and actual distance on the Earth’s surface
spot heights the exact altitudes or heights above sea level of points on the Earth’s surface
thematic maps maps designed to illustrate a particular theme (e.g. annual rainfall or the location of oil resources)
topography the shape of the land
vertical photographs photographs taken from above the ground, with the camera lens pointed directly down on the area being photographed 5.0.1 The Wave, Paria Canyon, USA. These sandstone
formations were initially eroded by water run-off. After the water dried up, they continued to be eroded by wind and sand.
Geography is concerned with the changes taking place in all living and non-living elements of the Earth’s surface and atmosphere. The elements interact to produce the diverse landscapes that make up the world around us. Geographers are concerned with the world’s people, communities and cultures. Of particular interest are the ways in which the activities of people impact on places.
In this chapter we reflect on how people view their place in the world. These worldviews help geographers understand people’s attitudes towards the natural world and its resources. We also learn how to read maps and draw a cross-section, and find out about the use of different types of photographs in studying our world.
OVERVIEW QUESTIONS5A How do people’s worldviews affect
the way they interact with the natural, managed and built environments?
5B What types of maps and photographs are used by geographers, and what are the conventions used in their creation?
5C What are the key skills involved in the interpretation of maps?
Geography toolkit 5
Sample
page
s

98 PEARSON HUMANITIES VICTORIA 8
5.1 Key concept: Environmental worldviews
Human-centred worldviewThis worldview is based on the belief that humans are the most important species and have several traits that set them apart from other species. For example, those with a human-centred worldview try to control nature through technology. They believe they are the masters of nature, and that other species have a value only if they are considered useful to humans.
As human needs are considered the most important, the impacts of economic growth and development on the natural world are not important. Technology is seen to be the solution to problems of potential environmental damage.
Stewardship-based worldviewPeople with this worldview believe that humans should be caring stewards (managers) of the natural world. They recognise that humans use resources but are aware that these resources may run out and should be managed carefully. Any development must not threaten the Earth’s life support systems on which humans and other species and ecosystems depend.
Indigenous people acted as stewards, as they traditionally had a close spiritual connection with the land and its creatures. They were grateful for what they were able to take and treated the natural world with respect. Any hunting or gathering was done well within the recovery limits of species. With this worldview they managed the environment successfully for thousands of years. While many indigenous people now no longer practise traditional hunting and gathering, they still hold this worldview.
Nature-centred worldviewPeople with a nature-centred worldview believe that nature exists for the benefit of all species on Earth, not just humans.
Humans are considered equal with other species, and all species have a value separate from any material benefit humans may get from them. Those with a nature-centred worldview believe every species has a right to life and does not have to be useful to humans to justify its continued existence. Humans also have an ethical (moral) responsibility to guard against the extinction of any species.
The deep ecology movement goes even further, claiming that humans have no right to interfere with the richness and diversity of the natural world.
Defining worldviewsWorldviews determine how people see their place in the world. They are reflected in people’s behaviour and the decisions they make. Knowledge of people’s environmental worldviews is important because it helps geographers understand the various attitudes that people have towards the natural world and its resources.
PerspectiveA worldview is a point of view, or perspective. It can be held by an individual, though when accepted and shared by many it becomes a belief system that is widely acknowledged. An environmental worldview is concerned with how the Earth and all its species and resources are managed.
Establishing worldviewsConflicts arise when people hold different environmental worldviews. For example, people will often disagree about whether an environmental problem should be solved or ignored. People have different points of view or opinions about the worth of other species and the extent to which they should be protected.
A person’s environmental worldview is determined by:
➤➤ how they think the world works➤➤ what they think is their role in the environment➤➤ what they think is the correct environmental behaviour.
5.1.1 A sign at Kinglake National Park, Victoria
Different worldviewsThere are a number of competing environmental worldviews. These views may be classified as human-centred, stewardship-based and nature-centred. These views are explained below and summarised in Table 5.1.2.
Sample
page
s

99CHAPTER 5 | GEOGRAPHY TOOLKIT
Human-centred worldview Stewardship-based worldview Nature-centred worldview
Humans are separate from the rest of nature and can manage nature to satisfy their ever-increasing needs and wants.
Humans have an ethical responsibility to be responsible stewards of the Earth and its resources.
Humans are part of nature and totally dependent on it for our wellbeing.
Technological advances will enable humanity to overcome any adverse (negative or harmful) impact on the natural environment.
The supply of natural resources is plentiful but they should be used carefully to avoid waste.
The Earth’s resources are limited and should not be wasted.
There is no limit on future economic growth.
Sustainable forms of economic growth should be encouraged ahead of those that are environmentally damaging.
Sustainable forms of economic activity should be encouraged. Activities that degrade the Earth’s resources should be discouraged.
Our future wellbeing depends on how well we manage the Earth’s life-support systems.
Our future wellbeing depends on how we manage the Earth’s life-support systems for our benefit and that of the rest of nature.
Our future wellbeing depends on our developing an understanding of how nature sustains itself.
5.1.2 Comparing worldviews
Remembering and understanding1 Define the term ‘worldview’.2 Explain how a person’s environmental
worldview is determined.3 Describe the three different types of
environmental worldviews.4 Explain why conflicts arise between people
with differing environmental worldviews.
Applying and analysing5 Determine your own worldview by considering
the following: What is more important, the health of the Earth’s natural world or the wellbeing of people? Write a short explanation of your opinion.
6 Study Table 5.1.2. Which of the various descriptions most closely matches your worldview? Which of them most closely reflects the worldview of your parents?
Activities
Spotlight
5.1.3 Pumalin Park, Chile, is an area of exceptional beauty and unique forest ecosystems.
Douglas TompkinsDouglas Tompkins is a wealthy American environmentalist and former businessman who founded the clothing companies North Face and Esprit. He went on to sell these businesses when he became concerned about the environmental impact of the fashion industry. Tompkins used his wealth to promote the importance of conservation, especially the protection of areas of exceptional environmental quality. His first project was Pumalin Park in Chile. There he purchased a 3200-square-kilometre area of temperate rainforest, high peaks, lakes and rivers. Without Tompkins’s intervention, this area might have been exploited to generate power, or for industry or agriculture. The Chilean government has since declared it a nature sanctuary. Tompkins also established the Foundation for Deep Ecology. Sam
ple pa
ges

100 PEARSON HUMANITIES VICTORIA 8
BRISBANE
CANBERRA
HOBART
SYDNEY
MELBOURNE
ADELAIDE
PERTH
DARWIN
1 000 000
500 000
100 000
Population
N
1000 km5000
Types of mapsMaps range from the very simple to the very complex. Cartographers (map makers) use symbols, shading and colour to simplify reality and show how the features of the Earth’s surface are arranged and distributed. Some common types of maps are:
➤➤ topographic maps—detailed, large-scale maps that illustrate selected features of the physical environment
➤➤ weather maps—map weather events and changes as they occur
➤➤ thematic maps—illustrate a particular theme, such as annual rainfall or the location of oil resources (see Figure 5.2.1)
➤➤ street maps—detailed maps that focus on a smaller area in an urban centre.
Elements of mapsThe essential elements of a map are:
➤➤ a border➤➤ an orientation or direction indicator➤➤ a legend or key, to explain symbols used➤➤ a title➤➤ a scale, to indicate the relationship between distance on
the map and actual distance on the Earth’s surface➤➤ a source, to tell us where the information in the map
came from.
A good way to remember the essential elements of a map is the term ‘BOLTSS’—border, orientation, legend, title, scale and source.
QuadrantsTo help us to locate features on maps, geographers sometimes express location (position) in terms of quadrants. The quadrants are named for the points of the compass.
north-west quadrant
north-east quadrant
south-west quadrant
south-east quadrant
5.2.2 The quadrants of a map
Patterns between mapsMaps help us to identify distribution patterns (the spatial arrangement of objects per unit of area) in landscapes. Figures 5.2.3 and 5.2.4 show a strong link between arid (dry) zones in Australia and regions that receive less than 250 millimetres of rainfall per year. Locations that receive over 2000 millimetres of rainfall per year have a tropical or maritime climate. In contrast, areas that receive less than 250 millimetres of rainfall per year have a semi-arid climate.
5.2 Maps
5.2.1 Australia’s population distribution
Cold ocean currentWarm ocean current
Isohyet
Brisbane
Sydney
Canberra1000
Melbourne
Darwin
AliceSprings
C a p r i c o r no fT r o p i c
Hobart
Adelaide
2000 1000
1000
1000
1000
500
500500Perth
1000
1000–2000
500–1000
250–500
Less than 250
250
250
Mean annual rainfall(millimetres)
2000 and over
500
1000
1000 2000
500
N
1000 km5000
5.2.3 Australia’s annual rainfall
Sample
page
s

101CHAPTER 5 | GEOGRAPHY TOOLKIT
Remembering and understanding1 Name four types of maps.2 List the elements of a map.
Geographical skills3 Study Figure 5.2.1 and do the following tasks.
a Name the quadrant/s that include cities of over 1 000 000 people.
b Name the quadrant/s in which the least people live.
4 Study Figure 5.2.4 and do the following tasks.a Name the quadrant/s in which the maritime
climate zone is located.b Name the quadrant/s in which the
Mediterranean climate zone is located.5 Study Figures 5.2.3 and 5.2.4, and do the
following tasks.
a Is there a link between tropical zones and areas receiving more than 1000 millimetres of rainfall per year? Explain.
b Is there a link between semi-arid zones and areas receiving 250 to 500 millimetres of rainfall per year?
6 Study Figures 5.2.1 and 5.2.4, and answer the following questions.a Is there a link between areas with low
population and arid zones? Explain.b Is there a link between areas with low
population and warm humid climate zones? Explain.
7 Study Figures 5.2.1 and 5.2.3, and discuss the following statement. ‘There is a strong link between rainfall areas greater than 500 millimetres per year and the location of large cities in Australia.’
Activities
Scale 1 : 32 400 000
O c e a n
P a c i f i cO c e a n
I n d i a n
C a p r i c o r no f
T r o p i c
DARWIN
PERTH
ADELAIDE
HOBART
MELBOURNE
CANBERRA
SYDNEY
BRISBANE
o30 S
o20 S
o10 S
o30 S
o20 S
o10 S
rain; mild to warm winters, irregular rain
wet winters
Arid: hot to very hot summers with some
Maritime: warm, wet summers; cool to
Mediterranean: hot, dry summers; mild
cold, wet winters
Semi-arid with summer rain: hot, humid and wet summers; warm and dry winters
Semi-arid with winter rain: warm to hot and dry summers; cool to cold and wet winters
Warm humid: hot, humid and wet summers; mild to cool winters with some rain
wet summers; warm to hot, dry wintersTropical wet and dry: hot, humid and very
N
1000 km200 400 600 8000
5.2.4 Climate regions of Australia
Sample
page
s
102 PEARSON HUMANITIES VICTORIA 8
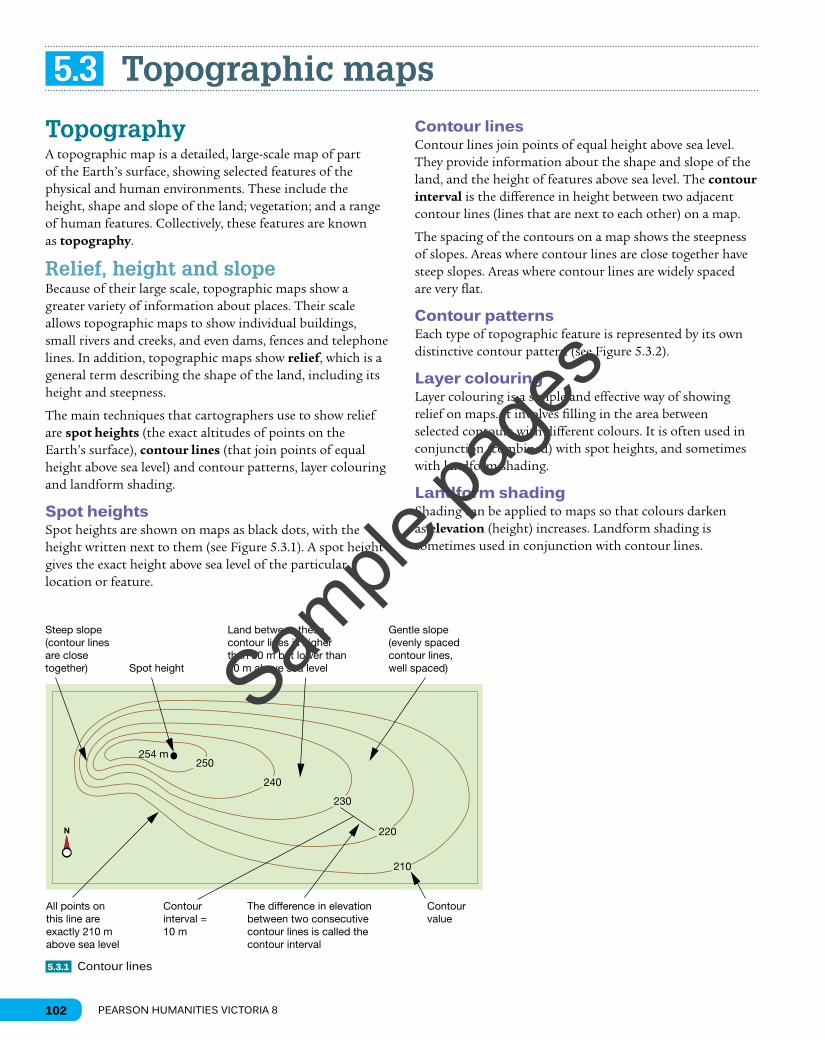
TopographyA topographic map is a detailed, large-scale map of part of the Earth’s surface, showing selected features of the physical and human environments. These include the height, shape and slope of the land; vegetation; and a range of human features. Collectively, these features are known as topography.
Relief, height and slopeBecause of their large scale, topographic maps show a greater variety of information about places. Their scale allows topographic maps to show individual buildings, small rivers and creeks, and even dams, fences and telephone lines. In addition, topographic maps show relief, which is a general term describing the shape of the land, including its height and steepness.
The main techniques that cartographers use to show relief are spot heights (the exact altitudes of points on the Earth’s surface), contour lines (that join points of equal height above sea level) and contour patterns, layer colouring and landform shading.
Spot heightsSpot heights are shown on maps as black dots, with the height written next to them (see Figure 5.3.1). A spot height gives the exact height above sea level of the particular location or feature.
Contour linesContour lines join points of equal height above sea level. They provide information about the shape and slope of the land, and the height of features above sea level. The contour interval is the difference in height between two adjacent contour lines (lines that are next to each other) on a map.
The spacing of the contours on a map shows the steepness of slopes. Areas where contour lines are close together have steep slopes. Areas where contour lines are widely spaced are very flat.
Contour patternsEach type of topographic feature is represented by its own distinctive contour pattern (see Figure 5.3.2).
Layer colouringLayer colouring is a simple and effective way of showing relief on maps. It involves filling in the area between selected contours with different colours. It is often used in conjunction (combined) with spot heights, and sometimes with landform shading.
Landform shadingShading can be applied to maps so that colours darken as elevation (height) increases. Landform shading is sometimes used in conjunction with contour lines.
5.3 Topographic maps
Steep slope(contour linesare close together) Spot height
Land between these contour lines is higher than 30 m but lower than 40 m above sea level
Gentle slope (evenly spaced contour lines, well spaced)
Contour value
Contour interval = 10 m
All points on this line are exactly 210 m above sea level
250
240
230
220
210
254 m
The difference in elevation between two consecutive contour lines is called the contour interval
N
5.3.1 Contour lines
Sample
page
s

103CHAPTER 5 | GEOGRAPHY TOOLKIT
5.3.2 Reading contour lines can tell a lot about the type of landforms.
Remembering and understanding1 Explain what topographic maps are.
What do they show?2 State what contour intervals are used for.3 List and explain the various ways relief is
shown on maps.4 State what is meant by the term ‘aspect’.
Activities
50
100 200
250150 300
300
250
200
150
8500
8750
90009250
9500
125
100
100
75
75
400
300
200
200
100
100
0
0
a b
140
140
120
120
8080
4040
01300
12001100
1000
130012001100
1000
900
800800
c d
60006200 62
00
6400
6400
6600 6600
6800 6800
7000
7000
72007200
6000
500
550600
600
600
600
600
600
650
650
650
650
700
650
650
550
550
550700
700
700
700
700
750750
e f
g h
flood plain drowned coastline
interlocking spurs beach cliff
ridge truncated spurs
escarpment conical mountain
Aspects of a slopeSlope refers to the height and pattern of the land. Aspect refers to the compass direction that a slope faces. There are north-facing, south-facing, east-facing and west-facing slopes. When there is no slope (the land is flat), there is no aspect.
Sample
page
s
104 PEARSON HUMANITIES VICTORIA 8
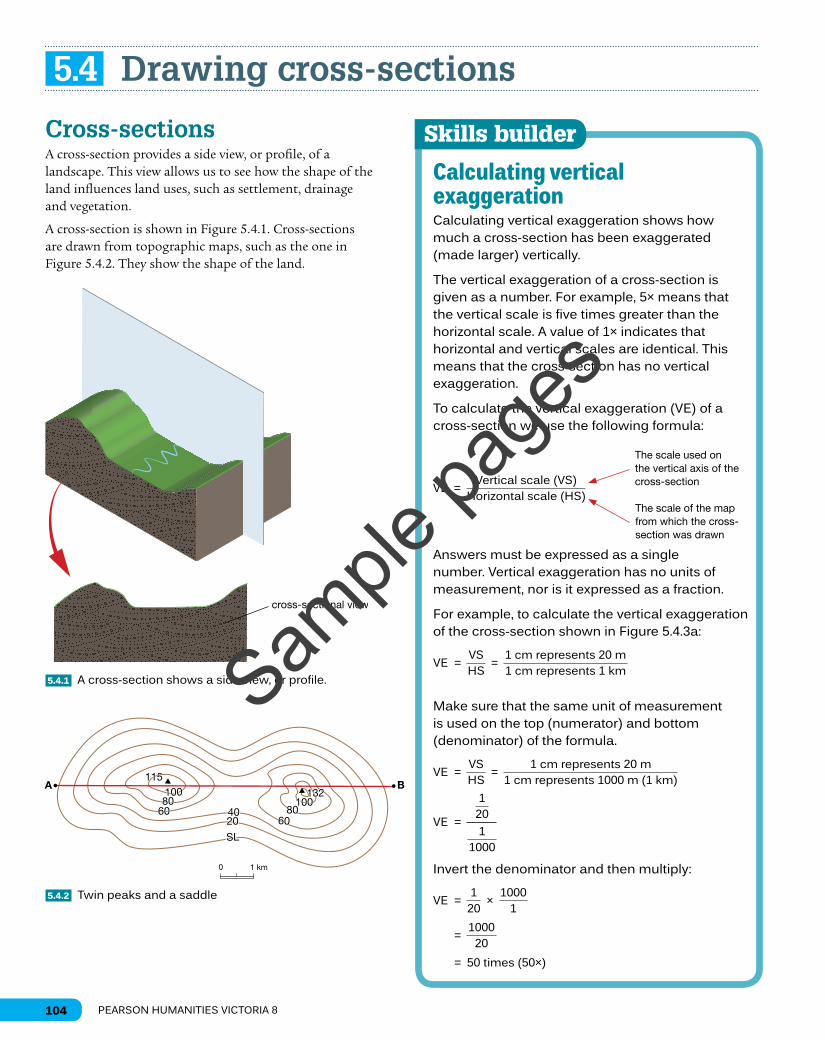
Cross-sectionsA cross-section provides a side view, or profile, of a landscape. This view allows us to see how the shape of the land influences land uses, such as settlement, drainage and vegetation.
A cross-section is shown in Figure 5.4.1. Cross-sections are drawn from topographic maps, such as the one in Figure 5.4.2. They show the shape of the land.
5.4 Drawing cross-sections
cross-sectional view
5.4.1 A cross-section shows a side view, or profile.
A B
SL
204060
80100
100132
115
8060
1 km0
5.4.2 Twin peaks and a saddle
Skills builder
Calculating vertical exaggerationCalculating vertical exaggeration shows how much a cross-section has been exaggerated (made larger) vertically.
The vertical exaggeration of a cross-section is given as a number. For example, 5× means that the vertical scale is five times greater than the horizontal scale. A value of 1× indicates that horizontal and vertical scales are identical. This means that the cross-section has no vertical exaggeration.
To calculate the vertical exaggeration (VE) of a cross-section we use the following formula:
VE = Vertical scale (VS)
Horizontal scale (HS)
Answers must be expressed as a single number. Vertical exaggeration has no units of measurement, nor is it expressed as a fraction.
For example, to calculate the vertical exaggeration of the cross-section shown in Figure 5.4.3a:
VE = VSHS
= 1 cm represents 20 m1 cm represents 1 km
Make sure that the same unit of measurement is used on the top (numerator) and bottom (denominator) of the formula.
VE = VSHS
= 1 cm represents 20 m
1 cm represents 1000 m (1 km)
VE =
1201
1000
Invert the denominator and then multiply:
VE = 1
20 ×
10001
= 1000
20
= 50 times (50×)
The scale used on the vertical axis of the cross-section
The scale of the map from which the cross-section was drawn
Sample
page
s

105CHAPTER 5 | GEOGRAPHY TOOLKIT
Constructing cross-sectionsTo draw a cross-section, follow the steps below and refer to Figure 5.4.3.
1 Locate the two points on the map between which the cross-section is to be made. Label these points ‘A’ and ‘B’ (see drawing a).
2 Place the straight edge of a piece of paper along an imaginary line joining points A and B. Mark points A and B on your paper (see drawing b).
3 Mark the position where your paper crosses each contour line. Write the value of each contour line on your piece of paper (see drawing b). You may have to estimate the height of your starting and finishing points.
Remembering and understanding1 Describe what a cross-section shows.2 Explain how a cross-section might be useful to
geographers.
Geographical skills3 Study Figure 5.4.2. Construct the cross-section
A–B. Calculate the vertical exaggeration of the cross-section you have drawn.
Activities
4 On graph or squared paper, draw the horizontal and vertical axes for your cross-section. The length of the horizontal axis should equal the distance between A and B. The vertical axis should use a scale that does not exaggerate your vertical scale too much. You don’t want a range of low hills looking like the Himalayas!
5 Place your piece of paper along your horizontal axis. In pencil, lightly plot the contour points and heights as if you were drawing a line graph (see drawing c).
6 Join the dots with a single, smooth curved line.
7 Label any features intersected by your cross-section, such as rivers and major roads (see drawing d).
8 Finish off your cross-section by:
a shading in the area below the landform you have drawn
b labelling the scale on the horizontal and vertical axesc giving it a title.
5.4.3 Drawing a cross-section
100
90
80
70
7080 90 100
110
115
A
B
Peter
’s Cre
ek
100
90
80
70
7080 90 100
110
115
A
B
Peter
’s Cre
ek
100
A
B
90
80
70
70
cree
k
8090
100
110
115
100
A B
90 80 70 70
cree
k 80 90 100
110
115
sheet of paper
sheet of paper
0
20
40
60
80
100
120
0
Met
res
vertical axis
horizontal axis
cree
k
20
40
60
80
100
120
0
20
40
60
80
100
120
0
Peter’s Creek valley
1 cm = 1 km
Met
res
5 m
m =
20
m
cree
k
20
40
60
80
100
120
100
90
80
70
7080 90 100
110
115
A
B
Peter
’s Cre
ek
100
90
80
70
7080 90 100
110
115
A
B
Peter
’s Cre
ek
100
A
B
90
80
70
70
cree
k
8090
100
110
115
100
A B
90 80 70 70
cree
k 80 90 100
110
115
sheet of paper
sheet of paper
0
20
40
60
80
100
120
0
Met
res
vertical axis
horizontal axis
cree
k
20
40
60
80
100
120
0
20
40
60
80
100
120
0
Peter’s Creek valley
1 cm = 1 km
Met
res
5 m
m =
20
m
cree
k
20
40
60
80
100
120
a
b
c
d
Sample
page
s

106 PEARSON HUMANITIES VICTORIA 8
Locating places and featuresMost of the maps you will use in your study of geography include lines of latitude and longitude. These allow you to quickly and accurately locate places and features on the Earth’s surface.
LatitudeLines of latitude are imaginary lines that run in an east–west direction around the Earth. Because lines of latitude are parallel to each other, they are often referred to as parallels of latitude.
The most important line of latitude is the Equator (0°). The Equator divides the Earth into two halves: the Northern and Southern hemispheres. All other lines of latitude are either north or south of the Equator.
LongitudeLines of longitude (see Figure 5.5.2) run in a north–south direction. They are not parallel to one another because they all converge, or meet, at the North and South poles. Any number of these lines can be drawn on a map. These imaginary lines are called meridians of longitude.
The most important line of longitude is the Prime Meridian (0°), which passes through Greenwich Observatory in London, United Kingdom. All other lines of longitude are located either to the east or to the west of the Prime Meridian. The International Date Line (IDL) is on the opposite side of the world, at 180°. There is a change of day at the IDL. The Prime Meridian and the IDL divide the Earth into two halves: the Western and Eastern hemispheres.
Latitude and longitudeTogether, lines of latitude and longitude form a grid that allows you to pinpoint places on the Earth’s surface.
5.5 Latitude and longitude
5.5.1 Lines of latitude are sometimes called parallels of latitude because they run parallel to each other.
North Pole(90°N)
Arctic Circle
Prime Meridian or Greenwich Meridian
Parallels of latitude
Tropic of Cancer
Equator
Meridians of longitude
Tropic ofCapricorn
South Pole (90°S)
Latitude is alwayswritten before longitude—e.g. Luanda, Angola is 8°50'S 13°15'E
66½°N
23½°N
0°
23½°S
30°W 0° 30°E
60°W 60°E
Western Hemisphere: areas west of the Prime Meridian to 180°
North Pole
Prime Meridian or Greenwich Meridian
International Date Line (180°)
Meridiansof longitude
0° 30°E60°E
30°W
60°W
South Pole
Equator
Eastern Hemisphere: areas east of the Prime Meridian to 180°
North Pole (90°N)
Arctic Circle
Parallels of latitude
Tropic of Cancer
Equator
Tropic of Capricorn
South Pole (90°S)
66½°N
23½°N
0°
23½°S
Northern Hemisphere:areas north of the Equatorto the North Pole
Southern Hemisphere:areas south of the Equatorto the South Pole
Luanda
5.5.2 Meridians of longitude meet at the North and South poles.
North Pole(90°N)
Arctic Circle
Prime Meridian or Greenwich Meridian
Parallels of latitude
Tropic of Cancer
Equator
Meridians of longitude
Tropic ofCapricorn
South Pole (90°S)
Latitude is alwayswritten before longitude—e.g. Luanda, Angola is 8°50'S 13°15'E
66½°N
23½°N
0°
23½°S
30°W 0° 30°E
60°W 60°E
Western Hemisphere: areas west of the Prime Meridian to 180°
North Pole
Prime Meridian or Greenwich Meridian
International Date Line (180°)
Meridiansof longitude
0° 30°E60°E
30°W
60°W
South Pole
Equator
Eastern Hemisphere: areas east of the Prime Meridian to 180°
North Pole (90°N)
Arctic Circle
Parallels of latitude
Tropic of Cancer
Equator
Tropic of Capricorn
South Pole (90°S)
66½°N
23½°N
0°
23½°S
Northern Hemisphere:areas north of the Equatorto the North Pole
Southern Hemisphere:areas south of the Equatorto the South Pole
Luanda
In 2011, Samoans lost a day when the country decided to move to the other side of the International Date Line.
Did you know?
5.5.3 Lines of latitude and longitude form a grid around the Earth.
North Pole(90°N)
Arctic Circle
Prime Meridian or Greenwich Meridian
Parallels of latitude
Tropic of Cancer
Equator
Meridians of longitude
Tropic ofCapricorn
South Pole (90°S)
Latitude is alwayswritten before longitude—e.g. Luanda, Angola is 8°50'S 13°15'E
66½°N
23½°N
0°
23½°S
30°W 0° 30°E
60° 60°E
LuandaSample
page
s

107CHAPTER 5 | GEOGRAPHY TOOLKIT
5.5.4 This map extract of Japan shows latitude and longitude, as well as features of the biophysical and built environments.
Remembering and understanding1 Define the terms ‘parallel of latitude’ and
‘meridian of longitude’.2 Explain the difference between parallels of
latitude and meridians of longitude.3 Describe the location and significance of the
Prime Meridian and the International Date Line.
Geographical skills4 Study Figure 5.5.4. Name the feature located at
each set of coordinates.a Physical environment features
i 36°05′N 133°00′Eii 42°30′N 132°00′E
iii 35°23′N 138°42′Eiv 38°20′N 138°30′Ev 41°20′N 140°15′Evi 42°N 129°Evii 33°30′N 135°45′E
b Human environment featuresi 35°40′N 139°45′Eii 34°23′N 132°27′Eiii 31°00′N 130°30′Eiv 38°15′N 140°52′Ev 43°05′N 141°21′Evi 35°02′N 135°45′E
Activities
Skills builder
Finding places using latitude and longitudeIf you are given the latitude and longitude (or coordinates) of a place and asked to identify it, follow the steps below.
1 Using a world map, find the general location of the latitude and longitude you have been given.
2 Turn to a map of the region or continent, and locate the latitude and longitude more accurately.
3 Check your answer by finding the place name in the index of the atlas. Most atlas indexes include the latitude and longitude of each place.
Kobe in Japan, for example, has a latitude of approximately 35° north of the Equator and a longitude of approximately 135° east of the Prime Meridian. To be even more accurate, each degree (°) can be divided into smaller units, called minutes (′). There are 60 minutes in each degree. Kobe’s location using degrees and minutes is latitude 34°40′ north, longitude 135°12′ east.
Area of map
135°E
135°E
130°E 140°E
140°E
40°N40°N
35°N35°N
Sample
page
s

108 PEARSON HUMANITIES VICTORIA 8
5.6 Photographs
Types of photographsPhotographs are very important to geographers. A photo of an area of the Earth can give a geographer an idea of what it looks like without needing to visit it. Photographs record a landscape as it exists at a particular time. They can also be used to record fieldwork observations.
Geographers group photographs in three different categories: ground-level, oblique and vertical.
➤➤ Ground-level photographs are taken from the ground. Features in the foreground will appear larger than those in the background. Large objects in the foreground may block out features in the middle and background.
➤➤ Oblique photographs are taken from above the ground, with the camera pointed at an oblique (slanted) angle to the ground. They are similar to ground-level photographs in that features in the background will appear smaller than those in the foreground. Often a horizon cannot be seen.
➤➤ Vertical photographs are taken from above the ground, with the camera lens pointed directly down on the area being photographed. Features across the photograph will not be distorted, although it will be hard to estimate their height.
Interpreting photographsWhen interpreting photographs, look for:
➤➤ the main features being shown➤➤ relevant information given with the photograph, such as
a caption or written information➤➤ evidence of location and time➤➤ clues to scale and living conditions➤➤ features that seem out of place, as they may require
further reading or investigation.
5.6.1 A ground-level photograph, Serengeti National Park, Tanzania
5.6.2 An oblique photograph, Dubrovnik, Croatia
5.6.3 A vertical photograph, Tokyo, Japan
oblique
ground level
vertical
5.6.4 Taking ground-level, oblique and vertical photographs
Sample
page
s

109CHAPTER 5 | GEOGRAPHY TOOLKIT
Remembering and understanding1 Explain why photographs are important to
geographers.2 State how ground-level photographs differ from
oblique photographs.
Applying and analysing3 Study Figures 5.6.1–5.6.4, then answer the
following questions.a Which type of photograph:
i shows excellent detail about the foreground?
ii eliminates (gets rid of) any distortion to the shape of an area covered by features?
iii best shows the shape of the landscape?
b Which type of photograph would be most suitable for showing:i a plan view of your school?ii a crowded shopping centre?iii areas affected by flooding?iv the height of a new building?
4 Study Figures 5.6.1 and 5.6.2. Compare the two locations by interpreting the photos.
Evaluating and creating5 Study Figure 5.6.2, then complete the following
tasks.a Construct a photo sketch of the image.
Label Dubrovnik’s harbour, marina and fort.b Describe the site of Dubrovnik.
Activities
5.6.5 A ground-level photo, Flinders Ranges, South Australia
5.6.6 A sketch of Figure 5.6.5
Skills builder
Photo sketchingBeing able to sketch from photographs allows you to make a quick summary of the information shown in an image. It also enables you to highlight and annotate (add notes of) the key elements of the feature or place photographed. Photo sketches can be used to illustrate reports and displays.
Use a soft pencil on blank paper. A photo sketch should not reproduce everything in the photograph. Pick out the main features of the photograph, and sketch in their shape. Include the features you want to highlight. Always place your sketch within a frame that is in the same proportions as the original photograph. Annotate your sketch to point out the main features, or to indicate a changing feature or some important link between features.
For ground-level photographs it may be useful to divide your photograph into three areas: foreground, middle ground and background. Before you begin sketching, lightly pencil these three areas into your frame. The features of each area can then be sketched in. Begin with the background, followed by the middle ground and then the foreground.
Ground-level photo sketches can be annotated or coloured to highlight particular features. You can see both of these techniques in Figure 5.6.6, which is a sketch of Figure 5.6.5.
Sample
page
s