geographic priorities for research and development on dryland cereals and legumes (dcl)
TRANSCRIPT

Geographic priorities for research and development on
dryland cereals and legumes (DCL)
Glenn Hyman1, Elizabeth Barona2, Chandrashekhar Biradar3, Edward Guevara1, John Dixon4,
Steve Beebe1, Silvia Elena Castano1, Tunrayo Alabi5, Murali Krishna Gumma6, Shoba
Sivasankar6, Ovidio Rivera1, Herlin Espinosa1, Jorge Cardona1
1International Center for Tropical Agriculture (CIAT), Cali, Colombia2Independent Researcher, Miami, USA3International Center for Agricultural Research in the Dry Areas (ICARDA), Amman, Jordan4Australian Centre for International Agricultural Research, Canberra, Australia5International Institute of Tropical Agriculture (IITA), Ibadan, Nigeria6International Crops Research Institute for the Semi-Arid Tropics (ICRISAT), Patancheru, India
eAtlasDCL.cgiar.org

2
Introduction
• Maps, geography and spatial analysis are increasingly important for developing R&D programs, priority setting, monitoring, impacts assessment and reporting.
• But the community of researchers working on this topics has perhaps been less organized to carry out this type of work.
• This initiative propose to develop an online Atlas for R&D among the DCL community with focus on Geo-spatial Science, Technology and Applications (GeSTA).

3
The DCL eAtlas www.eatlasdcl.cgiar.org

4
The DCL eAtlas www.eatlasdcl.cgiar.org
5
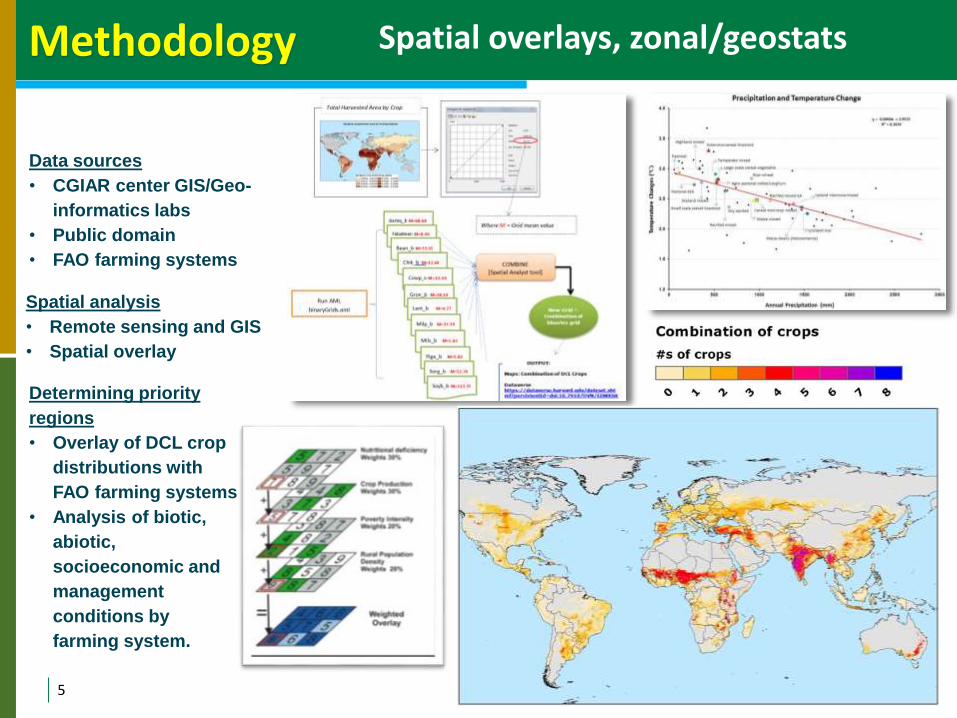
Methodology
Data sources
• CGIAR center GIS/Geo-
informatics labs
• Public domain
• FAO farming systems
Spatial analysis
• Remote sensing and GIS
• Spatial overlay
Determining priority
regions
• Overlay of DCL crop
distributions with
FAO farming systems
• Analysis of biotic,
abiotic,
socioeconomic and
management
conditions by
farming system.
Spatial overlays, zonal/geostats

6
Scripts, documentation and data all available online and cloud
Methodology

ResultsMajor drylands farming systems and crop and regional dominance

Results
• Three farming systems in South Asia – rainfed mixed, rice-wheat and dry rainfed – make up about one third of the 162 million ha of DCL crops in the 18 priority farming systems
• A second important region is Sub-Saharan Africa, where the cereal-root crop mixed system accounts for 21.3 million ha, the agro-pastoral millet sorghum system accounts for 18.6 million ha, the pastoral system accounts for 10.8 million ha and the maize mixed system has 7.6 million ha
• In Eastern Europe and Central Asia more than 15 million ha are cultivated, with barley figuring prominently.
• In East Asia over 22 million ha are cultivated, with groundnut and soybean as the predominant crops.
Major drylands farming systems and crop and regional dominance

9
The farming systems where dryland cereals and grain legumes are concentrated are particularly prone to high temperatures and drought and crop stress.
ResultsAbiotic and biotic stressclimate change and extreme events

These dryland systems, especially those with less than 1000 mm of annual precipitation, tend to have a higher probability of drought or a failed season, when precipitation does not meet crop requirements.
There is a general tendency of the drier farming systems having higher expectedtemperature changes between now and future climate scenarios (2050) and further decrease in precipitation
ResultsAbiotic and biotic stressclimate change and extreme events
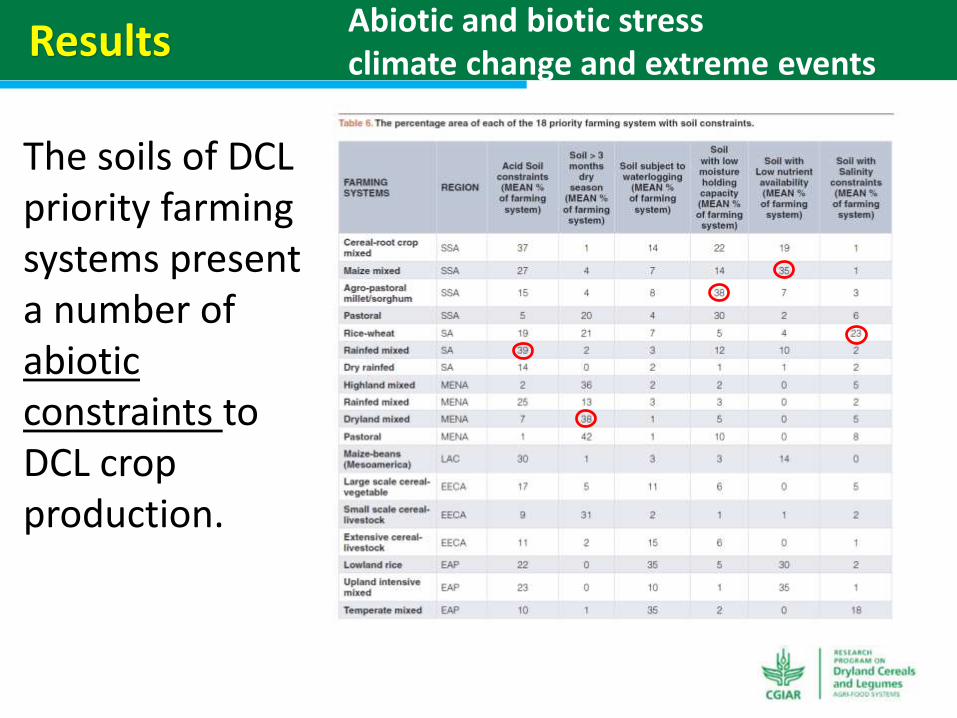
The soils of DCL priority farming systems present a number of abiotic constraints to DCL crop production.
ResultsAbiotic and biotic stressclimate change and extreme events

The key DCL farming systems are home to about one third of the global population, including an enormous number of people living in poverty.
Results Population and poverty
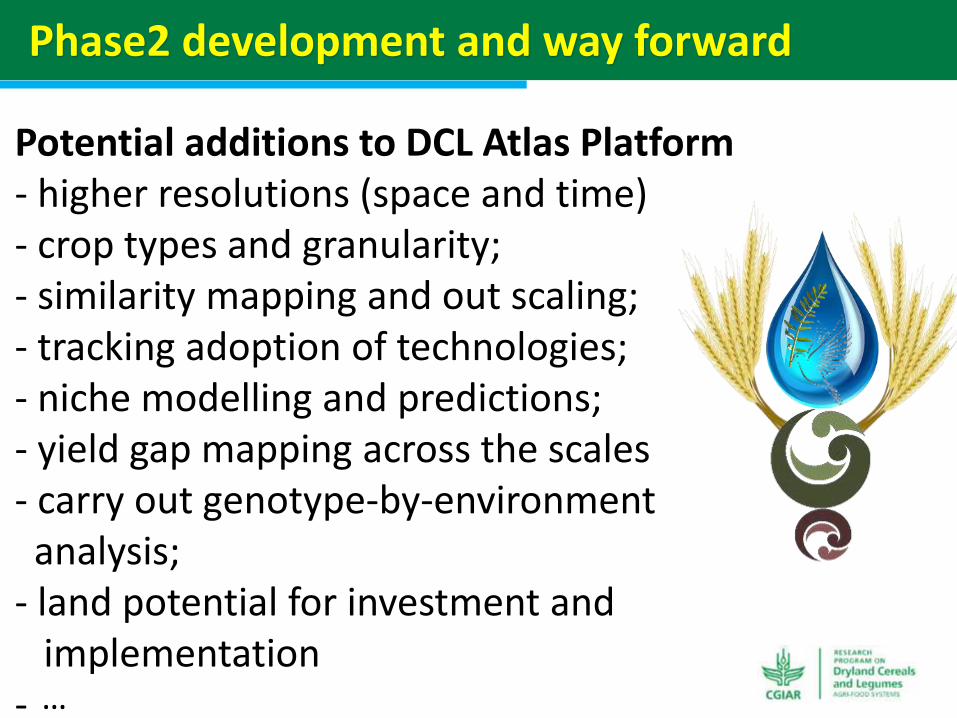
Potential additions to DCL Atlas Platform- higher resolutions (space and time)- crop types and granularity;- similarity mapping and out scaling;- tracking adoption of technologies; - niche modelling and predictions; - yield gap mapping across the scales- carry out genotype-by-environment
analysis; - land potential for investment and
implementation-
Phase2 development and way forward
…
14
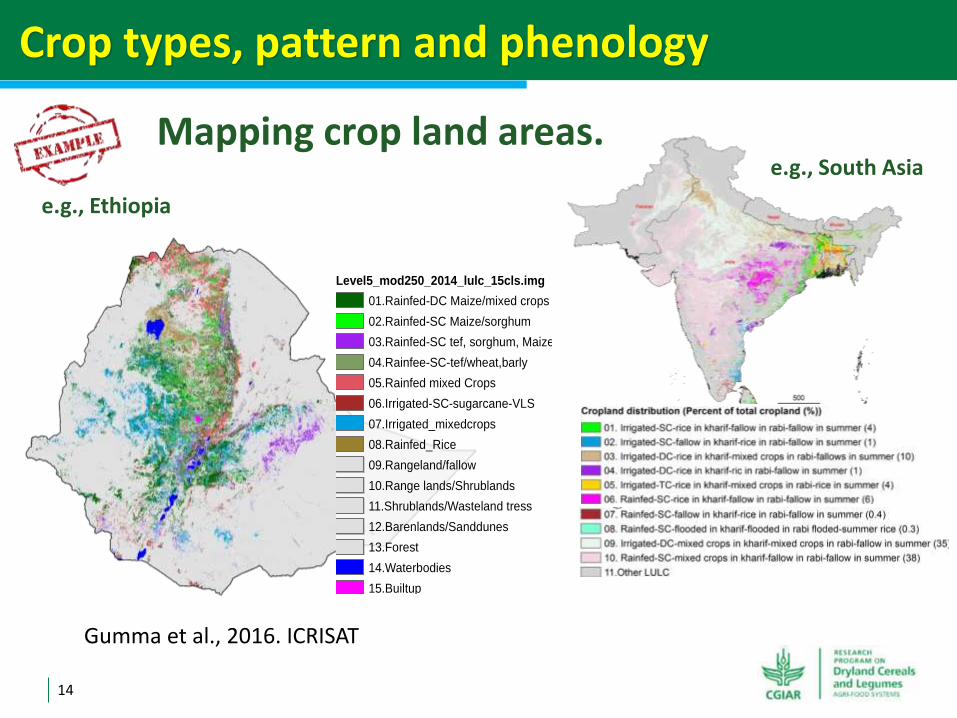
Level5_mod250_2014_lulc_15cls.img
01.Rainfed-DC Maize/mixed crops
02.Rainfed-SC Maize/sorghum
03.Rainfed-SC tef, sorghum, Maize
04.Rainfee-SC-tef/wheat,barly
05.Rainfed mixed Crops
06.Irrigated-SC-sugarcane-VLS
07.Irrigated_mixedcrops
08.Rainfed_Rice
09.Rangeland/fallow
10.Range lands/Shrublands
11.Shrublands/Wasteland tress
12.Barenlands/Sanddunes
13.Forest
14.Waterbodies
15.Builtup
Mapping crop land areas. e.g., South Asia
e.g., Ethiopia
Gumma et al., 2016. ICRISAT
Crop types, pattern and phenology

Tracking of technological adoption
Adoption of water harvesting structures, in Andra Pradesh
Ahmed, I. et al., 2016. ICRISAT
Biradar, et al., 2015. ICARDA
Adoption of conservation agriculture (zero tillage) in Morocco

16
Adoption of Chickpea
DistrictsArea (ha)
MODIS-2000 MODIS-2005 Modis-2012Anantapur 34777 51304 84493Cuddapah 30343 69258 117903Kurnool 68113 140511 196793Prakasam 35129 128288 159524
168362 389361 558713
Links image analysis to field surveys
Gumma et al., 2016. ICRISAT
Tracking of technological adoption
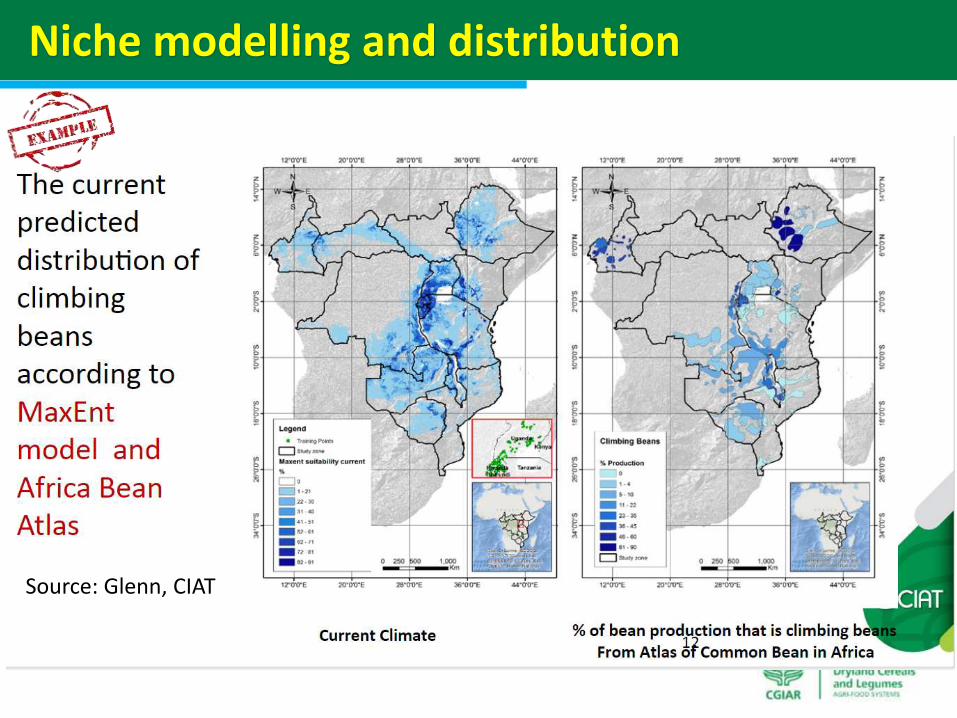
Source: Glenn, CIAT
Niche modelling and distribution

18
Near real-time farm analytics at pixel to landscape scales
March December
National>State>District>Tehsil>Block>Village>Farm>Polygon/Point/Pixel
Cropping SystemCrop IntensityCrop CalendarCrop RotationCropped AreaFallow Dynamics-Fallow area-Duration-Start date-End dateYield Potential-Current -Achievable Suitable Crop/Variety-Legumes-Oil SeedsSoils Soil Health (SHC)Soil Moisture (SMAP)Water useEvapotranspirationAllocation/Irri. Sch.Markets-ePlatform-Ag Supply Chain-Access (I/O)Monitoring-Pest/Diseases-Crop StressCitizen Science
Crop Intensification & Diversification

10%
26%
20%
15%
10%
7%
5%6%
1%
0.0
0.5
1.0
1.5
2.0
2.5
3.0
3.5
4.0
4.5
5.0
<0.5 0.5-1 1-1.5 1.5-2 2- 2.5 2.5-3 3.5-4 4.5-5 >5
Are
a (m
ha)
Mill
ion
s
Grain Yield (kg/ha, '1000)
Agricultural Productivity, Production and Dynamics
Biradar, et al., 2016

10%
26%
20%
15%
10%
7%
5%6%
1%
0.0
0.5
1.0
1.5
2.0
2.5
3.0
3.5
4.0
4.5
5.0
<0.5 0.5-1 1-1.5 1.5-2 2- 2.5 2.5-3 3.5-4 4.5-5 >5
Are
a (m
ha)
Mill
ion
s
Grain Yield (kg/ha, '1000)
5%
10%
15%
20%
25%
12%
6%4%
3%
0.0
0.5
1.0
1.5
2.0
2.5
3.0
3.5
4.0
4.5
5.0
<0.5 0.5-1 1-1.5 1.5-2 2- 2.5 2.5-3 3.5-4 4.5-5 >5
Are
a (m
ha)
Mill
ion
s
Grain Yield (kg/ha, '1000)
1%
6%5%
7%
10%
15%
20%
26%
10%
0.0
0.5
1.0
1.5
2.0
2.5
3.0
3.5
4.0
4.5
5.0
<0.5 0.5-1 1-1.5 1.5-2 2- 2.5 2.5-3 3.5-4 4.5-5 >5
Are
a (m
ha)
Mill
ion
s
Grain Yield (kg/ha, '1000)
10%
15%
20%
26%
10%
7%
5%6%
1%
0.0
0.5
1.0
1.5
2.0
2.5
3.0
3.5
4.0
4.5
5.0
<0.5 0.5-1 1-1.5 1.5-2 2- 2.5 2.5-3 3.5-4 4.5-5 >5
Are
a (m
ha)
Mill
ion
s
Grain Yield (kg/ha, '1000)
Current: 0% Gain32 m tons
S-2 : 5% Gain35 m tons
S-1 : 72% Gain61 m tons
S-3 : 18% Gain40 m tons
Location specific Investment, Interventions and Impacts
S=Scenarios
Biradar, et al., 2016*

21
Thank [email protected]
avoid the unmanageable and manage the unavoidable
-IPCC Confronting Climate Change:
in an inch of land and bunch of crop