geographic information systems: usability, perception, and
TRANSCRIPT
Geographic Information Systems: Usability, Perception, and Preferences of Public Health Professionals
Online Journal of Public Health Informatics * ISSN 1947-2579 * http://ojphi.org * 9(2):e191, 2017
OJPHI
Geographic Information Systems: Usability, Perception, and Preferences of Public Health Professionals
Awatef A. Ben Ramadan, MD, MPH, PhD1,2,3*, Jeannette Jackson-Thompson, MSPH, PhD1,2,3, Suzanne A. Boren, MHA, PhD2,3
1. University of Missouri-Columbia (MU): Missouri Cancer Registry and Research Center (MCR-ARC)
2. University of Missouri-Columbia (MU): School of Medicine, Department of Health Management and Informatics (HMI)
3. University of Missouri-Columbia (MU): MU Informatics Institute (MUII)
*Awatef Ahmed Ben Ramadan, MD, MPH, PhD, [email protected]
d
Abstract
Background: Analyzing and visualizing health-related databases using Geographic Information Systems (GISs) becomes essential in controlling many public health problems.
Objectives: To explore the perception and preferences of public health professionals (PHPs) about the usability of GISs in public health field
Methods: For this scoping review, the investigators searched Medline Ovid, PubMed, IEEE, Scopus, and GeoBase databases. A total of 105 articles were identified. Nine articles met the inclusion criteria.
Results: Iterative evaluations, training, and involvement of GIS end users are productive in GIS usability. More methodologies are needed to support the validity of GIS usability studies. The exchange of GIS technology impacts public health policy and research positively.
Discussion: PHPs are aware of the use of GISs in the public health field, and the exchange of visualized health data in determining inequalities and inaccessibility issues.
Conclusion: GISs are essential to control public health problems, if the related health datasets are analyzed carefully and if the mapping reports are extensively evaluated and interpreted.
Keywords: Geographic Information Systems, GIS, Public Health, Usability
Geographic Information Systems: Usability, Perception, and Preferences of Public Health Professionals
Online Journal of Public Health Informatics * ISSN 1947-2579 * http://ojphi.org * 9(2):e191, 2017
OJPHI
Introduction
Public health work requires collaboration and effective communication between team members
[1]. Therefore, the Geographic Information System (GIS) tools should be designed to meet the
needs and perspectives of the team members. The problem today is not in creating new GISs, but
in effective and efficient use of the existing ones [2,3].
Analyzing and visualizing health-related databases, using sophisticated statistical software, is
essential in helping control many public health problems in any community. This data should be
handled carefully, analyzed adequately to get reliable results, and not mislead the target audiences
[4].
Most of the potential users of the health-related spatial data find difficulties in interpreting
statistical and mapping information of most health-related spatial reports [5-7]. The major issues
are lack of experience and training to use this technology, lack of acceptance to use GIS tools, and
complicated design of most existing GIS technologies [8]. Providing the potential users of GIS
software with clear explanations on the statistical methodology and results and analogies of the
combined diagrams and maps will enhance the users’ understanding and motivate them to use this
technology [9]. Mapped public health data can create knowledge, produce evidence, and generate
policies [10]. Every mapping report should carry a specific purpose and carry a clear message to
the audience [11]. Targeting the public health professionals (PHPs) and policy makers, the
mapping reports should include citations of the used databases’ sources and the methodology of
the results. In order to make it user friendly, the usability of the GIS tools and reports should be
iteratively pilot tested by potential users before and after tools’ release [4].
Current literature proves the collaboration between the professionals of the same public health
interest by linking health information from different sources and designing portals and applications
[12]. This will help guide PHPs and policy makers to develop cost-effective public health
interventions [12]. Over the last 20 years, spatial health data are transformed from being static to
being interactive and dynamic [13].
GIS tools could help communication between experts in different fields. The GIS developers and
users should consider technical, social, and cultural issues during development, evaluations, and
updates of the GISs tools to enhance the experts’ connection [14]. The investigators of the current
Correspondence: Awatef Ahmed Ben Ramadan, MD, MPH, PhD, [email protected]
DOI: 10.5210/ojphi.v9i2.7437
Copyright ©2017 the author(s) This is an Open Access article. Authors own copyright of their articles appearing in the Online Journal of Public Health Informatics. Readers may copy articles without permission of the copyright owner(s), as long as the author and OJPHI are acknowledged in the copy and the copy is used for educational, not-for-profit purposes
Geographic Information Systems: Usability, Perception, and Preferences of Public Health Professionals
Online Journal of Public Health Informatics * ISSN 1947-2579 * http://ojphi.org * 9(2):e191, 2017
OJPHI
scoping review could not find previous literature reviews adopting the same aim, including all of
this review’s inclusion criteria (see methods section), covering exactly the time limits of this
review, and/or using the same searching strategies and similar keyword terms used in the current
review.
The current scoping review’s aim is to explore the perceptions and preferences of public health
practitioners and policy makers about the use of GISs in public health practice, and to search the
literature about the usability and utility of GISs in public health fields.
Methods
Study Design and Search Strategy
The study design was a scoping review research. The investigators initially searched for eligible
journal articles in the following databases: Medline Ovid and PubMed databases. The following
terms were searched using Medline Ovid: 1) Geographic Information System (GIS) OR GIS OR
mapping software, AND 2) public health OR public health practitioners, AND 3) usability OR
functionality OR utility OR perception OR preferences. The search resulted in two articles. The
PubMed was searched with the same strategy and did not produce any results. The investigators
tried to search the same terms differently using PubMed database. By using the strategy:
Geographic Information Systems AND public health AND perception AND GIS, our search
results produced 35 articles, including just one article which is strongly related to the current study
aim. The article’s title was “Interactive map communication: pilot study of the visual perceptions
and preferences of public health practitioners” [15]. The investigators searched the article’s
references and the article’s similar articles which were listed on the right side of the article’s
abstract PubMed page. From both the Medline Ovid and the unique PubMed strategy, we identified
a total of 103 articles.
The investigators searched the Institute of Electrical and Electronics Engineers (IEEE)® Xplore
database using the same terms and the search produced two articles. The Scopus and the GeoBase
databases also were searched using the same terms without producing any related articles.
The collected 105 articles were screened by reading their abstracts and 48 articles were excluded
because their objectives did not meet the review’s aim. The investigators assessed the eligibility
of the selected 57 strongly related articles by reading the articles’ full text. At the end, nine articles
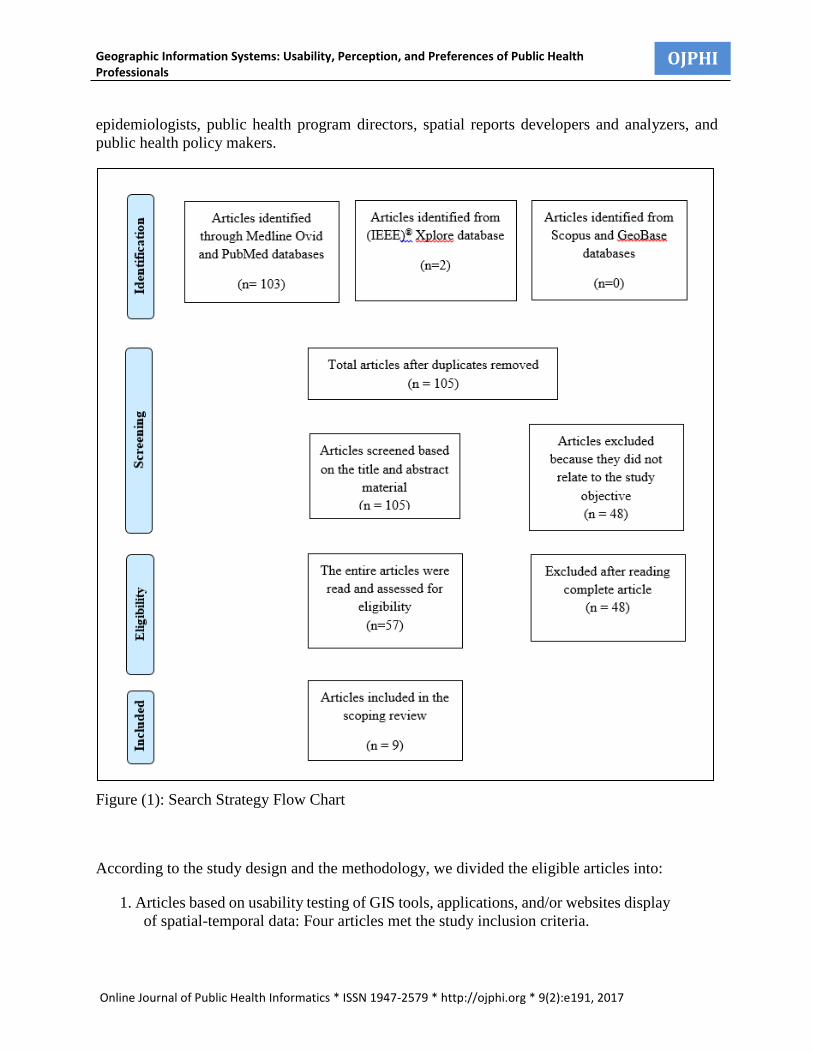
met the review’s inclusion criteria (Figure 1).
Inclusion Criteria
Eligible articles for this review were written in English, published in the years from 2000 to 2016,
and included usability interviews or usability testing of public health professionals (PHPs) and/or
decision- or policy-makers. In the usability testing literature, the studies test the usability of: GISs,
mapping atlases, mapping applications, or spatial or spatial-temporal websites and/or portals.
These mentioned tools should display spatial or spatial-temporal public health data. In the usability
studies, the inclusion criteria for the users were public health practitioners or professionals,
Geographic Information Systems: Usability, Perception, and Preferences of Public Health Professionals
Online Journal of Public Health Informatics * ISSN 1947-2579 * http://ojphi.org * 9(2):e191, 2017
OJPHI
epidemiologists, public health program directors, spatial reports developers and analyzers, and
public health policy makers.
Figure (1): Search Strategy Flow Chart
According to the study design and the methodology, we divided the eligible articles into:
1. Articles based on usability testing of GIS tools, applications, and/or websites display
of spatial-temporal data: Four articles met the study inclusion criteria.
Geographic Information Systems: Usability, Perception, and Preferences of Public Health Professionals
Online Journal of Public Health Informatics * ISSN 1947-2579 * http://ojphi.org * 9(2):e191, 2017
OJPHI
2. Articles based on interviewing PHPs and policy-makers to find out their GISs’
perspectives and preferences in public health field: Five articles met the study
inclusion criteria.
Results
There is variety among the nine eligible articles presented in Table 1 and Table 2. The participants
are different (demographics, experience, work type, and degree of education). Different GIS
software is tested and different research measures are used. See Table 1 and Table 2.
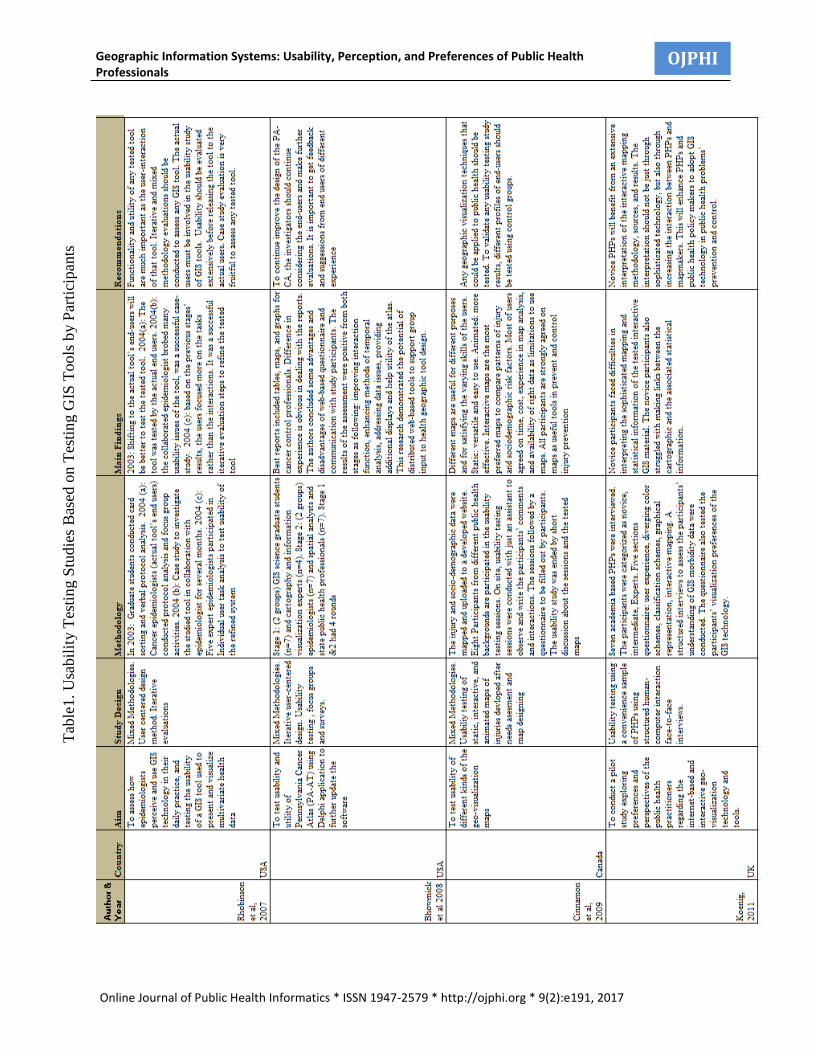
1. Usability Testing Studies:
There are four articles in this category. The important information about the studies was extracted
and presented in Table1.
The first study was conducted by a geography scholar. The study’s objective was to explore how
epidemiologists take advantage of the geo-visualized technology, and how they expect this
information to help them in practice. The study design was usability testing of the Exploratory
Spatial-Temporal Analysis Toolkit (ESTAT) which visualizes multivariate health data to support
cancer epidemiology. The study was user-centered and the researchers conducted iterative
evaluation processes to refine ESTAT.
The study design was multi-staged. In the first stage, graduate students used card sorting and verbal
protocol analysis. After a year, the study investigators shifted to the actual end-users after they had
problems with the tool’s interface. In the second stage, the researchers conducted verbal protocol
analysis on 12 epidemiologists followed by focus group activities to discuss the testing usability
sessions. Verbal protocol is defined as: “A psychological research method that elicits verbal
reports from research participants” [16]. In the third stage, a case study in collaboration with an
academic epidemiologist was conducted to analyze ESTAT. The analysis was a positive addition
to the tool’s design. In the fourth stage, five experts in data analysis tested the refined tool using
verbal protocol analysis followed by focus groups. A scatter plot was the first analytical measure
the epidemiologists used followed by bivariate map tools. The complicated and multivariate tools
of the ESTAT were not used commonly with the users. The most interesting finding of this stage
was that the users did not face a lot of interaction problems, and this indicated improvement in
development and refinement of the tool [17].
Geographic Information Systems: Usability, Perception, and Preferences of Public Health Professionals
Online Journal of Public Health Informatics * ISSN 1947-2579 * http://ojphi.org * 9(2):e191, 2017
OJPHI
Tab
le1. U
sabil
ity T
esti
ng S
tudie
s B
ased
on T
esti
ng G
IS T
ools
by P
arti
cipan
ts
Geographic Information Systems: Usability, Perception, and Preferences of Public Health Professionals
Online Journal of Public Health Informatics * ISSN 1947-2579 * http://ojphi.org * 9(2):e191, 2017
OJPHI
The second study was conducted by scholars from four different specialties and expertise: public
health, geography, clinical medicine, and cancer research. The study objective was to test the
usability and utility of the Pennsylvania Cancer Atlas (PA-CA) to refine the software. The study
design was multi-staged user-centered evaluations of PA-CA usability using web-based
application (Delphi application). In the first stage, the investigators tested the PA-CA using two
groups of users. The first group included seven GIS science graduate students, and the second
group formed from four cartography and information visualization experts. The second stage
included two groups, seven epidemiologists in the first group, and seven spatial analysts and
Pennsylvania state public health professionals in the second group. Every stage of evaluation had
four rounds of testing sessions. The professional participants pointed out that the best spatial
reports included tables, maps, and charts. The responses and the using of the tested spatial reports
were varied by the difference in expertise. Most of the participants stressed the importance of
integrating tutorials and help information for the PA-CA end-users. The results of the evaluation
processes were totally positive. The testers came up with important recommendations on the PA-
CA software: improving user-software interface and motivating new methods of temporal analysis.
The other main finding of the study was the ability to distribute web-based tools to access different
kinds of experts and recruit them to test the design of GIS tools [18].
The third study was conducted by researchers of different scientific backgrounds: geography,
medical school, and public health specialties. The study design was multi-staged. First stage: There
was a user needs assessment, through meetings with public health stakeholders who described
need for injury-related GIS tools and reports. Second and third stages: These combined stages were
named as the map development stage. Three map types were created by the researchers; the maps
were: static, animated, and interactive maps. The created maps displayed the injury data and its
socio-demographic determinants. These maps were uploaded to a developed website. Fourth stage:
The uploaded maps were tested using a sample of public health officials and injury prevention
stakeholders. The usability testing sessions were on-site with an observer to write down the users’
comments and their map-interface. The sessions were followed by a self-filled-out questionnaire
and short discussion per participant. All the participants revealed that all map types are useful for
different purposes. Most of them pointed out that the animated maps are more effective than the
static maps, and the best maps to effectively compare the injury data to its socio-economic
determinants were the interactive maps. Most of the users agreed on the effect of the resources in
terms of time, money, expertise on the map development industry, and the availability of right and
appropriate data to build successful maps [19].
The fourth study was carried out by three scholars from different specialties and educational
institutions: Public health science, environmental and engineering science, and geography science.
The study aims were to conduct a pilot study on a sample of PHPs to explore their comprehensive
and visualization preferences of the interactive online-based mapping reports and to evaluate the
effectiveness of the interactive mapping reports’ formats and measure the actual end-users’
interactions with the tested GIS tools.
The study design was built on a five-section interview questionnaire. The test was on-site, face-
to-face, and a GIS-based interview. The interviews were accompanied with direct observation and
a think-aloud protocol. The participants were asked to examine the tested visualization material,
answer the questions, and write down their preferences, perceptions, and expectations on the tested
Geographic Information Systems: Usability, Perception, and Preferences of Public Health Professionals
Online Journal of Public Health Informatics * ISSN 1947-2579 * http://ojphi.org * 9(2):e191, 2017
OJPHI
material. Seven academic PHPs were assigned, according to their expertise of using disease
visualization maps, based on their answers on a specific question to novice, intermediate, and
expert categories. The interviews included five sections in a well-structured questionnaire: User
experience, diverging color schemes, data classification schemes, graphical representation of
morbidity data, and interactive mapping usability tasks. The novice participants had problems in
exploration of the data classifications, in understanding the supplementary sophisticated statistical
graphics, and in linking the interactive tables with the maps of the tested reports. There were
differences in the perception of the interactive mapping reports among the participants according
to their previous geographic experience [15].
2. Usability Studies Based on Just Interviewing the Participants:
There are five articles under this category. The articles’ methodologies were based on interviewing
PHPs, cartographic scientists, map developers, and/ or public health policy makers. See Table (2).
The first study was conducted as a collaboration of three geography scientists from three different
universities. The aim of the study was to analyze the organizational issues which are important to
successfully implement GISs within the National Health Service (NHS) in the UK and compare
the results to previous studies that were conducted to analyze the same aim. The study design was
mixed-methods, starting with a national questionnaire followed by semi-structured interviews. The
national questionnaire was formed on the current use of GIS software, future plans for GIS use,
policy-related uses of GIS, barriers to using GIS, and enumerates human, environmental, and
organizational barriers to implement GIS. The questionnaire was answered by health services
professionals. An in-depth interview was conducted on 20 selected NHS personnel. The interviews
included the potential issues to establish GIS software: individual issues, policy issues, data issues,
organizational issues, and various resources issues. The national survey revealed an increase of
GIS use, map production and GIS use in analysis, modeling, and data integration are important.
The examples of GIS uses were in: inequalities, accessibility determination, and environmental
sciences. Less than 50% of the interviewees stated they did not fully operate their GISs.
Informational technology administration and maintaining systems are influential for GIS
implementation. Both the survey and the interviewees stated a list of the obstacles to GIS
implementation: lack of digital data, difficult analytical tasks of GIS, lack of staff resources to
operate GIS, lack of GIS skills, lack of maintenance systems, lack of wide organizational planning,
lack of authority’s awareness, insufficient training of the GIS users, lack of central plan and
support from the department of health to its organizations, and lack of awareness among clinicians
and administrators of GIS importance. The respondents were asked about the barriers and issues
which restricted the geographic information exchange. Responses were varied: Licensing
arrangement issues between the organizations, presence of GIS data in specific formats, lack of
interest of GIS exchange in other organizations, and hardware and software incompatibilities
among different organizations [20].
Geographic Information Systems: Usability, Perception, and Preferences of Public Health Professionals
Online Journal of Public Health Informatics * ISSN 1947-2579 * http://ojphi.org * 9(2):e191, 2017
OJPHI
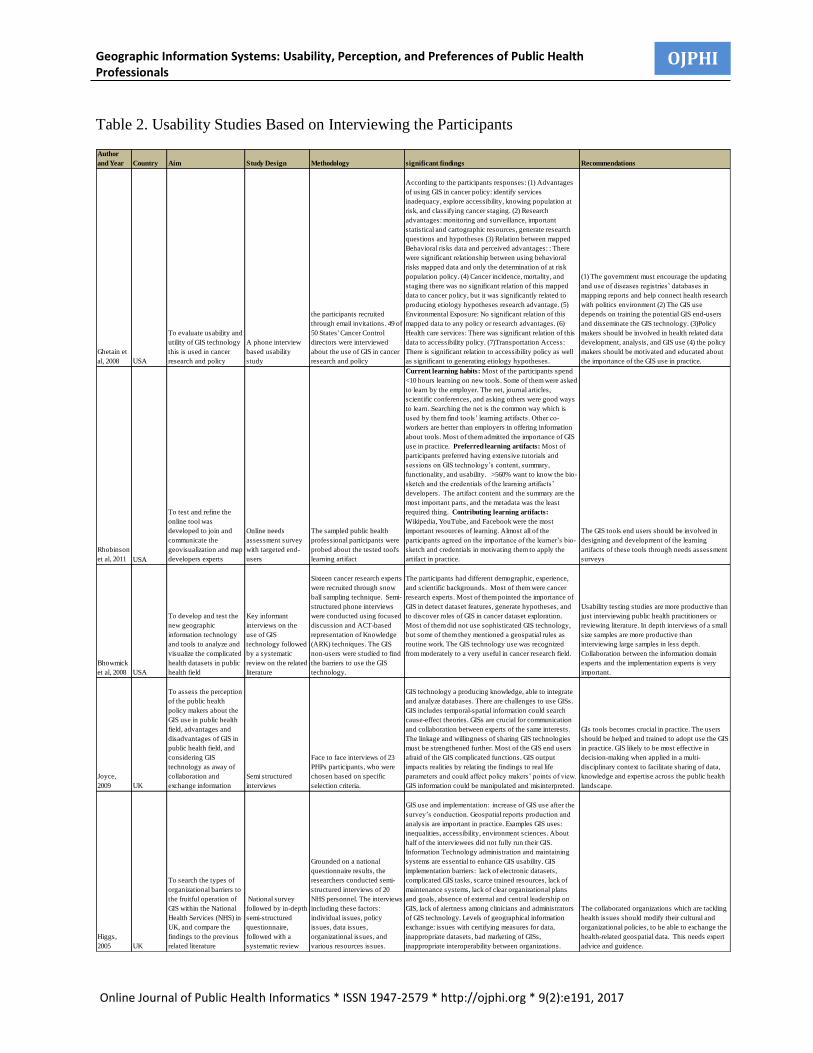
Table 2. Usability Studies Based on Interviewing the Participants
Author
and Year Country Aim Study Design Methodology significant findings Recommendations
Ghetain et
al, 2008 USA
To evaluate usability and
utility of GIS technology
this is used in cancer
research and policy
A phone interview
based usability
study
the participants recruited
through email invitations. 49 of
50 States' Cancer Control
directors were interviewed
about the use of GIS in cancer
research and policy
According to the participants responses: (1) Advantages
of using GIS in cancer policy: identify services
inadequacy, explore accessibility, knowing population at
risk, and classifying cancer staging. (2) Research
advantages: monitoring and surveillance, important
statistical and cartographic resources, generate research
questions and hypotheses (3) Relation between mapped
Behavioral risks data and perceived advantages: : There
were significant relationship between using behavioral
risks mapped data and only the determination of at risk
population policy. (4) Cancer incidence, mortality, and
staging there was no significant relation of this mapped
data to cancer policy, but it was significantly related to
producing etiology hypotheses research advantage. (5)
Environmental Exposure: No significant relation of this
mapped data to any policy or research advantages. (6)
Health care services: There was significant relation of this
data to accessibility policy. (7)Transportation Access:
There is significant relation to accessibility policy as well
as significant to generating etiology hypotheses.
(1) The government must encourage the updating
and use of diseases registries’ databases in
mapping reports and help connect health research
with politics environment (2) The GIS use
depends on training the potential GIS end-users
and disseminate the GIS technology. (3)Policy
makers should be involved in health related data
development, analysis, and GIS use (4) the policy
makers should be motivated and educated about
the importance of the GIS use in practice.
Rhobinson
et al, 2011 USA
To test and refine the
online tool was
developed to join and
communicate the
geovisualization and map
developers experts
Online needs
assessment survey
with targeted end-
users
The sampled public health
professional participants were
probed about the tested tool's
learning artifact
Current learning habits: Most of the participants spend
<10 hours learning on new tools. Some of them were asked
to learn by the employer. The net, journal articles,
scientific conferences, and asking others were good ways
to learn. Searching the net is the common way which is
used by them find tools’ learning artifacts. Other co-
workers are better than employers in offering information
about tools. Most of them admitted the importance of GIS
use in practice. Preferred learning artifacts: Most of
participants preferred having extensive tutorials and
sessions on GIS technology’s content, summary,
functionality, and usability. >560% want to know the bio-
sketch and the credentials of the learning artifacts’
developers. The artifact content and the summary are the
most important parts, and the metadata was the least
required thing. Contributing learning artifacts:
Wikipedia, YouTube, and Facebook were the most
important resources of learning. Almost all of the
participants agreed on the importance of the learner’s bio-
sketch and credentials in motivating them to apply the
artifact in practice.
The GIS tools end users should be involved in
designing and development of the learning
artifacts of these tools through needs assessment
surveys
Bhowmick
et al, 2008 USA
To develop and test the
new geographic
information technology
and tools to analyze and
visualize the complicated
health datasets in public
health field
Key informant
interviews on the
use of GIS
technology followed
by a systematic
review on the related
literature
Sixteen cancer research experts
were recruited through snow
ball sampling technique. Semi-
structured phone interviews
were conducted using focused
discussion and ACT-based
representation of Knowledge
(ARK) techniques. The GIS
non-users were studied to find
the barriers to use the GIS
technology.
The participants had different demographic, experience,
and scientific backgrounds. Most of them were cancer
research experts. Most of them pointed the importance of
GIS in detect dataset features, generate hypotheses, and
to discover roles of GIS in cancer dataset exploration.
Most of them did not use sophisticated GIS technology,
but some of them they mentioned a geospatial rules as
routine work. The GIS technology use was recognized
from moderately to a very useful in cancer research field.
Usability testing studies are more productive than
just interviewing public health practitioners or
reviewing literature. In depth interviews of a small
size samples are more productive than
interviewing large samples in less depth.
Collaboration between the information domain
experts and the implementation experts is very
important.
Joyce,
2009 UK
To assess the perception
of the public health
policy makers about the
GIS use in public health
field, advantages and
disadvantages of GIS in
public health field, and
considering GIS
technology as away of
collaboration and
exchange information
Semi structured
interviews
Face to face interviews of 23
PHPs participants, who were
chosen based on specific
selection criteria.
GIS technology a producing knowledge, able to integrate
and analyze databases. There are challenges to use GISs.
GIS includes temporal-spatial information could search
cause-effect theories. GISs are crucial for communication
and collaboration between experts of the same interests.
The linkage and willingness of sharing GIS technologies
must be strengthened further. Most of the GIS end users
afraid of the GIS complicated functions. GIS output
impacts realities by relating the findings to real life
parameters and could affect policy makers’ points of view.
GIS information could be manipulated and misinterpreted.
GIs tools becomes crucial in practice. The users
should be helped and trained to adopt use the GIS
in practice. GIS likely to be most effective in
decision-making when applied in a multi-
disciplinary context to facilitate sharing of data,
knowledge and expertise across the public health
landscape.
Higgs,
2005 UK
To search the types of
organizational barriers to
the fruitful operation of
GIS within the National
Health Services (NHS) in
UK, and compare the
findings to the previous
related literature
National survey
followed by in-depth
semi-structured
questionnaire,
followed with a
systematic review
Grounded on a national
questionnaire results, the
researchers conducted semi-
structured interviews of 20
NHS personnel. The interviews
including these factors:
individual issues, policy
issues, data issues,
organizational issues, and
various resources issues.
GIS use and implementation: increase of GIS use after the
survey’s conduction. Geospatial reports production and
analysis are important in practice. Examples GIS uses:
inequalities, accessibility, environment sciences. About
half of the interviewees did not fully run their GIS.
Information Technology administration and maintaining
systems are essential to enhance GIS usability. GIS
implementation barriers: lack of electronic datasets,
complicated GIS tasks, scarce trained resources, lack of
maintenance systems, lack of clear organizational plans
and goals, absence of external and central leadership on
GIS, lack of alertness among clinicians and administrators
of GIS technology. Levels of geographical information
exchange: issues with certifying measures for data,
inappropriate datasets, bad marketing of GISs,
inappropriate interoperability between organizations.
The collaborated organizations which are tackling
health issues should modify their cultural and
organizational policies, to be able to exchange the
health-related geospatial data. This needs expert
advice and guidence.
Geographic Information Systems: Usability, Perception, and Preferences of Public Health Professionals
Online Journal of Public Health Informatics * ISSN 1947-2579 * http://ojphi.org * 9(2):e191, 2017
OJPHI
The second study was conducted by three communication and art scientists and a public health
scientist. The aim of the study was to evaluate the use and the utility of GIS tools in mapping
cancer-related data and their effect on cancer control policies and practice, and to measure the
participants’ perception on using such tools in the Comprehensive Cancer Control (CCC) program.
The researchers recruited participants through email. Forty-nine U.S. CCC program directors out
of 50 states were interviewed by phone. The interview questions were to explore the relationship
of GIS reports to public health policy and research. The identified advantages of using GIS on
cancer policy were: Identify service gap, identify access issues, identify cancer staging, followed
by identify risk population. The identified advantages of using GIS on cancer research were:
Multivariate modeling tool, monitoring and surveillance, followed by generate etiologic
hypotheses. There was no significant relationship discovered between using behavioral risks
mapped reports and research, while there was a significant relationship between behavioral risks
mapping data and the policy of identifying the at risk population. The study did not discover any
significant relationship of cancer burden mapped reports and cancer control policy, but there was
a significant relationship of this kind of mapped reports and the generating etiology hypotheses
research advantage. About 51% of the interviewed directors stated that the demographics are an
important content of any mapped reports, but the study researchers could not find any significant
relation of the demographics to any of the policy and research advantages. There was significant
relation of mapped reports of transportation access and the accessibility policy, and the etiology
hypotheses research advantages. There were no significant relations between policy and research,
and all of these kinds of cancer mapped contents: Environmental exposure, multi-layer content
maps, and healthcare services [21].
The third study was conducted by scientists from geography, environmental science, and public
health fields. The aim of the study was to develop and evaluate the tools and methods that might
be used by PHPs in order to extract knowledge and evidence from health-related databases. The
methodology of the study was semi-structured phone interviews with 16 participants who were
recruited using snowball sampling. The investigators searched the literature of using GIS in cancer
research to support the interviews’ results. Most of the participants were faculty or senior
administrators of different demographic and scientific backgrounds. They varied in experience.
Most of the participants were involved in the cancer research domain. Most of the participants
pointed out that the typical goals of data exploration were to detect dataset aspects, to develop
hypotheses for further cancer research, and to discover roles of geospatial methods in the
exploration process. Most of them did not use complex spatial analysis, but 30% of them reported
geo-coding, map creation, and GIS data analysis as regular research activities. GIS analyses were
considered from moderate to very useful tools in cancer research, specifically in incidence and
mortality cancer data. They pointed to the importance of GIS in comparing spatial data of different
cancer types, disease clustering, correlation with related spatial indicators, and combining
geospatial data from different domains. The participants pointed to the following limitations in
GIS use: Difficulties in geo-coding and data aggregation, lack of support for merging data from
different data sources and/or constructed with different GIS tools, complexity of GIS tools use and
functionalities [22].
The aim of the study described in the fourth article was to study public health professionals’
perceiving of the GIS in practice and research and understand the impact of GIS on data sharing
and communication. The methodology was face-to-face semi-structured interviews with 23
Geographic Information Systems: Usability, Perception, and Preferences of Public Health Professionals
Online Journal of Public Health Informatics * ISSN 1947-2579 * http://ojphi.org * 9(2):e191, 2017
OJPHI
participants who were policy decision makers. The participants were recruited purposefully. The
article findings are: GISs are converting raw data to useful data and knowledge. GIS has the ability
to integrate and analyze datasets. GISs are important in public health practice and decision making
but include many implementation and usability challenges. GIS could be used to explore cause-
effect relationship by including time and space and have epidemiological power. GISs are crucial
for collaboration between experts of the same interests but there are challenges to that. The linkage
and willingness of sharing GIS technologies must be strengthened further. Most of the low
experiences in GIS use of public health practitioners are fear of the sophisticated functions of the
GIS tools. GIS output impacts realities and could affect policy makers’ decisions. Some
participants pointed out that GIS tools are not neutral and map makers might manipulate datasets
using GIS power. Metadata and detailed text are very important to interpret the GIS data. Data
quality is very important as well as strict standards during constructing GIS data. GIS tools are
considered user-friendly and easier to relate data tools. Time and resource constraints, training
skills, and intra-organization environments enhance feelings of insecurity and concern among
potential GIS end-users [23].
The last article’s aim was to conduct a needs-assessment survey on the potential end users of the
Geo-visual Explication (G-EX) portal, which is an online tool designed to connect researchers in
geo-visualization to the end users, to refine the G-XL Learn module. The researchers developed a
web-based survey using their previous in-depth usability studies. The participants were recruited
by sending emails. There were 21 participants from different backgrounds: Epidemiologists, health
policy specialists, geographers, and research scientists. The results were as follows: Most of the
participants spend less than ten hours per week learning new tools and 20% of them were required
by their employers to keep learning these tools. The ways of learning about new tools were: the
internet, journal articles, conference sessions, and asking colleagues. The least likely ways
participants learned about these tools were advertisements and employer contribution. The
participants’ preferred learning artifacts were comprehensive tutorials followed by hands-on
training. Most of the participants wanted the artifacts to include expected training duration and
summary of learning objects, and they preferred to start using the software before starting the
training. 63% of the participants liked to know the biography of the trainers. Most of the
participants spotted that the artifact’s content, summary, and the instructions are the most
important parts of any learning module. The other contributing artifacts for the participants were:
Wikipedia, YouTube, and social media, respectively. Fifty two of the participants were interested
in development of training material to share with others on the G-EX website [24].
Discussion
The findings of the reviewed articles are discussed separately as they were classified in the
methods and the results sections.
1. Usability Testing Studies
It is important to include a representative sample of the actual users in any usability testing of GIS
tools. A five-participant study can demonstrate most of the usability problems of the tested material
[25]. This enables the investigators to measure the actual user-tool interface and helps them
successfully design, implement, and refine these tested tools. All the studied usability testing
Geographic Information Systems: Usability, Perception, and Preferences of Public Health Professionals
Online Journal of Public Health Informatics * ISSN 1947-2579 * http://ojphi.org * 9(2):e191, 2017
OJPHI
articles used the actual users to test the GIS systems. The review also revealed that the usability
testing research should extend to explore the content, functionality, and utility of the GIS tools.
The review stated that any GIS tool should be iteratively evaluated using different methodologies.
The review discovered that case studies by collaboration with experts were very valuable in
development and refinement of GIS tools. The review concluded that visualizing the health-related
data in an interactive way, including tables, maps and graphs, is considered the best way to present
such information. The review revealed the importance of the development of online applications
to access more potential users and help them participate in testing the GIS tools. The review stated
that building successful mapping reports depends on the availability of monetary support, right
data, and expertise in map construction. The review pointed out that the level of experience in
using data visualization is critical for being willing to use GIS software and interpretation and
linking of the mapping reports’ information.
2. Usability Studies Based on Just Interviewing the Participants
The review revealed that even to assess the PHPs’ preferences and perspectives the researchers do
not have to rely on just interviewing the participants, but they need to search for more methodology
to support the validity of their results. In some of our reviewed articles, researchers supplemented
their interviews with the results of well-respected national questionnaires and some did systematic
reviews to support the study evidence and generalizability.
Health organizations should assess and overcome the organizational, cultural, technical, and
expertise barriers to implement and use GIS software to visualize their data. One of our reviewed
articles recommended the adoption of policies that support visualization of health-related data on
the state level and valued the importance of state encouragement of utilization and presentation of
disease registries on geographic bases to connect health research to the political environment. All
the reviewed articles pointed to the importance of dissemination of successful GIS technology,
training the potential users adequately and giving up-to-date information technology
administration support and maintenance. Most of the reviewed articles recommended involvement
of policy makers in using GIS tools and in analysis of the GIS tools results. The review
recommended collaboration between GIS software developers and implementers and potential
end-users to develop new, and test refined, versions of public health GIS tools.
The review articles in this section revealed that needs assessment is crucial to know the
perspectives of the GIS potential users and to develop web learning portals and modules. The
review suggested that the learning artifacts of GISs tools could be presented in different formats
based on users’ preferences. The review recommended that employers offer extensive training for
their GIS potential users before and after implementation of the GIS tools.
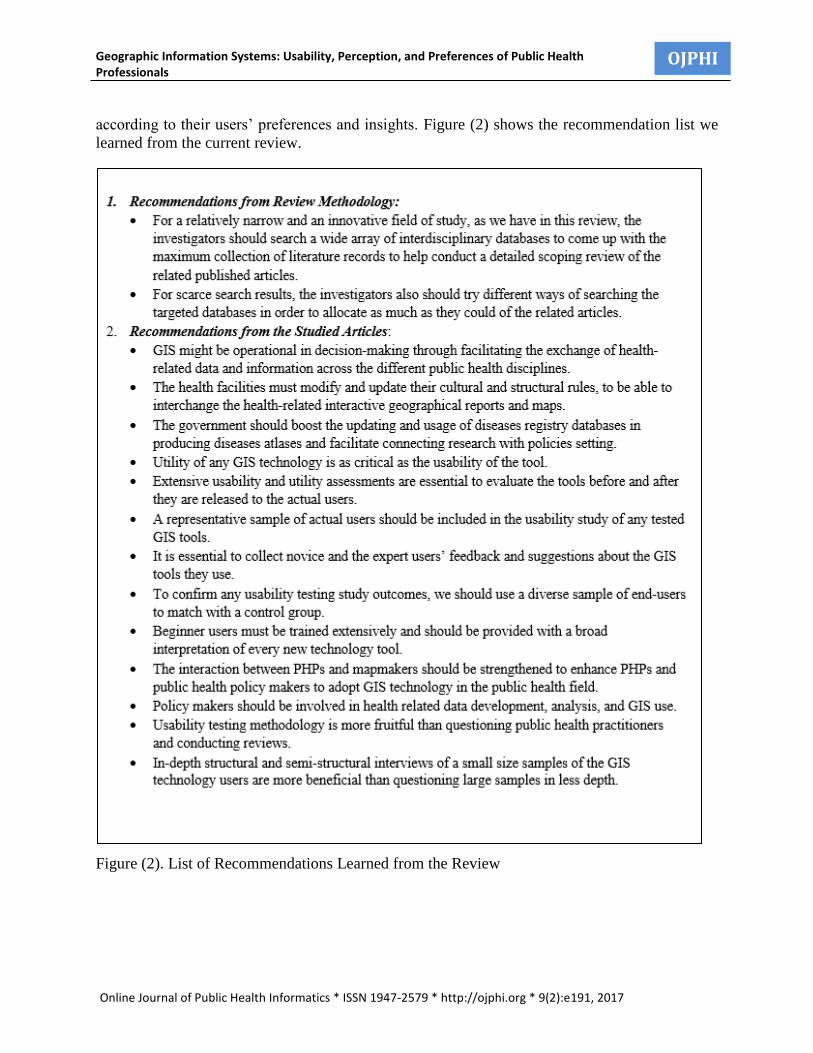
3. List of Recommendations Learned from the Review
The review’s investigators constructed a list of recommendations they learned from conducting
the review. This list could help other researchers conducting similar reviews. It also might help
public health practitioners to decide on the type of information and the way they should visualize
the health-related data to satisfy potential users. The list might help the GIS technology designers,
builders, and vendors to develop a user-friendly technology by tailoring the developed technology
Geographic Information Systems: Usability, Perception, and Preferences of Public Health Professionals
Online Journal of Public Health Informatics * ISSN 1947-2579 * http://ojphi.org * 9(2):e191, 2017
OJPHI
according to their users’ preferences and insights. Figure (2) shows the recommendation list we
learned from the current review.
Figure (2). List of Recommendations Learned from the Review
Geographic Information Systems: Usability, Perception, and Preferences of Public Health Professionals
Online Journal of Public Health Informatics * ISSN 1947-2579 * http://ojphi.org * 9(2):e191, 2017
OJPHI
Conclusion
In general, the review revealed that PHPs are aware of the importance of using GIS software on
public health policy and research. In most of the studies, participants pointed to the advantages of
using GISs on public health practice to determine inequalities and accessibility. They also stated
the importance of supplementary roles of other contextual indicators on different public health
problems when these indicators are visualized with the health-related data.
Most of the studies revealed the participants were aware of the collaboration and the exchange of
the GISs technology and data between experts in the public health field, and the importance of
including the end users in the basic stages of design and development of GIS tools. The participants
were also aware of the importance of extensive evaluations for GIS tools before and after releasing
them and the essential need for training the potential users of these GIS tools.
Review Strengths, Limitations and Future Directions
Due to the innovative review’s purpose, the review’s authors targeted specific databases which
could produce a maximum number of scientific-based articles to match the current review’s aim.
This is a considerable strength for this study. To get a detailed and updated scope of the searched
literature, the investigators used strict inclusion criteria and used the literature published in a
limited period of time. The investigators wanted to produce an in-depth analysis of an innovative
field of study and help future researchers comprehend GIS use in public health and the ideal way
of conducting usability studies to assess this technology. Future usability testing studies must
include more potential end users who must be recruited randomly and tested using more
sophisticated methodology, as well as quantitative and qualitative measures.
References
1. Sicotte C, D’Amour D, Mordaunt MP. 2002. Interdisciplinary collaboration within Quebec
community health care centres. Soc Sci Med. 55(6), 991-1003. PubMed
https://doi.org/10.1016/S0277-9536(01)00232-5
2. Brooks Jr FP. The Mythical Man-Month: Essays on Software Engineering, Anniversary
Edition, 2/E. Pearson Education India; 1995 Sep 1.
3. Young RR. Effective requirements practices. Addison-Wesley Longman Publishing Co., Inc.;
2001 Mar 1.
4. Bell BS, Hoskins RE, Pickle LW, Wartenberg D. 2006. Current practices in spatial analysis of
cancer data: mapping health statistics to inform policymakers and the public. Int J Health Geogr. 5(1),
49. PubMed https://doi.org/10.1186/1476-072X-5-49
5. Lipkus IM, Samsa G, Rimer BK. 2001. General performance on a numeracy scale among highly
educated samples. Med Decis Making. 21(1), 37-44. PubMed
https://doi.org/10.1177/0272989X0102100105
Geographic Information Systems: Usability, Perception, and Preferences of Public Health Professionals
Online Journal of Public Health Informatics * ISSN 1947-2579 * http://ojphi.org * 9(2):e191, 2017
OJPHI
6. Sheridan SL, Pignone M. 2001. Numeracy and the medical student’s ability to interpret data. Effective
clinical practice. ECP. 5(1), 35-40. PubMed
7. Woloshin S, Schwartz LM, Moncur M, Gabriel S, Tosteson AN. 2001. Assessing values for
health: numeracy matters. Med Decis Making. 21(5), 382-90. PubMed
https://doi.org/10.1177/0272989X0102100505
8. Rogers EM. Diffusion of innovations. Simon and Schuster; 2010 Jul 6.
9. Woloshin S, Schwartz LM, Zellner A. 2003. Making sense of risk information on the web. BMJ.
327(7417), 695-96. PubMed https://doi.org/10.1136/bmj.327.7417.695
10. MacEachren AM. How maps work: representation, visualization, and design. Guilford
Press; 2004.
11. Frye C. 2001. Making maps that communicate. ArcUser. 4, 38-43.
12. Richards TB, Croner CM, Rushton G, Brown CK, Fowler L. 1999. Information technology:
Geographic information systems and public health: Mapping the future. Public Health Rep. 114(4), 359.
PubMed https://doi.org/10.1093/phr/114.4.359
13. Pickle LW. Atlas of united states mortality. National Center for Health Statistics, Centers for
Disease Control and Prevention, US Dept. of Health and Human Services; 1996.
14. Paolino L, Sebillo M, Cringoli G. 2005. Geographical information systems and on-line GIServices for
health data sharing and management. Parassitologia. 47(1), 171. PubMed
15. Koenig A, Samarasundera E, Cheng T. 2011. Interactive map communication: Pilot study of the
visual perceptions and preferences of public health practitioners. Public Health. 125(8), 554-60.
PubMed https://doi.org/10.1016/j.puhe.2011.02.011
16. Crutcher RJ. 1994. Telling what we know: The use of verbal report methodologies in psychological
research. Psychological Science-Cambridge. 5, 241. https://doi.org/10.1111/j.1467-
9280.1994.tb00619.x
17. Robinson AC. 2007. A design framework for exploratory revisualization in epidemiology. Inf Vis. 6(3),
197-214. PubMed https://doi.org/10.1057/palgrave.ivs.9500155
18. Bhowmick T, Robinson AC, Gruver A, MacEachren AM, Lengerich EJ. 2008. Distributed
usability evaluation of the Pennsylvania Cancer Atlas. Int J Health Geogr. 7(1), 36. PubMed
https://doi.org/10.1186/1476-072X-7-36
19. Cinnamon J, Rinner C, Cusimano MD, Marshall S, Bekele T, et al. 2009. Evaluating web-based
static, animated and interactive maps for injury prevention. Geospat Health. 4(1), 3-16. PubMed
https://doi.org/10.4081/gh.2009.206
Geographic Information Systems: Usability, Perception, and Preferences of Public Health Professionals
Online Journal of Public Health Informatics * ISSN 1947-2579 * http://ojphi.org * 9(2):e191, 2017
OJPHI
20. Higgs G, Smith DP, Gould MI. 2005. Findings from a survey on GIS use in the UK National Health
Service: organisational challenges and opportunities. Health Policy. 72(1), 105-17. PubMed
https://doi.org/10.1016/j.healthpol.2004.06.011
21. Ghetian CB, Parrott R, Volkman JE, Lengerich EJ. 2008. Cancer registry policies in the United
States and geographic information systems applications in comprehensive cancer control. Health Policy.
87(2), 185-93. PubMed https://doi.org/10.1016/j.healthpol.2007.12.007
22. Bhowmick T, Griffin AL, MacEachren AM, Kluhsman BC, Lengerich EJ. 2008. Informing
geospatial toolset design: understanding the process of cancer data exploration and analysis. Health Place.
14(3), 576-607. PubMed https://doi.org/10.1016/j.healthplace.2007.10.009
23. Joyce K. 2009. “To me it’s just another tool to help understand the evidence”: Public health decision-
makers’ perceptions of the value of geographical information systems (GIS). Health Place. 15(3), 831-
40. PubMed https://doi.org/10.1016/j.healthplace.2009.01.004
24. Robinson AC, MacEachren AM, Roth RE. 2011. Designing a web-based learning portal for
geographic visualization and analysis in public health. Health Informatics J. 17(3), 191-208. PubMed
https://doi.org/10.1177/1460458211409718
25. Albert W, Tullis T. Measuring the user experience: collecting, analyzing, and presenting
usability metrics. Newnes; 2013 May 23.