geographia polonica vol. 90 no. 1 (2017), cloud cover over
TRANSCRIPT

INSTITUTE OF GEOGRAPHY AND SPATIAL ORGANIZATIONPOLISH ACADEMY OF SCIENCES
www.igipz.pan.pl
www.geographiapolonica.pl
Geographia Polonica2017, Volume 90, Issue 1, pp. 21-38https://doi.org/10.7163/GPol.0076
CLOUD COVER OVER SPITSBERGEN AND ITS RELATION TO ATMOSPHERIC CIRCULATION (1983-2015)
Ewa Łupikasza • Oskar Lipiński
Department of Climatology, Faculty of Earth SciencesUniversity of Silesia in KatowiceBędzińska 60, 41-200 Sosnowiec: Polande-mails: [email protected] • [email protected]
AbstractThis paper discusses the cloud cover and its relation to atmospheric circulation over Spitsbergen during 1983-2015. It focuses on monthly and seasonal cloud covers and on the frequency of days with specific cloud cover (cloud-less, clear, cloudy and completely overcast sky) and their relation to various circulation types. In the research period the cloud cover characteristics were differentiated over the island on both monthly and seasonal scales, and they strongly depended on the direction of air advection. The highest mean daily cloud cover was reported for circulation types with air advection from the south (S+SWc and S+SWa). The greatest variation in the cloud cover distribution was observed during the polar night (at Svalbard Lufthavn and Ny-Ålesund) or in the au-tumn (Hornsund). The long-term variability in the cloud cover significantly depends on the frequency of N+NEa type (negative correlation) and on S+SWc and W+NWc and Cc+Bc types (positive correlation), particularly in spring.
Key wordscloud cover • atmospheric circulation • Spitsbergen • the Arctic
Introduction
An increase in air temperature, shrinking sea ice extent or a variable pattern of baric field can significantly influence the fraction of the sky obscured by clouds in the Arctic. Unlike majority of climate elements, the cloud cover is measured by visual assessment of the sky fraction covered by clouds. The type and oc-currence of cloud cover may indicate a current
state of the atmosphere, or spell its future modification. Clouds may undergo various modifications, thus significantly influencing the radiation balance of the Earth surface and atmosphere and finally impacting air tem-perature (IPCC 2007; Przybylak 2007; Vavrus et al. 2011; Matuszko & Soroka 2013; Bednorz et al. 2016). Cloud cover modifies the amount of the solar radiation reaching the Earth sur-face and thus significantly influences human
22 Ewa Łupikasza • Oskar Lipiński
Geographia Polonica 2017, 90, 1, pp. 21-38
general sensation (Araźny 2008). Changes and variability in cloud cover are a key factor affecting solar radiation and other climate ele-ments, such as air temperature, precipitation and horizontal visibility (Marsz 2013). Moreo-ver, the knowledge of cloud cover and related precipitation is the basis for understanding the glacier mass-balance (Turner & Gareth 2011).The currently observed shrinking of the sea ice (Meier et al. 2011; Polyakov et al. 2012; Stroeve et al. 2012) is supposed to have a significant influence on the cloud cover over the Arctic (Schweiger & Key 1992; Schweiger 2004; Kay & Gettelman 2009; Eastman & Warren 2010; Palm et al. 2010). Cloud cover is recently pointed to as one of the key indicators of the current climate change (Webber 1994), which creates the need for its research.
This paper aims at assessing the influence of the atmospheric circulation on the amount of the total cloud cover over Spitsbergen, the largest island within the Svalbard Archipela-go. The location of the Island in the central part of the Atlantic Sector of the Arctic results in an increased dynamics of weather condi-tions being shaped by selected circulation types. Heightened cyclonic activity conditioned by the location of the island in the vicinity of the Arctic front is considered to be a char-acteristic feature of the atmospheric circula-tion over the Arctic (Niedźwiedź 2006). Apart from the circulation types, the variability in the cloud cover over Spitsbergen is also affected by local conditions, including, among others, the landform and the warm West Spitsbergen Current flowing in the vicinity of the west Spits-bergen coast (Marsz 2013).
The cloud cover in the Arctic has been discussed in several monographs, though ad-mittedly it still remains a little-known climate element. The total cloud cover over the Arctic or its certain regions was researched, among others, by Raatz (1981), Beesley (1999), Przy-bylak (2003), Marsz and Styszyńska (2013) and Lipiński and Łupikasza (2016). Matusz-ko and Soroka (2013) performed qualitative and quantitative analysis of the cloud cover over Hornsund and delivered the annual aver-age cloud cover for various circulation types
between the 1st July 2009 and 30th June 2012. The modification of solar radiation by clouds was investigated by Vowinckel and Orvig (1962) and Curry et al. (1996), while the relation between cloud cover and sea ice loss was researched by Liu et al. (2007), Kay and Gettelman (2009) and Eastman et al. (2010). Soroka and Matuszko (2013) noted dif-ficulties related to the specificity of the visual cloud cover observations in the Polar Regions. Poor visibility during the polar night, lowered tropopause and limitations in the notation of cloud types in SYNOP messages were speci-fied among the most ultimate ones. Kotarba and Widawski (2008) analysed the cloud cover over Svalbard using satellite images, however the analysis was performed for only one year. Casual relations between the cloud cover and atmospheric circulation were partly recognized by Adamczyk and Ustrnul (2008), who found vast cloud cover variability in five selected grid points in the Arctic. The authors recom-mended the analysis of cloud cover in smaller spatial scales using station data from direct measurements. The relation between cloud cover and atmospheric circulation in the Polish Polar Station Hornsund was also researched by Niedźwiedź and Ustrnul (1989). On the basis of 9-year chronological series (July 1978-July 1987) they determined the average daily cloud cover and the number of days with char-acteristic cloud cover for various circulation types. While calculating regression between cloud cover and the annual index of southern oscillation, Marsz et al. (2013) found rapid changes in the cloud cover over Spitsbergen that are in line with the changes in synoptic situations and related changes in the direction of air advection. Marsz (2013) also performed multifaceted discussion on the cloud cover and its relation to the atmospheric circulation indi-ces over Hornsund in comparison with the oth-er stations located on the island (Ny-Ålesund, Svalbard Lufthavn, Björnöya) in the period 1978-2009. While the study by Marsz (2013) aimed at analysing the correlation between the variability in cloudiness and circulation indices, this study focuses on researching the synoptic conditions related to cloud cover and

23Cloud cover over Spitsbergen and its relation to atmospheric circulation (1983-2015)
Geographia Polonica 2017, 90, 1, pp. 21-38
favouring the occurrence of days with charac-teristic cloud cover. Moreover, this study covers the latest period, namely beyond 2009. Cloud cover and its relation to atmospheric circula-tion in the short-term period of 2010-2011 was also discussed over NW Spitsbergen (Kejna 2012). The research on atmospheric conditions during an anomalous cloud cover in winter and summer at Svalbard Lufthavn station indicated its strong dependence on the air pressure pat-tern at sea level (Bednorz et al. 2016).
This study discusses the annual course and the seasonal cloud cover over the west-ern part of Svalbard and its relations to at-mospheric circulation. The foregoing papers studied the relations using different or single stations. In this paper, in addition to Horn-sund, two more stations located to the north of Hornsund were used, namely Svalbard Lufthavnand and Ny-Alesund. Marsz (2013) used these stations only to compare the an-nual course of cloudiness in Hornsund. Con-trary to the above cited papers, in this study the cloud cover is considered during the polar night and the polar day, duration of which is different at the stations. Two much shorter transitional periods are also analysed – spring
(between the polar night and day) and autumn (between the polar day and night). Average cloud cover and the probability of days with a specific cloud cover are considered as well as its relation to circulation types. Clouds play multiple critical roles in the climate system, particularly in the energetic balance of the at-mosphere. In particular, they efficiently reflect light into space, and thus contribute to the cooling of the planet (Boucher et al. 2013).
Data and Methods
Chronological series of the average daily total cloud cover over the period of 33 years between 1983 and 2015 for three synoptic stations lo-cated on Svalbard were used (Fig. 1, Tab. 1). The northernmost station is Ny-Ålesund. The Svalbard Lufthavn is located several kilome-tres to the northwest of Longyearbyen, while Hornsund – Polish Polar Station of the Institute of Geophysics, Polish Academy of Sciences – is placed in the southern part of the island.
The data for Ny-Ålesund and Svalbard Lufthavn stations come from the Norwe-gian Meteorological Institute database ‘e-klima’ (http://eklima.met.no/). The data
Figure 1. Location of meteorological stations on Spitsbergen

24 Ewa Łupikasza • Oskar Lipiński
Geographia Polonica 2017, 90, 1, pp. 21-38
Table 1. Characteristics of meteorological stations and periods conditioned by seasonal variation in solar radiation
Index Ny-Ålesund Svalbard Lufthavn Hornsund
ø 78°55’N 78°15’N 77°00’N
λ 11°56’E 15°28’E 15°33’E
H 8 m a.s.l 27 m a.s.l 10 m a.s.l
Polar Day*Days
18.04–24.08129
21.04 – 21.08123
24.04 do 18.08117
AutumnDays
25.08-24.10 61
22.08–27.10 67
19.08-30.1073
Polar Night*Days
25.10-17.02 116
28.10 – 14.02 110
31.10 do 11.02104
SpringDays
18.02-17.04 59
15.02 – 20.0465
12.02-23.0471
ø – latitude, λ – longitude, h – altitude in m a.s.l., * durations of polar day and night after http://hornsund.igf.edu.pl/hornsund.old/swiatlo.html
for Hornsund (for the period 1982/1983 -1999/2000) were taken from Meteorological Yearbooks ‘Hornsund’ published by Maritime Branch of the IMGW in Gdynia under the guid-ance of M. Miętus (IMGW 2000-2001). The further yearbooks, for the periods 2000/2001 and 2001/2002 were published by the In-stitute of Geophysics, Polish Academy of Sci-ences under the guidance of Kwaczyński and Nowosielski (Institute of Geophysics 2001, 2003). The latest data for the Hornsund sta-tion (for 2003-2013) come from the database of the Institute of Geophysics, Polish Academy of Sciences. Moreover, the shortened version of the synoptic types catalogue by Niedźwiedź (2015) was used to analyse the relations be-tween atmospheric circulation and cloud cover (Niedźwiedź 2013a). The calendar con-sists of 11 synoptic types including 5 anticy-clonic types (Ca+Ka, N+NEa, E+SEa, S+SWa, W+NWa), 5 cyclonic types (Cc+Bc, N+NEc, E+SEc, S+SWc, W+NWc) and one unidentified type „x” attributed to days with the col or fuzzy atmospheric pressure field.
The main body of the paper consists of two parts divided into further two subchapters. The first part discusses the climatology of cloud cover (first subchapter) and days with a char-acteristic cloud cover (second subchapter). This
chapter includes the average, maximum and minimum monthly, seasonal and annual cloud cover as well as the probability of days with characteristic cloud cover. Days with charac-teristic cloud cover were defined according to the meteorological glossary by IMGW ( Polish Institute of Meteorology and Water Manage-ment, Niedźwiedź 2003). Accordingly, clear days were defined as days with daily average cloud cover lower than 20% (N < 20%), cloudy days are those with average daily cloud cover higher than 80% (N > 80%). Moreover, com-pletely overcast days (N = 100%) and cloud-less days (N = 0%) were also included into the analysis due to the relevance for bioclimatol-ogy. The second part of the paper concerns relations between the cloud cover character-istics and atmospheric circulation. Average cloud cover and conditional probability of the days with a characteristic cloud cover were calculated for every circulation type. Condi-tional probability is a method used to assess relationships between variables while taking into account the frequency of these variables. The statistics provide information about the degree to which each of the considered cir-culation types favours the occurrence of days with a characteristic cloud cover, and thus has a prognostic value. The probability of the
25Cloud cover over Spitsbergen and its relation to atmospheric circulation (1983-2015)
Geographia Polonica 2017, 90, 1, pp. 21-38
occurrence of Event E1 (a day with a specific cloud cover) on condition of the occurrence of Event E2 (a specific type of synoptic situa-tion) is expressed as (Wilks 2006):
PrPr
PrEE
E E
E1
2
1 2
2
Spearman correlation coefficients were also calculated between seasonal cloud cover characteristics and the number of days with particular circulation types to assess the im-pact of atmospheric circulation on the long-term variability in cloud cover indices. The correlation coefficients were not calculated for W+NWa type for the polar night and spring due to a very rare occurrence of the type in these seasons.
Cloud cover
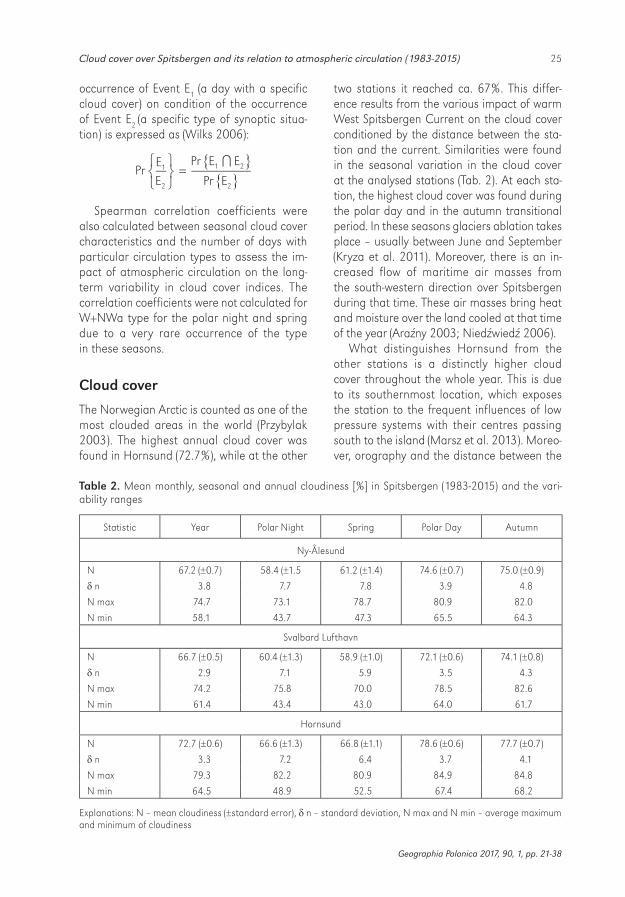
The Norwegian Arctic is counted as one of the most clouded areas in the world (Przybylak 2003). The highest annual cloud cover was found in Hornsund (72.7%), while at the other
two stations it reached ca. 67%. This differ-ence results from the various impact of warm West Spitsbergen Current on the cloud cover conditioned by the distance between the sta-tion and the current. Similarities were found in the seasonal variation in the cloud cover at the analysed stations (Tab. 2). At each sta-tion, the highest cloud cover was found during the polar day and in the autumn transitional period. In these seasons glaciers ablation takes place – usually between June and September (Kryza et al. 2011). Moreover, there is an in-creased flow of maritime air masses from the south-western direction over Spitsbergen during that time. These air masses bring heat and moisture over the land cooled at that time of the year (Araźny 2003; Niedźwiedź 2006).
What distinguishes Hornsund from the other stations is a distinctly higher cloud cover throughout the whole year. This is due to its southernmost location, which exposes the station to the frequent influences of low pressure systems with their centres passing south to the island (Marsz et al. 2013). Moreo-ver, orography and the distance between the
Table 2. Mean monthly, seasonal and annual cloudiness [%] in Spitsbergen (1983-2015) and the vari-ability ranges
Statistic Year Polar Night Spring Polar Day Autumn
Ny-Ålesund
N 67.2 (±0.7) 58.4 (±1.5 61.2 (±1.4) 74.6 (±0.7) 75.0 (±0.9)
δ n 3.8 7.7 7.8 3.9 4.8
N max 74.7 73.1 78.7 80.9 82.0
N min 58.1 43.7 47.3 65.5 64.3
Svalbard Lufthavn
N 66.7 (±0.5) 60.4 (±1.3) 58.9 (±1.0) 72.1 (±0.6) 74.1 (±0.8)
δ n 2.9 7.1 5.9 3.5 4.3
N max 74.2 75.8 70.0 78.5 82.6
N min 61.4 43.4 43.0 64.0 61.7
Hornsund
N 72.7 (±0.6) 66.6 (±1.3) 66.8 (±1.1) 78.6 (±0.6) 77.7 (±0.7)
δ n 3.3 7.2 6.4 3.7 4.1
N max 79.3 82.2 80.9 84.9 84.8
N min 64.5 48.9 52.5 67.4 68.2
Explanations: N – mean cloudiness (±standard error), δ n – standard deviation, N max and N min – average maximum and minimum of cloudiness

26 Ewa Łupikasza • Oskar Lipiński
Geographia Polonica 2017, 90, 1, pp. 21-38
station and the open waters of the Greenland Sea are other important factors. Low-level clouds appearing over the Greenland Sea are ‘pushed’ into the fiords of the Western Spits-bergen, however they do not frequently reach the Svalbard Lufthavn station, which is distant from the fjord entrance (Marsz 2013). Gener-ally, the highest cloud cover within a year was found in July, August or September (Hornsund 81.2%; Svalbard Lufthavn 77.1%; Ny-Ålesund 80.0%, Fig. 2). Except for the station located further to the land, the maximum monthly cloud cover crossed the threshold of 90% (Fig. 2). At each station the variability in the cloud cover was vividly higher in December
and April than in the other months, which was indicated by high standard deviations. Consid-ering seasonal values, the highest cloud cover was noticed during the polar day and the au-tumn transitional season, when it varied from 72.1% at Svalbard Lufthavn to 78.6% at Horn-sund station. A high cloud cover in that part of the year is due to an intense cyclogenesis and low pressure systems more frequent in au-tumn then in winter (Brümmer et al. 2000). Clear weather occurred most often between December and April. During the polar night, when radiation is negligible, atmospheric cir-culation is the most important factor impact-ing upon weather conditions.
Figure 2. Annual course of average, maximum and minimum total cloudiness in Svalbard Lufthavn (SL), Ny-Ålesund (NA) and Hornsund (H) in the period 1983-2015
Days with characteristic cloud cover
The probability of days with a characteristic cloud cover is a very important climate in-dex of bioclimatological and environmental importance. The fraction of the sky obscured by clouds determines the dynamics of many processes taking part in the environment in-cluding human general sensation. Despite relatively short distances between the con-sidered stations, the number of characteristic days varied noticeably depending on location.
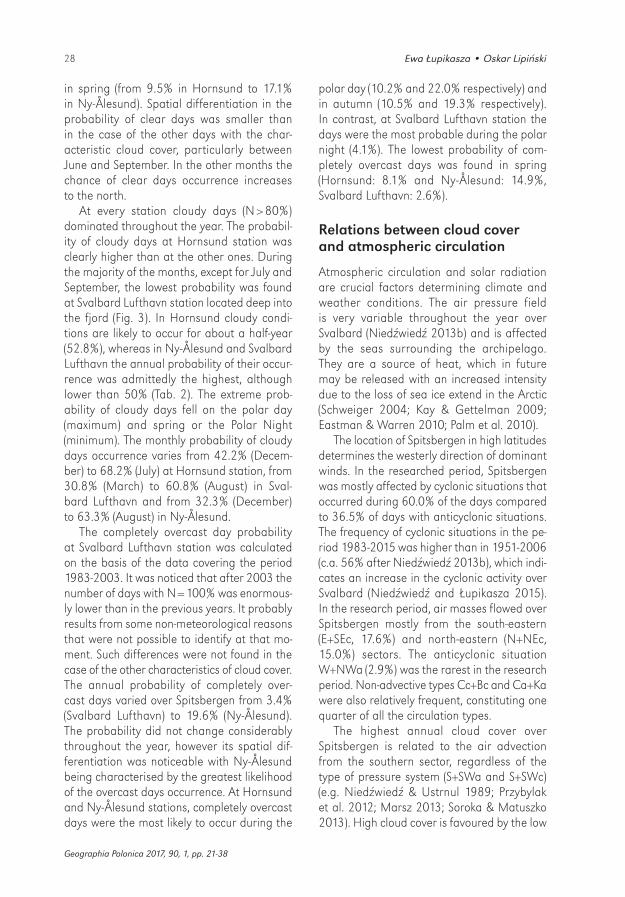
The probability of cloudless days (N = 0%) on Spitsbergen is very low (Tab. 3). At Horn-sund and Svalbard Lufthavn stations it is low-er than 1%. The days occur more frequently at Ny-Ålesund station, with the maximum during the polar night when the probability
of their occurrence reached 7.1%. Cloudless days did not appear in autumn, particularly in Hornsund and Svalbard Lufthavn. At every station cloudless days were the most probable in winter months, from December to February – from 0.3% in Svalbard Lufthavn in Decem-ber to10.0% in Ny-Ålesund in January (Fig. 3). According to Marsz (2013) and Marsz et al. (2013), the low number of cloudless days in Hornsund is due to the frequent and rap-id development of orographic clouds in the visual field of an observer and their rapid transformation.
The highest probability of clear days (N < 20%) on both annual and seasonal scales was found in Ny-Ålesund (Tab. 3). At every sta-tion the probability reached its maximum dur-ing the polar night (from 11.3% in Hornsund to 20.4% in Ny-Ålesund) and was quite high

27Cloud cover over Spitsbergen and its relation to atmospheric circulation (1983-2015)
Geographia Polonica 2017, 90, 1, pp. 21-38
Table 3. Probability of days [%] with characteristic cloudiness: cloudless days (N = 0%), clear days (N<20%), cloudy (N>80%) and the completely overcast (N = 100%) [%] in Spitsbergen (1983-2015)
StationDays with
characteristic cloudiness
Year Polar Night Spring Polar
Day Autumn
NA N = 0% 3.2 7.1 3.0 0.9 0.3
N < 20% 24.3 20.4 17.1 6.1 5.3
N > 80% 46.0 36.2 37.1 54.5 53.5
N = 100% 19.6 18.9 14.9 22.0 19.3
SL N = 0% 0.2 0.4 0.2 0.1 -
N < 20% 9.0 14.0 14.2 5.2 2.4
N > 80% 43.2 34.0 31.4 52.2 52.9
N = 100% 3.4 4.1 2.6 3.7 3.1
H N = 0% 0.4 0.9 0.3 0.1 -
N < 20% 6.3 11.3 9.5 2.6 2.0
N > 80% 52.8 44.4 43.3 62.1 59.5
N = 100% 9.9 10.3 8.1 10.2 10.5
“-“ no characteristic days occurred in the research period
Figure 3. Probability of days with characteristic cloudiness (N) at Svalbard Lufthavn (SL), Ny-Ålesund (NA) and Hornsund (H) stations in the period 1983-2015
28 Ewa Łupikasza • Oskar Lipiński
Geographia Polonica 2017, 90, 1, pp. 21-38
in spring (from 9.5% in Hornsund to 17.1% in Ny-Ålesund). Spatial differentiation in the probability of clear days was smaller than in the case of the other days with the char-acteristic cloud cover, particularly between June and September. In the other months the chance of clear days occurrence increases to the north.
At every station cloudy days (N > 80%) dominated throughout the year. The probabil-ity of cloudy days at Hornsund station was clearly higher than at the other ones. During the majority of the months, except for July and September, the lowest probability was found at Svalbard Lufthavn station located deep into the fjord (Fig. 3). In Hornsund cloudy condi-tions are likely to occur for about a half-year (52.8%), whereas in Ny-Ålesund and Svalbard Lufthavn the annual probability of their occur-rence was admittedly the highest, although lower than 50% (Tab. 2). The extreme prob-ability of cloudy days fell on the polar day (maximum) and spring or the Polar Night (minimum). The monthly probability of cloudy days occurrence varies from 42.2% (Decem-ber) to 68.2% (July) at Hornsund station, from 30.8% (March) to 60.8% (August) in Sval-bard Lufthavn and from 32.3% (December) to 63.3% (August) in Ny-Ålesund.
The completely overcast day probability at Svalbard Lufthavn station was calculated on the basis of the data covering the period 1983-2003. It was noticed that after 2003 the number of days with N = 100% was enormous-ly lower than in the previous years. It probably results from some non-meteorological reasons that were not possible to identify at that mo-ment. Such differences were not found in the case of the other characteristics of cloud cover. The annual probability of completely over-cast days varied over Spitsbergen from 3.4% (Svalbard Lufthavn) to 19.6% (Ny-Ålesund). The probability did not change considerably throughout the year, however its spatial dif-ferentiation was noticeable with Ny-Ålesund being characterised by the greatest likelihood of the overcast days occurrence. At Hornsund and Ny-Ålesund stations, completely overcast days were the most likely to occur during the
polar day (10.2% and 22.0% respectively) and in autumn (10.5% and 19.3% respectively). In contrast, at Svalbard Lufthavn station the days were the most probable during the polar night (4.1%). The lowest probability of com-pletely overcast days was found in spring (Hornsund: 8.1% and Ny-Ålesund: 14.9%, Svalbard Lufthavn: 2.6%).
Relations between cloud cover and atmospheric circulation
Atmospheric circulation and solar radiation are crucial factors determining climate and weather conditions. The air pressure field is very variable throughout the year over Svalbard (Niedźwiedź 2013b) and is affected by the seas surrounding the archipelago. They are a source of heat, which in future may be released with an increased intensity due to the loss of sea ice extend in the Arctic (Schweiger 2004; Kay & Gettelman 2009; Eastman & Warren 2010; Palm et al. 2010).
The location of Spitsbergen in high latitudes determines the westerly direction of dominant winds. In the researched period, Spitsbergen was mostly affected by cyclonic situations that occurred during 60.0% of the days compared to 36.5% of days with anticyclonic situations. The frequency of cyclonic situations in the pe-riod 1983-2015 was higher than in 1951-2006 (c.a. 56% after Niedźwiedź 2013b), which indi-cates an increase in the cyclonic activity over Svalbard (Niedźwiedź and Łupikasza 2015). In the research period, air masses flowed over Spitsbergen mostly from the south-eastern (E+SEc, 17.6%) and north-eastern (N+NEc, 15.0%) sectors. The anticyclonic situation W+NWa (2.9%) was the rarest in the research period. Non-advective types Cc+Bc and Ca+Ka were also relatively frequent, constituting one quarter of all the circulation types.
The highest annual cloud cover over Spitsbergen is related to the air advection from the southern sector, regardless of the type of pressure system (S+SWa and S+SWc) (e.g. Niedźwiedź & Ustrnul 1989; Przybylak et al. 2012; Marsz 2013; Soroka & Matuszko 2013). High cloud cover is favoured by the low

29Cloud cover over Spitsbergen and its relation to atmospheric circulation (1983-2015)
Geographia Polonica 2017, 90, 1, pp. 21-38
pressure system developing between Green-land and Spitsbergen, which triggers an in-flow of warm and moist maritime air masses ( Soroka & Matuszko 2013). High cloud cover amount over Spitsbergen also occurs in Cc+Bc and W+NWc circulation types. In contrary, the sky is the clearest in N+NEa circulation type. The cloud cover in anticyclonic situations is no-ticeably lower than in cyclonic ones, except for S+SWa type.
The relations between the cloud cover and atmospheric circulation changed throughout the year (Fig. 4), however the main pattern – the highest cloud cover in S+SWc and S+SWa and the lowest one in N+NEa and N+NEc – did not change during the year. In type S+SWc the cloud cover varied between 81.3% during the polar night in Svalbard Lufthavn to 94.7% during the polar day in Hornsund, while in type N+NEa the cloud cover reached form 30.5% in Ny-Ålesund (polar night) to 65.2% in Hornsund (polar day). The relations between the cloud cover and atmospheric circulation
during the polar night and in spring were stronger than in the other two seasons. It was proved by a higher degree of variability in the average cloud cover in particular circulation types – the difference between the types with the highest and the lowest cloud cover. This means that there were some circulation types that were clearly favourable and some types that were clearly unfavourable for the cloud cover development. During the polar day the difference in average cloud cover between N+NEa and S+SWc types reached on average 33.0% (Fig. 4), while during the polar night it equalled 53.7%. In the case of the cyclonic types (excluding S+SWc), clouds covered about 67.4% (the polar night) to 77.9% (the polar day) of the sky over Spitsbergen. For the majority of the cyclonic types (excluding W+NWc and N+NEc at polar night), the highest cloud cov-er occurred at Hornsund station. The station is frequently in the cloud zone induced by low pressure systems whose centres move south to the island (Marsz 2013). A decrease in the
Figure 4. Average seasonal cloudiness [%] in circulation types in the period 1983-2015
30 Ewa Łupikasza • Oskar Lipiński
Geographia Polonica 2017, 90, 1, pp. 21-38
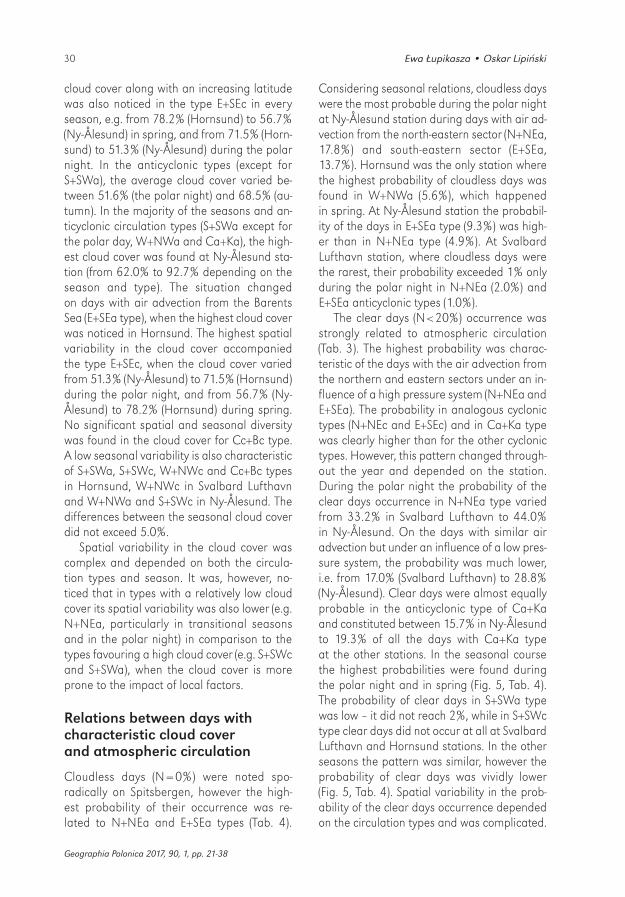
cloud cover along with an increasing latitude was also noticed in the type E+SEc in every season, e.g. from 78.2% (Hornsund) to 56.7% (Ny-Ålesund) in spring, and from 71.5% (Horn-sund) to 51.3% (Ny-Ålesund) during the polar night. In the anticyclonic types (except for S+SWa), the average cloud cover varied be-tween 51.6% (the polar night) and 68.5% (au-tumn). In the majority of the seasons and an-ticyclonic circulation types (S+SWa except for the polar day, W+NWa and Ca+Ka), the high-est cloud cover was found at Ny-Ålesund sta-tion (from 62.0% to 92.7% depending on the season and type). The situation changed on days with air advection from the Barents Sea (E+SEa type), when the highest cloud cover was noticed in Hornsund. The highest spatial variability in the cloud cover accompanied the type E+SEc, when the cloud cover varied from 51.3% (Ny-Ålesund) to 71.5% (Hornsund) during the polar night, and from 56.7% (Ny-Ålesund) to 78.2% (Hornsund) during spring. No significant spatial and seasonal diversity was found in the cloud cover for Cc+Bc type. A low seasonal variability is also characteristic of S+SWa, S+SWc, W+NWc and Cc+Bc types in Hornsund, W+NWc in Svalbard Lufthavn and W+NWa and S+SWc in Ny-Ålesund. The differences between the seasonal cloud cover did not exceed 5.0%.
Spatial variability in the cloud cover was complex and depended on both the circula-tion types and season. It was, however, no-ticed that in types with a relatively low cloud cover its spatial variability was also lower (e.g. N+NEa, particularly in transitional seasons and in the polar night) in comparison to the types favouring a high cloud cover (e.g. S+SWc and S+SWa), when the cloud cover is more prone to the impact of local factors.
Relations between days with characteristic cloud cover and atmospheric circulation
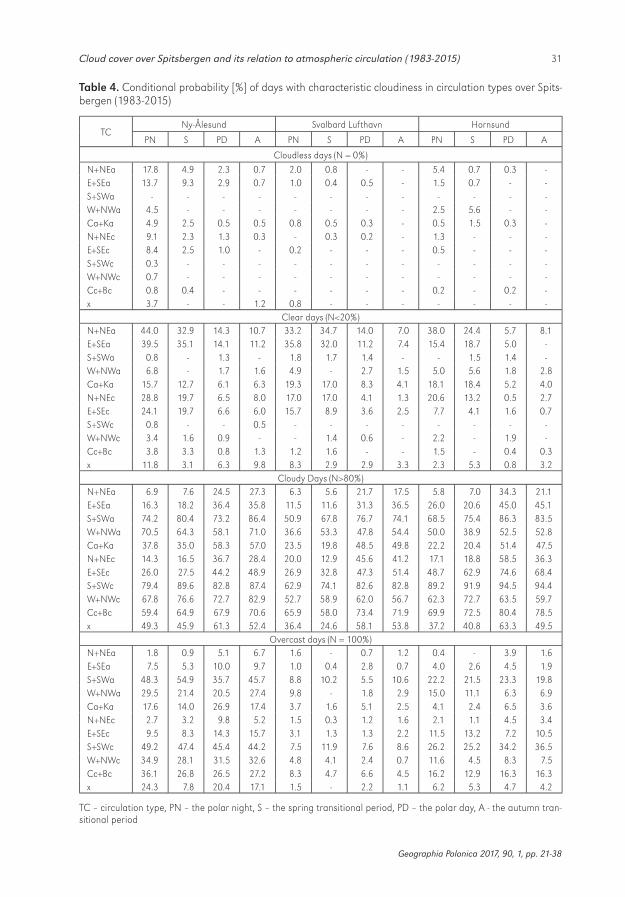
Cloudless days (N = 0%) were noted spo-radically on Spitsbergen, however the high-est probability of their occurrence was re-lated to N+NEa and E+SEa types (Tab. 4).
Considering seasonal relations, cloudless days were the most probable during the polar night at Ny-Ålesund station during days with air ad-vection from the north-eastern sector (N+NEa, 17.8%) and south-eastern sector (E+SEa, 13.7%). Hornsund was the only station where the highest probability of cloudless days was found in W+NWa (5.6%), which happened in spring. At Ny-Ålesund station the probabil-ity of the days in E+SEa type (9.3%) was high-er than in N+NEa type (4.9%). At Svalbard Lufthavn station, where cloudless days were the rarest, their probability exceeded 1% only during the polar night in N+NEa (2.0%) and E+SEa anticyclonic types (1.0%).
The clear days (N < 20%) occurrence was strongly related to atmospheric circulation (Tab. 3). The highest probability was charac-teristic of the days with the air advection from the northern and eastern sectors under an in-fluence of a high pressure system (N+NEa and E+SEa). The probability in analogous cyclonic types (N+NEc and E+SEc) and in Ca+Ka type was clearly higher than for the other cyclonic types. However, this pattern changed through-out the year and depended on the station. During the polar night the probability of the clear days occurrence in N+NEa type varied from 33.2% in Svalbard Lufthavn to 44.0% in Ny-Ålesund. On the days with similar air advection but under an influence of a low pres-sure system, the probability was much lower, i.e. from 17.0% (Svalbard Lufthavn) to 28.8% (Ny-Ålesund). Clear days were almost equally probable in the anticyclonic type of Ca+Ka and constituted between 15.7% in Ny-Ålesund to 19.3% of all the days with Ca+Ka type at the other stations. In the seasonal course the highest probabilities were found during the polar night and in spring (Fig. 5, Tab. 4). The probability of clear days in S+SWa type was low – it did not reach 2%, while in S+SWc type clear days did not occur at all at Svalbard Lufthavn and Hornsund stations. In the other seasons the pattern was similar, however the probability of clear days was vividly lower (Fig. 5, Tab. 4). Spatial variability in the prob-ability of the clear days occurrence depended on the circulation types and was complicated.
31Cloud cover over Spitsbergen and its relation to atmospheric circulation (1983-2015)
Geographia Polonica 2017, 90, 1, pp. 21-38
Table 4. Conditional probability [%] of days with characteristic cloudiness in circulation types over Spits-bergen (1983-2015)
TCNy-Ålesund Svalbard Lufthavn Hornsund
PN S PD A PN S PD A PN S PD A
Cloudless days (N = 0%)
N+NEa 17.8 4.9 2.3 0.7 2.0 0.8 - - 5.4 0.7 0.3 -E+SEa 13.7 9.3 2.9 0.7 1.0 0.4 0.5 - 1.5 0.7 - -S+SWa - - - - - - - - - - - -W+NWa 4.5 - - - - - - - 2.5 5.6 - -Ca+Ka 4.9 2.5 0.5 0.5 0.8 0.5 0.3 - 0.5 1.5 0.3 -N+NEc 9.1 2.3 1.3 0.3 - 0.3 0.2 - 1.3 - - -E+SEc 8.4 2.5 1.0 - 0.2 - - - 0.5 - - -S+SWc 0.3 - - - - - - - - - - -W+NWc 0.7 - - - - - - - - - - -Cc+Bc 0.8 0.4 - - - - - - 0.2 - 0.2 -x 3.7 - - 1.2 0.8 - - - - - - -
Clear days (N<20%)N+NEa 44.0 32.9 14.3 10.7 33.2 34.7 14.0 7.0 38.0 24.4 5.7 8.1E+SEa 39.5 35.1 14.1 11.2 35.8 32.0 11.2 7.4 15.4 18.7 5.0 -S+SWa 0.8 - 1.3 - 1.8 1.7 1.4 - - 1.5 1.4 -W+NWa 6.8 - 1.7 1.6 4.9 - 2.7 1.5 5.0 5.6 1.8 2.8Ca+Ka 15.7 12.7 6.1 6.3 19.3 17.0 8.3 4.1 18.1 18.4 5.2 4.0N+NEc 28.8 19.7 6.5 8.0 17.0 17.0 4.1 1.3 20.6 13.2 0.5 2.7E+SEc 24.1 19.7 6.6 6.0 15.7 8.9 3.6 2.5 7.7 4.1 1.6 0.7S+SWc 0.8 - - 0.5 - - - - - - - -W+NWc 3.4 1.6 0.9 - - 1.4 0.6 - 2.2 - 1.9 -Cc+Bc 3.8 3.3 0.8 1.3 1.2 1.6 - - 1.5 - 0.4 0.3x 11.8 3.1 6.3 9.8 8.3 2.9 2.9 3.3 2.3 5.3 0.8 3.2
Cloudy Days (N>80%)N+NEa 6.9 7.6 24.5 27.3 6.3 5.6 21.7 17.5 5.8 7.0 34.3 21.1E+SEa 16.3 18.2 36.4 35.8 11.5 11.6 31.3 36.5 26.0 20.6 45.0 45.1S+SWa 74.2 80.4 73.2 86.4 50.9 67.8 76.7 74.1 68.5 75.4 86.3 83.5W+NWa 70.5 64.3 58.1 71.0 36.6 53.3 47.8 54.4 50.0 38.9 52.5 52.8Ca+Ka 37.8 35.0 58.3 57.0 23.5 19.8 48.5 49.8 22.2 20.4 51.4 47.5N+NEc 14.3 16.5 36.7 28.4 20.0 12.9 45.6 41.2 17.1 18.8 58.5 36.3E+SEc 26.0 27.5 44.2 48.9 26.9 32.8 47.3 51.4 48.7 62.9 74.6 68.4S+SWc 79.4 89.6 82.8 87.4 62.9 74.1 82.6 82.8 89.2 91.9 94.5 94.4W+NWc 67.8 76.6 72.7 82.9 52.7 58.9 62.0 56.7 62.3 72.7 63.5 59.7Cc+Bc 59.4 64.9 67.9 70.6 65.9 58.0 73.4 71.9 69.9 72.5 80.4 78.5x 49.3 45.9 61.3 52.4 36.4 24.6 58.1 53.8 37.2 40.8 63.3 49.5
Overcast days (N = 100%)N+NEa 1.8 0.9 5.1 6.7 1.6 - 0.7 1.2 0.4 - 3.9 1.6E+SEa 7.5 5.3 10.0 9.7 1.0 0.4 2.8 0.7 4.0 2.6 4.5 1.9S+SWa 48.3 54.9 35.7 45.7 8.8 10.2 5.5 10.6 22.2 21.5 23.3 19.8W+NWa 29.5 21.4 20.5 27.4 9.8 - 1.8 2.9 15.0 11.1 6.3 6.9Ca+Ka 17.6 14.0 26.9 17.4 3.7 1.6 5.1 2.5 4.1 2.4 6.5 3.6N+NEc 2.7 3.2 9.8 5.2 1.5 0.3 1.2 1.6 2.1 1.1 4.5 3.4E+SEc 9.5 8.3 14.3 15.7 3.1 1.3 1.3 2.2 11.5 13.2 7.2 10.5S+SWc 49.2 47.4 45.4 44.2 7.5 11.9 7.6 8.6 26.2 25.2 34.2 36.5W+NWc 34.9 28.1 31.5 32.6 4.8 4.1 2.4 0.7 11.6 4.5 8.3 7.5Cc+Bc 36.1 26.8 26.5 27.2 8.3 4.7 6.6 4.5 16.2 12.9 16.3 16.3x 24.3 7.8 20.4 17.1 1.5 - 2.2 1.1 6.2 5.3 4.7 4.2
TC – circulation type, PN – the polar night, S – the spring transitional period, PD – the polar day, A - the autumn tran-sitional period

32 Ewa Łupikasza • Oskar Lipiński
Geographia Polonica 2017, 90, 1, pp. 21-38
Figure 5. Conditional probability of the occurrence of selected days with characteristic cloudiness (clear days: N < 20%, cloudy days, N > 80%, completely overcast days, N = 100%) from seasonal perspective in Spitsbergen in the period 1983-2015
33Cloud cover over Spitsbergen and its relation to atmospheric circulation (1983-2015)
Geographia Polonica 2017, 90, 1, pp. 21-38
Despite that, it is noticeable that in the ma-jority of the seasons and circulation types clear days were most probable at Ny-Ålesund station.
Cloudy days, (N > 80%) in contrast to the other days with characteristic cloud cover, may occur in Spitsbergen in every circulation type. However, their highest probability (at least 50%) was related to S+SEc, S+SWa, W+NWc and Cc+Bc circulation types (Tab. 4). The prob-ability of cloudy days in the cyclonic types at Hornsund, and at the other stations simi-larly, reached its maximum during the polar day (72.5% in Hornsund, 60% at the other sta-tions); at Svalbard Lufthavn and Ny-Ålesund stations it was also quite high in autumn. Dur-ing the polar night and in spring the chance of the cloudy days occurrence was lower, thus the average probability of their occurrence in the cyclonic situations was also lower, i.e. from ca. 44.1% in Svalbard Lufthavn to 54.1% in Hornsund during the polar night, and from 43.6% in Svalbard Lufthavn to 59.9% in Horn-sund in spring. At every station cloudy days were the least frequent in N+NEa type dur-ing the polar night (from 5.8% in Hornsund to 6.9% in Ny-Ålesund) and in spring (from 5.6% in Svalbard Lufthavn to 7.6% in Ny-Ålesund). The chance of the cloudy days oc-currence in the other anticyclonic situations (E+SEa, W+NWa, Ca+Ka) varied from 11.5% (the polar night) to 54.4% (autumn) at Sval-bard Lufthavn station, from 20.6% (spring) to 52.8% (autumn) at Hornsund station and from 16.3% (the polar night) to 71.0% (au-tumn) at Ny-Ålesund station (Tab. 4).
Completely overcast days may occur in al-most every circulation type. However, the proba-bility of their occurrence was the highest during air advection from the southern sector (S+SWa and S+SWc). It particularly applies to Ny-Ålesund station (S+SWa: from 35.7% to 54.9%; S+SWc: from 44.2%to 49.2%) and Hornsund station (S+SWa: from 19.8% to 23.3%; S+SWc: from 25.2% to 36.5%) (Tab. 4). The least chance of completely overcast days characterised Sval-bard Lufthavn station, located deep into the island where the probability did not exceed 10%, except for S+SWa type in spring (10.2%)
and autumn (10.6%) and S+SWc type in spring (11.9%). This may be related to the topography – the station is sheltered by a high orographic barrier that stops the moist air flowing from the south. Seasonal differentiation in the probabil-ity of completely overcast days did not exceed 10% at Hornsund and Svalbard Lufthavn sta-tions, while at Ny-Ålesund station it was higher than 12% in anticyclonic types S+SEa, W+NWa and Ca+Ka. Completely overcast days were the least probable in N+NEa situation, the prob-ability of their occurrence in that circulation types exceeded 5% only at Ny-Ålesund station during autumn and the polar day
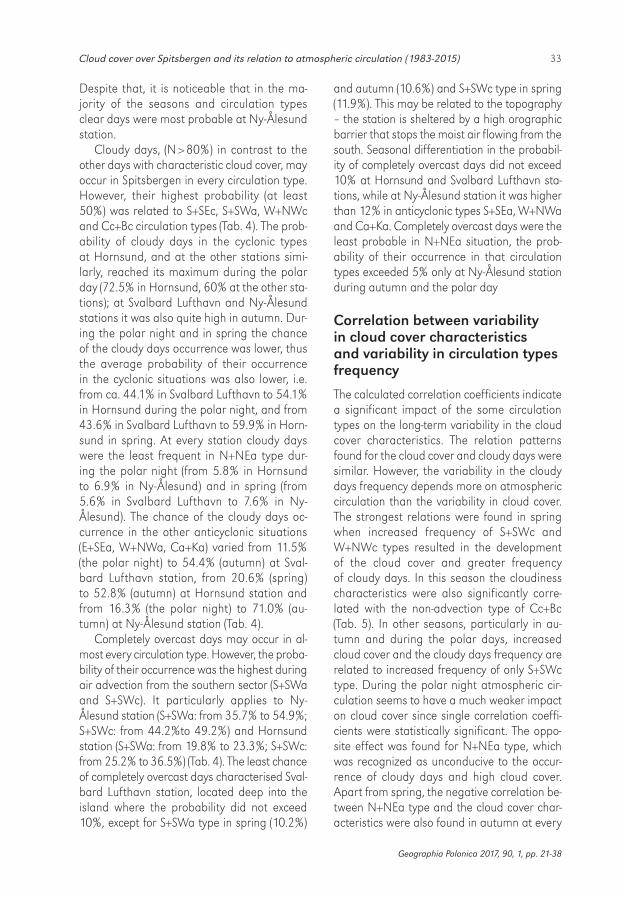
Correlation between variability in cloud cover characteristics and variability in circulation types frequency
The calculated correlation coefficients indicate a significant impact of the some circulation types on the long-term variability in the cloud cover characteristics. The relation patterns found for the cloud cover and cloudy days were similar. However, the variability in the cloudy days frequency depends more on atmospheric circulation than the variability in cloud cover. The strongest relations were found in spring when increased frequency of S+SWc and W+NWc types resulted in the development of the cloud cover and greater frequency of cloudy days. In this season the cloudiness characteristics were also significantly corre-lated with the non-advection type of Cc+Bc (Tab. 5). In other seasons, particularly in au-tumn and during the polar days, increased cloud cover and the cloudy days frequency are related to increased frequency of only S+SWc type. During the polar night atmospheric cir-culation seems to have a much weaker impact on cloud cover since single correlation coeffi-cients were statistically significant. The oppo-site effect was found for N+NEa type, which was recognized as unconducive to the occur-rence of cloudy days and high cloud cover. Apart from spring, the negative correlation be-tween N+NEa type and the cloud cover char-acteristics were also found in autumn at every
34 Ewa Łupikasza • Oskar Lipiński
Geographia Polonica 2017, 90, 1, pp. 21-38
Table 5. Spearman correlation coefficients between days with characteristic cloudiness and circulation types frequency over Spitsbergen (1983-2015)
SZ ST N+NEa E+SEa S+SWa W+NWa Ca+Ka N+NEc E+SEc S+SWc W+NWc Cc+Bc x
Cloud cover
PN NA -0.502 -0.198 +0.286 - -0.177 -0.093 +0.051 +0.220 -0.048 +0.486 -0.015
SL -0.232 -0.271 +0.075 - -0.256 -0.082 +0.136 +0.297 -0.108 +0.336 -0.041
H -0.192 -0.347 +0.188 - -0.292 +0.030 +0.121 +0.563 -0.009 +0.236 +0.151
S NA -0.563 -0.359 +0.123 - -0.288 +0.015 +0.006 +0.497 +0.357 +0.530 +0.309
SL -0.569 -0.243 +0.028 - -0.143 -0.204 -0.064 +0.563 +0.522 +0.592 +0.461
H -0.711 -0.170 +0.018 - -0.135 -0.155 -0.024 +0.504 +0.643 +0.431 +0.446
PD NA -0.424 -0.068 +0.221 -0.004 -0.197 -0.017 -0.131 +0.358 +0.243 +0.297 +0.095
SL -0.458 -0.148 +0.332 -0.149 -0.225 -0.099 +0.012 +0.555 +0.128 +0.422 +0.088
H -0.316 -0.226 +0.148 -0.258 -0.358 +0.091 +0.290 +0.421 +0.018 +0.318 +0.104
A NA -0.448 -0.192 +0.282 +0.149 -0.068 -0.324 +0.157 +0.305 +0.041 -0.092 +0.080
SL -0.583 +0.017 +0.184 +0.146 -0.010 -0.346 +0.162 +0.503 -0.046 +0.126 +0.292
H -0.653 -0.101 +0.123 -0.152 -0.112 -0.254 +0.103 +0.526 +0.300 +0.298 -0.040
Clear days (N<20%)
PN NA +0.446 +0.163 -0.198 - +0.376 -0.049 -0.024 -0.180 +0.069 -0.412 +0.014
SL +0.358 +0.180 -0.147 - +0.350 +0.099 -0.155 -0.454 +0.221 -0.314 -0.049
H +0.234 +0.296 -0.344 - +0.315 +0.016 -0.148 -0.573 -0.020 -0.068 -0.069
S NA +0.503 +0.297 +0.132 - +0.333 -0.205 -0.091 -0.052 -0.306 -0.421 -0.282
SL +0.509 +0.316 +0.335 - +0.188 +0.029 -0.172 -0.264 -0.520 -0.435 -0.326
H +0.608 +0.271 +0.126 - +0.147 +0.048 -0.070 -0.294 -0.627 -0.285 -0.423
PD NA +0.105 +0.072 -0.076 +0.000 +0.253 -0.326 +0.240 +0.059 -0.159 -0.344 +0.056
SL +0.255 +0.224 -0.348 +0.012 +0.286 -0.166 +0.158 -0.234 -0.116 -0.452 -0.051
H +0.500 -0.012 -0.188 +0.053 +0.279 -0.071 -0.001 -0.146 -0.158 -0.370 -0.215
A NA -0.292 -0.228 -0.332 +0.237 -0.367 +0.215 +0.326 -0.084 +0.055 +0.389 -0.020
SL +0.566 +0.208 +0.016 -0.035 +0.161 +0.091 -0.169 -0.352 -0.095 -0.210 -0.354
H +0.288 -0.044 -0.140 +0.132 +0.270 +0.038 +0.093 -0.352 -0.335 +0.116 -0.037
Cloudy days (>80%)
PN NA -0.403 -0.163 +0.253 - +0.014 -0.140 +0.029 +0.194 +0.088 +0.408 -0.003
SL -0.103 -0.311 +0.065 - -0.008 -0.120 +0.003 +0.142 +0.063 +0.399 -0.039
H +0.004 -0.234 +0.092 - -0.129 -0.025 +0.017 +0.489 +0.117 +0.243 +0.122
S NA -0.558 -0.184 +0.254 - -0.193 -0.175 -0.137 +0.683 +0.474 +0.459 +0.358
SL -0.396 -0.054 +0.387 - +0.089 -0.329 -0.308 +0.710 +0.472 +0.332 +0.396
H -0.655 -0.065 +0.077 - -0.132 -0.221 -0.037 +0.578 +0.539 +0.386 +0.347
PD NA -0.438 -0.145 +0.297 -0.117 -0.140 -0.036 +0.013 +0.468 +0.215 +0.183 +0.103
SL -0.368 -0.245 +0.377 -0.154 -0.232 -0.092 +0.004 +0.640 +0.148 +0.297 +0.088
H -0.261 -0.272 +0.130 -0.307 -0.336 -0.021 +0.377 +0.487 +0.042 +0.269 +0.059
A NA -0.426 -0.143 +0.357 +0.164 -0.011 -0.372 +0.087 +0.330 +0.012 -0.069 +0.000
SL -0.635 -0.233 +0.051 +0.169 -0.201 -0.132 +0.221 +0.390 +0.040 +0.192 +0.315
H -0.513 -0.140 +0.244 -0.023 -0.101 -0.327 +0.219 +0.447 +0.161 +0.212 +0.002
SZ – season, PN – the polar night, S – the spring transitional period, PD – the polar day, A – the autumn transitional period, ST – station, NA – Ny-Ålesund, SL – Svalbard Lufthavn, H – Hornsund, +0.089 – insignificant correlation, +0.408 – significant correlation at α < 0.05, +0.468 – significant correlation at α < 0.01, +0.640– significant correlation at α < 0.001, “-“ correlation not calculated due to low frequency of circulation type
35Cloud cover over Spitsbergen and its relation to atmospheric circulation (1983-2015)
Geographia Polonica 2017, 90, 1, pp. 21-38
station and during the polar day at Ny-Ålesund and Svalbard Lufthavn stations. During the po-lar night, the correlation was significant only at Ny-Ålesund station (Tab. 4).
The relation between the long-term course of clear days and atmospheric circulation are reverse to that found for cloud cover and cloudy days. Again the strongest correlations were noted in spring (Tab. 5). In that season an increase in the frequency of N+NEa type resulted in the higher number of clear days. Similar effect was found in autumn at Sval-bard Lufthavn station, during the polar night at Svalbard Lufthavn and Ny-Ålesund sta-tions, and during the polar day at Hornsund station. The cyclonic types of S+SWc, W+NWc and Cc+Bc were negatively correlated with the clear days frequency. Their impact on the vari-ability in clear days differs depending on the season. The impact of S+SWc types is signifi-cant in autumn and during the polar night, while of Cc+Bc type – mainly in spring and during the polar day. A strong correlation was also found between clear days and S+SWc types at Hornsund and Svalbard Lufthavn sta-tion, however only in spring.
Conclusions
The undertaken research of the annual course and seasonal variability in the cloud cover at se-lected stations located on the Western coast of Spitsbergen in 1983-2015 showed that at-mospheric circulation is an important factor affecting the cloud cover. Despite relatively short distances between the stations, the cloud cover was diverse. Hornsund was the cloudiest station. At Ny-Ålesund and Svalbard Lufthavn stations the cloud cover was similar. The maxi-mum cloud cover was found during the polar day and in autumn. The minimum cloud cover was characteristic of the polar night. However, it must be stressed that the assessment of cloud cover during that season is the most difficult.
The number of days with a characteristic cloud cover also varies depending on the station. The highest number of cloudless (N = 0%) and clear (N < 20%) days was found in Ny-Ålesund. The same applies to completely
overcast days (N = 100%). The highest number of cloudy days (N > 80%) was noticed in Horn-sund, located furthest to the south.
The research of the relation between cloud cover and atmospheric circulation points to the following conclusions:− The cloud cover depended on the direction
of air advection. The type of pressure sys-tem was of minor relevance. The highest cloud cover over Spitsbergen was related to air advection from the southern sector regardless of a pressure system (S+SWc and S+SWa). At each station and in all seasons the lowest cloud cover was related to the types of N+NEa and N+NEc.
− In the majority of the cyclonic types, the highest cloud cover was found in Hornsund (except for W+NWc type during the polar day and in autumn). In the anticyclonic situations of S+SWa (except for the polar day at Hornsund station), W+NWa and Ca+Ka, the highest cloud cover was no-ticed in Ny-Ålesund. At Svalbard Lufthavn station the highest cloud cover during the polar night was related to the air advection from the northern sector.
− The impact of atmospheric circulation on the cloud cover was the strongest during the po-lar night (Svalbard Lufthavnand, Ny-Ålesund) and in autumn (Hornsund),while the weak-est – during the polar day, when the solar radiation is a crucial climate factor.
− In Spitsbergen cloudy days (N > 80%) were dominant. These days, and completely overcast days likewise (N = 100%), were the most probable during the air advec-tion from the southern sector regardless the pressure system.
− The number of cloudless days over Spitsber-gen was relatively low, particularly at Horn-sund and Svalbard Lufthavn stations. The highest probability of these days was found at Ny-Ålesund station during the polar night and in spring during the air advection from the north-eastern and south-eastern sectors (N+NE and E+SE) regardless of the type of pressure system. These circulation types also favoured the occurrence of clear days over the whole research area.
36 Ewa Łupikasza • Oskar Lipiński
Geographia Polonica 2017, 90, 1, pp. 21-38
− Atmospheric circulation significantly in-fluences the variability in the cloud cover characteristics, and the relations change throughout the year being the strongest in spring and the weakest during the po-lar night. The frequency of N+NEa type is positively correlated with clear days, and negatively with cloudy days and cloud cover, while the opposite relations were found with S+SWc, W+NWc and Cc+Bc types.
AcknowledgementsThe publication has been (partially) financed from the funds of the Leading National Re-search Centre (KNOW) received by the Centre for Polar Studies of the University of Silesia, Poland.
Editors’ note:Unless otherwise stated, the sources of tables and figures are the authors’, on the basis of their own research.
References
ADAMCZYK R., USTRNUL Z., 2008. Uwarunkowania cyrkulacyjne zachmurzenia ogólnego w strefie polarnej Europy. Problemy Klimatologii Polarnej, 18, pp. 79-86.
ARAŹNY A., 2003. Przebieg roczny wilgotności względnej w Arktyce Norweskiej w okresie 1971-2000, Problemy Klimatologii Polarnej. 13, pp. 107-115.
ARAŹNY A., 2008. Bioklimat Arktyki Norweskiej i jego zmienność w okresie 1971-2000. Toruń: Wydawnictwo Naukowe Uniwersytetu Mikołaja Kopernika.
BEDNORZ E., KACZMAREK D., DULIK P., 2016. Atmos-pheric conditions governing anomalies of the summer and winter cloudiness in Spitsbergen. Theoretical and Applied Climatology, vol. 123, nos. 1-2, pp. 1-10.
BEESLEY J.A., MORITZ R.E., 1999. Toward an expla-nation of the annual cycle of cloudiness over the Arctic Ocean. Journal of Climate, vol. 12, no. 2, pp. 395-415.
BOUCHER O., RANDALL D., ARTAXO P., BRETHER-TON C., FEINGOLD G., FORSTER P., KERMINEN V.-M., KONDO Y., LIAO H., LOHMANN U., RASCH P., SATHEESHS K., SHERWOOD S., STEVENS B., ZHANGX Y., 2013. Clouds and Aerosols [in:] T.F. Stocker, D. Qin, G.-K. Plattner, M. Tignor, S.K. Allen, J. Boschung, A. Nauels, Y. Xia, V. Bex, P.M. Midgley (eds.), Climate Change 2013: The Physical Science Basis. Contribution of Working Group I to the Fifth Assessment Report of the Intergovernmental Panel on Climate Change, Cambridge, United Kingdom – New York, NY, USA: Cambridge University Press.
BRÜMMER, B., S. THIEMANN S., KIRCHGÄSSNER A., 2000. A cyclone statistics for the Arctic based on European Centre re-analysis data. Meteorol-ogy and Atmospheric Physics, vol. 75, nos. 3-4, pp. 233-250.
CURRY J.A., ROSSOW W.B., RANDALL D., SCH-RAMM J.L., 1996. Overview of Arctic cloud and radiation characteristics. Journal of Climate, vol. 9, no. 8., pp. 1731-1764.
EASTMAN R., WARREN S.G., 2010. Interannual variations of arctic cloud types in relation to sea ice. Journal of Climate, vol. 23, no. 15, pp. 4216-4232.
IMGW, 2000-2001. Roczniki Meteorologiczne Horn-sund. (Edited by M. Miętus), 1982/83-1999/2000, Gdynia: Instytut Meteorologii i Gospodarki Wod-nej Oddział Morski.
IPCC, 2007. Climate Change 2007: The Physical Science Basis Contribution of Working Group I to the Fourth Assessment Report of the Inter-governmental Panel on Climate Change. Cam-bridge: Cambridge University Press.
KAY J.E., GETTELMAN A., 2009. Cloud influence on and response to seasonal Arctic sea ice loss. Journal of Geophysical Research, vol. 114, no. D18204, DOI:10.1029/2009JD011773.
KOTARBA A., WIDAWSKI A., 2008. Satelitarna charak-terystyka zachmurzenia ogólnego nad Svalbardem w roku 2007 w powiązaniu z cyrkulacją atmosfery. Problemy Klimatologii Polarnej, 18, pp. 127-140.
KRYZA M., SZYMANOWSKI M., MIGAŁA K., 2011. Zasto-sowanie modelu r. sun do określenia dobowych sum promieniowania rzeczywistego na lodowcu Werenskjolda (SW Spitsbergen). Prace i Studia Geograficzne, 47, pp. 435-442.
37Cloud cover over Spitsbergen and its relation to atmospheric circulation (1983-2015)
Geographia Polonica 2017, 90, 1, pp. 21-38
LIPIŃSKI O., ŁUPIKASZA E., 2016. Rola cyrkulacji at-mosfery w kształtowaniu wielkości zachmurzenia ogólnego na Spitsbergenie (1983-2013). Prze-gląd Geograficzny, vol. 88, no. 3, pp. 295-315.
LIU Y., KEY J.R., FRANCIS J.A., WANG X., 2007. Pos-sible causes of decreasing cloud cover in the Arctic winter, 1982–2000. Journal of Geo-physical Research, vol. 34, no. 14, L14705, DOI:10.1029/2007GL030042.
MARSZ A.A., 2013. Cloudiness and sunshine du-ration [in:] Marsz A.A., Styszyńska A., (ed.), Climate and climate change in Hornsund, Svalbard, Gdynia: Gdynia Maritime University, pp. 101-125.
MARSZ A.A., NIEDŹWIEDŹ T., STYSZYŃSKA A., 2013. Współczesne zmiany klimatu Spitsbergenu jako podstawa wyznaczania zmian krajobrazowych [in:] Dawne i współczesne geoekosystemy Spits-bergenu, Zb. Zwoliński, A. Kostrzewski, M. Pulina (ed.), Poznań: Bogucki Wydawnictwo Naukowe, pp. 391-413.
MARSZ A.A., STYSZYŃSKA A., 2013. Climate and climate change at Hornsund, Svalbard. Gdynia: Gdynia Maritime University.
MATUSZKO D., SOROKA J., 2013. Zachmurzenie Spitsbergenu na podstawie obserwacji w polskiej polarnej w Hornsundzie. Kraków: Instytut Geo-grafii i Gospodarki Przestrzennej. Uniwersytet Jagielloński.
MEIER W.N., GERLAND S., GRANSKOG M.A., KEY J.R., HAAS C., HOVELSRUD G.K., KOVACS K., MAKSHTAS A., MICHEL C., PEROVICH D., REIST J.D., VAN OORT B.E.H., 2011. Chapter 9: Sea ice [in:] Snow, Water, Ice and Permafrost in the Arctic (SWIPA): Climate Change and the Cryosphere, Oslo: Arctic Monitoring and Assessment Pro-gramme (AMAP).
NIEDŹWIEDŹ T., 2003. Słownik meteorologiczny. Warszawa: Polskie Towarzystwo Geofizyczne, In-stytut Meteorologii i Gospodarki Wodnej.
NIEDŹWIEDŹ T., 2006. Główne cechy cyrkulacji atmos-fery nad Spitsbergenem (XII.1950 – IX.2006). Pro-blemy Klimatologii Polarnej, no. 16, pp. 91-105.
NIEDŹWIEDŹ T., 2013a, Kalendarz typów cyrkulacji dla Spitsbergenu, zbiór komputerowy dostępny w Katedrze Klimatologii. Sosnowiec: Wydział Nauk o Ziemi Uniwersytetu Śląskiego.
NIEDŹWIEDŹ T., 2013b. The atmospheric circulation [in:] A.A. Marsz, A. Styszyńska, (ed.), Climate and climate change in Hornsund, Svalbard, Gdynia: Gdynia Maritime University, pp. 57-74.
NIEDŹWIEDŹ T., ŁUPIKASZA E., 2015. Dynamika wskaź-ników cyrkulacji nad Spitsbergenem. Problemy Klimatologii Polarnej, 25, pp. 153-167.
NIEDŹWIEDŹ T., USTRNUL Z., 1989. Wpływ cyrkulacji atmosferycznej na kształtowanie się zachmurze-nia w Hornsundzie [in:] A. Olszewski, Dorobek i perspektywy Polskich Badań Polarnych: XVI Sympozjum Polarne, Toruń: Uniwersytet Mikołaja Kopernika, pp. 158-160.
PALM S.P., MARSHAK A., YANG Y., SPINHIRNE J., MARKUS T., 2010. The influence of Arctic sea ice extent on polar cloud fraction and vertical structure and implications for regional climate. Journal of Geophysical Research, vol. 115, no. D21, DOI: 10.1029/2010JD013900.
POLYAKOV I.V., WALSH J.E., KWOK R., 2012. Recent changes of Arctic multiyear sea ice coverage and the likely causes. Bulletin of the American Me-teorological Society, vol. 93, no. 2, pp. 145-151.
PRZYBYLAK R., 2003. The climate of the Arctic. At-mospheric and Oceanographic Science Library, vol.26, Dordrecht: Kluwer Academic Publishers.
PRZYBYLAK R., 2007. Współczesne zmiany klimatu w Arktyce [in:] A. Styczyńska, A.A. Marsz (ed.), Zmiany klimatyczne w Arktyce i Antarktyce w ostatnim pięćdziesięcioleciu XX wieku i ich implikacje środowiskowe, Gdynia: Wydawnictwo Uczelniane Akademii Morskiej, pp. 93-110.
RAATZ W.E., 1981. Trends in cloudiness in the Arctic since 1920. Atmospheric Environment, vol. 15, no. 8, pp. 1503-1506.
SCHWEIGER A., 2004. Changes in seasonal cloud cover over the Arctic seas from satel-lite and surface observations. Geophysical Research Letters, vol. 31, no. 12, L12207, DOI: 10.1029/2004GL020067.
SCHWEIGER A., KEY J.R., 1992. Arctic cloudiness: comparison of ISCCPC2 and NIMBUS-7 satel-lite-derived cloud products with a surface based climatology. Journal of Climate, vol. 5, no. 12, pp. 1514-1527.
SOROKA J., MATUSZKO D., 2013. Trudności w wizual-nej ocenie zachmurzenia w Hornsundzie. Proble-my Klimatologii Polarnej, 23, pp. 147-156.
STROEVE J.C., SERREZE M.C., HOLLAND M.M., KAY J.E., MALANIK J., BARRETT A.P., 2012. The Arc-tic’s rapidly shrinking sea ice cover: A research synthesis. Climatic Change, vol. 110, nos. 3-4, pp. 1005-1027

38 Ewa Łupikasza • Oskar Lipiński
© Ewa Łupikasza • Oskar Lipiński© Geographia Polonica© Institute of Geography and Spatial Organization
Polish Academy of Sciences • Warsaw • 2017
Article first received • September 2016Article accepted • December 2016
TURNER J., GARETH J.M., 2011. Climate change in the polar regions. Cambridge-New York: Cam-bridge University Press.
USTRNUL Z., 2007. Warunki cyrkulacyjne [in:] Ma-tuszko (ed.), Klimat Krakowa w XX wieku, Kraków: Krakó w: Instytut Geografii i Gospodarki Prze-strzennej. Uniwersytet Jagielloń ski, pp. 21-40.
VAVRUS S.J., BHATT U.S., ALEXEEV V.A., 2011. Fac-tors influencing simulated changes in future Arc-tic cloudiness. Journal of Climatology, vol. 24, no. 18, pp. 4817-4830.
VOWINCKEL E., ORVIG S., 1962. Relation between solar radiation income and cloud type in the Acr-tic. Journal of Applied Meteorology, vol. 1, no. 4, pp. 552-559.
WEBBER G.R., 1994. On the seasonal variation of local relationship between temperature, tem-perature range, sunshine and cloudiness. Theo-retical and Applied Climatology, vol. 50, nos. 1-2, pp. 15-22.
WILKS D.S., 2006. Statistical methods in the atmos-pheric sciences. International Geophysics Series, vol. 91, Amsterdam: Elsevier.
Online sourceshttp://eklima.met.no [5 June 2014].http://hornsund.igf.edu.pl/hornsund.old/swiatlo.html
[2 September 2016].http://www.ogimet.com [17 July 2016].
http://rcin.org.pl