geog3839.9: climate from trees
TRANSCRIPT


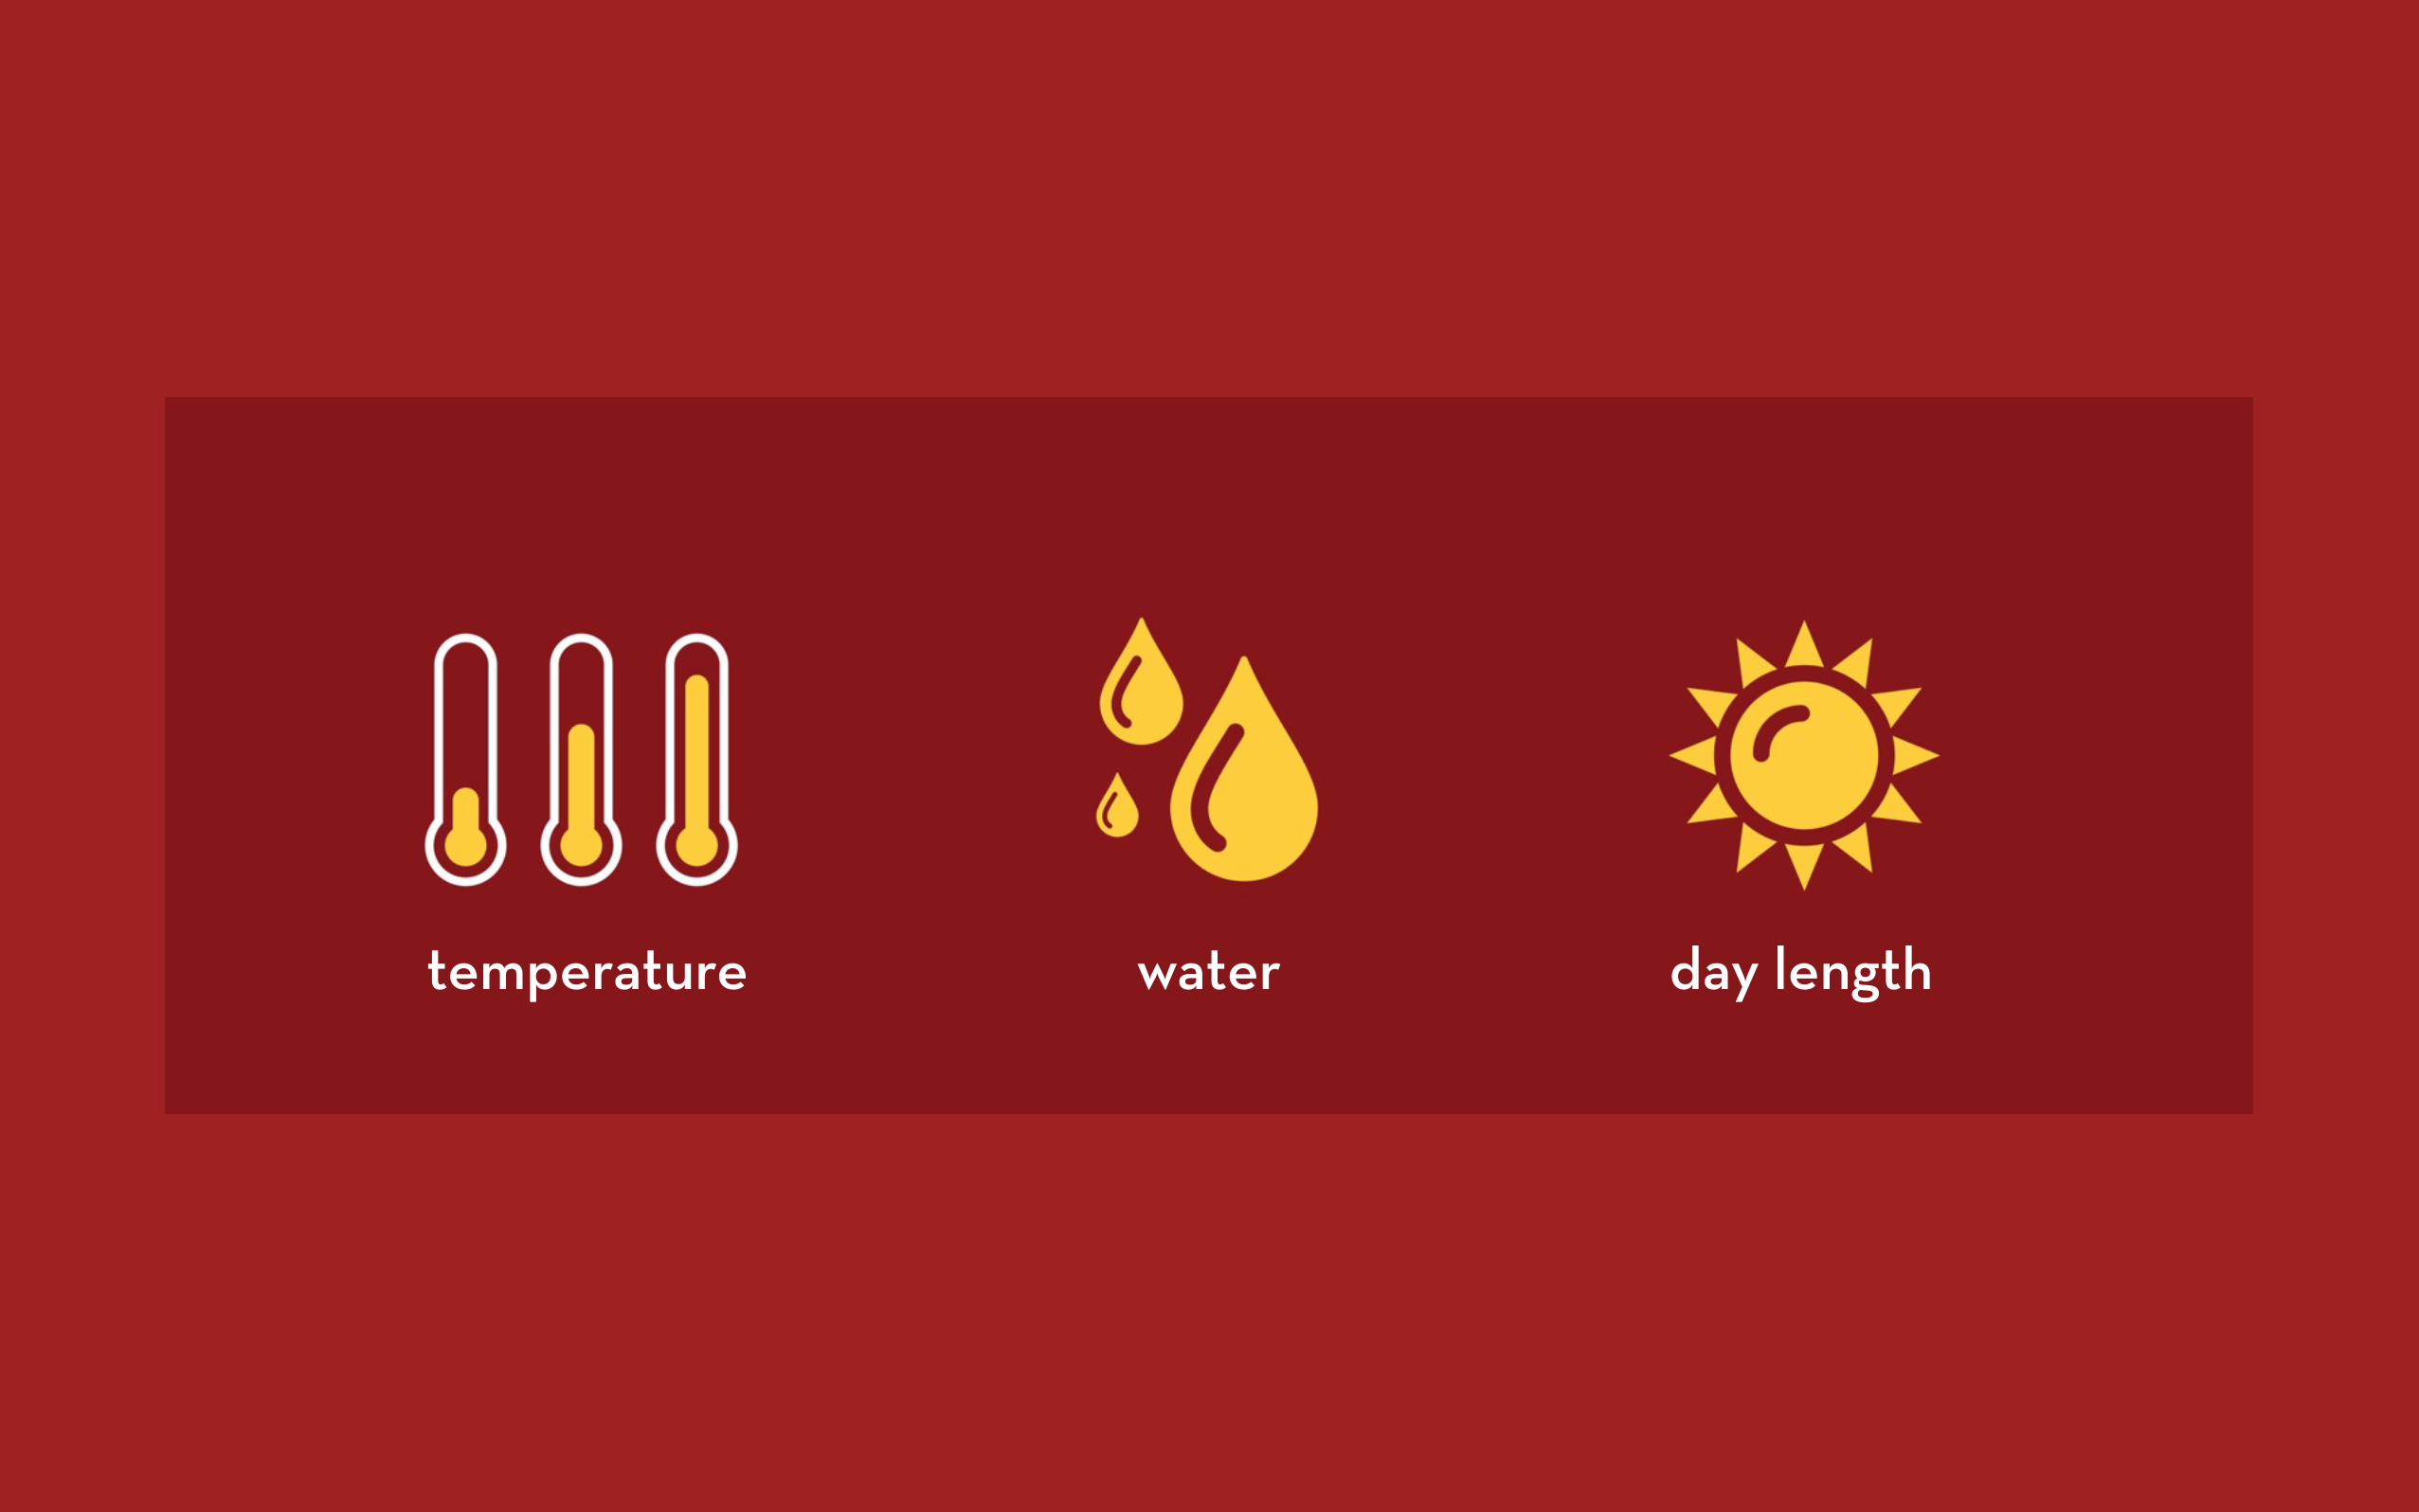
temperature water day length

THE PRINCIPLE OF
ECOLOGICAL AMPLITUDE
THE PRINCIPLE OF
SITE SELECTION
THE PRINCIPLE OF
AGGREGATE TREE GROWTH
THE PRINCIPLE OF
REPLICATION
STANDARDIZATION
THE PRINCIPLE OF
CROSS-DATING

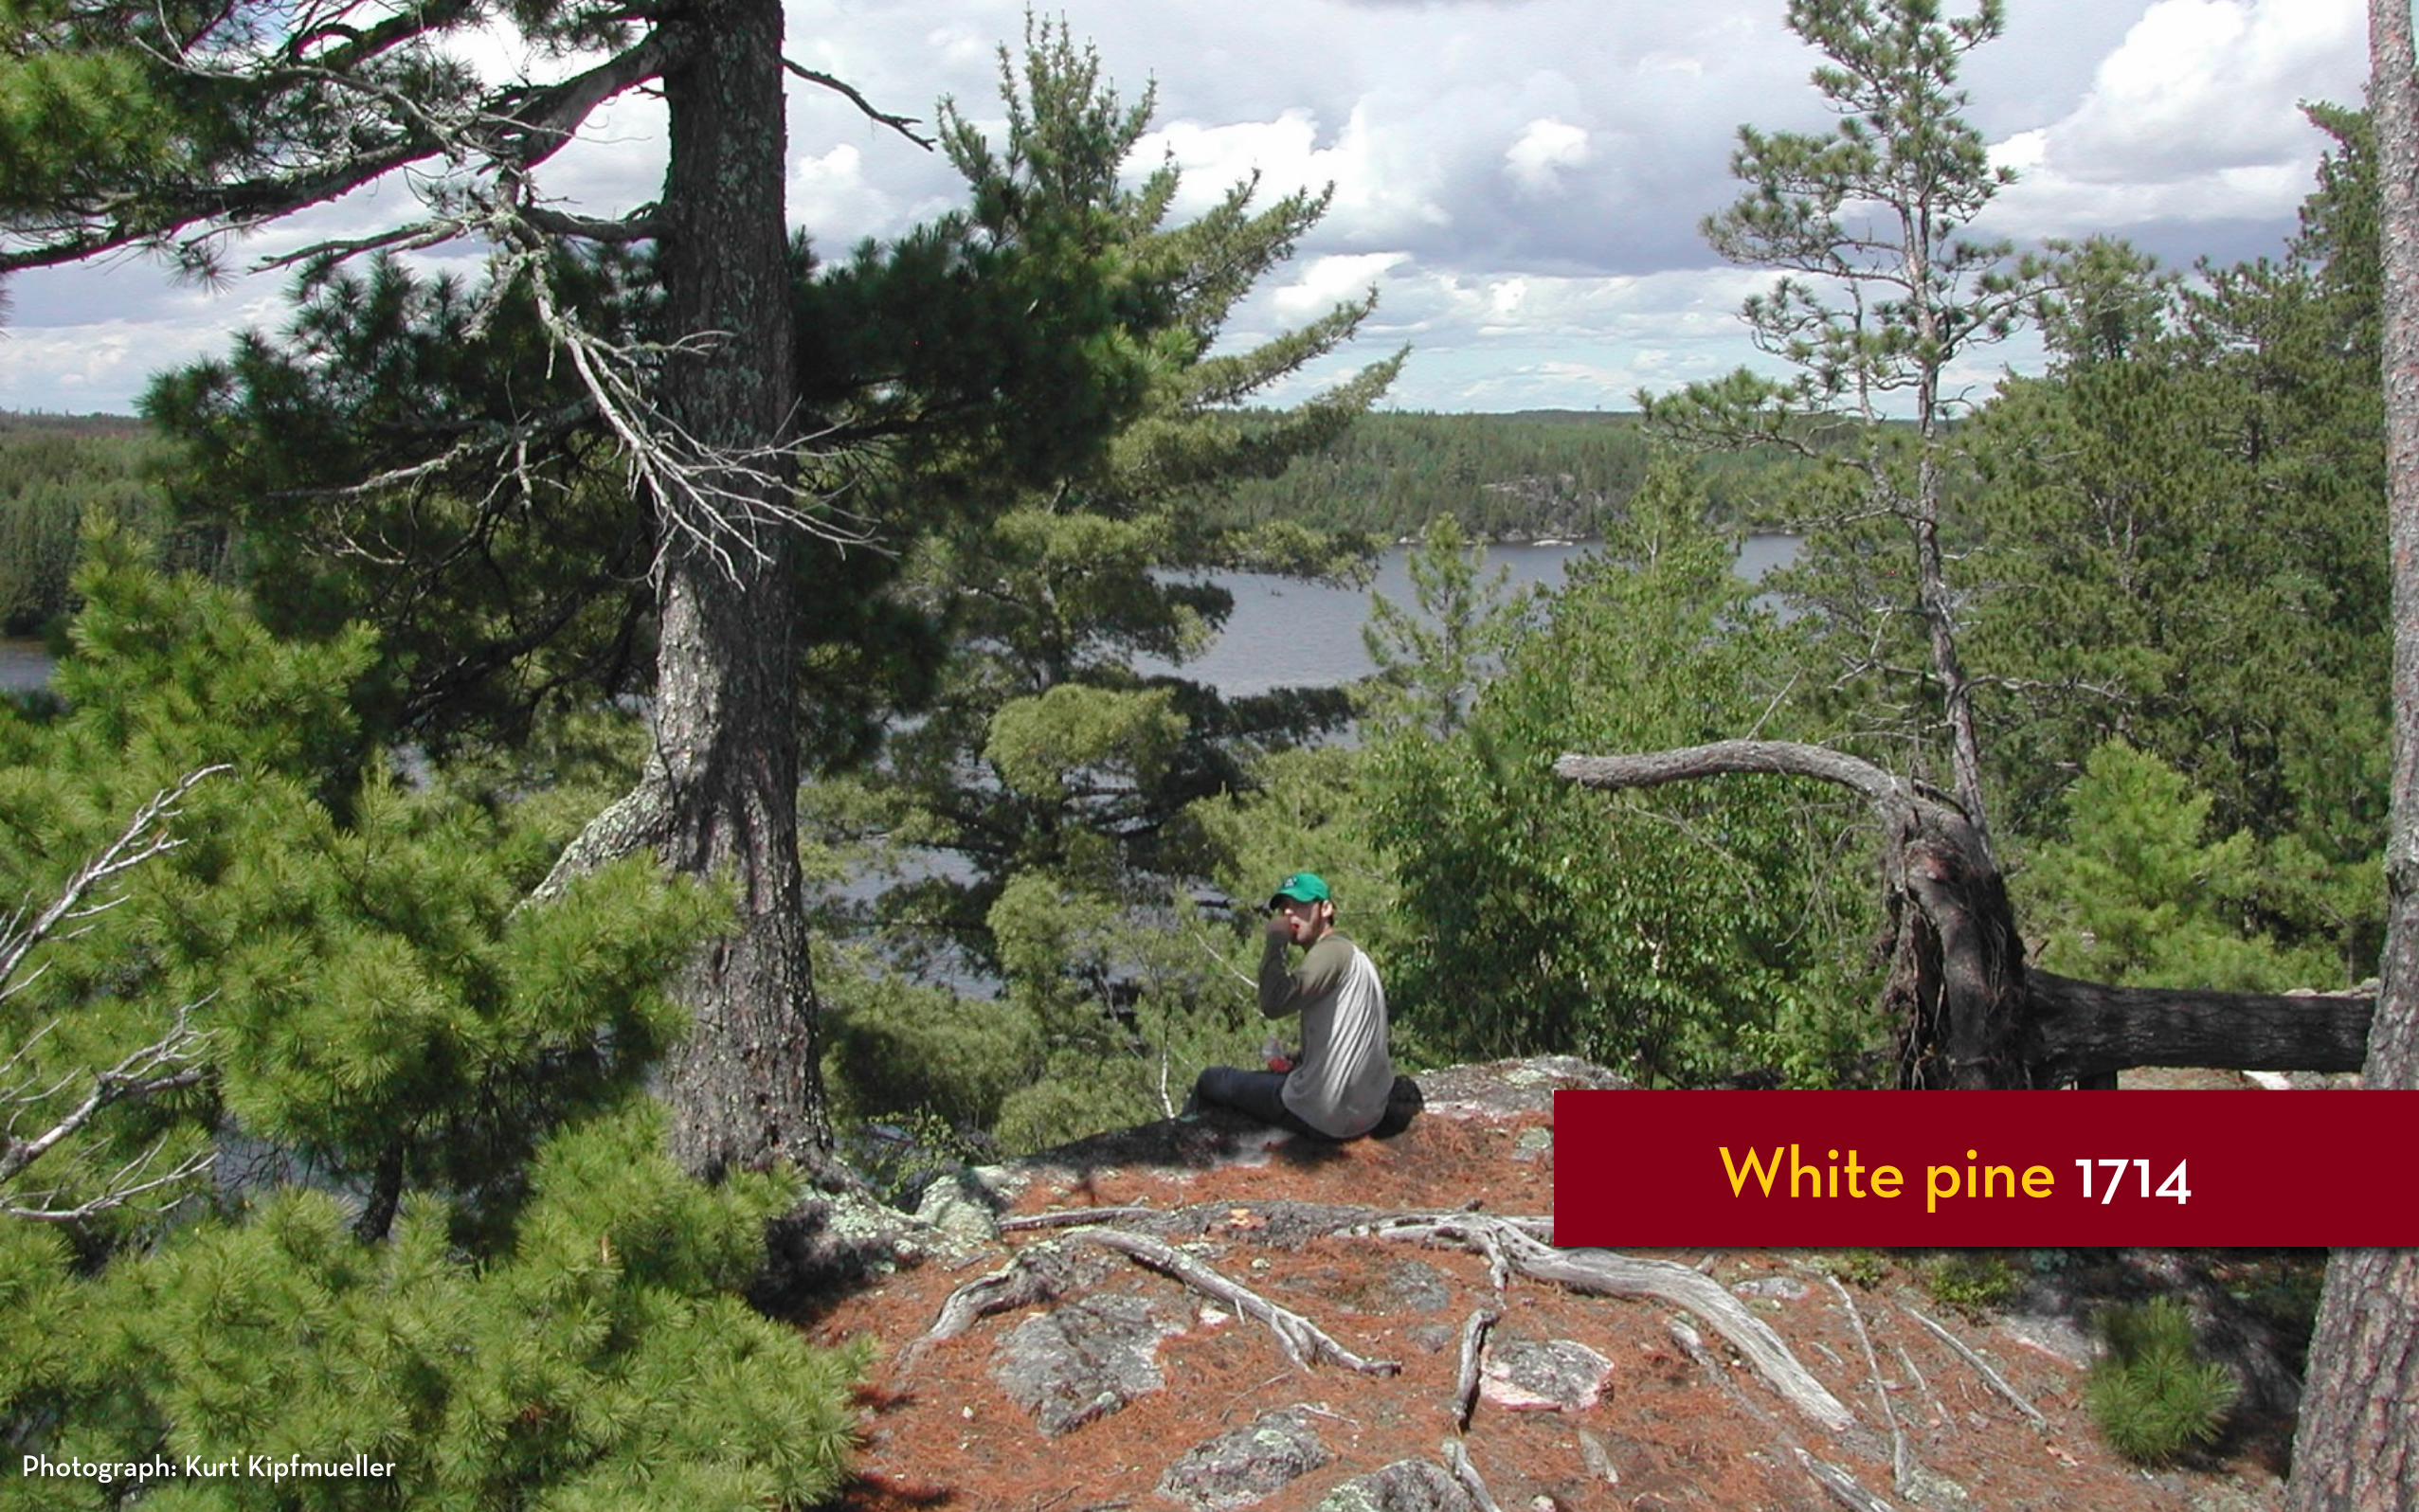
White pine 1714
Photograph: Kurt Kipfmueller

C L I M AT E F R O M T R E E S
Photograph: RawheaD Rex

empirical Information gained by means of observation, experience or experiment.


Photograph: Minyoung Choi

h!p://sokar.geo.umn.edu/weather/
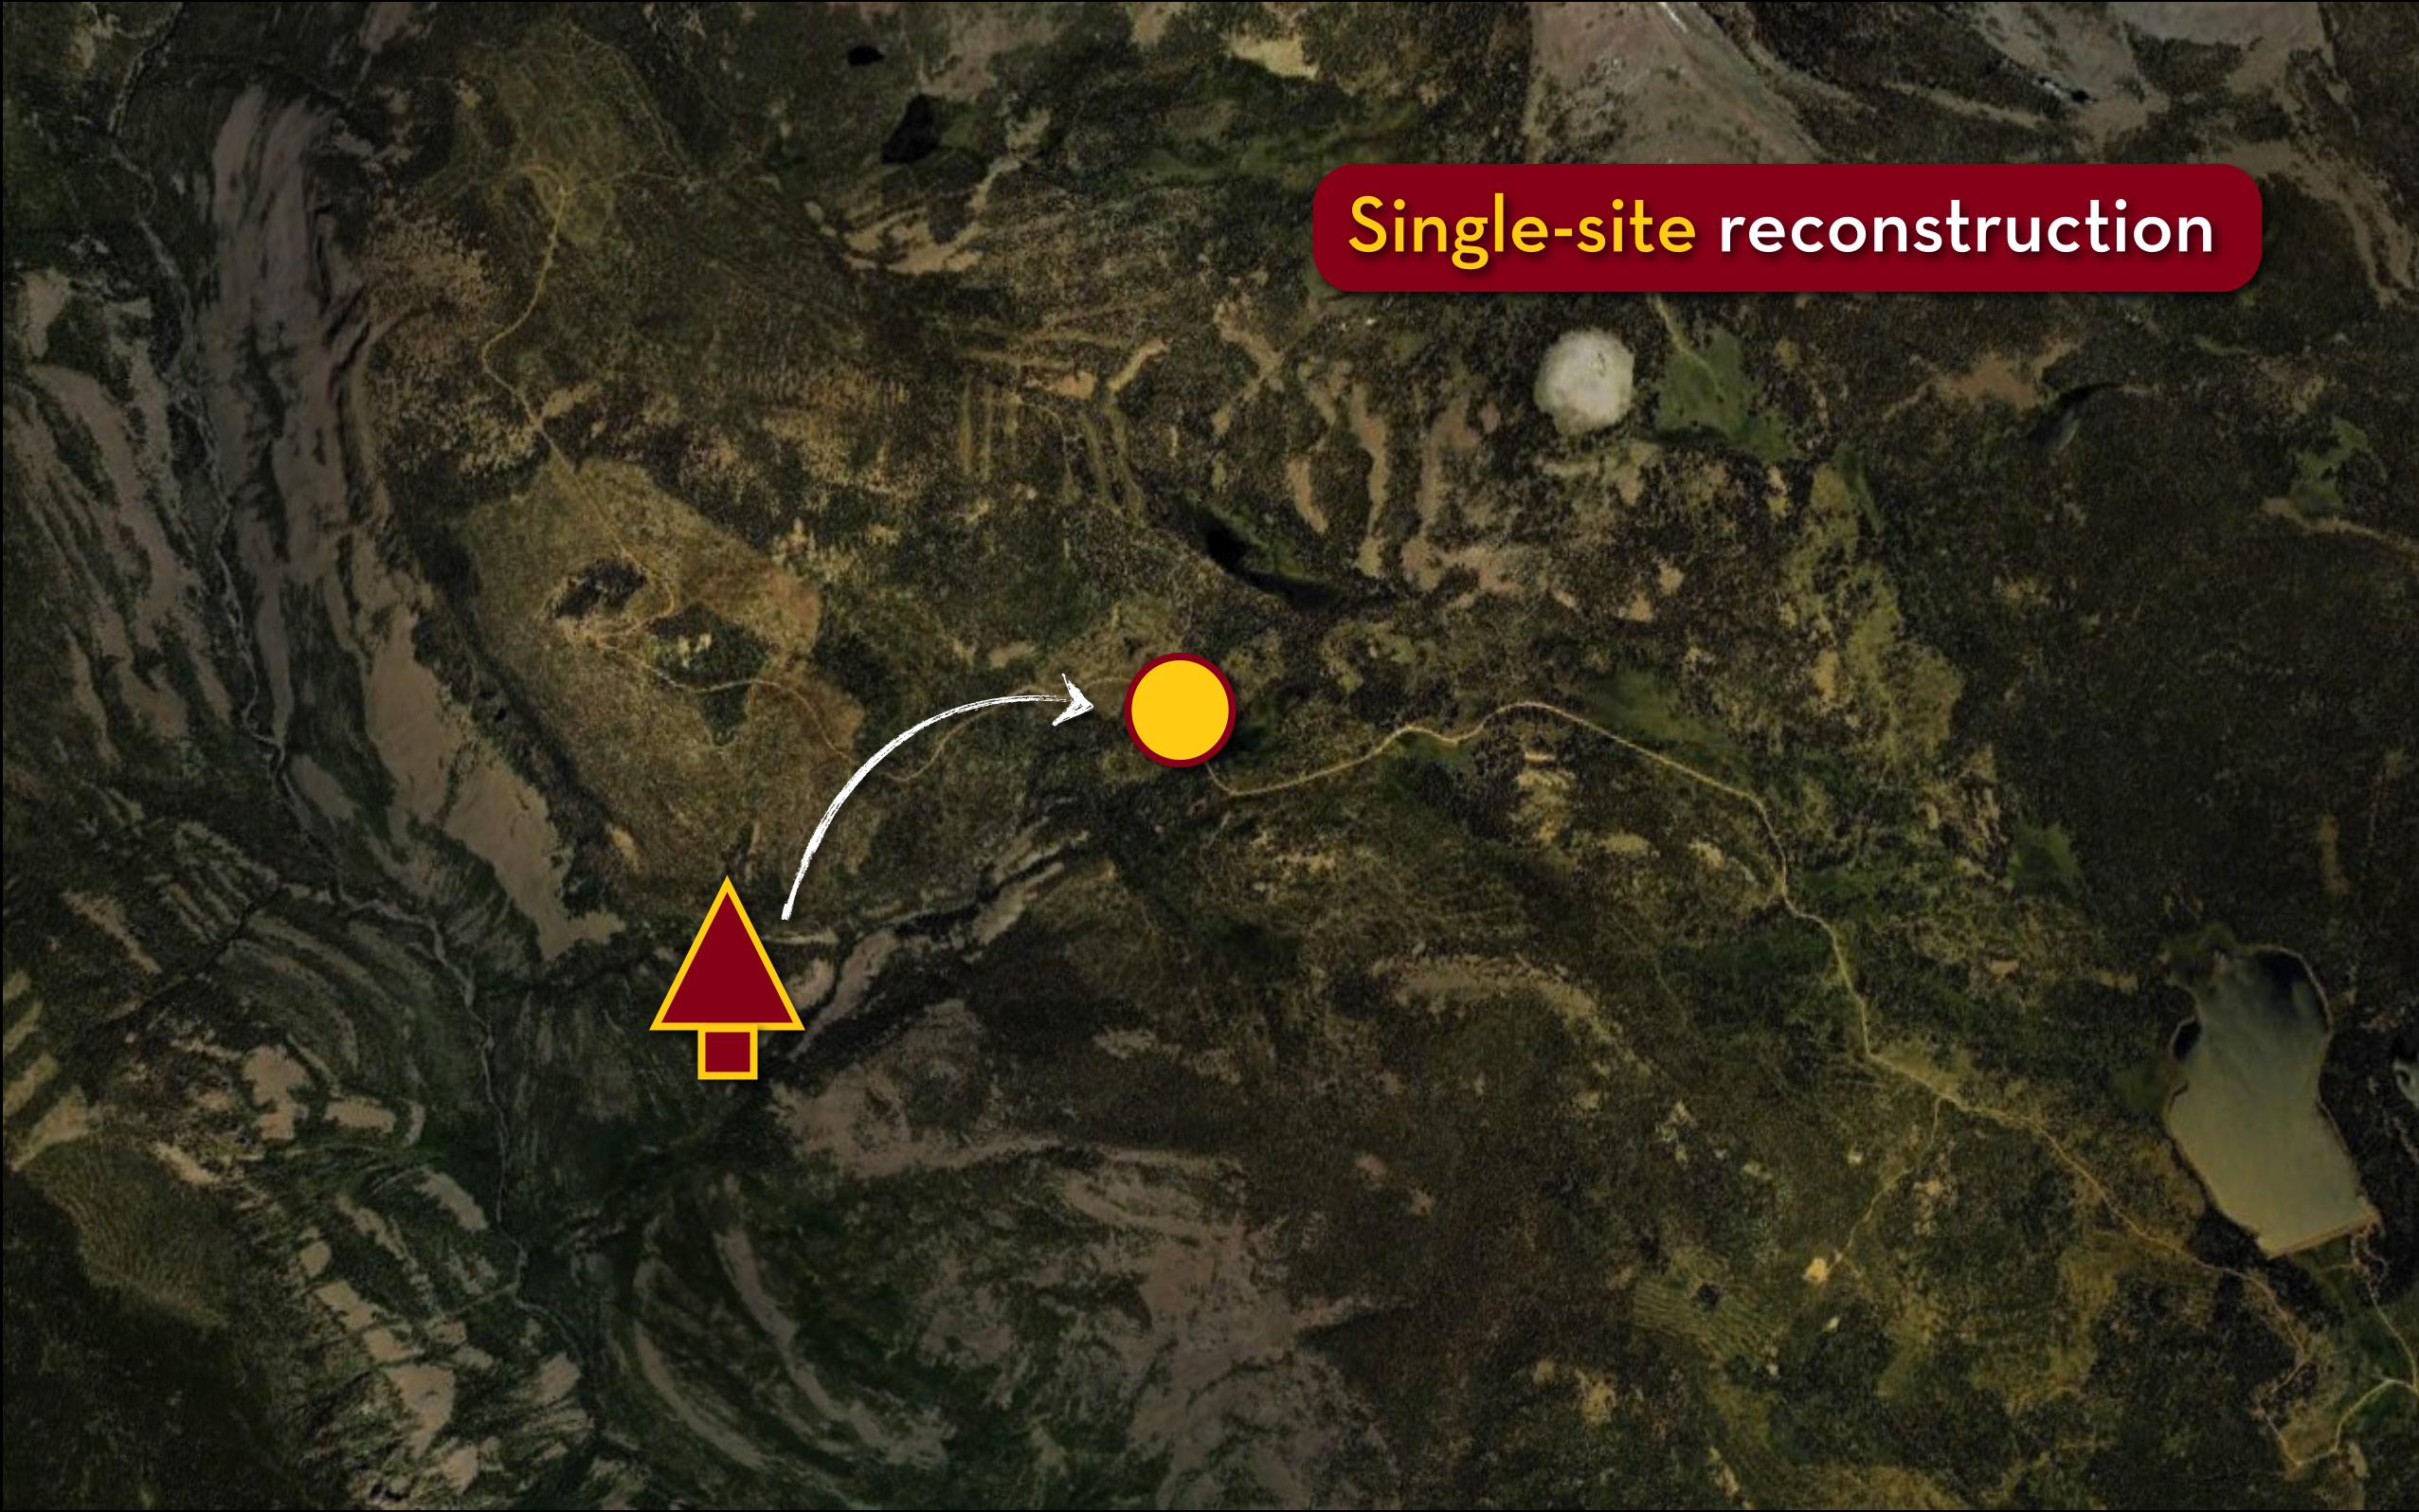
Single-site reconstruction

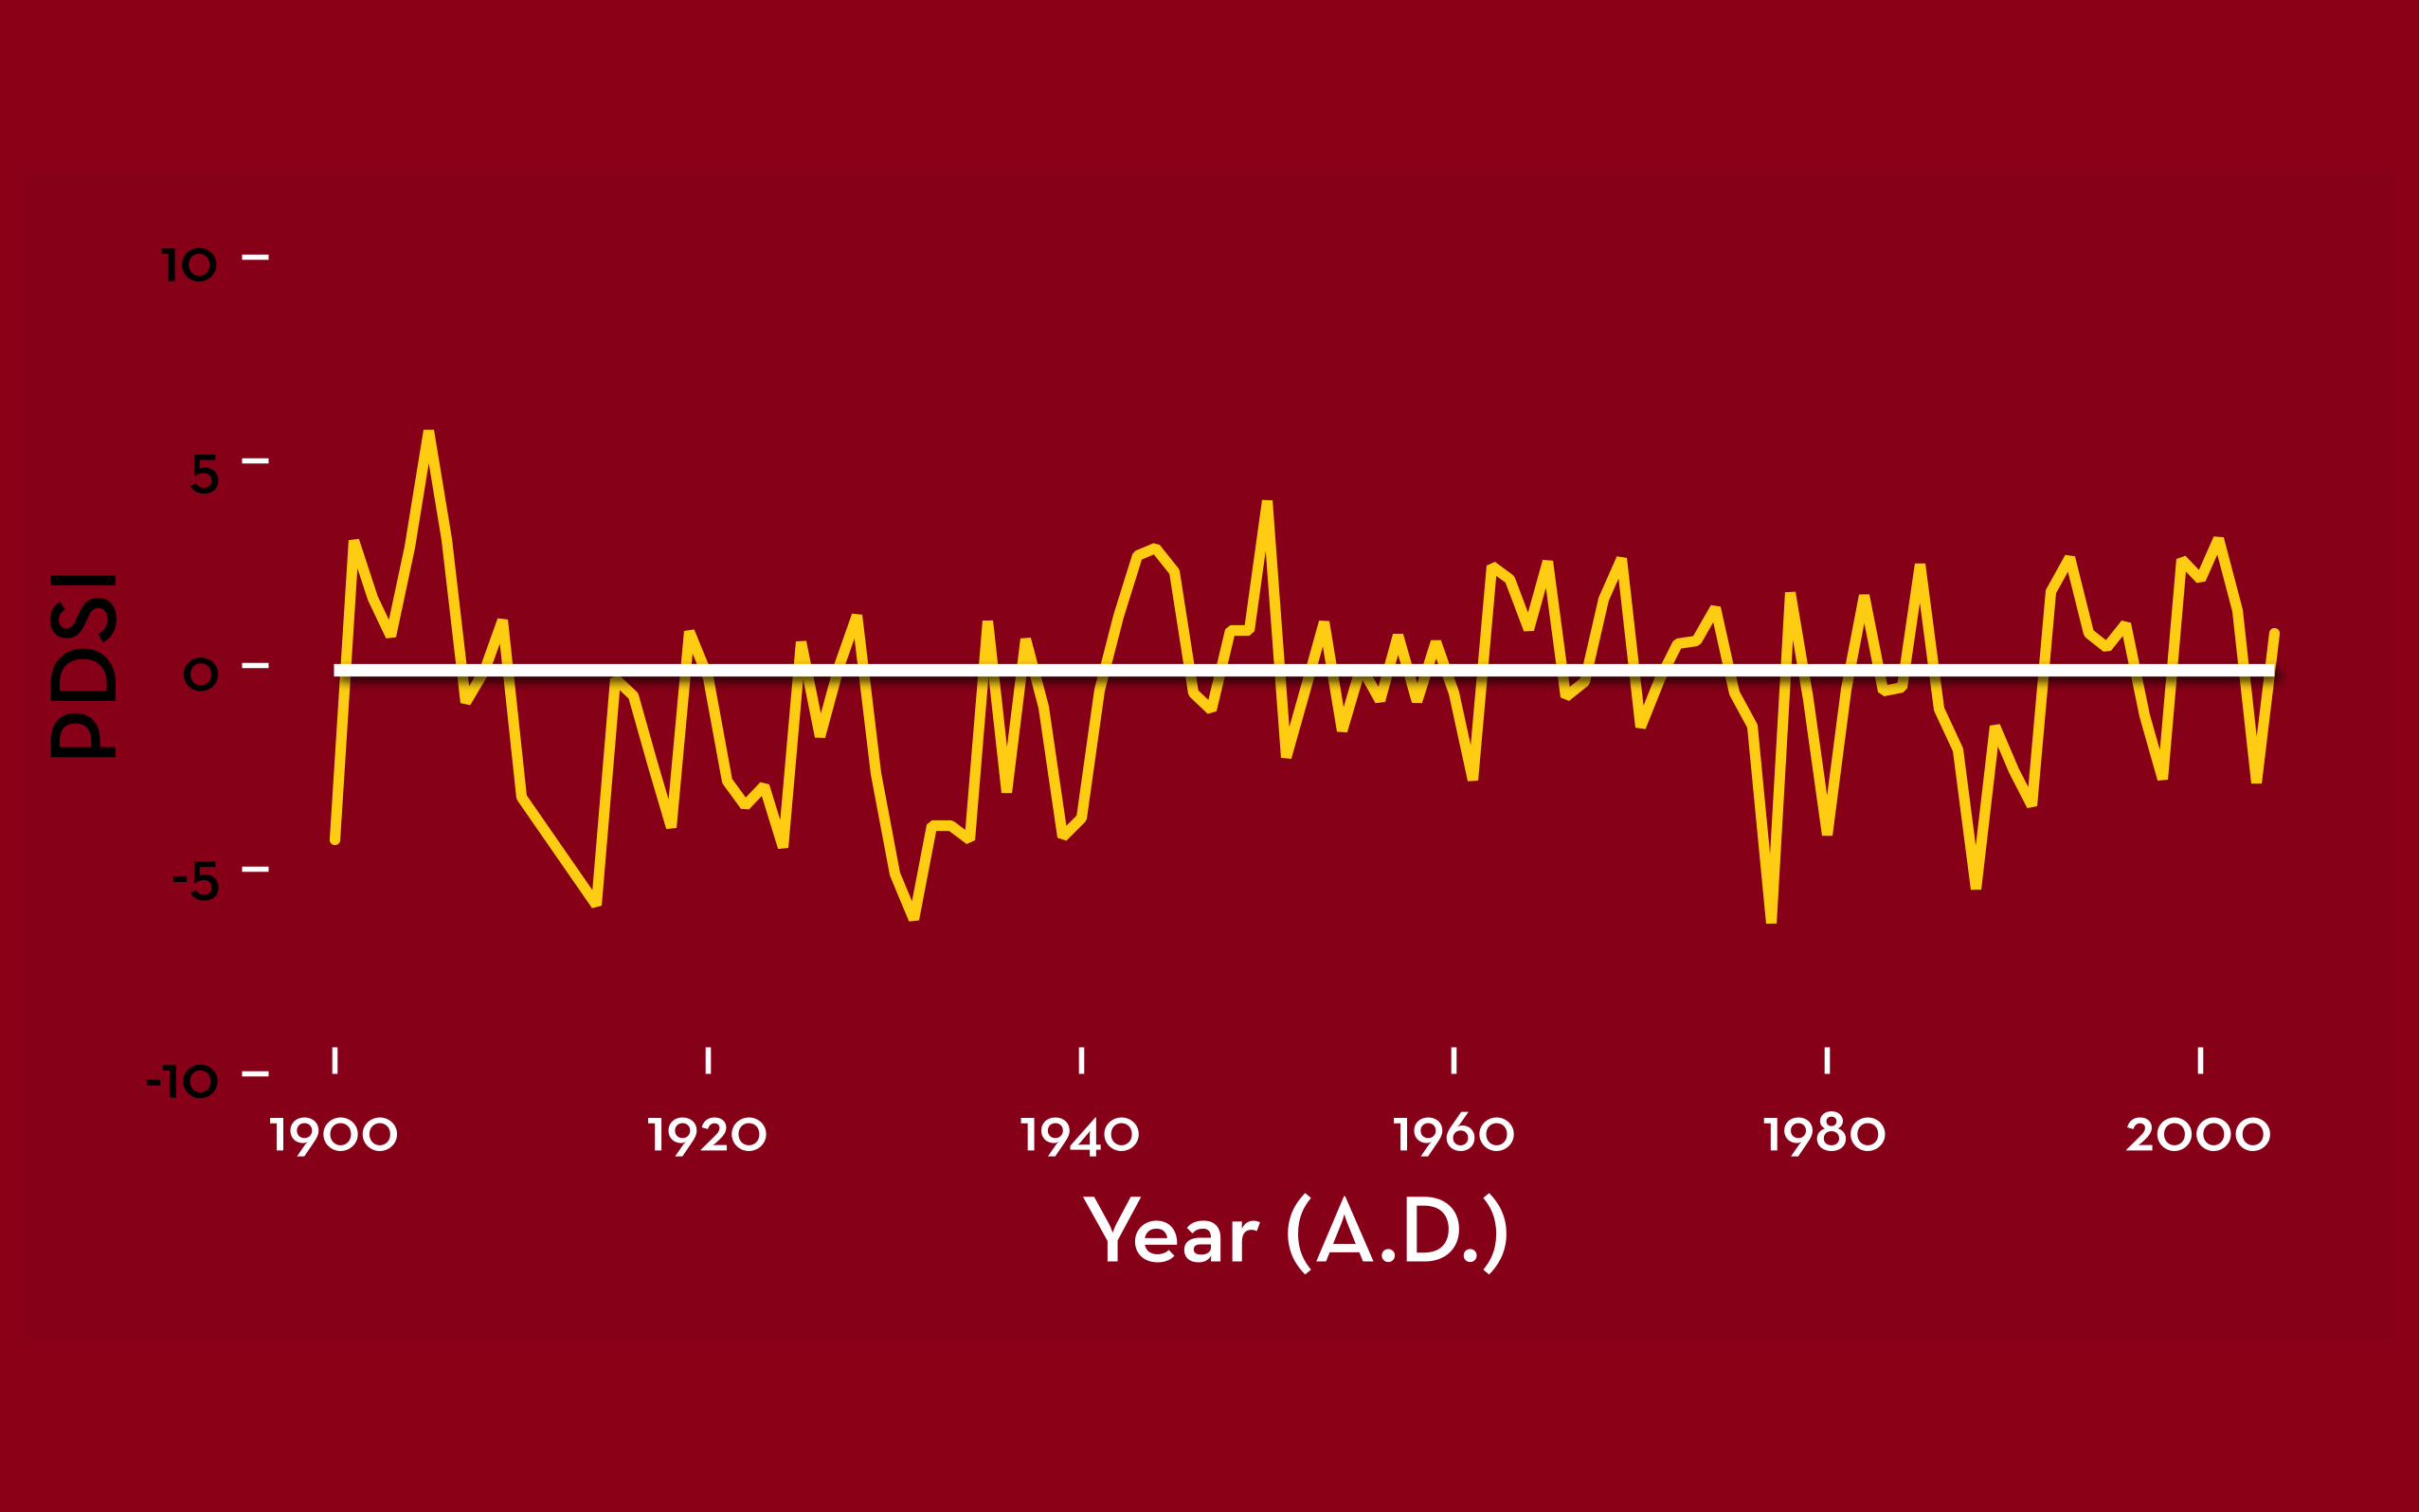
A time series is a set of observations ordered in time.

1900 1920 1940 1960 1980 2000
Year (A.D.)
-10
-5
0
5
10
PDSI
resolutionannual
chronological uncertaintysub-annual
time spanlast century
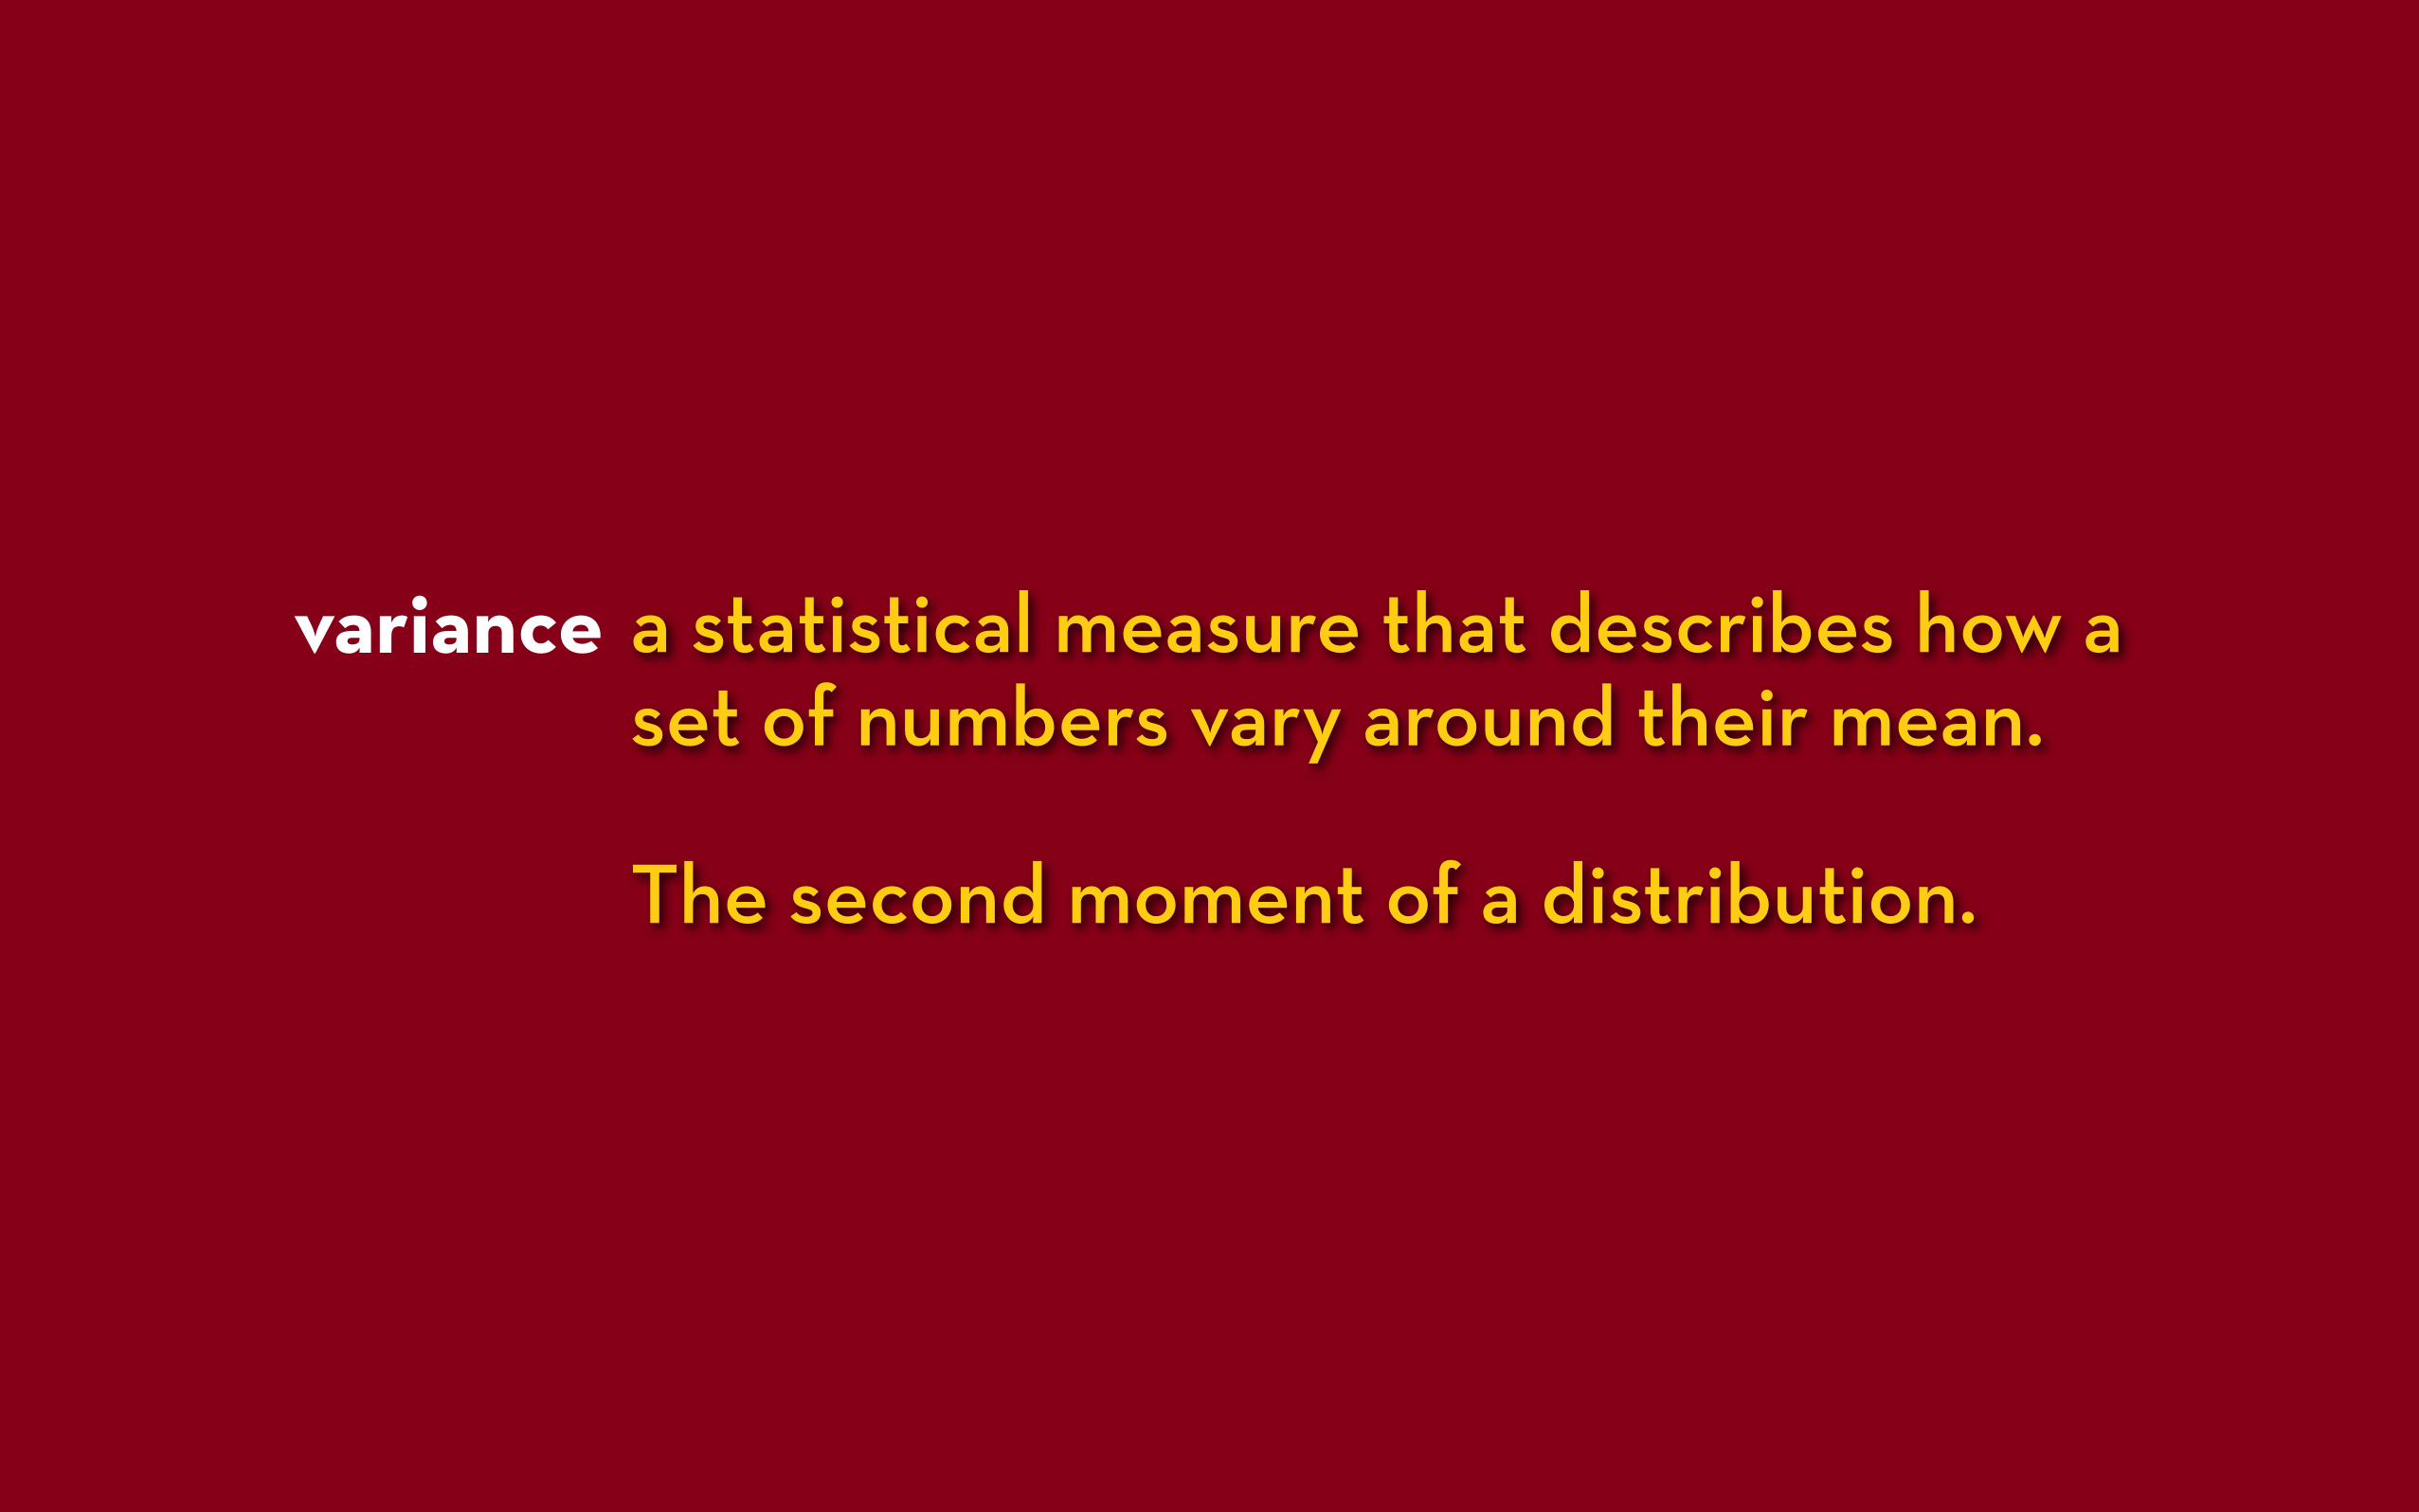
a statistical measure that describes how a set of numbers vary around their mean.
The second moment of a distribution.
variance

Variance
samplesize
variance observation
sample mean
1900 1920 1940 1960 1980 2000
Year (A.D.)
-10
-5
0
5
10
PDSI

empirical comparisons

Source: Hughes et al., 1999
tree rings
thermometers

Source: Hughes and Funkhouser, 1998
tree rings
rain gauges

correlation The Pearson product-moment correlation coefficient is probably the single most widely used statistic for summarizing the relationship between two variables.
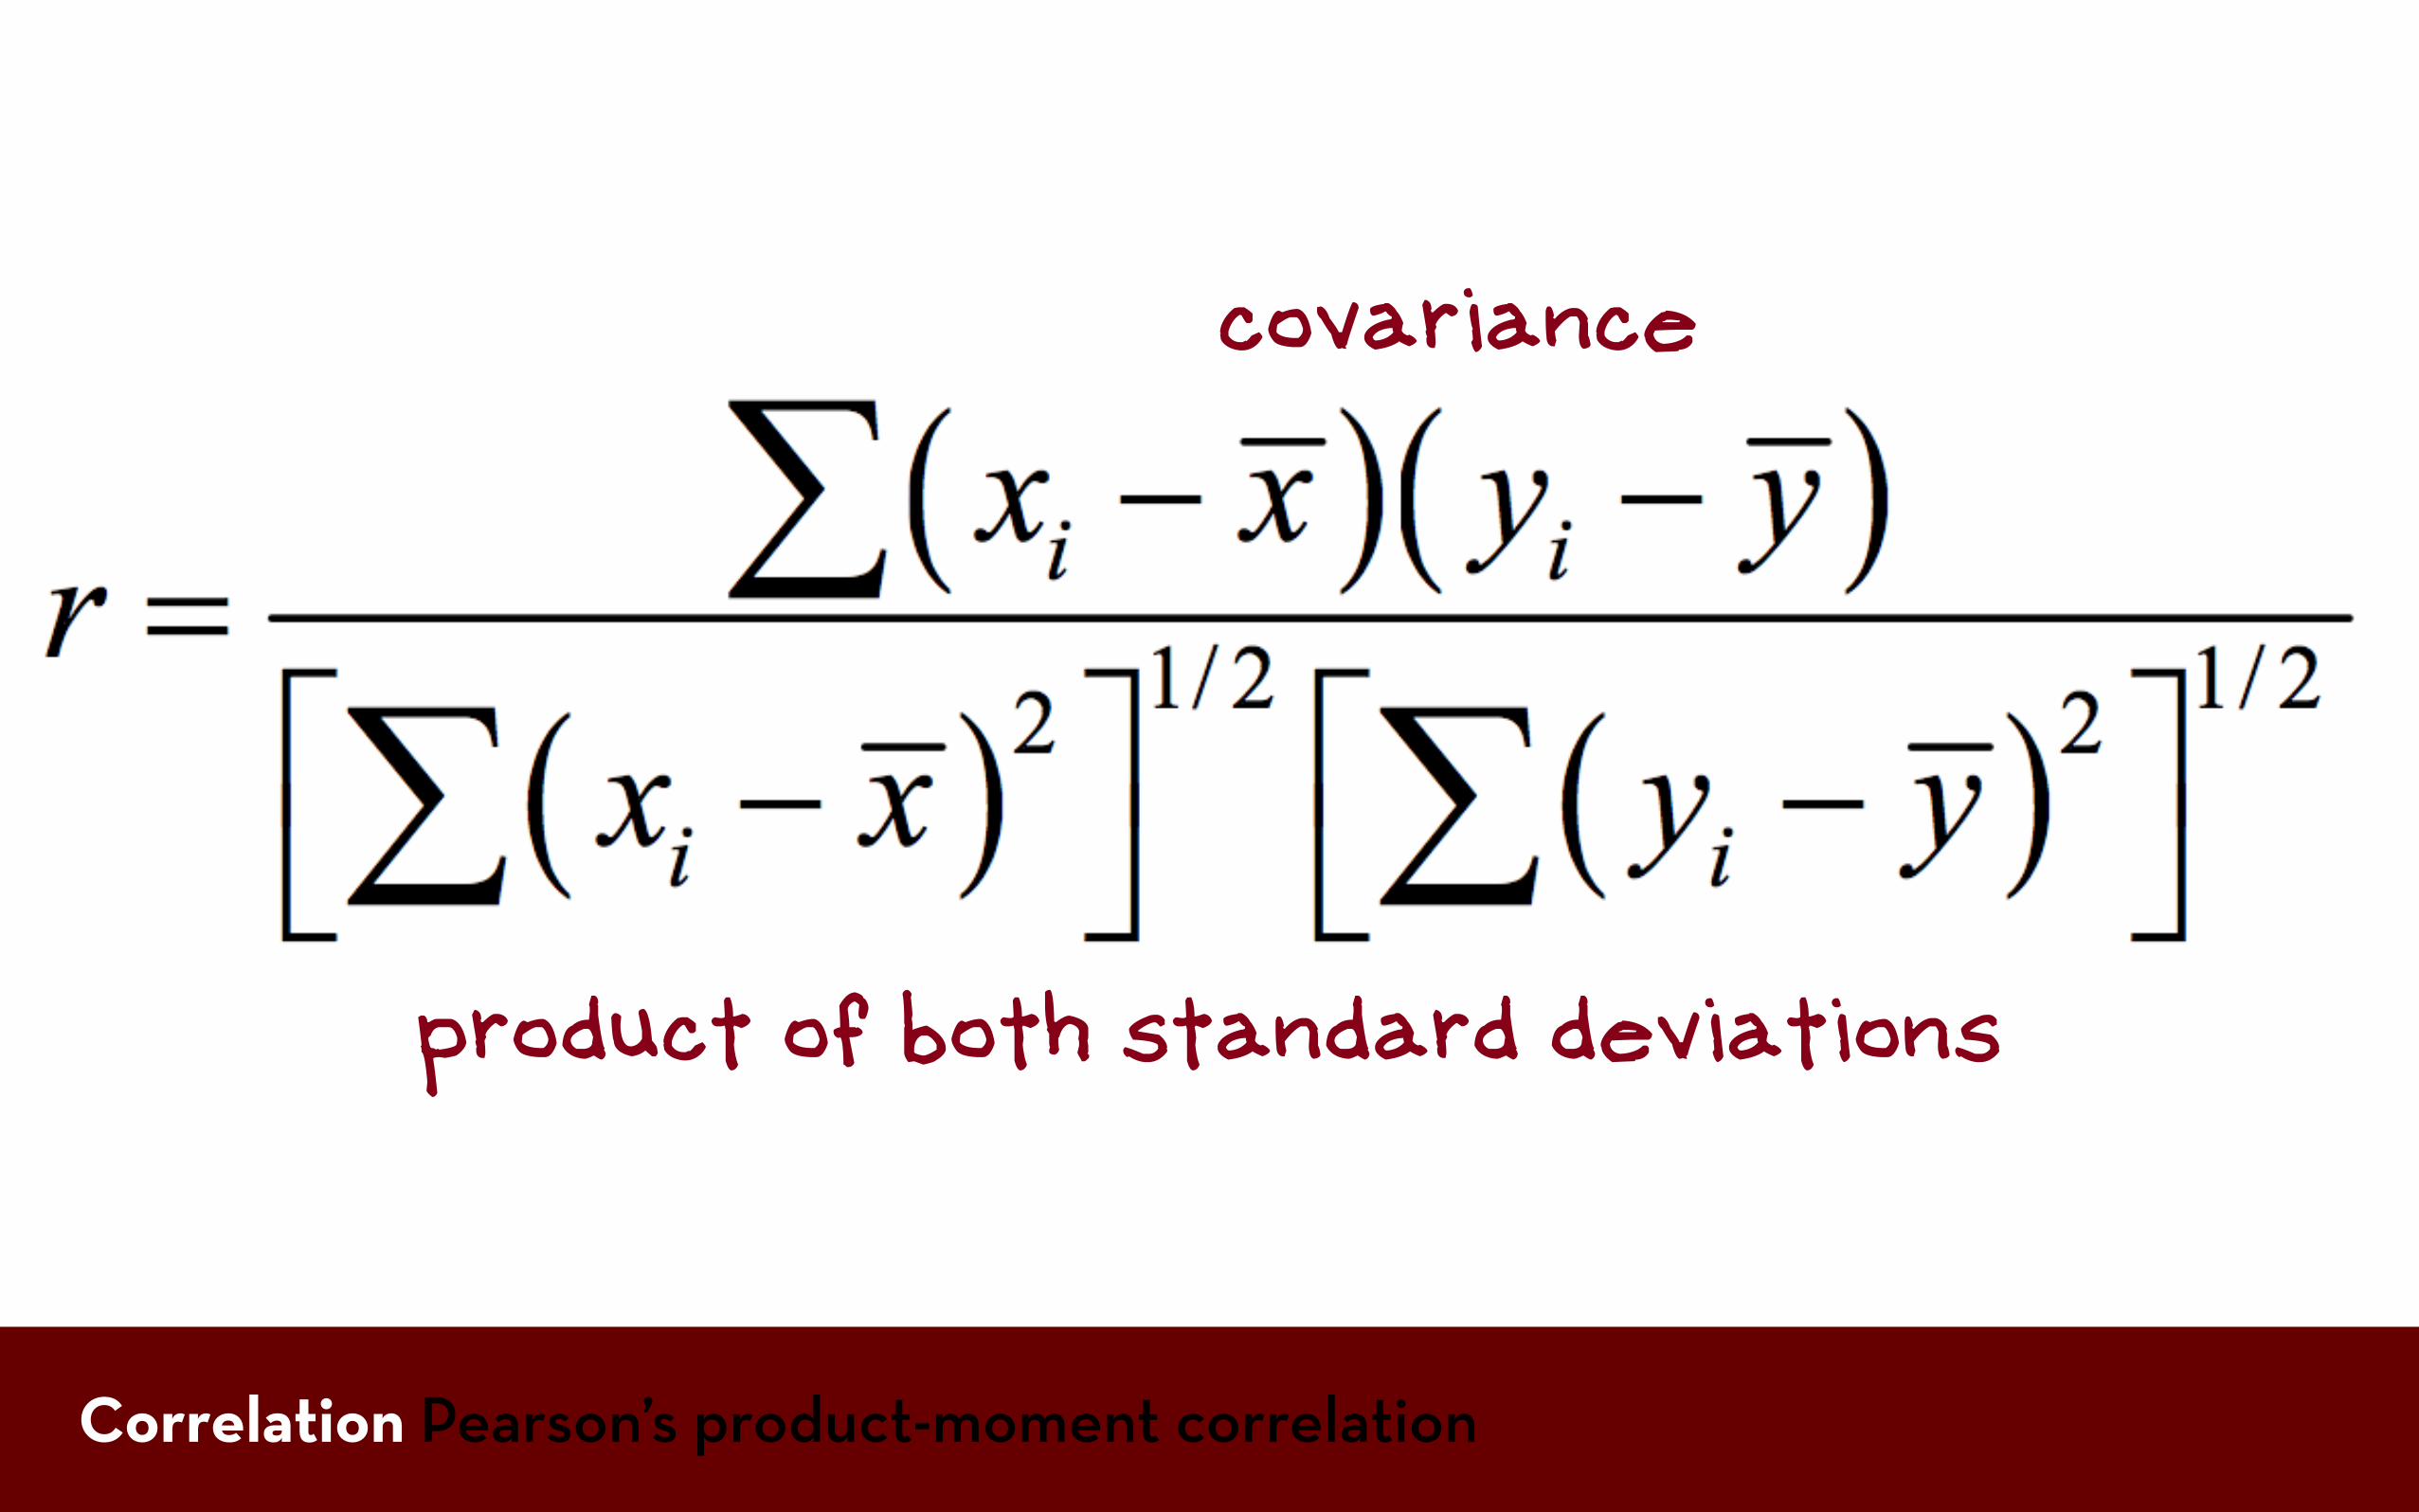
Correlation Pearson’s product-moment correlation
covariance
product of both standard deviations
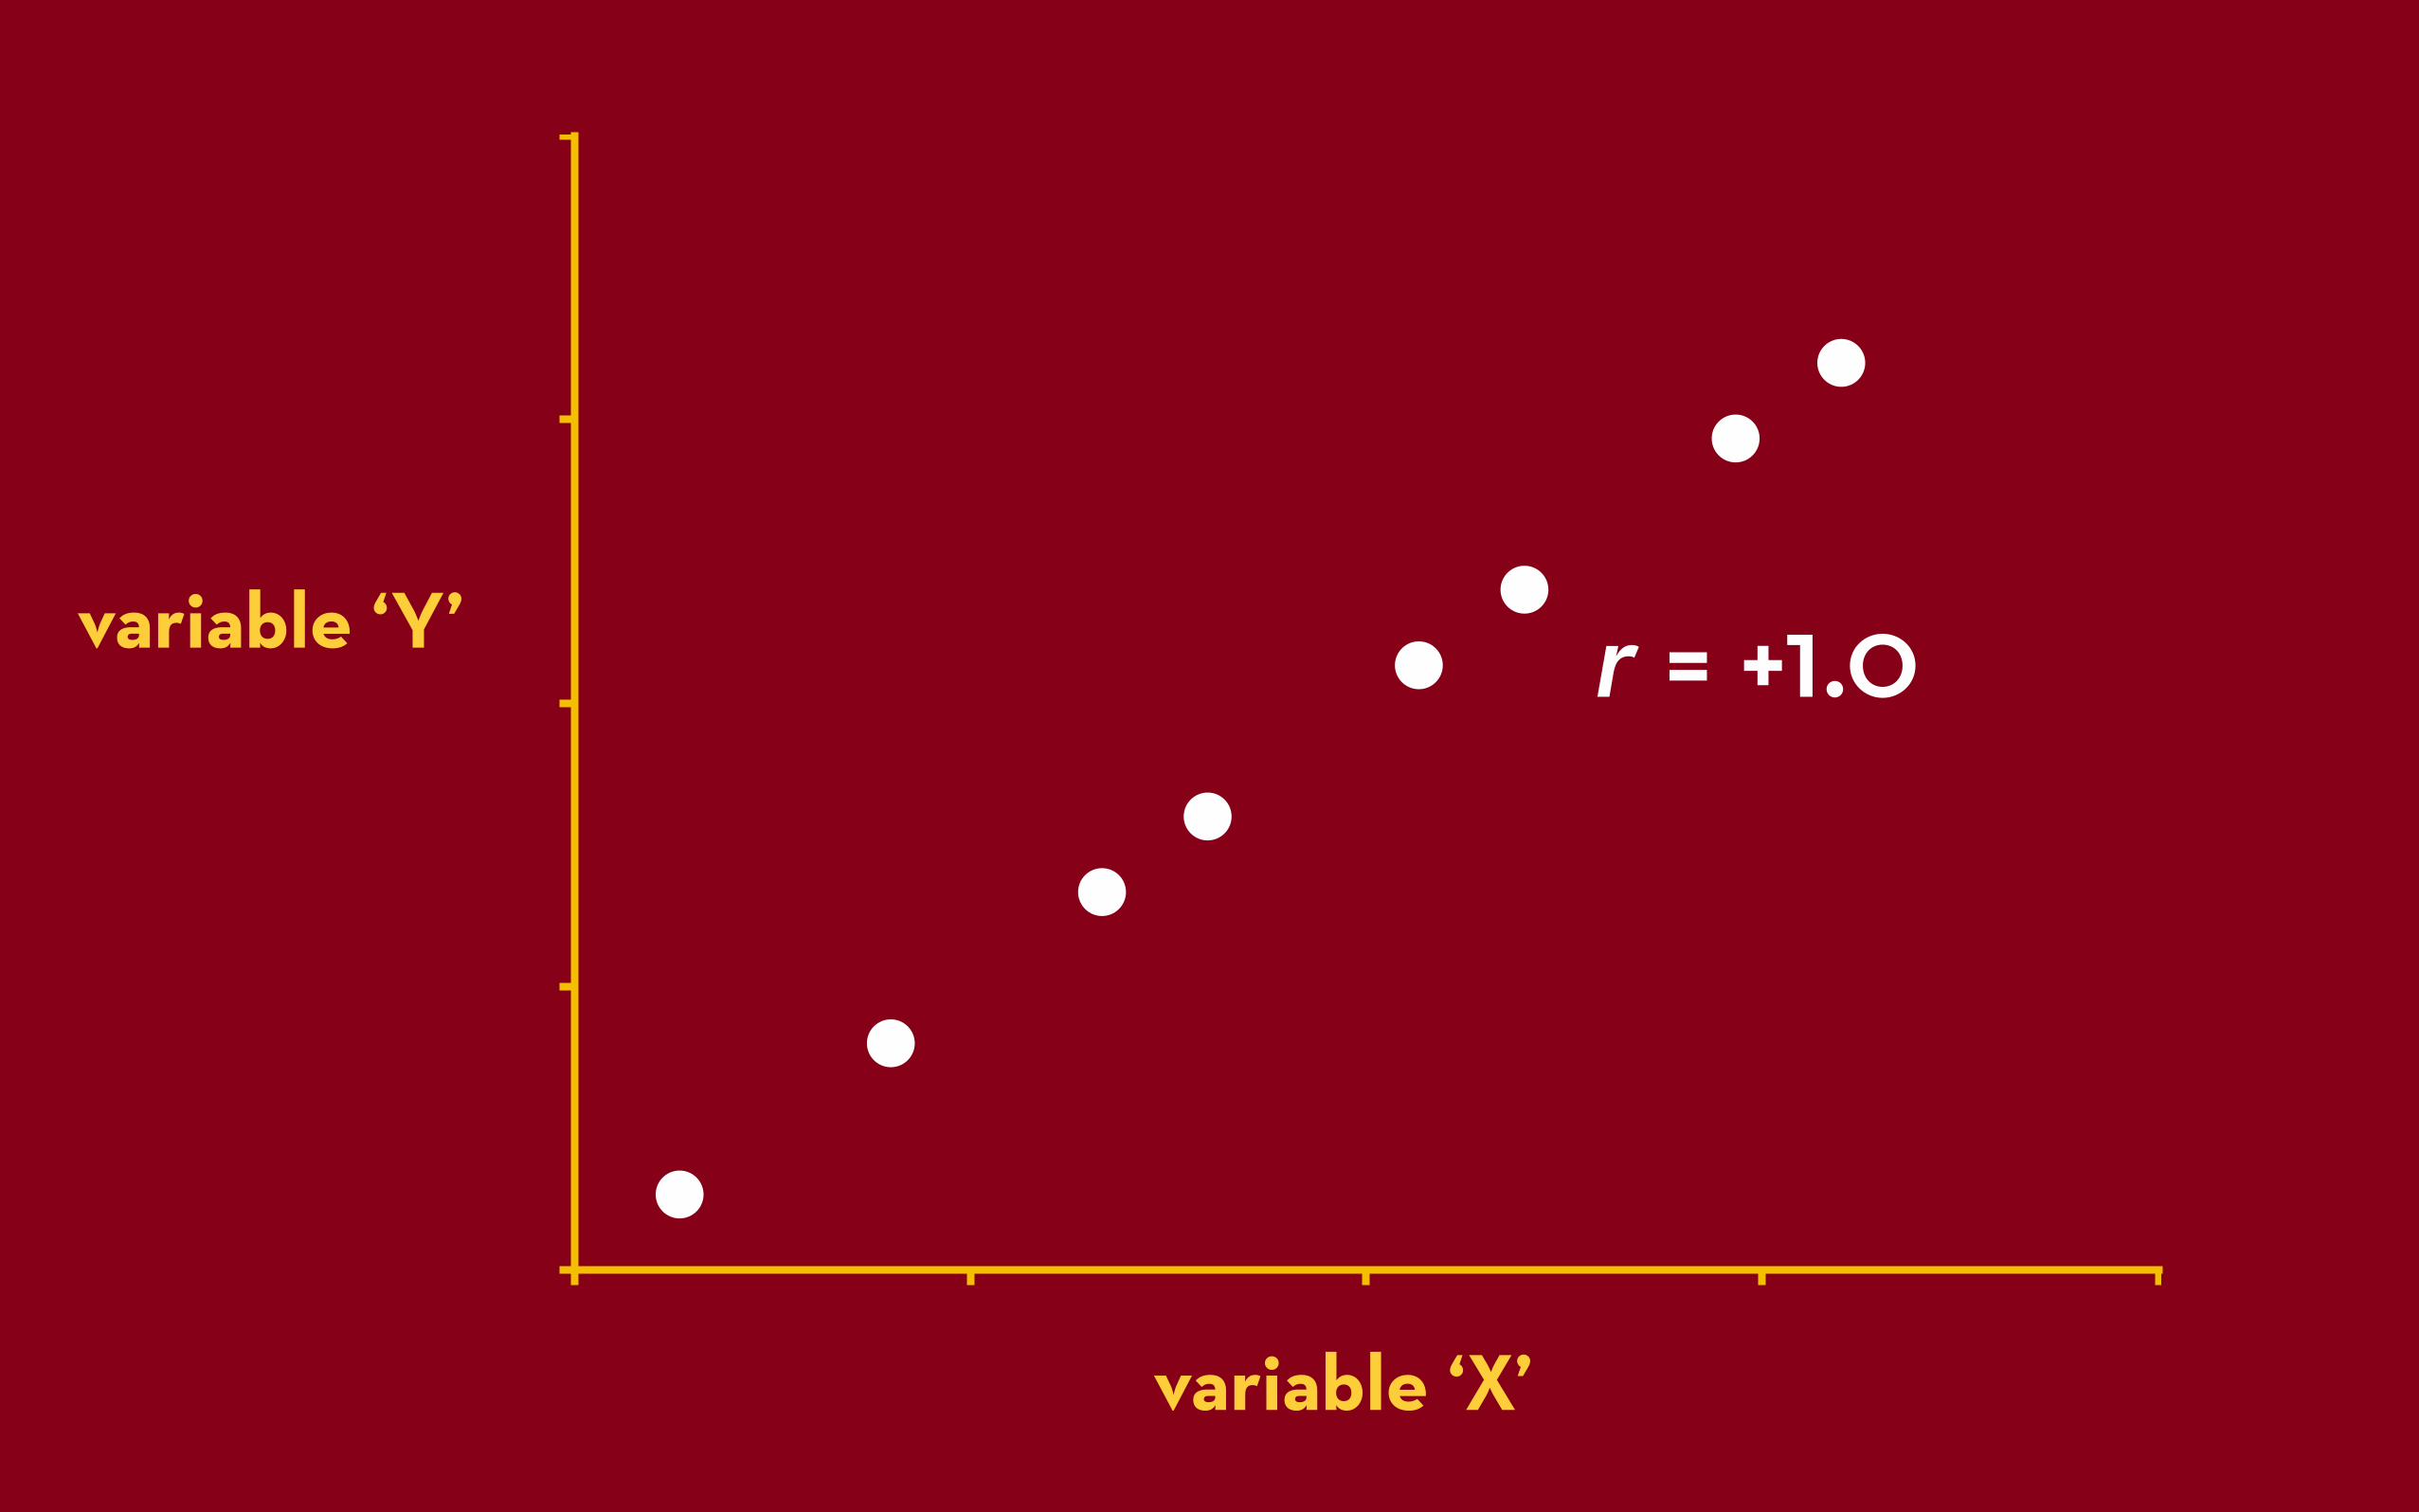
variable ‘X’
variable ‘Y’ r = +1.0
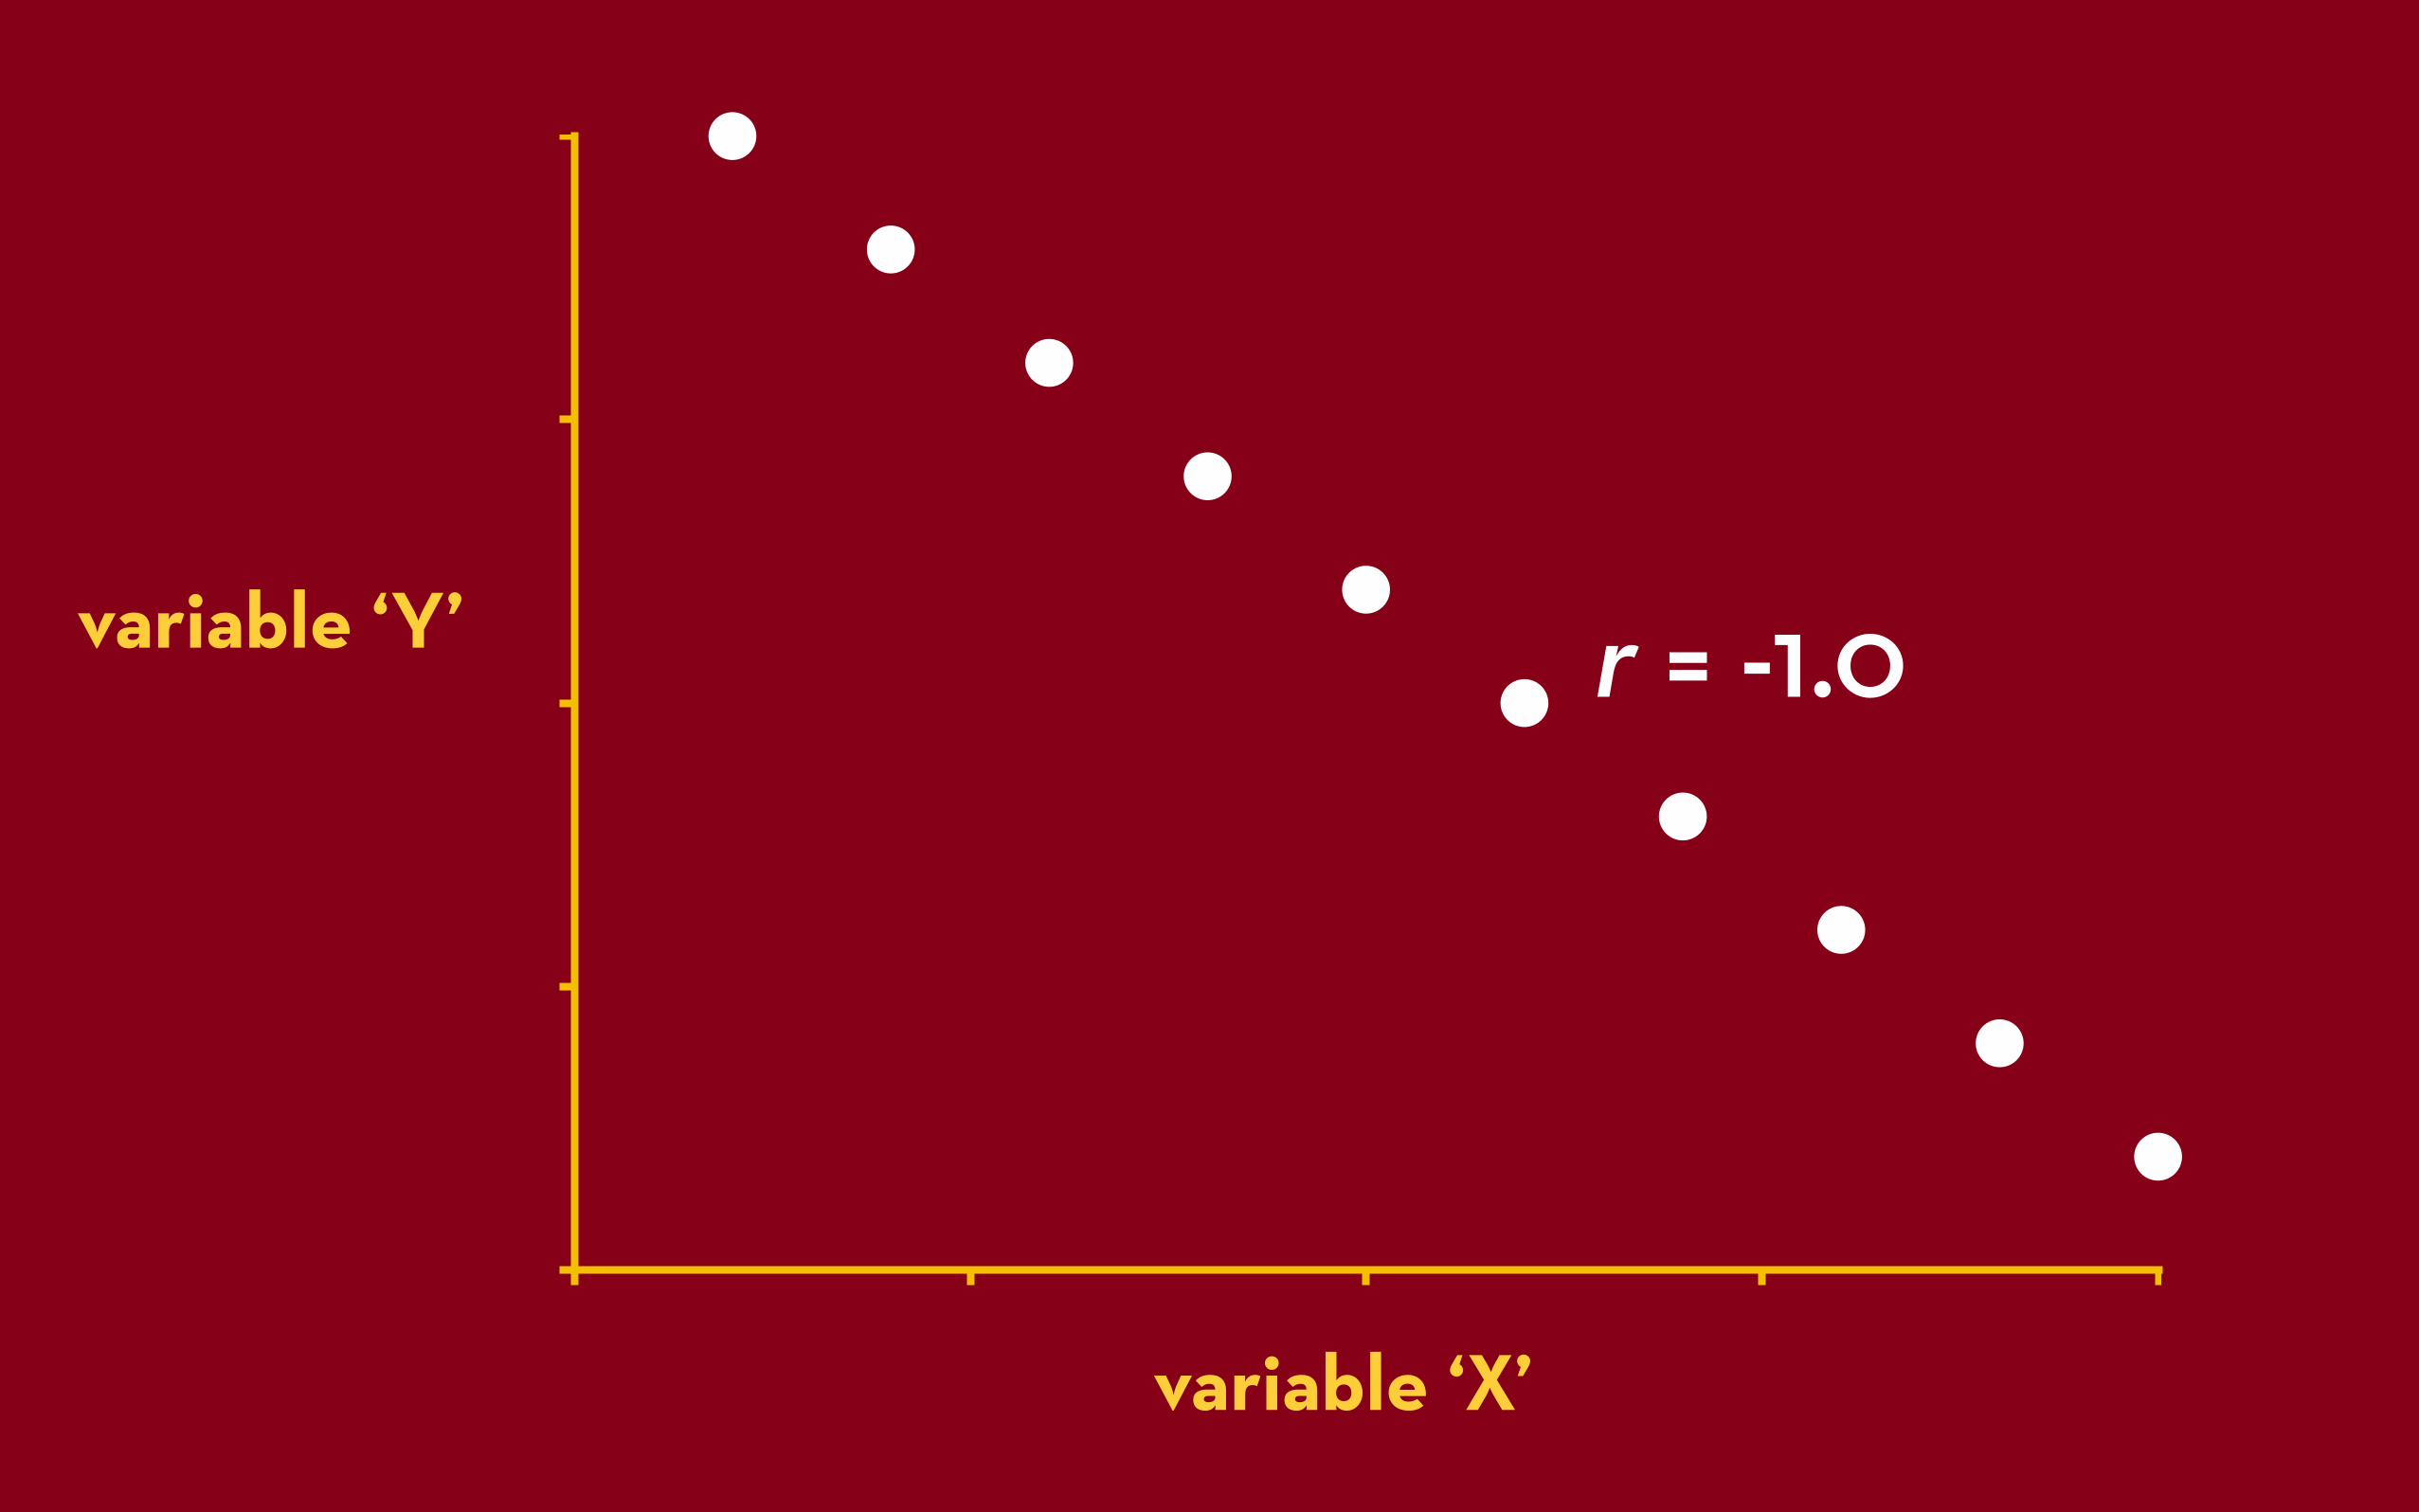
variable ‘X’
variable ‘Y’ r = -1.0
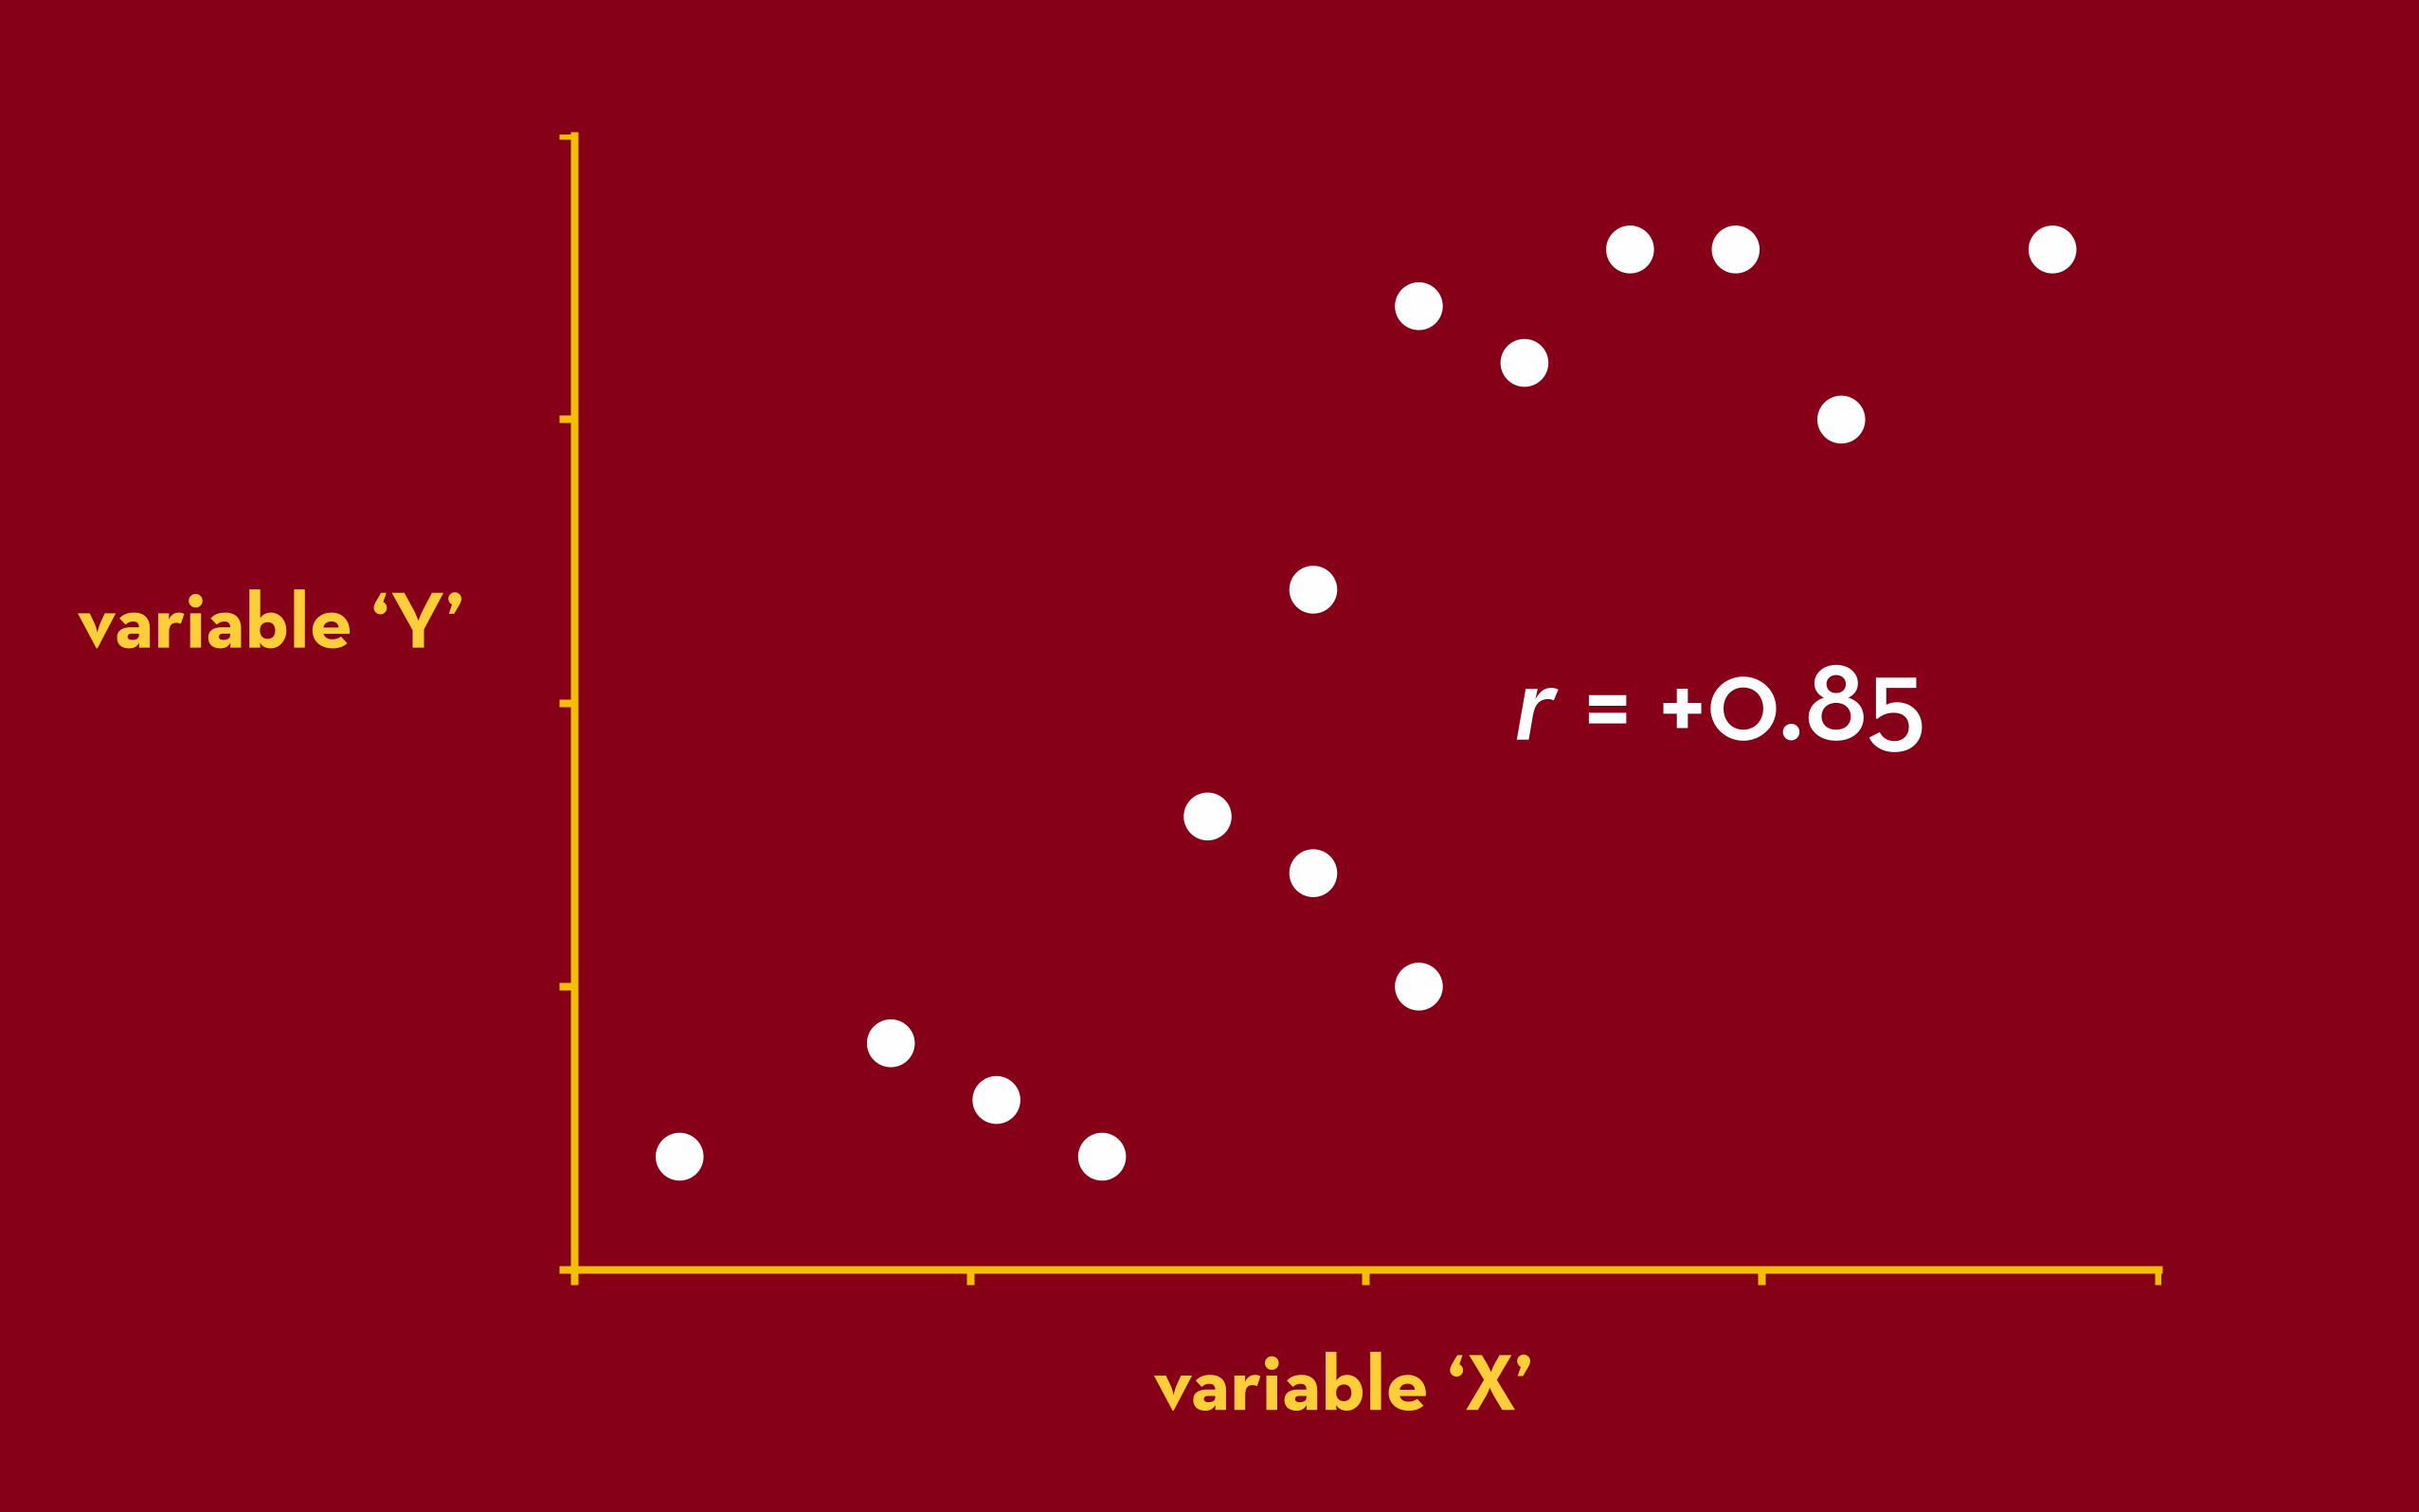
variable ‘X’
variable ‘Y’r = +0.85
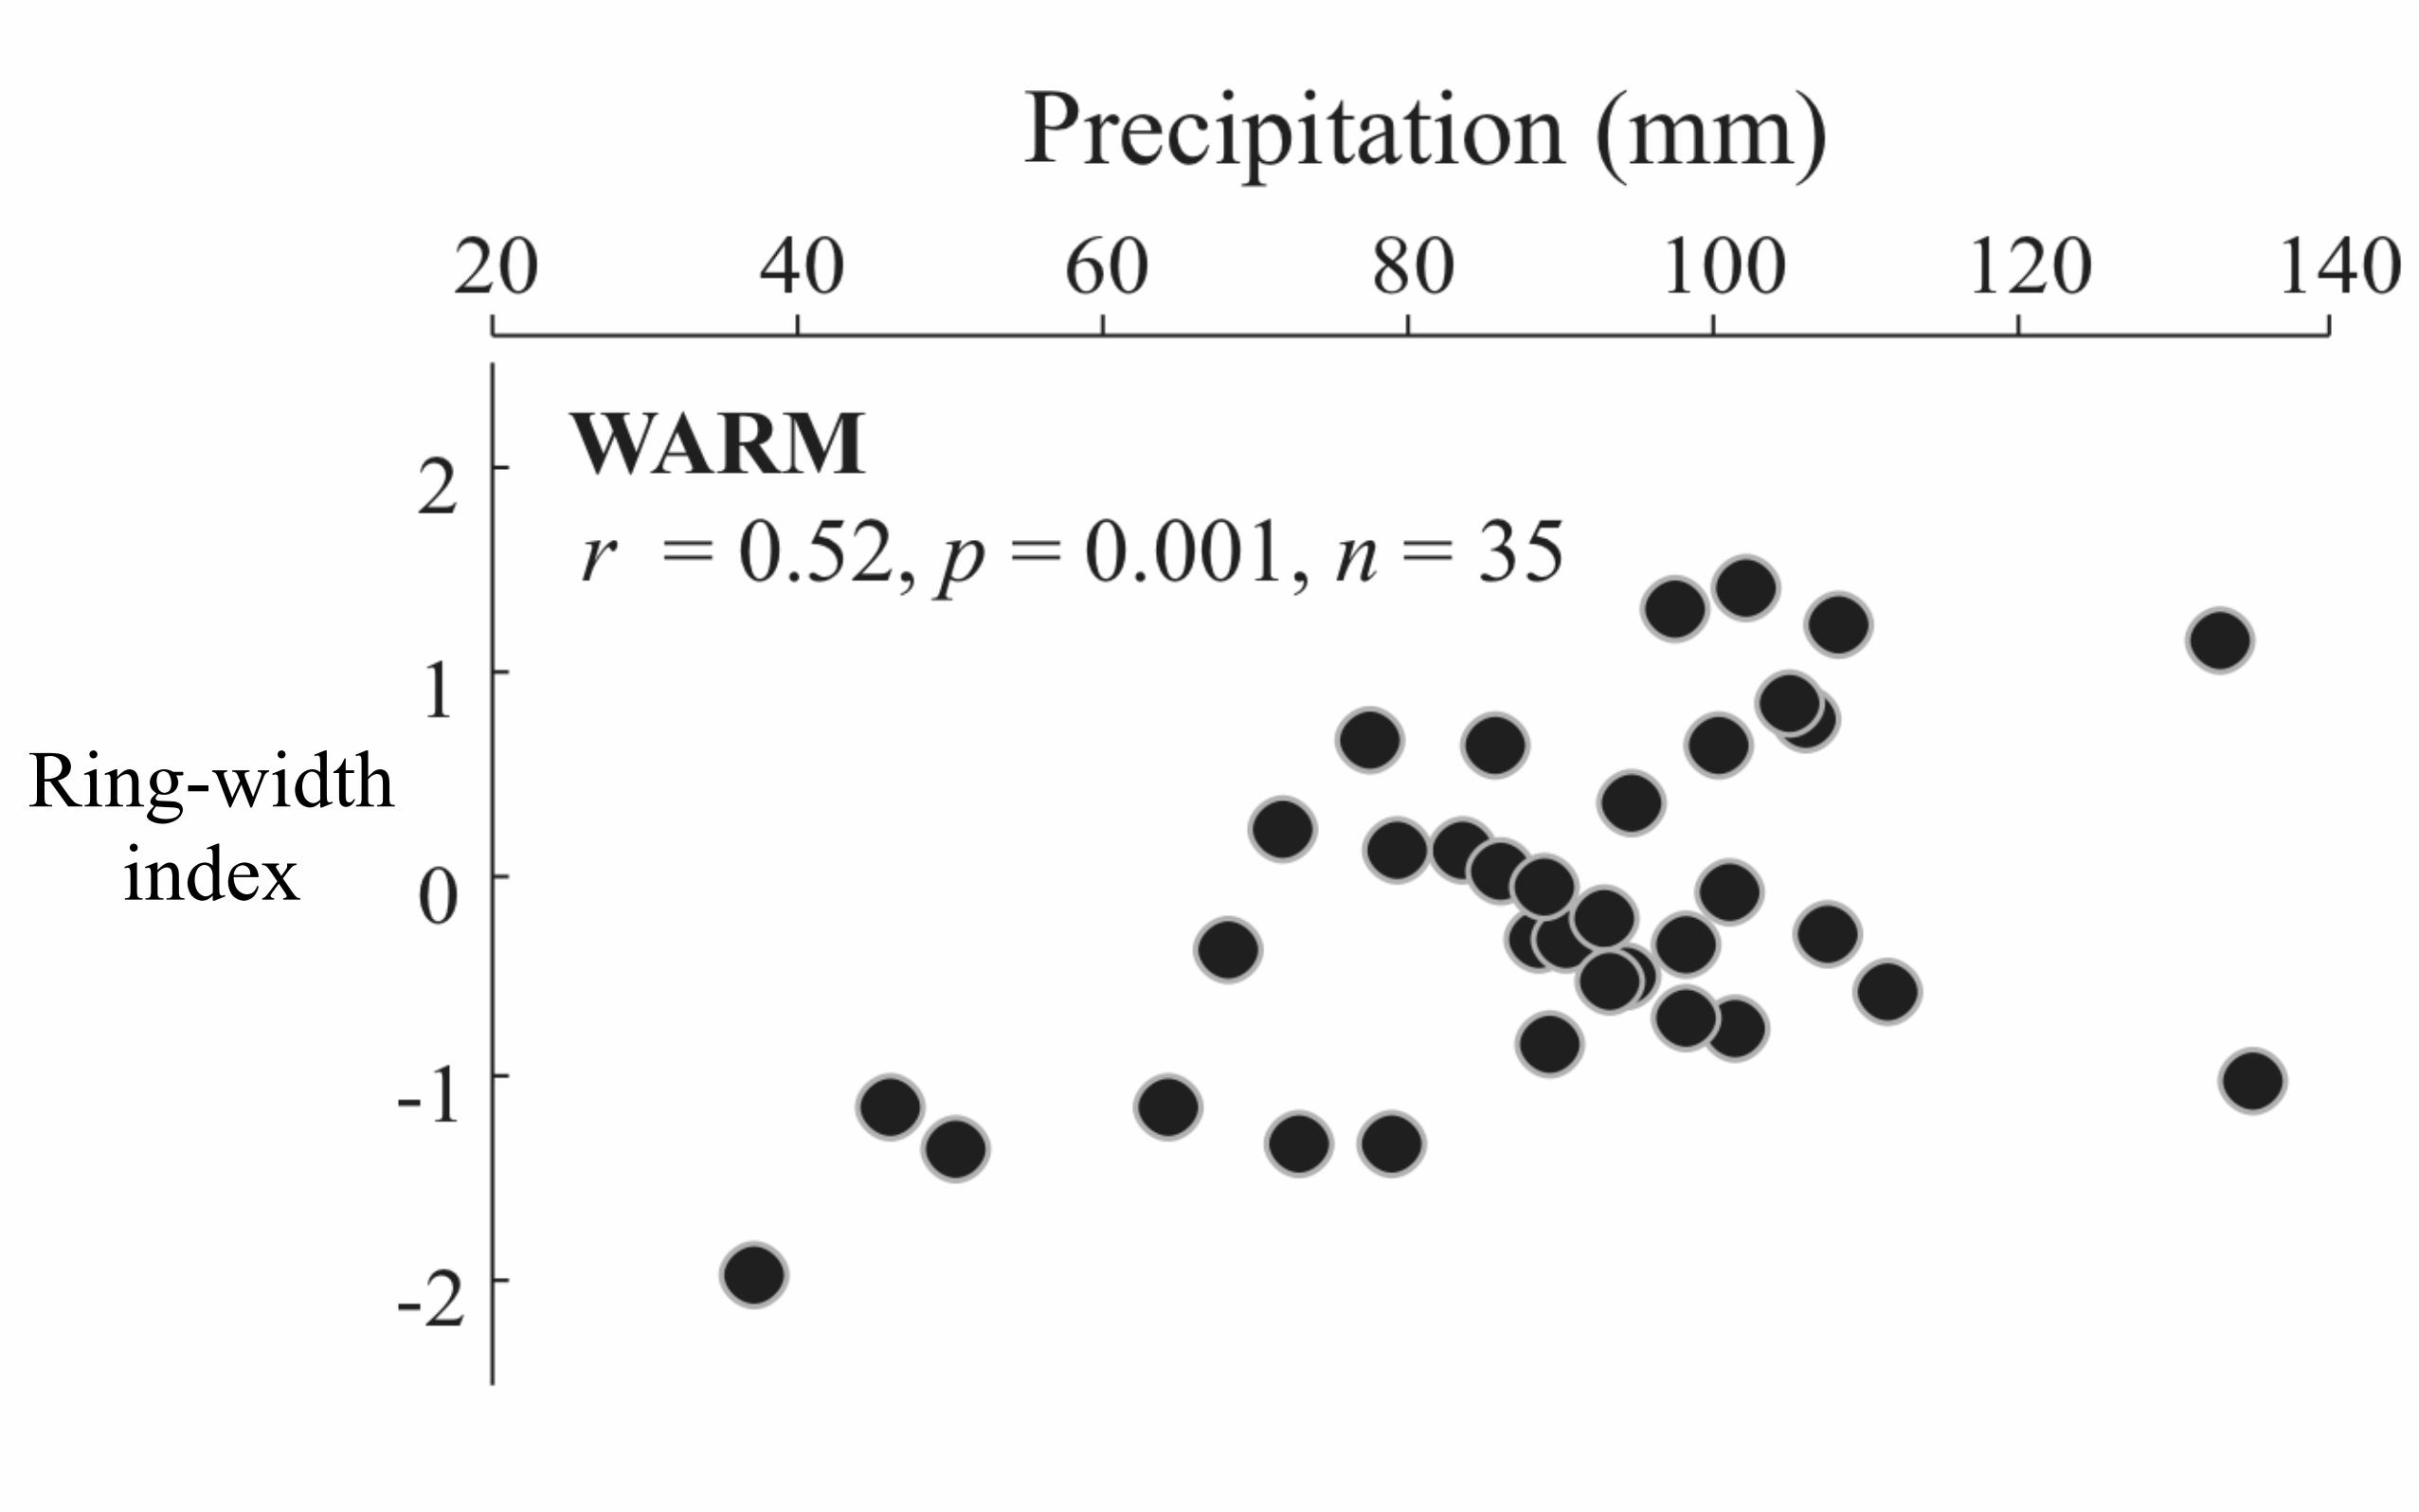
Ring-width index

“SHARED”VARIANCE

1900 1920 1940 1960 1980 2000
Year (A.D.)
-10
-5
0
5
10
PDSI
-3
-2
-1
0
1
2
3
Ring
wid
th
St. George et al., (2009), Journal of Climate

r = 0.62 r2 = 0.622
r2 = 0.38

1900 1920 1940 1960 1980 2000
Year (A.D.)
-10
-5
0
5
10
PDSI
-3
-2
-1
0
1
2
3
Ring
wid
th
St. George et al., (2009), Journal of Climate
38% shared variance

Correlation Pearson’s product-moment correlation
covariance
product of both standard deviations

Source: Wikipedia
r = 0.816

Single-site reconstruction

CORRELATIONFUNCTION
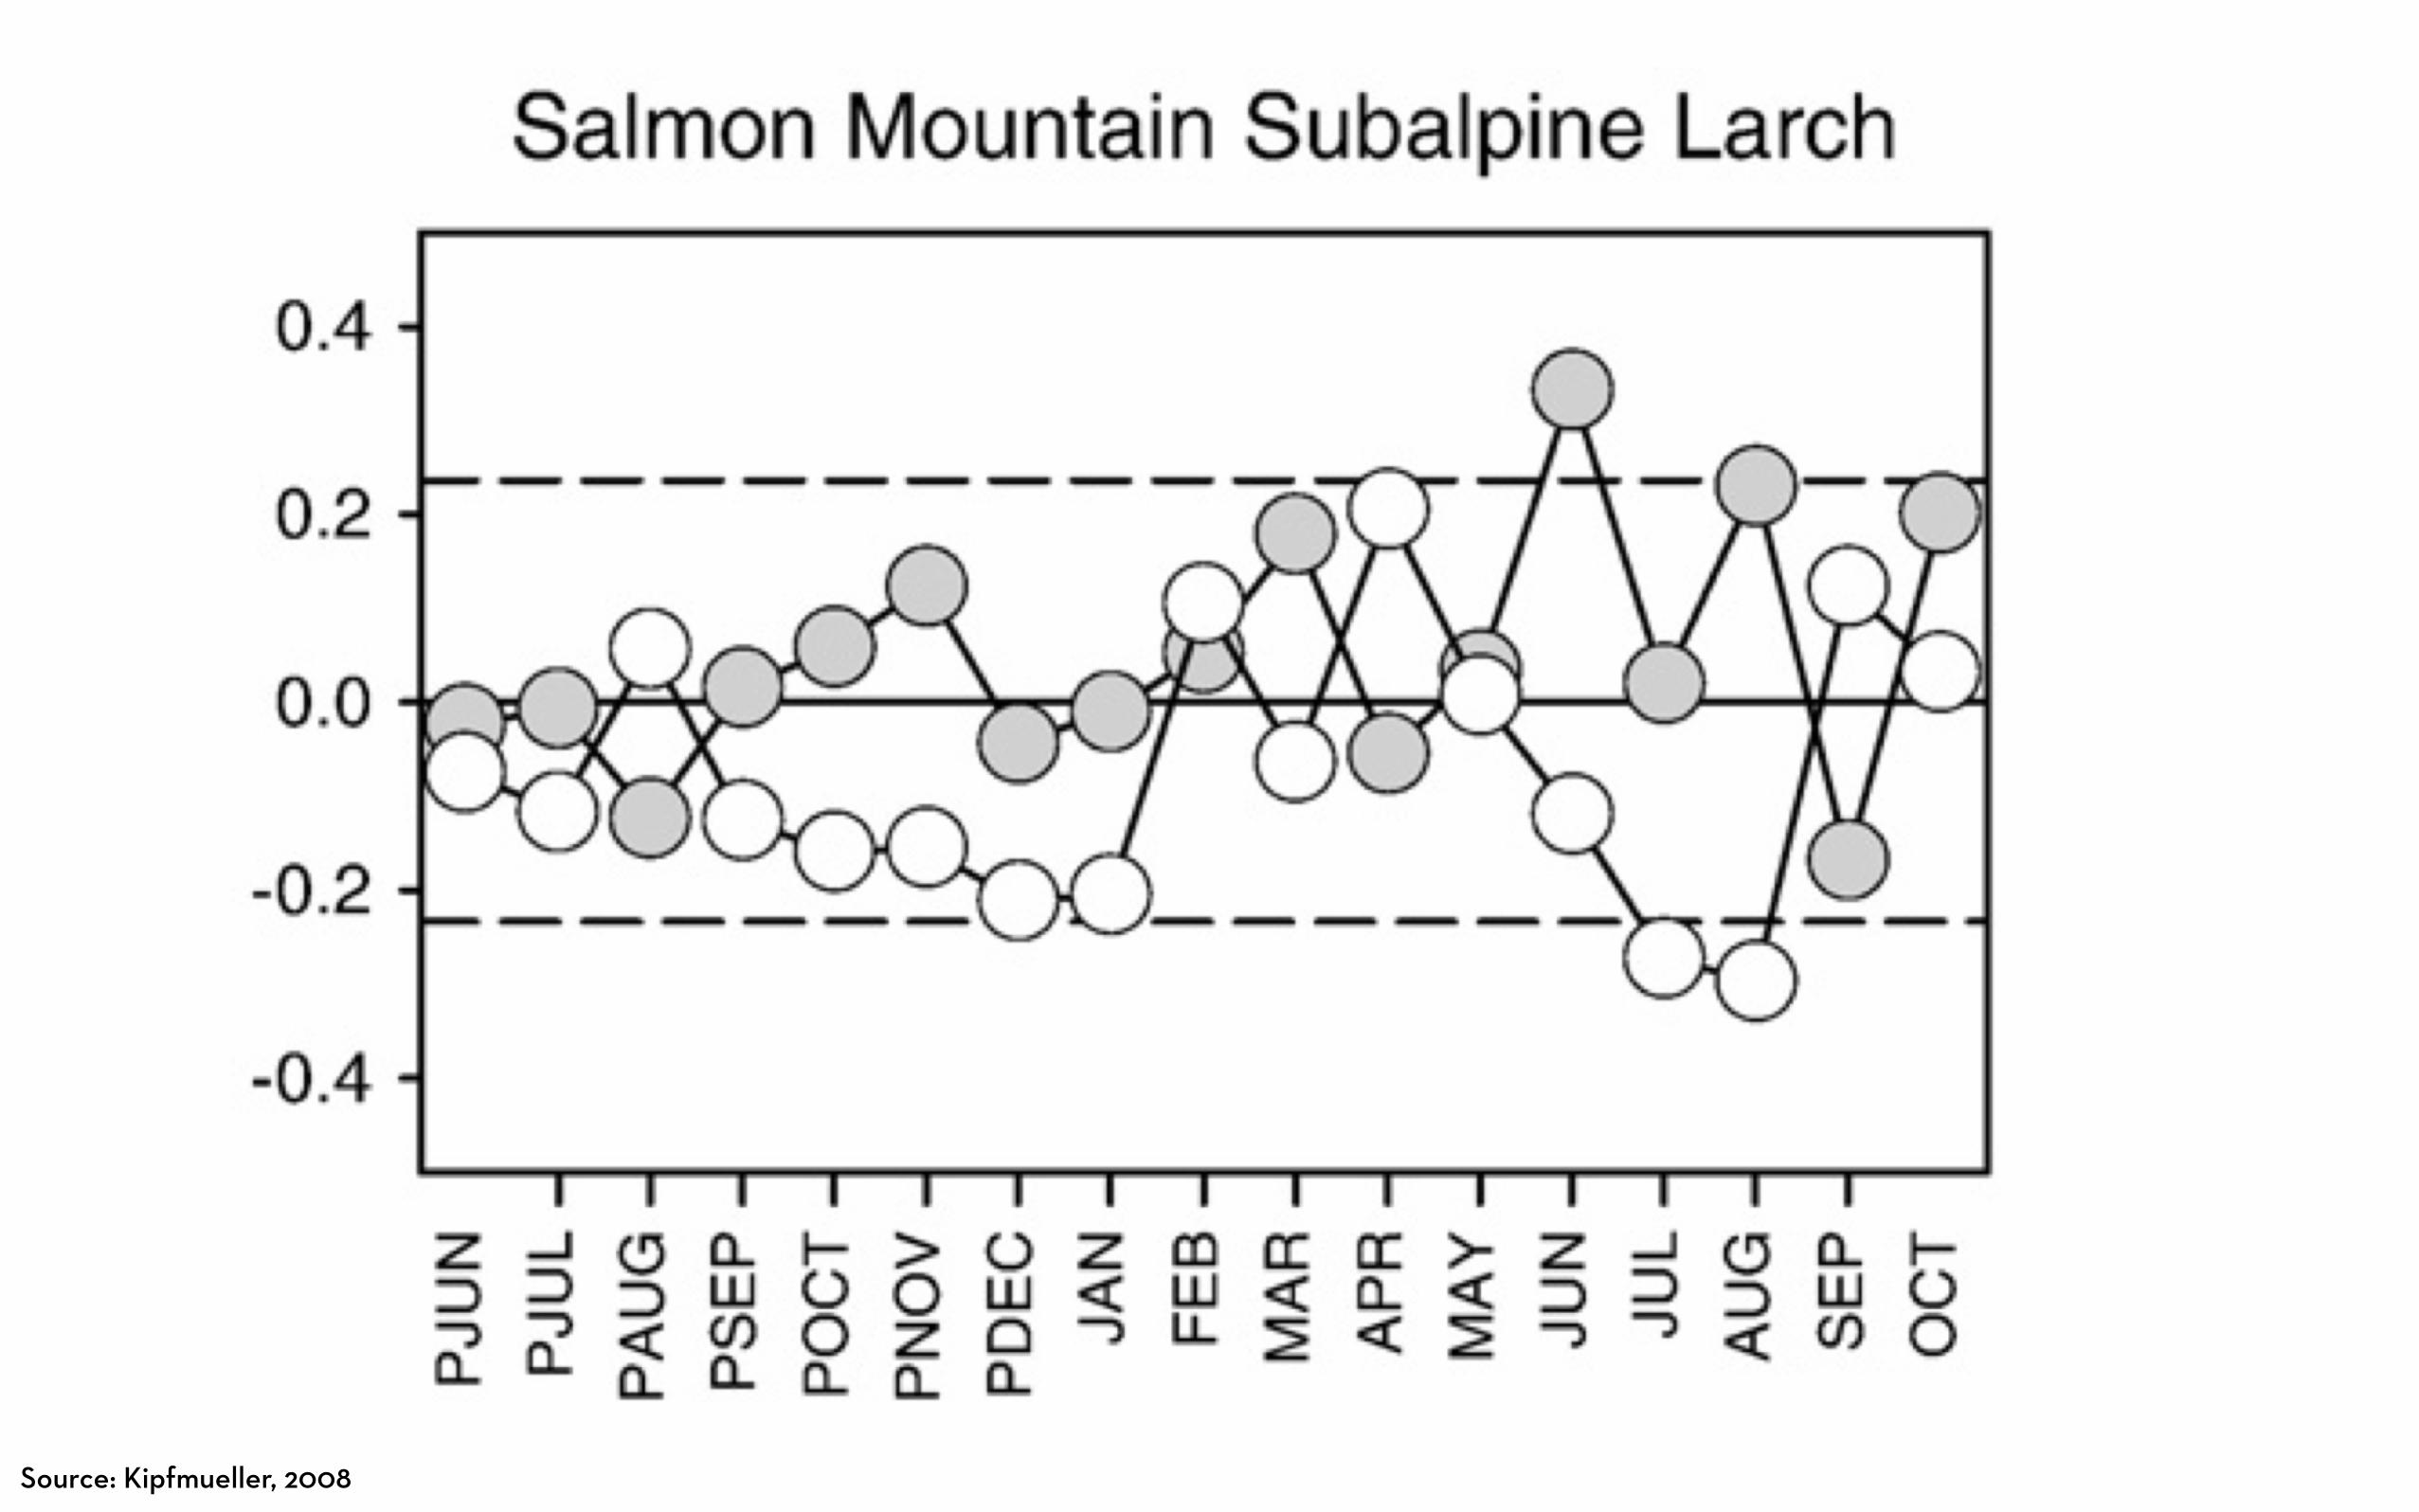
Source: Kipfmueller, 2008

LINEARREGRESSION

yt = axt + b + ε

yt = axt + b + ε
the climate variable of interest (at year t)

yt = axt + b + ε
the tree-ring variable (at year t)

yt = axt + b + ε
regression weight for the tree-ring
variable

yt = axt + b + ε
constant

yt = axt + b + ε
error of the residual

yt = axt + b + ε

Ring-width index

CLIMATERECONSTRUCTION


never trust one tree
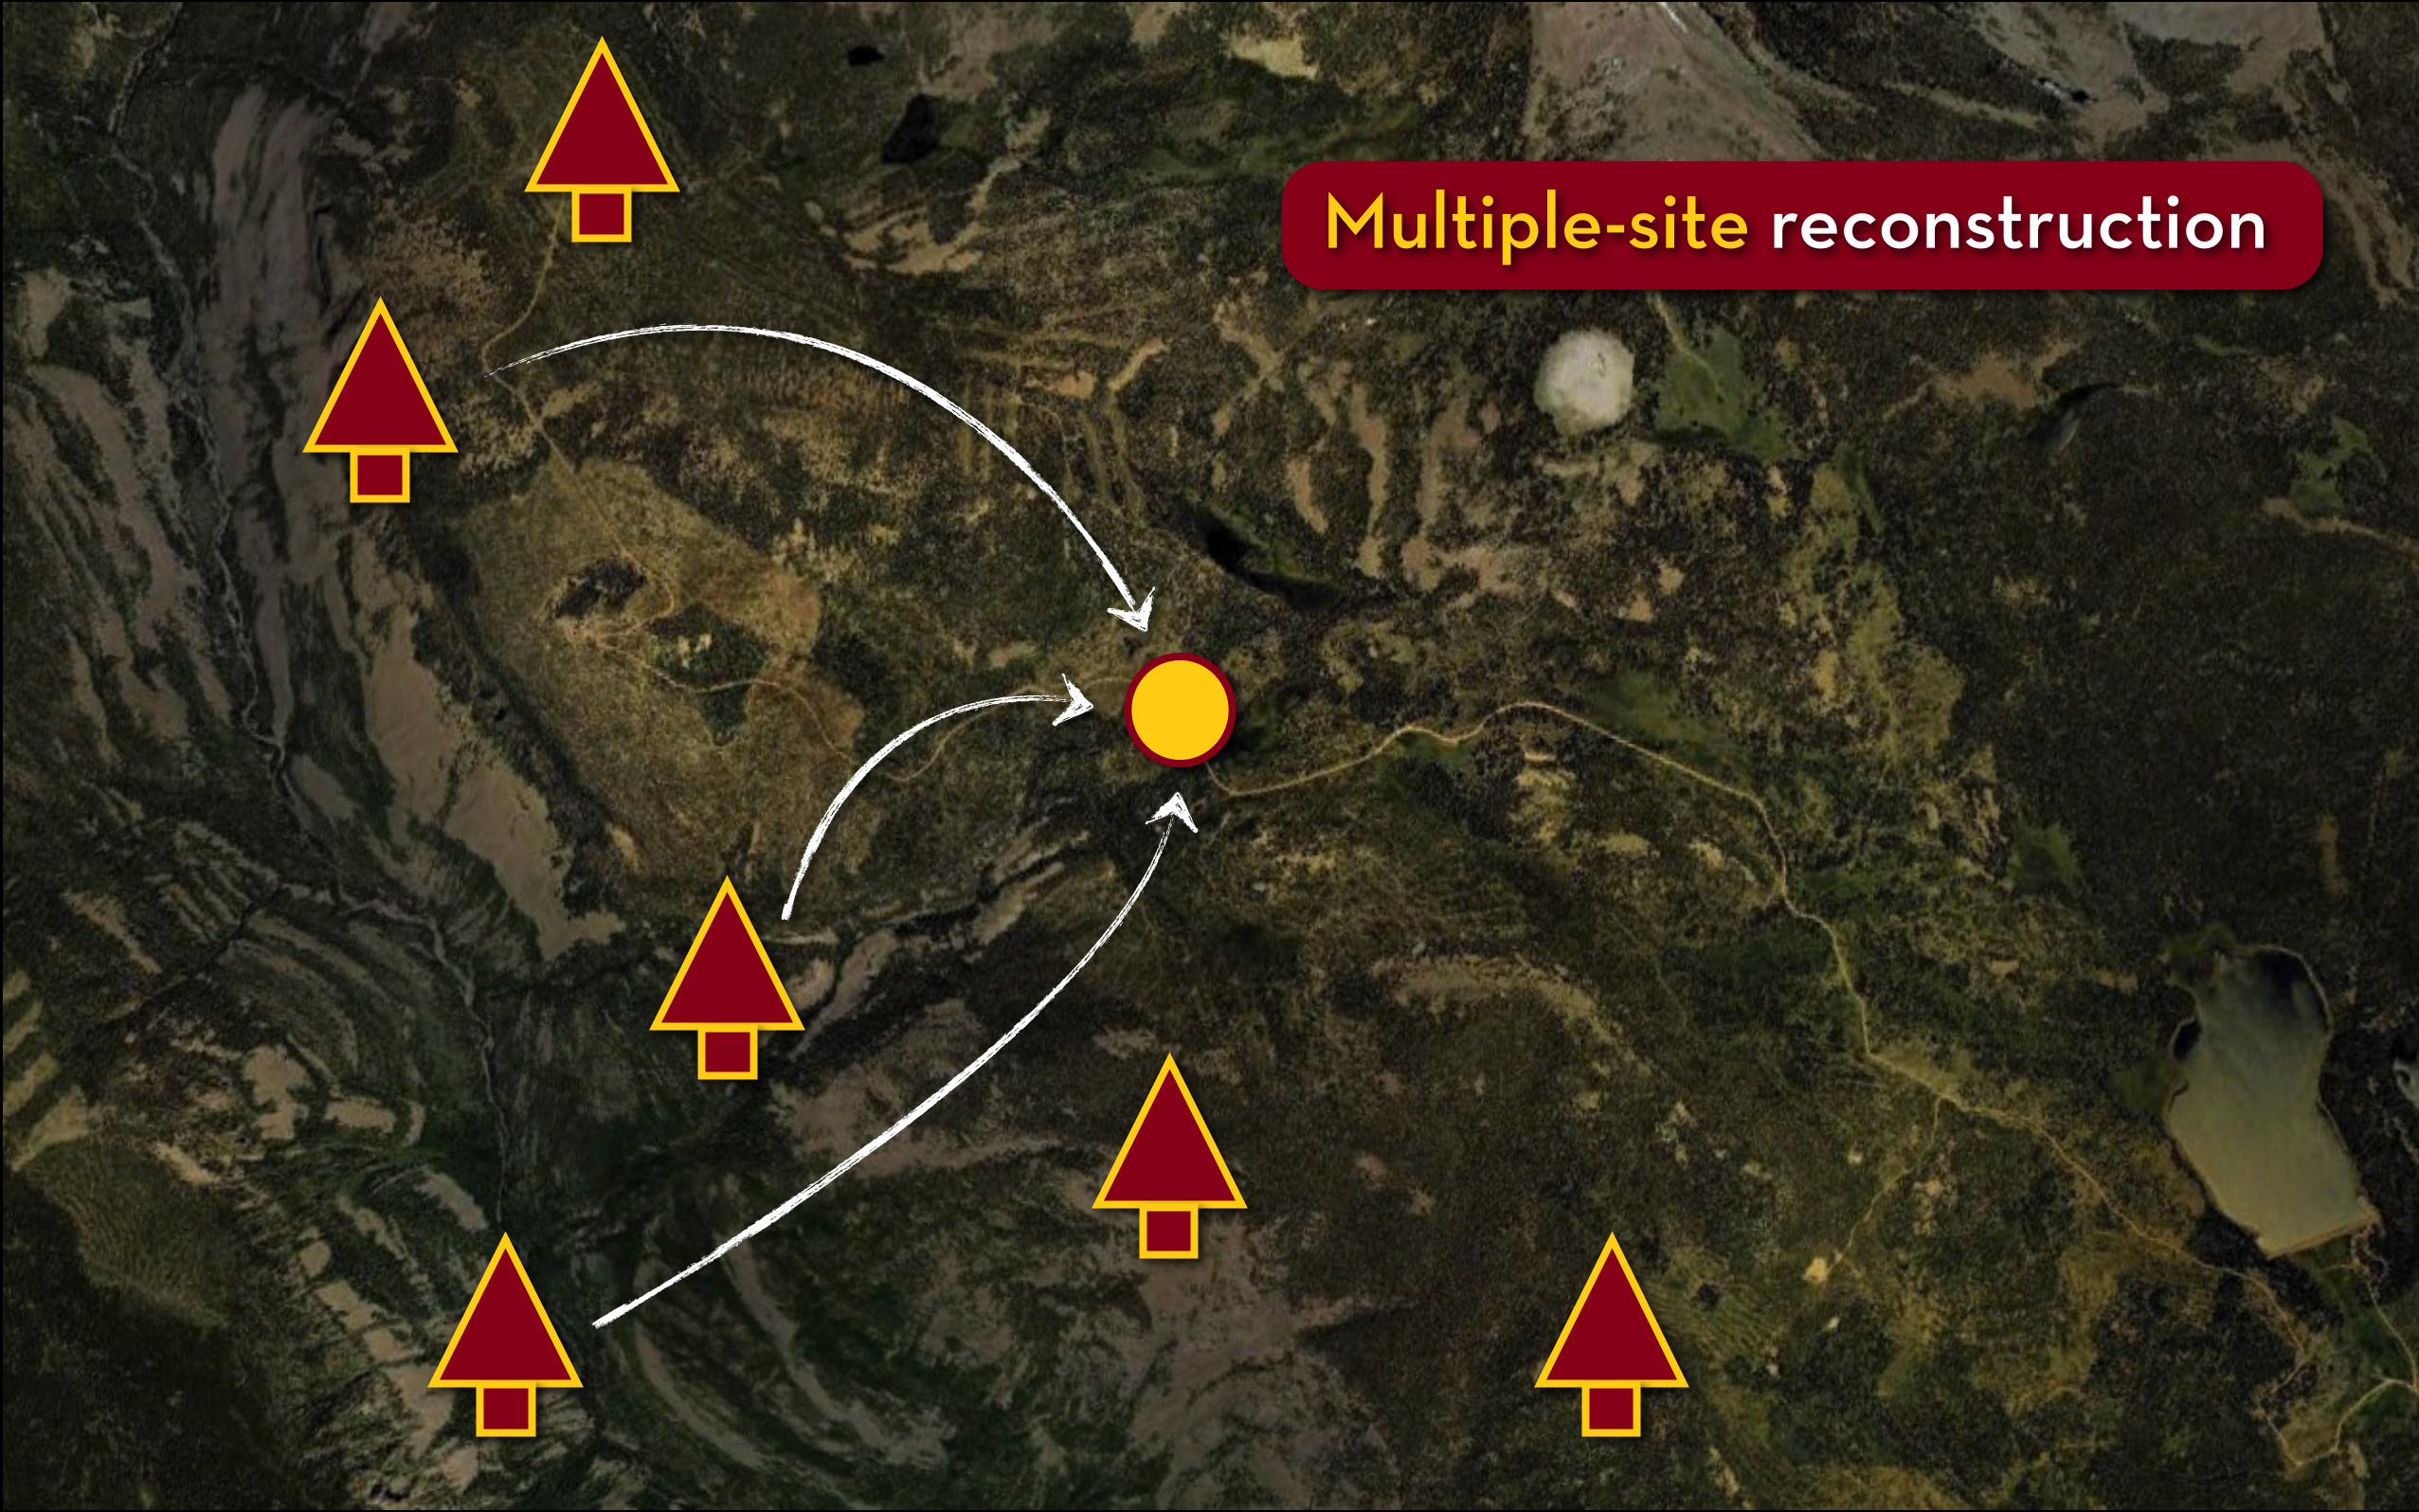
Multiple-site reconstruction

yt = a1x1t + a2x2t + a3x3t ... + b + ε
‘multiple’ linear regresson
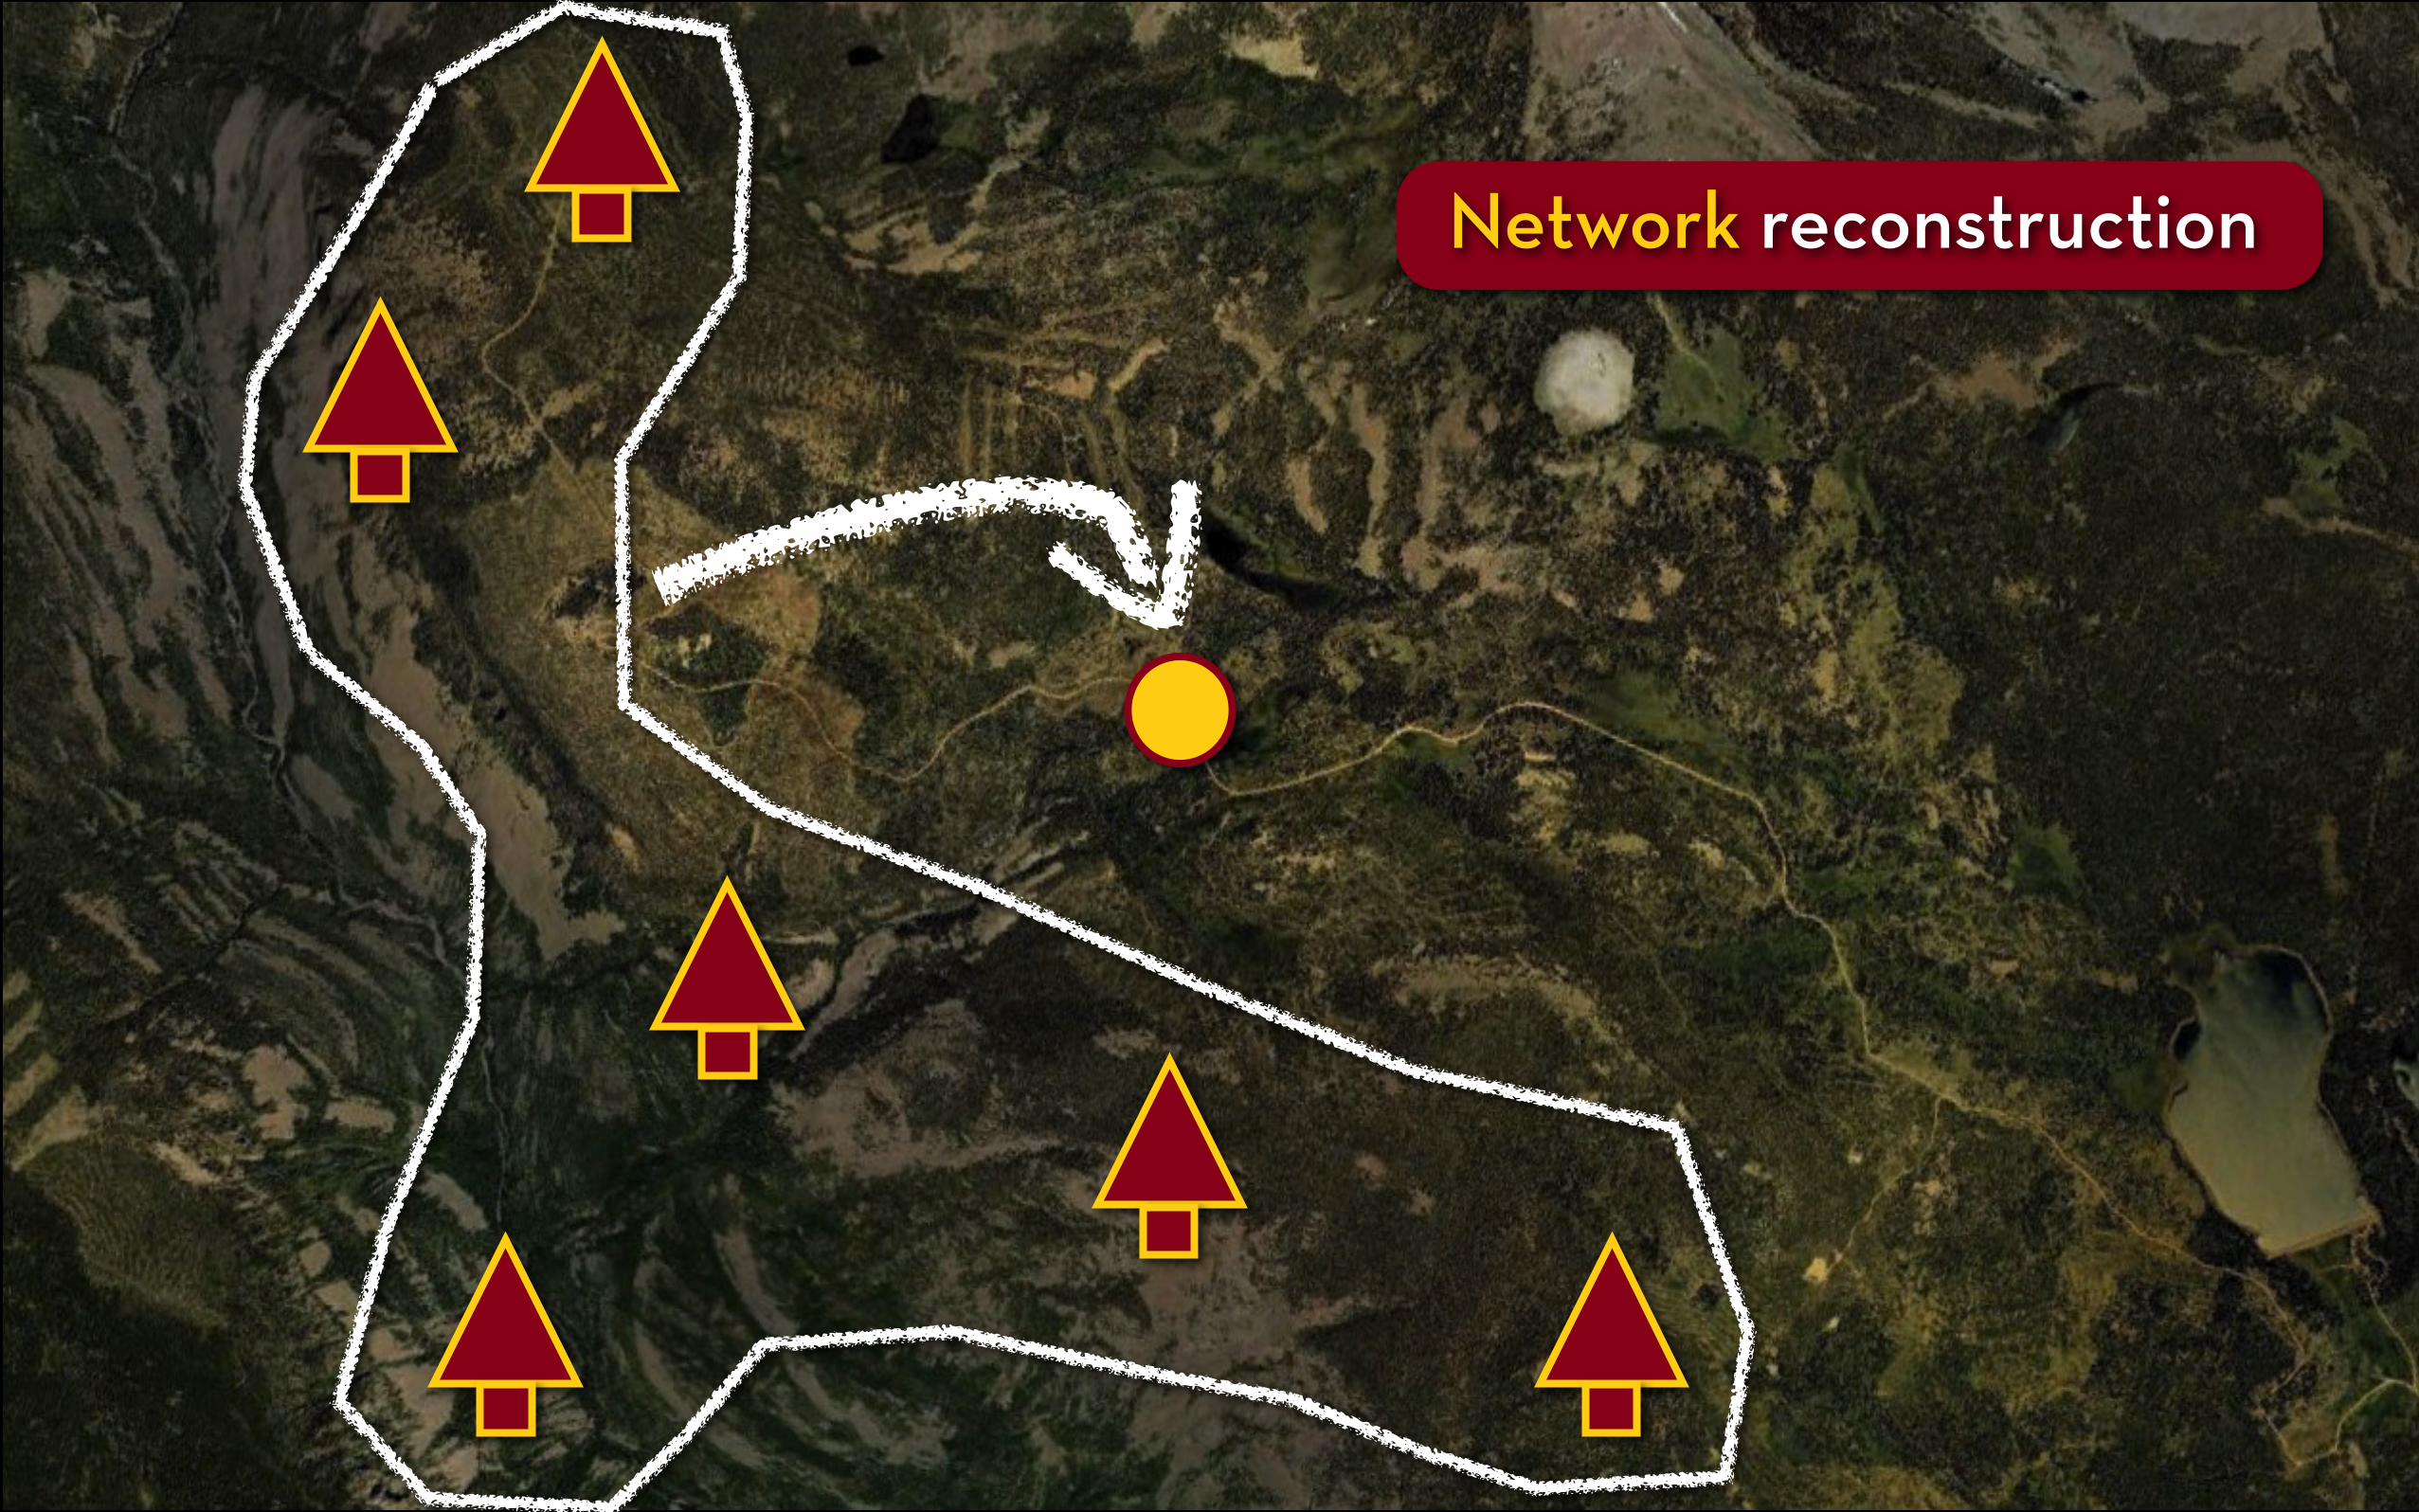
Network reconstruction

yt = axt + b + ε
average tree-ring width at many sites
(in year t)

‘SHARED’ VARIANCE
CORRELATION FUNCTION
LINEAR REGRESSION
CLIMATE RECONSTRUCTION

Source: Woodhouse et al., 2006
Tree rings can provide extra-ordinarily good estimates (sometimes)
White pine 1714
Photograph: Kurt Kipfmueller
