geog2021 environmental remote sensing lecture 2 image display and enhancement
TRANSCRIPT

GEOG2021Environmental Remote Sensing
Lecture 2
Image Display and Enhancement

Image Display and Enhancement
Purpose
• visual enhancement to aid interpretation
• enhancement for improvement of information extraction techniques

Image Display
• The quality of image display depends on the quality of the display device used– and the way it is set up / used …
• computer screen - RGB colour guns– e.g. 24 bit screen (16777216)
• 8 bits/colour (28)
• or address differently
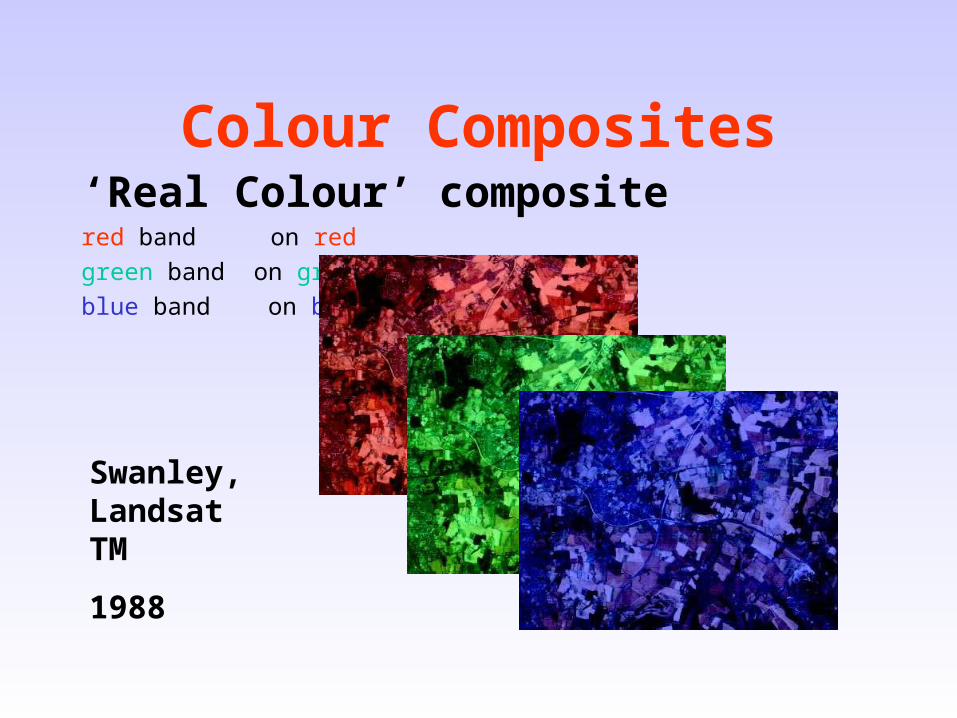
Colour Composites‘Real Colour’ compositered band on red
green band on green
blue band on blue
Swanley, Landsat TM
1988
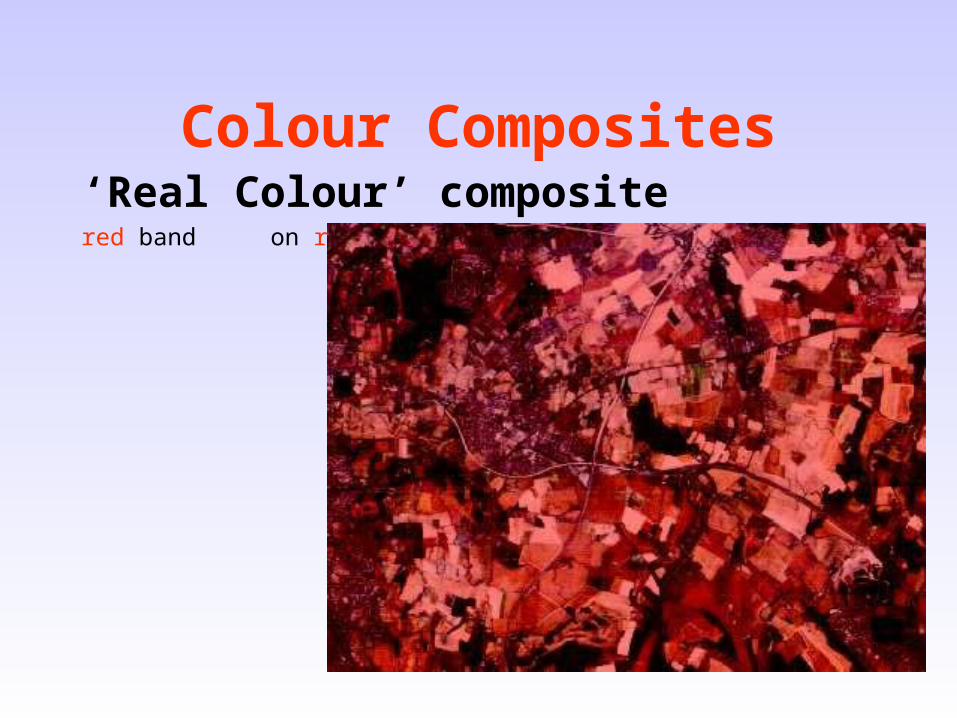
Colour Composites‘Real Colour’ compositered band on red
Colour Composites‘Real Colour’ compositered band on red
green band on green

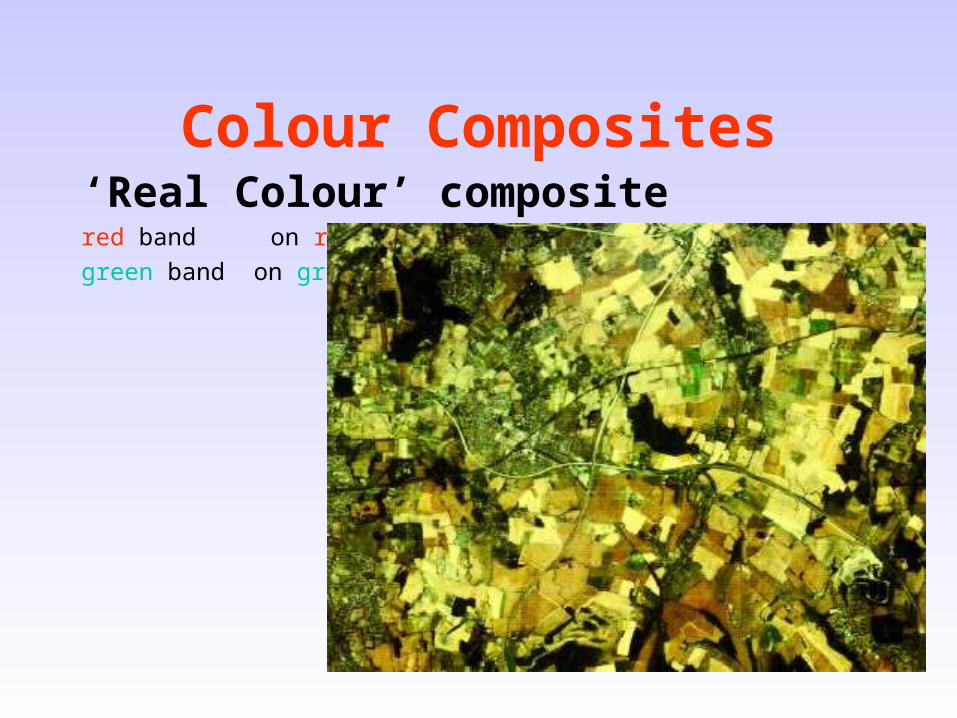
Colour Composites‘Real Colour’ compositered band on red
green band on green
blue band on blue
approximation to ‘real colour’...
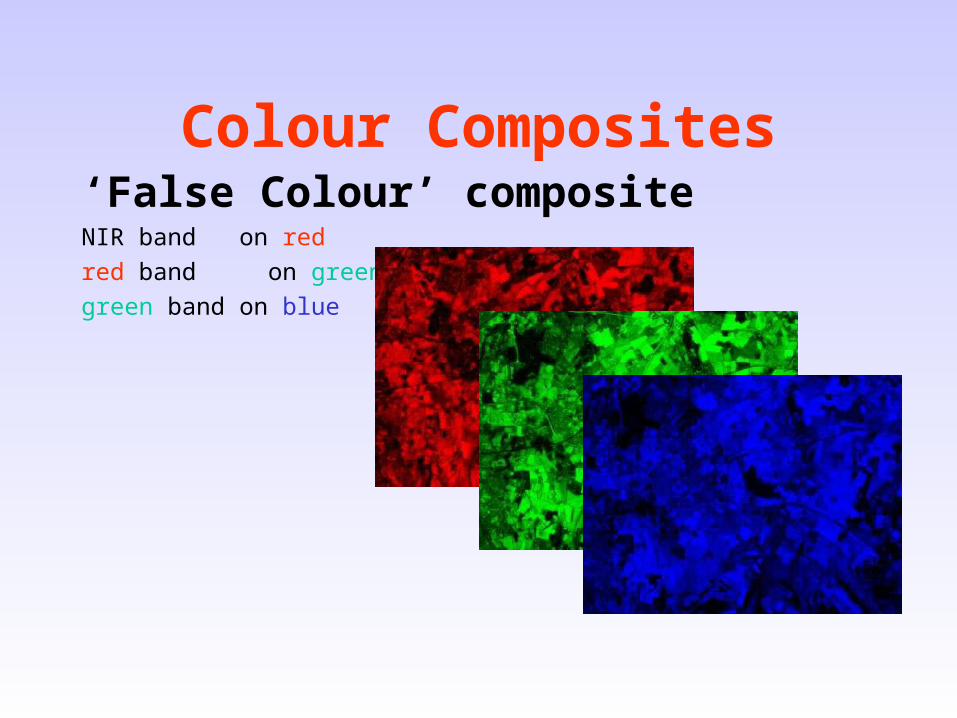
Colour Composites‘False Colour’ compositeNIR band on red
red band on green
green band on blue

Colour Composites‘False Colour’ compositeNIR band on red
red band on green
green band on blue

Colour Composites‘False Colour’ composite• many channel data, much not comparable to RGB (visible)
– e.g. Multi-polarisation SAR
HH: Horizontal transmitted polarization and Horizontal received polarization
VV: Vertical transmitted polarization and Vertical received polarization
HV: Horizontal transmitted polarization and Vertical received polarization

Colour Composites‘False Colour’ composite• many channel data, much not comparable to RGB (visible)
– e.g. Multi-temporal data
– AVHRR MVC 1995
April
August
September
April; August; September

Colour Composites‘False Colour’ composite• many channel data, much not comparable to RGB (visible)
– e.g. MISR -Multi-angular data (August 2000)
RCCNortheast Botswana
0o; +45o; -45o

Greyscale DisplayPut same information on R,G,B:
August 1995
August 1995
August 1995
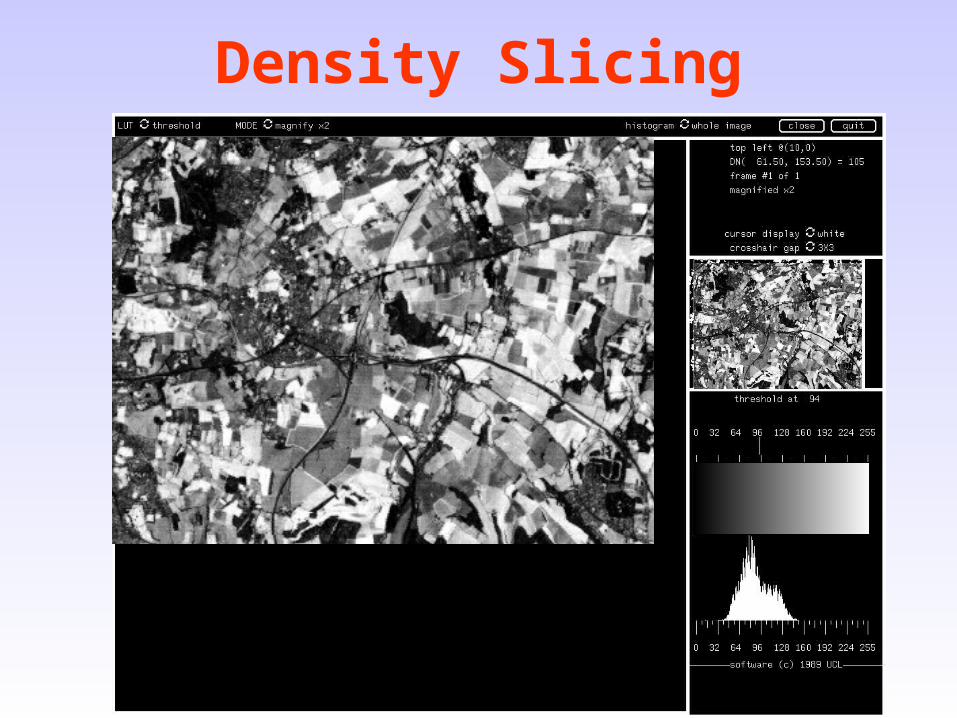
Density Slicing

Density Slicing

Density SlicingDon’t always want to use full
dynamic range of display
Density slicing:
• a crude form of classification
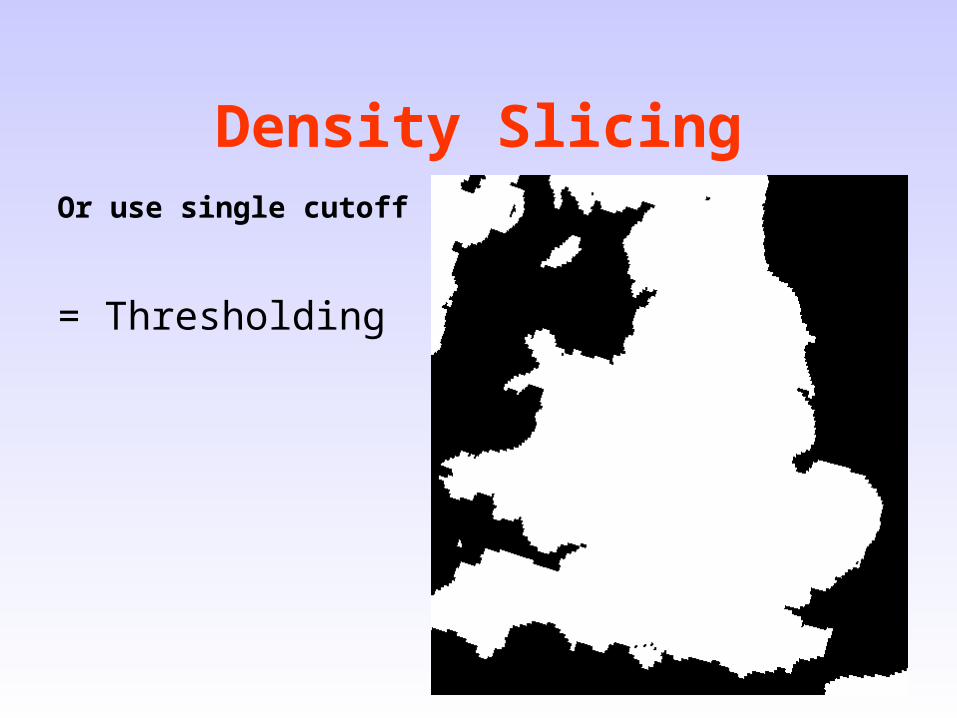
Density SlicingOr use single cutoff
= Thresholding

Density SlicingOr use single cutoff with
grey level after that point
‘Semi-Thresholding’
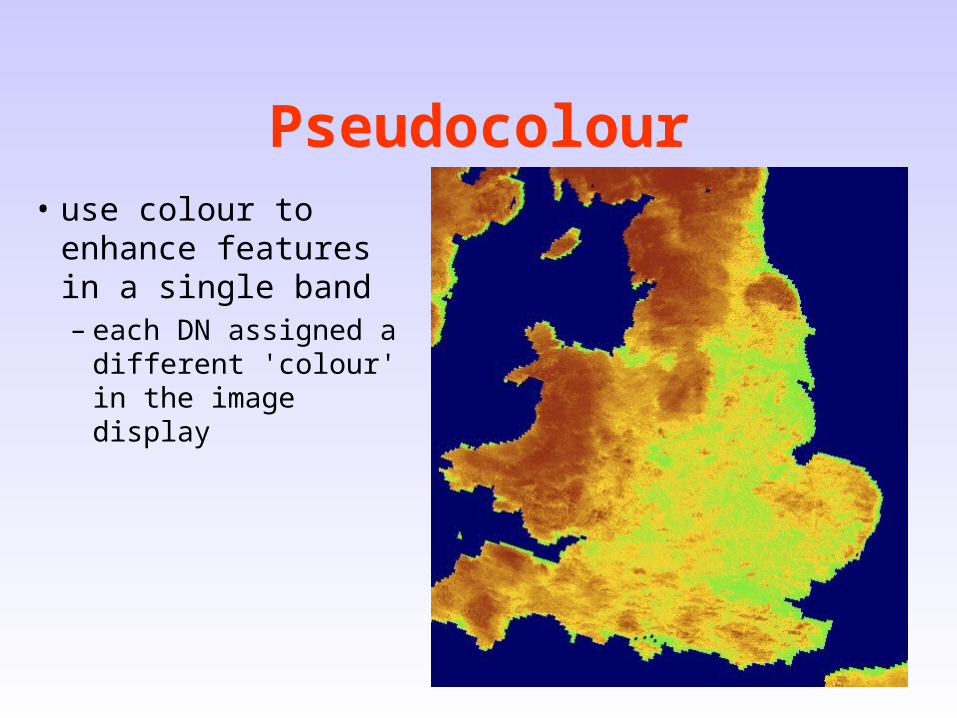
Pseudocolour• use colour to enhance
features in a single band – each DN assigned a
different 'colour' in the image display

Pseudocolour
• Or combine with density slicing / thresholding

Image Arithmetic• Combine multiple
channels of information to enhance features
• e.g. NDVI
(NIR-R)/(NIR+R)

Image Arithmetic
• Combine multiple channels of information to enhance features
• e.g. NDVI
(NIR-R)/(NIR+R)

Image Arithmetic
• Common operators: Ratio
Landsat TM 1992
Southern Vietnam:
green band
what is the ‘shading’?
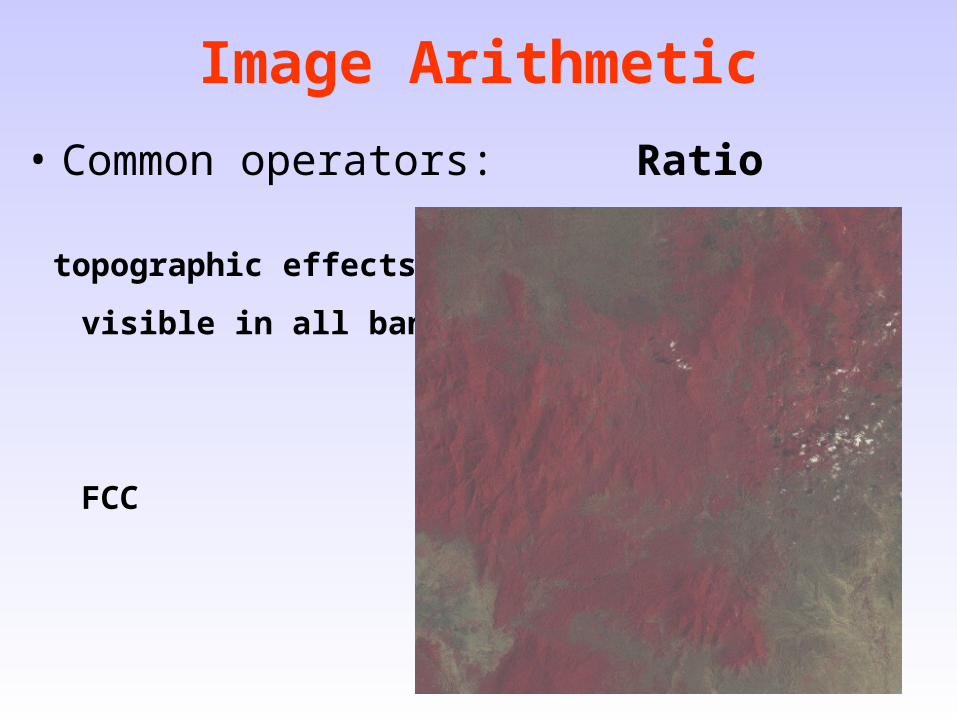
Image Arithmetic
• Common operators: Ratio
topographic effects
visible in all bands
FCC

Image Arithmetic
• Common operators: Ratio (cha/chb)
apply band ratio
= NIR/red
what effect has it had?
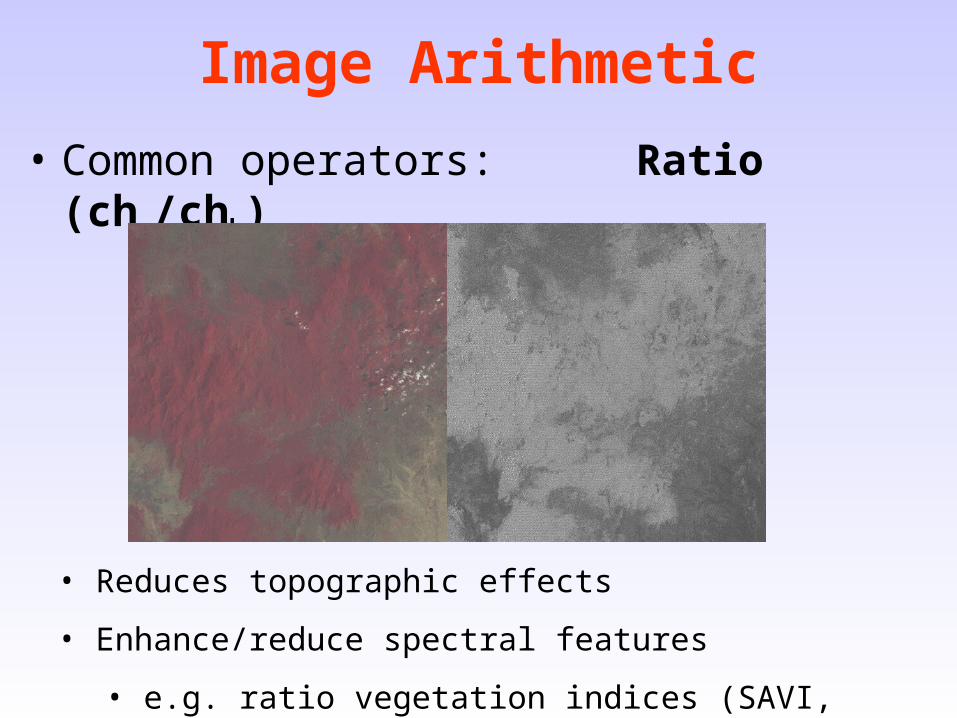
Image Arithmetic
• Common operators: Ratio (cha/chb)
• Reduces topographic effects
• Enhance/reduce spectral features
• e.g. ratio vegetation indices (SAVI, NDVI++)
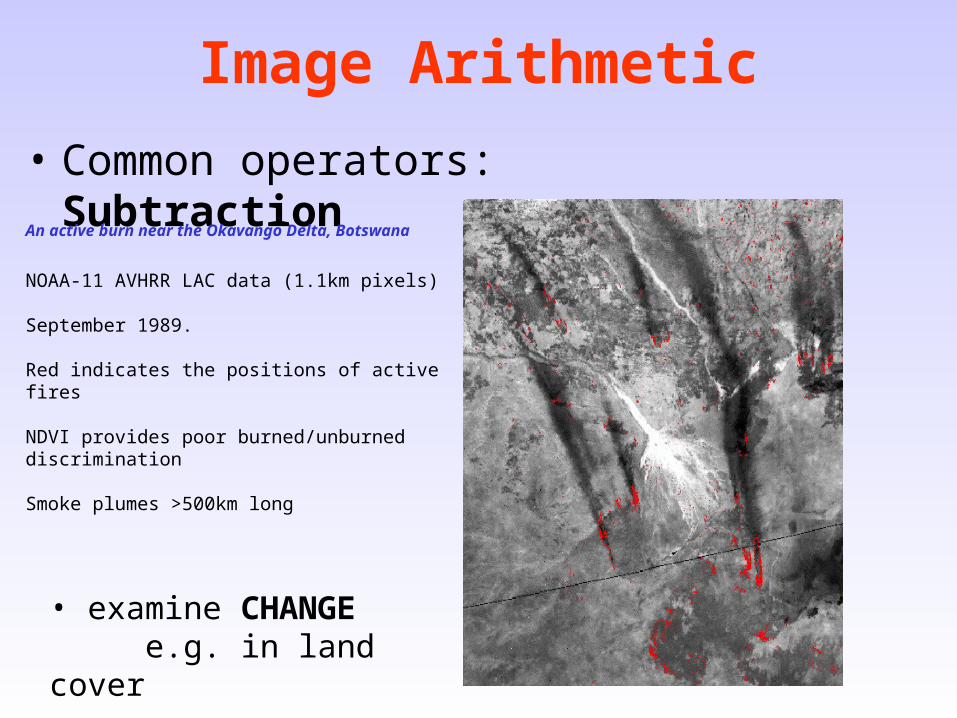
Image Arithmetic
• Common operators: Subtraction
• examine CHANGE e.g. in land cover
An active burn near the Okavango Delta, Botswana
NOAA-11 AVHRR LAC data (1.1km pixels)
September 1989.
Red indicates the positions of active fires
NDVI provides poor burned/unburned discrimination
Smoke plumes >500km long

Top left AVHRR Ch3 day 235
Top Right AVHRR Ch3 day 236
Bottom difference
pseudocolur scale:
black - none
blue - low
red - high
Botswana (approximately 300 * 300km)
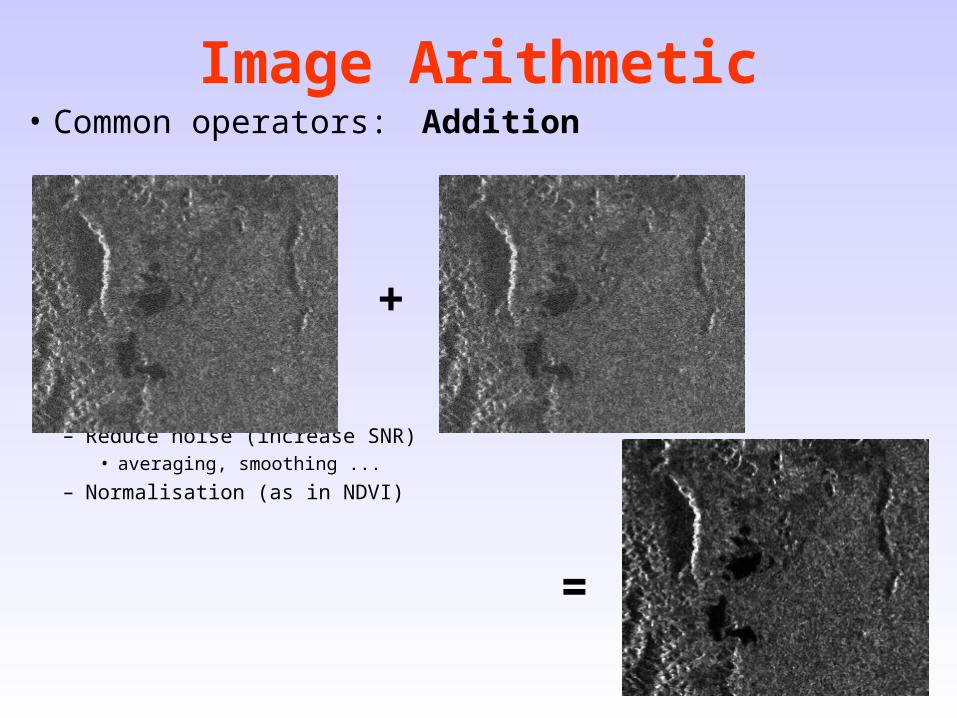
Image Arithmetic• Common operators: Addition
– Reduce noise (increase SNR) • averaging, smoothing ...
– Normalisation (as in NDVI)
+
=

Image Arithmetic
• Common operators: Multiplication
• rarely used per se: logical operations?– land/sea mask

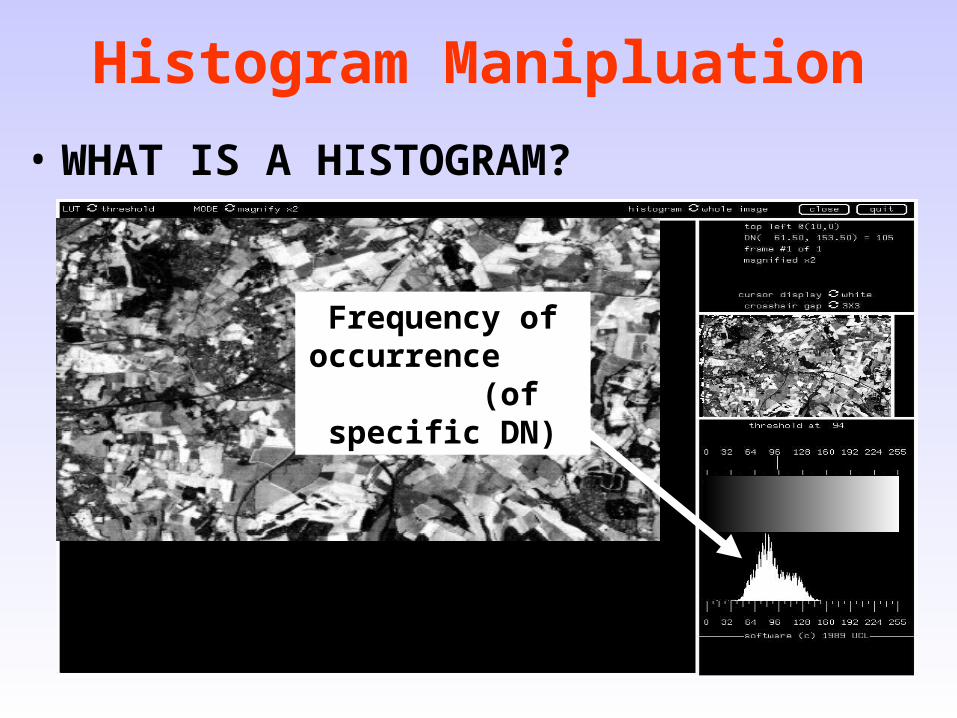
Histogram Manipluation
• WHAT IS A HISTOGRAM?

Histogram Manipluation
• WHAT IS A HISTOGRAM?
Histogram Manipluation
• WHAT IS A HISTOGRAM?
Frequency of occurrence (of specific DN)

Histogram Manipluation
• Analysis of histogram – information on the dynamic range and
distribution of DN• attempts at visual enhancement
• also useful for analysis, e.g. when a multimodal distibution is observed

Histogram Manipluation
• Analysis of histogram – information on the dynamic range and
distribution of DN• attempts at visual enhancement
• also useful for analysis, e.g. when a multimodal distibution is observed

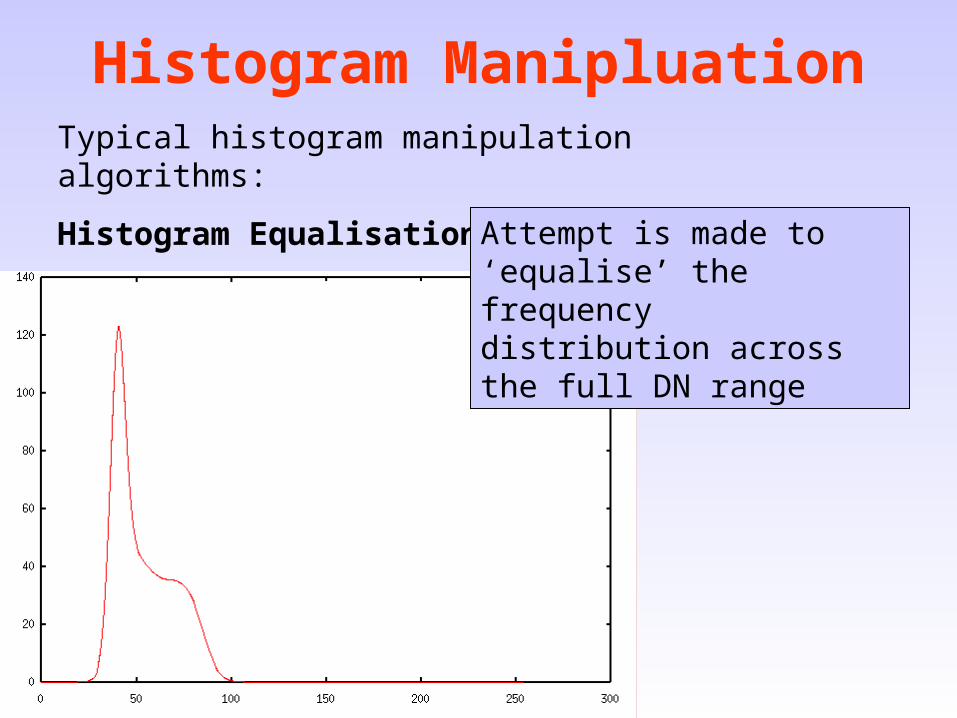
Histogram ManipluationTypical histogram manipulation algorithms:
Linear Transformation
input
outp
ut
0 255
255
0

Histogram ManipluationTypical histogram manipulation algorithms:
Linear Transformation
input
outp
ut
0 255
255
0

Histogram ManipluationTypical histogram manipulation algorithms:
Linear Transformation
• Can automatically scale between upper and lower limits•or apply manual limits
•or apply piecewise operator
But automatic not always useful ...
Histogram ManipluationTypical histogram manipulation algorithms:
Histogram EqualisationAttempt is made to ‘equalise’ the frequency distribution across the full DN range

Histogram ManipluationTypical histogram manipulation algorithms:
Histogram Equalisation
Attempt to split the histogram into ‘equal areas’

Histogram ManipluationTypical histogram manipulation algorithms:
Histogram Equalisation
Resultant histogram uses DN range in proportion to frequency of occurrence
Histogram ManipluationTypical histogram manipulation algorithms:
Histogram Equalisation
• Useful ‘automatic’ operation, attempting to produce ‘flat’ histogram
• Doesn’t suffer from ‘tail’ problems of linear transformation
• Like all these transforms, not always successful
• Histogram Normalisation is similar idea
• Attempts to produce ‘normal’ distribution in output histogram
• both useful when a distribution is very skewed or multimodal skewed

Histogram ManipluationTypical histogram manipulation algorithms:
Gamma Correction
• Monitor output not linearly-related to voltage applied
• Screen brightness, B, a power of voltage, V:
B = aV
• Hence use term ‘gamma correction’
• 13 for most screens

Colour Spaces• Define ‘colour space’ in terms of RGB
• Only for visible part of spectrum:
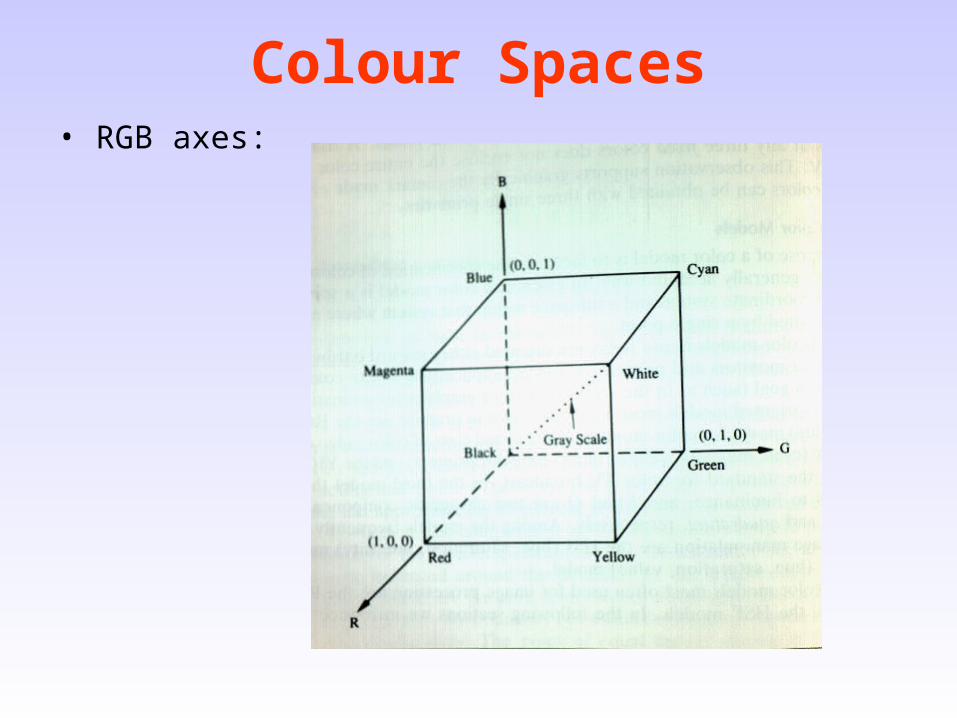
Colour Spaces• RGB axes:

Colour Spaces• RGB (primaries) as axes

Colour Spaces• Alternative: CMYK ‘subtractive primaries’
• often used for printing (& some TV)

Colour Spaces• Alternative: CMYK ‘subtractive primaries’
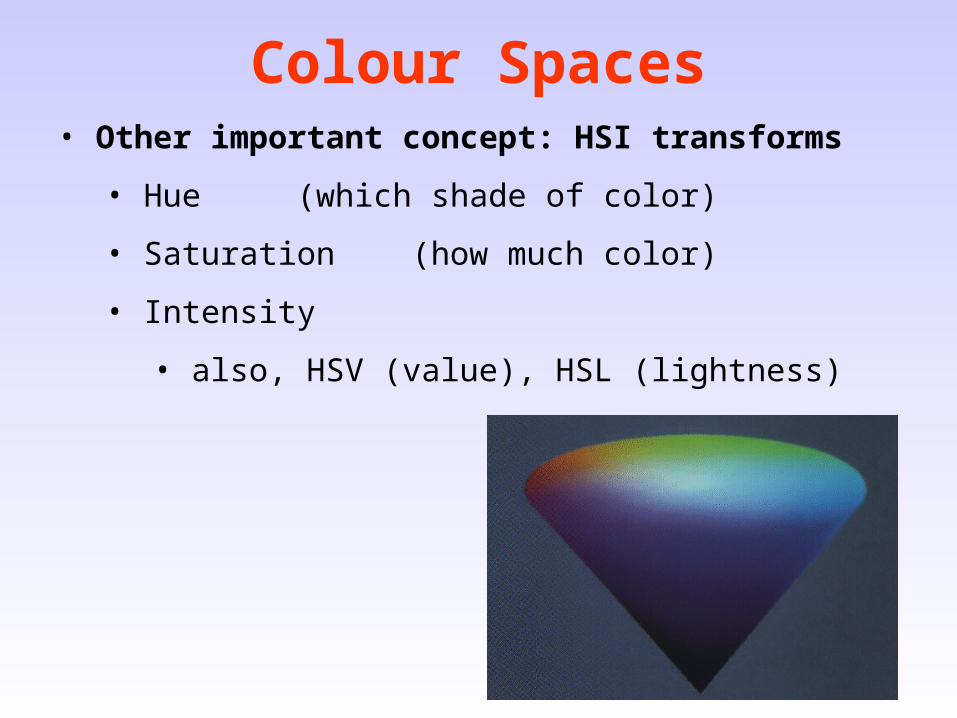
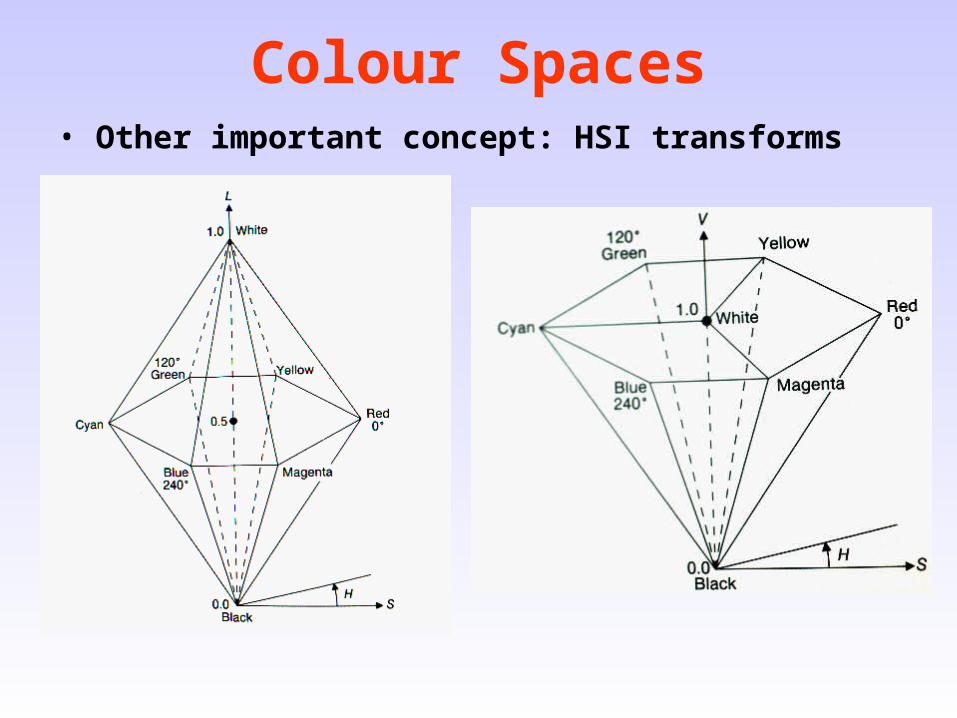
Colour Spaces• Other important concept: HSI transforms
• Hue (which shade of color)
• Saturation (how much color)
• Intensity
• also, HSV (value), HSL (lightness)
Colour Spaces• Other important concept: HSI transforms

Colour Spaces
• SPOT data fusion– 3 ‘colour’ bands (NRG) at 20m
– 1 ‘panchromatic’ band at 10m
• Fusion application
10m PAN 20m XS fused 10+20m
•Perform RGB-HSI transformation
•Replace I by higher resolution
•Perform HSI-RGB

Summary• Display
– Colour composites, greyscale Display, density slicing, pseudocoluor
• Image arithmetic– +
• Histogram Manipulation– properties, transformations
• Colour spaces– transforms, fusion

Summary
• Followup:– web material
• http://www.geog.ucl.ac.uk/~plewis/geog2021
• Mather chapters
• Follow up material on web and other RS texts
• Learn to use Science Direct for Journals