geochemical and isotopic evidence for palaeo-seawater...
TRANSCRIPT
Applied Geochemistry 26 (2011) 863–883
Contents lists available at ScienceDirect
Applied Geochemistry
journal homepage: www.elsevier .com/ locate/apgeochem
Geochemical and isotopic evidence for palaeo-seawater intrusioninto the south coast aquifer of Laizhou Bay, China
Dongmei Han a, Claus Kohfahl b, Xianfang Song a,⇑, Guoqiang Xiao c, Jilong Yang c
a Key Laboratory of Water Cycle and Related Land Surface Processes, Institute of Geographic Sciences and Natural Resources Research, Chinese Academy of Sciences,Beijing 100101, PR Chinab Instituto Geológico y Minero de España, Plaza de España, 41013 Seville, Spainc Tianjin Institute of Geology and Mineral Resources, Tianjin 300170, PR China
a r t i c l e i n f o a b s t r a c t
Article history:Received 8 June 2010Accepted 17 February 2011Available online 23 February 2011Editorial handling by I. Cartwright
0883-2927/$ - see front matter � 2011 Elsevier Ltd. Adoi:10.1016/j.apgeochem.2011.02.007
⇑ Corresponding author. Tel./fax: +86 10 64889849E-mail address: [email protected] (X. Song).
This research aims to improve the current knowledge of groundwater salinisation processes in coastalaquifers using combined hydrochemical and isotopic parameters and inverse hydrochemical modelling.Field investigations were conducted in Laizhou Bay, which is the area most seriously affected by seawaterintrusion in north China. During three sampling campaigns along a vertical transect in the Changyi-Liutuan area, 95 ground- and surface-water samples were collected for major ion and isotope analysis(2H/18O, 3H, 14C, 34S). The groundwater changes along the general flowpath towards the coast from fresh(<1 g/L), brackish (1–10 g/L), saline (10–100 g/L) to brine water (>100 g/L). Molar Cl/Br ratios are close tothose of seawater in almost all groundwater samples, indicating that brines and deep seawater evolvedfrom different events of palaeo-seawater intrusion. Depleted isotopic signatures of brines and deep salinewater point to a former, initially depleted seawater reservoir due to runoff dilution. Tritium and 14C activ-ities in deep saline water below confining units indicate isolation from modern precipitation and signif-icant residence times. Brine water shows a wide range of 3H and 14C ages due to the complex conditionsof mixing without isolation from modern groundwater. Sulphur-34 isotope ratios support seawater intru-sion as a possible salt origin, although this parameter does not exclude gypsum dissolution. The com-bined use of Cl and 18O yields four different end-members of groundwater, and three different mixingscenarios were identified explaining the hydrochemical composition of groundwater samples with inter-mediate salinity in the different areas. To improve understanding of the various water types and theirrelated processes in a spatial context, a conceptual model was developed integrating the results derivedfrom the presented data in a vertical cross-section. Results of three inverse modelling simulations usingPHREEQC-2 show that all hypothetical mixing scenarios derived from conservative components are ther-modynamically feasible. In all scenarios, mixing, ion exchange, dissolution of dolomite and precipitationof gypsum and calcite account for the hydrochemical changes.
� 2011 Elsevier Ltd. All rights reserved.
1. Introduction
Declining groundwater levels, caused by continuous over-exploitation of coastal aquifers, can result in saline water intrusion(Pinder, 1973; Custodio and Bruggeman, 1987; Essaid, 1990; Joneset al., 1999; Pulido-Leboeuf, 2004; Grassi et al., 2007). The associ-ated increase in concentrations of total dissolved solids (TDS) caneventually render freshwater resources unusable (Sherif andHamza, 2001). Saline water intrusion threatens drinking watersupplies, a large proportion of which are derived from groundwa-ter, in the coastal region of China. The Bohai Sea area, especiallyLaizhou Bay, experiences the most severe seawater intrusion inNorth China (Fig. 1a) (Meng et al., 1997).
ll rights reserved.
.
Concerns for long-term human and environmental health makeit important to understand how geological conditions control flowdynamics in coastal aquifers and how water and chemical fluxeschange in the freshwater–saltwater interface. The combination ofchemical and isotopic indicators to characterise the behaviour ofsalty water in the coastal groundwater circulation has previouslybeen applied to determine the origins of groundwater salinity,delineating flow systems and groundwater salinisation processes,examine migration of the fresh–salt water interface and under-stand the mixing relationships between saline water bodies andsurrounding freshwater in many coastal aquifers (e.g., Bergelsonet al., 1999; Kim et al., 2003; Marimuthu et al., 2005; Schiavoet al., 2009). To successfully describe groundwater flow, transport,and geochemical interactions under variable density conditions inrelation to real-world problems, detailed and accurate character-isation of the subsurface is required. Increasing Cl� and TDS con-centrations towards the coastline are good indicators of seawater

Fig. 1. Location map (a), modified after TJR (2006), and geologic cross-section (b) of study area. Legend: (a) 1. River; 2. Distribution range of alluvial–proluvial fan; 3. Fault; 4.Groundwater level depression (enclosed by 0 m water table); 5. Investigated boundary of Circum-Bohai-Sea area; 6. Paleochannel (Li et al., 2000); 7. Salt water intrusion areaduring 2000–2005 TJR (2006). (b) Arrows indicate groundwater flow directions from hydrogeological data. The geological background and brine location are modified fromHan et al. (1996). The vertical exaggeration is 357�.
864 D. Han et al. / Applied Geochemistry 26 (2011) 863–883
intrusion. In the process of seawater intrusion, mixing betweensaline and freshwater and water–rock interaction (e.g., cation ex-change processes with clays) may influence groundwater salinity
(Appelo and Postma, 2005; Vengosh et al., 2002; Sivan et al.,2005; Edmunds and Smedley, 2000; Grassi and Cortecci, 2005;Möller et al., 2007). Using multiple sources of chemical and isotope

D. Han et al. / Applied Geochemistry 26 (2011) 863–883 865
data combined with hydrogeological information may significantlyimprove the current understanding of seawater intrusionprocesses.
This paper presents a case study from the south coast plain ofLaizhou Bay, Shandong province, north China. Previous work haslargely dealt with saltwater intrusion mechanisms, groundwaterflow modelling, the formation of brine waters, and preventivecountermeasures for seawater intrusion (e.g., Zhang et al., 1996;Li et al., 2000), which has become the critical focus of hydrogeolog-ical research in the bay (e.g., Chen et al., 1997; Zhang and Peng,1998; Xue et al., 2000). The management of this coastal aquiferrequires an understanding of the main processes controlling thegroundwater salinity and geochemical evolution. In contrast toprevious work, this study integrates 2H/18O data and 3H, 34S and14C analyses. A number of samples from the deeper aquifers areincluded, giving additional insight into the hydrogeochemical pro-cesses at different depths. Based on this extensive data set, this re-search aims to demonstrate how major ion chemistry, isotopes,hydraulic data and hydrochemical modelling can be combined ina multi-approach study related to saltwater intrusion to (i) identifythe different salt sources and their contribution to the presenthorizontal and vertical salinity distribution, (ii) estimate thegroundwater age and mixing behaviour between different end-members, and (iii) improve the understanding of reactive transportprocesses in determining the hydrogeochemical evolution ofdifferent types of groundwater.
2. Study area
2.1. Geological and hydrogeological setting
The southern part of Laizhou Bay covers approximately2870 km2 in Shandong province, northeastern China (Fig. 1a). Thenorthern boundary of the study area is Laizhou Bay (Bohai Sea)with a coastline of 12.8 km. It contains a series of Cretaceous toRecent sediments that overlie the Palaeozoic basement. Thedepositional facies of the aquifer change from south to north, fromalluvium to proluvial to marine sediments on the coastal plain. Themain aquifers in the study area are composed of Quaternary sedi-ments with a thickness of 30–50 m in the south and up to 300 m inthe north (Xue et al., 2000). The strata in the upper proluvial fan inthe south mainly consist of gravel and coarse sandstone, grading tofine sand, silt, sandy clay, and silty clay towards the coast.
The vertical structure is shown in Fig. 1b. The northern part ofthe aquifer in the study area is split into two different units sepa-rated by confining layers. There is a general upwards trend fromcoarse- to fine-grained material. As shown in Fig. 1b, the southernmountains and the unconfined part of the aquifer constitute themain recharge areas, and the general natural groundwater flowpattern is from south to north although the general flow patternmay be altered considerably by highly permeable erosion channelscrossing the area, as shown in the cross-section (Fig. 1b).
Brines have been detected up to 10 km from the shoreline (Hanet al., 1996; Zhang and Peng, 1998). According to previous studiesby Xue et al. (2000) the brines were assumed to have originatedfrom ancient seawater during three occurrences of marine invasionand regression along the coast of Laizhou Bay since the middle LatePleistocene (39–24 ka B.P.), and formed by evaporation of ancientseawater in combination with re-dissolution of salts and mixing.Brine water is mainly distributed in depths of 0–15 m, 33–42 m,and 59–74 m, forming three different layers separated by confiningunits.
The mineralogy of the shallow aquifer includes quartz, anor-thite, albite, plagioclase feldspar, picrite, biotite, aragonite, dolo-mite, calcite, kaolinite, gibbsite and Ca–montmorillonite. Only
minor amounts of evaporites (e.g., gypsum, anhydrite, halite, poly-halite, bischofite, epsomite) are present locally (Zhang et al., 1996;Han et al., 1996; Xue et al., 2000). Owing to the marine deposi-tional environment, there are more chemical sediments in theaquifer matrix towards the coastline, especially in the saline andbrine water zones (Han et al., 1996). Gypsum deposits are commonin the coastal saltwater zone (Zhang and Peng, 1998). By contrast,silicate rocks dominate the freshwater zone at the top of the WeiRiver alluvial fan to the south. The clay layers are composed of il-lite, kaolinite and chlorite (Zhao, 1996). In the southern mountain-ous areas of Laizhou Bay, bedrock is mainly composed ofCretaceous and Neogene basalt, andesite, trachyte and pyroclasticrock that consist of anorthite, albite, K-feldspar and biotite (Ning,2004). In the area near Xiaying, the lithology is fine sand, withcoarse sand to gravel from the upper to the lower part, the mainminerals being quartz, mica and feldspar. Calcite-rich nodulesand re-precipitated gypsum occur in the clay interbed layer (Hanet al., 1996).
Additionally, in the downstream region of Weihe River, a palae-ochannel is well developed, with very thick layers of coarse-grained deposits formed during the early Late Pleistocene. The pal-aeochannel provides well-connected paths for brine/seawaterintrusion (Li et al., 2000). From south to north, the buried depthof the top of the sand layer in the alluvial fan ranges from 5 to50 m; the depth to the bottom is 8–65 m.
2.2. Climatic and hydrological background
On the basis of a 45-a record in the study area, the mean annualprecipitation is estimated to be 630 mm, and the average annualtemperature is 12 �C. Of the total annual precipitation, 60–70% fallsbetween June and August. The average annual evaporation basedon pan evaporation experiments is about 1640 mm, chiefly fromApril to June. Elevation ranges from 30 m a.s.l. in the south to1–2 m a.s.l. in the north (Chen et al., 1997).
The Weihe River is the main water course in the study area andshows intermittent discharge characteristics, depending on rain-fall. Its annual average streamflow is 1.5 � 108 m3/a. The river headis normally located several metres above the groundwater level,and infiltration from the river recharges the groundwater.
2.3. Environmental issues
Owing to the concentration of human habitation, urbanisationand agricultural activity, increasing demand for groundwater hascaused a gradual increase in saltwater intrusion over recent years,a problem that has been known to local authorities since 1976 (Ji,1991). Before 1975, the water demand was lower and the ground-water in the study area retained its natural status, flowing fromsouth to north, then discharging into Laizhou Bay. After 1983,two water supply centres were installed that disrupted the naturalflow pattern by forming two drawdown cones caused by over-exploitation under weak recharge conditions. The first cone nearChangyi city, about 22 km away from the coast, has led to a waterlevel decline of 15 m and the intrusion of saline water into thefreshwater aquifer (Fig. 1a). The heavy over-exploitation ofgroundwater resources in the deep aquifers results in a downwardgradient between the upper and the lower aquifers (TJR, 2006).Nonetheless, the hydraulic head of the deep aquifer is locally high-er than the shallower groundwater level, leading to upconing ofthe fresh–salt water interface (location indicated in the cross-sec-tion of Fig. 1b). The second depression is located in the coastalaquifer of Laizhou Bay near Xiaying close to the coast and is relatedto exploitation of shallow brines for obtaining salt by means ofevaporation since the late 1980s (Chen et al., 1997). Here the
866 D. Han et al. / Applied Geochemistry 26 (2011) 863–883
groundwater level dropped to �22.7 m a.s.l. in 2005, showing anannual decline of up to 1 m/a.
According to Fetter (1994) and Nonner (2006), groundwatersamples were divided into four types: fresh, brackish, saline andbrine water, with TDS of <1 g/L, 1–10 g/L, 10–100 g/L, and>100 g/L, respectively. Under natural conditions before intensivegroundwater exploitation, a gradual transition from brines to freshwater had developed over an extended period, leading to the for-mation of brackish and saline water as intermediate types. Theexcessive abstraction of fresh water caused the brackish and saltwater to advance landwards, forming an undulating salt water/fresh water interface due to exploitation dynamics and the hydro-geological heterogeneity.
3. Methods
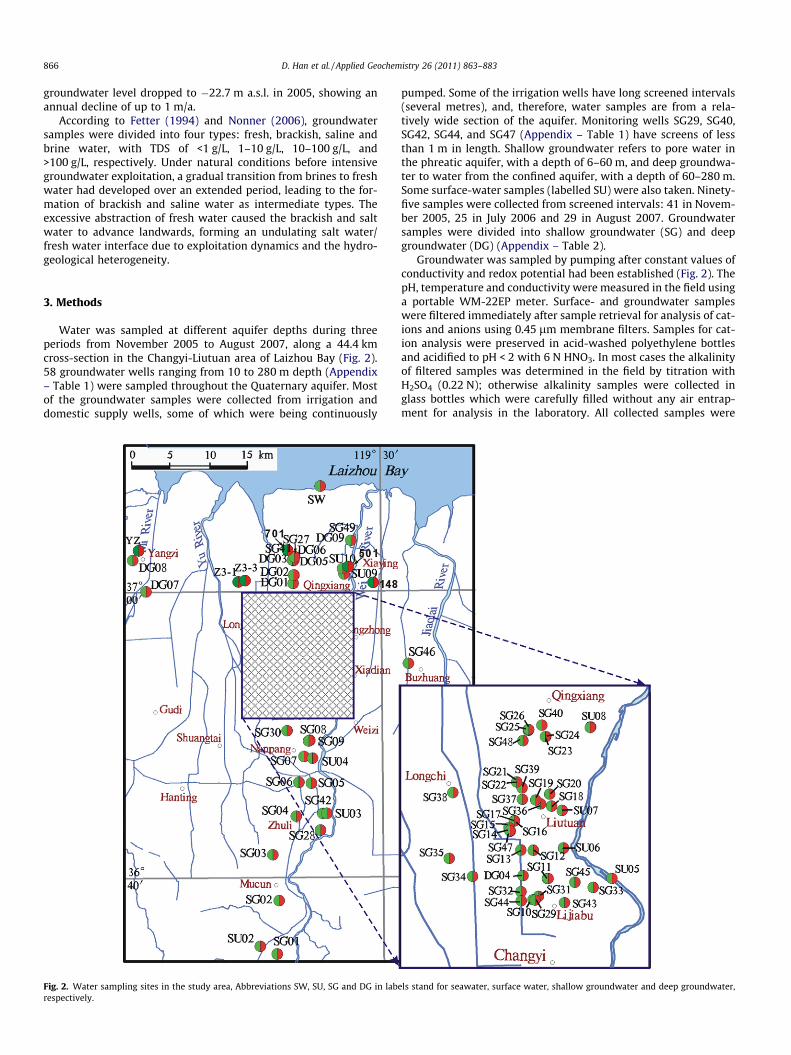
Water was sampled at different aquifer depths during threeperiods from November 2005 to August 2007, along a 44.4 kmcross-section in the Changyi-Liutuan area of Laizhou Bay (Fig. 2).58 groundwater wells ranging from 10 to 280 m depth (Appendix– Table 1) were sampled throughout the Quaternary aquifer. Mostof the groundwater samples were collected from irrigation anddomestic supply wells, some of which were being continuously
Fig. 2. Water sampling sites in the study area, Abbreviations SW, SU, SG and DG in labrespectively.
pumped. Some of the irrigation wells have long screened intervals(several metres), and, therefore, water samples are from a rela-tively wide section of the aquifer. Monitoring wells SG29, SG40,SG42, SG44, and SG47 (Appendix – Table 1) have screens of lessthan 1 m in length. Shallow groundwater refers to pore water inthe phreatic aquifer, with a depth of 6–60 m, and deep groundwa-ter to water from the confined aquifer, with a depth of 60–280 m.Some surface-water samples (labelled SU) were also taken. Ninety-five samples were collected from screened intervals: 41 in Novem-ber 2005, 25 in July 2006 and 29 in August 2007. Groundwatersamples were divided into shallow groundwater (SG) and deepgroundwater (DG) (Appendix – Table 2).
Groundwater was sampled by pumping after constant values ofconductivity and redox potential had been established (Fig. 2). ThepH, temperature and conductivity were measured in the field usinga portable WM-22EP meter. Surface- and groundwater sampleswere filtered immediately after sample retrieval for analysis of cat-ions and anions using 0.45 lm membrane filters. Samples for cat-ion analysis were preserved in acid-washed polyethylene bottlesand acidified to pH < 2 with 6 N HNO3. In most cases the alkalinityof filtered samples was determined in the field by titration withH2SO4 (0.22 N); otherwise alkalinity samples were collected inglass bottles which were carefully filled without any air entrap-ment for analysis in the laboratory. All collected samples were
els stand for seawater, surface water, shallow groundwater and deep groundwater,
D. Han et al. / Applied Geochemistry 26 (2011) 863–883 867
stored at 4 �C in HDPE bottles with watertight caps. Hydrochemicalanalyses were performed using a High Performance Ion Chromato-graph (SHIMADZU). Only analyses with charge balance errorsbelow 5% were considered in this study.
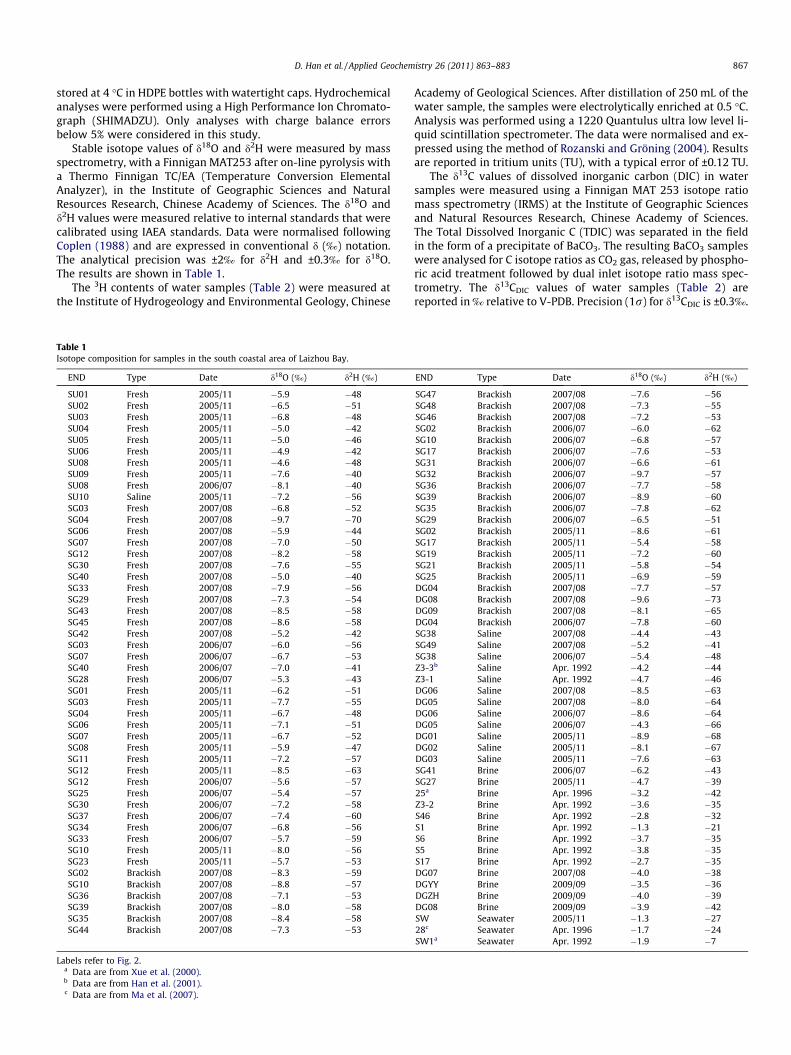
Stable isotope values of d18O and d2H were measured by massspectrometry, with a Finnigan MAT253 after on-line pyrolysis witha Thermo Finnigan TC/EA (Temperature Conversion ElementalAnalyzer), in the Institute of Geographic Sciences and NaturalResources Research, Chinese Academy of Sciences. The d18O andd2H values were measured relative to internal standards that werecalibrated using IAEA standards. Data were normalised followingCoplen (1988) and are expressed in conventional d (‰) notation.The analytical precision was ±2‰ for d2H and ±0.3‰ for d18O.The results are shown in Table 1.
The 3H contents of water samples (Table 2) were measured atthe Institute of Hydrogeology and Environmental Geology, Chinese
Table 1Isotope composition for samples in the south coastal area of Laizhou Bay.
END Type Date d18O (‰) d2H (‰)
SU01 Fresh 2005/11 �5.9 �48SU02 Fresh 2005/11 �6.5 �51SU03 Fresh 2005/11 �6.8 �48SU04 Fresh 2005/11 �5.0 �42SU05 Fresh 2005/11 �5.0 �46SU06 Fresh 2005/11 �4.9 �42SU08 Fresh 2005/11 �4.6 �48SU09 Fresh 2005/11 �7.6 �40SU08 Fresh 2006/07 �8.1 �40SU10 Saline 2005/11 �7.2 �56SG03 Fresh 2007/08 �6.8 �52SG04 Fresh 2007/08 �9.7 �70SG06 Fresh 2007/08 �5.9 �44SG07 Fresh 2007/08 �7.0 �50SG12 Fresh 2007/08 �8.2 �58SG30 Fresh 2007/08 �7.6 �55SG40 Fresh 2007/08 �5.0 �40SG33 Fresh 2007/08 �7.9 �56SG29 Fresh 2007/08 �7.3 �54SG43 Fresh 2007/08 �8.5 �58SG45 Fresh 2007/08 �8.6 �58SG42 Fresh 2007/08 �5.2 �42SG03 Fresh 2006/07 �6.0 �56SG07 Fresh 2006/07 �6.7 �53SG40 Fresh 2006/07 �7.0 �41SG28 Fresh 2006/07 �5.3 �43SG01 Fresh 2005/11 �6.2 �51SG03 Fresh 2005/11 �7.7 �55SG04 Fresh 2005/11 �6.7 �48SG06 Fresh 2005/11 �7.1 �51SG07 Fresh 2005/11 �6.7 �52SG08 Fresh 2005/11 �5.9 �47SG11 Fresh 2005/11 �7.2 �57SG12 Fresh 2005/11 �8.5 �63SG12 Fresh 2006/07 �5.6 �57SG25 Fresh 2006/07 �5.4 �57SG30 Fresh 2006/07 �7.2 �58SG37 Fresh 2006/07 �7.4 �60SG34 Fresh 2006/07 �6.8 �56SG33 Fresh 2006/07 �5.7 �59SG10 Fresh 2005/11 �8.0 �56SG23 Fresh 2005/11 �5.7 �53SG02 Brackish 2007/08 �8.3 �59SG10 Brackish 2007/08 �8.8 �57SG36 Brackish 2007/08 �7.1 �53SG39 Brackish 2007/08 �8.0 �58SG35 Brackish 2007/08 �8.4 �58SG44 Brackish 2007/08 �7.3 �53
Labels refer to Fig. 2.a Data are from Xue et al. (2000).b Data are from Han et al. (2001).c Data are from Ma et al. (2007).
Academy of Geological Sciences. After distillation of 250 mL of thewater sample, the samples were electrolytically enriched at 0.5 �C.Analysis was performed using a 1220 Quantulus ultra low level li-quid scintillation spectrometer. The data were normalised and ex-pressed using the method of Rozanski and Gröning (2004). Resultsare reported in tritium units (TU), with a typical error of ±0.12 TU.
The d13C values of dissolved inorganic carbon (DIC) in watersamples were measured using a Finnigan MAT 253 isotope ratiomass spectrometry (IRMS) at the Institute of Geographic Sciencesand Natural Resources Research, Chinese Academy of Sciences.The Total Dissolved Inorganic C (TDIC) was separated in the fieldin the form of a precipitate of BaCO3. The resulting BaCO3 sampleswere analysed for C isotope ratios as CO2 gas, released by phospho-ric acid treatment followed by dual inlet isotope ratio mass spec-trometry. The d13CDIC values of water samples (Table 2) arereported in ‰ relative to V-PDB. Precision (1r) for d13CDIC is ±0.3‰.
END Type Date d18O (‰) d2H (‰)
SG47 Brackish 2007/08 �7.6 �56SG48 Brackish 2007/08 �7.3 �55SG46 Brackish 2007/08 �7.2 �53SG02 Brackish 2006/07 �6.0 �62SG10 Brackish 2006/07 �6.8 �57SG17 Brackish 2006/07 �7.6 �53SG31 Brackish 2006/07 �6.6 �61SG32 Brackish 2006/07 �9.7 �57SG36 Brackish 2006/07 �7.7 �58SG39 Brackish 2006/07 �8.9 �60SG35 Brackish 2006/07 �7.8 �62SG29 Brackish 2006/07 �6.5 �51SG02 Brackish 2005/11 �8.6 �61SG17 Brackish 2005/11 �5.4 �58SG19 Brackish 2005/11 �7.2 �60SG21 Brackish 2005/11 �5.8 �54SG25 Brackish 2005/11 �6.9 �59DG04 Brackish 2007/08 �7.7 �57DG08 Brackish 2007/08 �9.6 �73DG09 Brackish 2007/08 �8.1 �65DG04 Brackish 2006/07 �7.8 �60SG38 Saline 2007/08 �4.4 �43SG49 Saline 2007/08 �5.2 �41SG38 Saline 2006/07 �5.4 �48Z3-3b Saline Apr. 1992 �4.2 �44Z3-1 Saline Apr. 1992 �4.7 �46DG06 Saline 2007/08 �8.5 �63DG05 Saline 2007/08 �8.0 �64DG06 Saline 2006/07 �8.6 �64DG05 Saline 2006/07 �4.3 �66DG01 Saline 2005/11 �8.9 �68DG02 Saline 2005/11 �8.1 �67DG03 Saline 2005/11 �7.6 �63SG41 Brine 2006/07 �6.2 �43SG27 Brine 2005/11 �4.7 �3925a Brine Apr. 1996 �3.2 �42Z3-2 Brine Apr. 1992 �3.6 �35S46 Brine Apr. 1992 �2.8 �32S1 Brine Apr. 1992 �1.3 �21S6 Brine Apr. 1992 �3.7 �35S5 Brine Apr. 1992 �3.8 �35S17 Brine Apr. 1992 �2.7 �35DG07 Brine 2007/08 �4.0 �38DGYY Brine 2009/09 �3.5 �36DGZH Brine 2009/09 �4.0 �39DG08 Brine 2009/09 �3.9 �42SW Seawater 2005/11 �1.3 �2728c Seawater Apr. 1996 �1.7 �24SW1a Seawater Apr. 1992 �1.9 �7

Table 2Tritium and carbon-14 composition of sampled water.
Label Water type Sampling time Well depth 3H (TU) r (TU) d13C 14C (pmc) r (pmc) Uncorrected 14C age (years BP) Error (years)
SU01 Fresh Nov. 2005 6.0 ±0.5SU03 Fresh Nov. 2005 5.1 ±0.7SU04 Fresh Nov. 2005 6.6 ±0.6SU05 Fresh Nov. 2005 7.8 ±0.6SU08 Fresh Nov. 2005 6.6 ±0.5SU09 Fresh Nov. 2005 6.6 ±0.5SG01 Fresh Nov. 2005 25 7.5 ±0.6SG03 Fresh Nov. 2005 14 12.6 ±0.6SG04 Fresh Nov. 2005 14 7.0 ±0.8SG06 Fresh Nov. 2005 12 5.9 ±0.6SG07 Fresh Nov. 2005 25 7.6 ±0.6SG08 Fresh Nov. 2005 28 6.1 ±0.6SG10 Fresh Nov. 2005 40 2.0 ±0.5SG11 Fresh Nov. 2005 30 6.7 ±0.5SG12 Fresh Nov. 2005 35 9.5 ±0.6SG23 Fresh Nov. 2005 20 8.1 ±0.5SG03 Fresh Jul. 2006 14 11.7 ±0.5 �10.71 105.41 0.49 ModernSG07 Fresh Jul. 2006 25 8 ±0.5 �9.30 101.81 0.48 ModernSG30 Fresh Jul. 2006 35 7.3 ±0.5 �10.69 79.84 0.31 1800 40SG04 Fresh Aug. 2007 14 6.0 ±0.6SG12 Fresh Aug. 2007 35 15.3 ±0.5SG29 Fresh Aug. 2007 30 �10.00 87.11 0.22 1100 30SG02 Brackish Nov. 2005 16 11.8 ±0.7SG17 Brackish Nov. 2005 20 5.2 ±0.5SG19 Brackish Nov. 2005 24 4.4 ±0.5SG21 Brackish Nov. 2005 18 10.3 ±0.9SG25 Brackish Nov. 2005 14 4.2 ±0.5SG02 Brackish Jul. 2006 16 10.1 ±0.6 �11.86 106.88 0.43 ModernSG10 Brackish Jul. 2006 40 1.8 ±0.5 �10.34 79.99 0.25 1800 35SG17 Brackish Jul. 2006 30 3.5 ±0.5SG36 Brackish Jul. 2006 20 2.6 ±0.5 �11.94 63.35 0.21 3700 35DG04 Brackish Jul. 2006 65 <1 �8.68 70.46 0.24 2800 35SG10 Brackish Aug. 2007 40 4.4 0.9 �11.56 81.01 0.25 1700 35SG39 Brackish Aug. 2007 35 3.1 0.9 �8.15 54.23 0.2 4900 40SG47 Brackish Aug. 2007 35 2.6 0.8 �9.35 62.01 0.25 3800 40SG48 Brackish Aug. 2007 30 6.8 1.0 �11.67 80.02 0.3 1800 40DG04 Brackish Aug. 2007 65 2.6 0.9 �9.52 76.39 0.23 2200 35DG08 Brackish Aug. 2007 180 �9.79 5.54 0.05 23,200 75DG09 Brackish Aug. 2007 280 �10.10 11.38 0.08 17,500 65SU10 Saline Nov. 2005 1.7 ±0.5DG01 Saline Nov. 2005 80 1.4 ±0.5DG02 Saline Nov. 2005 100 <1DG03 Saline Nov. 2005 75 <1DG05 Saline Jul. 2006 125 <1 �10.58 15.81 0.14 14,800 75DG06 Saline Jul. 2006 86 <1 �9.08 30.22 0.13 9600 40DG05 Saline Jul. 2007 125 �9.73 12 0.07 17,000 55SG27 Brine Nov. 2005 40 3.4 ±0.5SG41 Brine Jul. 2006 30 2.3 ±0.5 �12.93 62.68 0.21 3800 35DG07 Brine Aug. 2007 60 3.5 0.9 �15.47 37.2 0.15 7900 40SW Seawater Nov. 2005 7.3 ±0.6
868 D. Han et al. / Applied Geochemistry 26 (2011) 863–883
The 14C activities were determined by a compact AMS systembased on a NEC (National Electrostatics Corporation) Model1.5SDH-1 Pelletron accelerator in the Institute of Heavy Ion Physics& Key Laboratory of Heavy Ion Physics, Ministry of Education, Pek-ing University, Beijing. The activities are expressed as percentmodern C (pmC) (Table 2). The accuracy of this system is betterthan 0.4%, and the instrument background is lower than0.03 pmC. By convention, the 14C age is expressed in years BP (Be-fore Present), where 1950 is taken as the start year. Calculations ofminimum 14C ages were carried out according to Clark and Fritz(1997):
t ¼ �8267 � ln a14t C
q � a14o C
� �ð1Þ
with t = groundwater age in years, at14C = measured activity of 14C,
a014C = modern 14C activity of soil derived DIC and q = mixing factor.
The mixing factor accounts for the dissolution of calcite, which isassumed to be free of 14C and, therefore, dilutes the initial 14C activ-ity of aqueous DIC in recharged water.
Several methods exist to calculate the q factor, but the selectionof an adequate approach for all the water samples is problematicowing to their different ages and conditions of recharge. An over-view of the different methods is given by Clark and Fritz (1997).Conditions during recharge in the study site are unknown andmay have changed from rain water to seawater infiltration underopen and/or closed conditions over space and time. Therefore, inthis study different methods were used to correct 14C ages forcarbonate dissolution considering either only chemical mixingbetween the C compounds or isotopic fractionation using 14C activ-ities, d13C values and alkalinities as compiled in Table 3. The inputvariables and references used in the corresponding methods arecompiled in Table 4.
3.1. Sulphate isotopes
The d34SSO4 samples were collected in 1 L polyethylene bottlesand acidified to pH < 3 with 6 N HNO3. The d34SSO4 was determinedby converting precipitated BaSO4 to SO2 using the method of Halas

Table 3Analytical results for the corrected groundwater age of water samples in the coastal aquifers of Laizhou Bay.
Well label watertype
Samplingtime
Welldepth (m)
3H (TU) HCO�3(mg/L)
14C (pmc) Temp. (�C) pH d13CDIC
(PDB)
14C agea
(uncorrected, a)
14C ageb
(STAT model, a)
14C agec
(ALK model, a)
14C aged
(d13C model, a)
14C agee
(CMB, a)Mean age (a)
q 14C age q 14C age q 14C age
SG03 Fresh Jul. 2006 14 11.7 384.4 105.41 25 7.89 -10.71 Modern Modern 0.51 Modern 0.96 Modern 0.64 Modern ModernSG07 Fresh Jul. 2006 25 8 333.2 101.81 14.6 7.78 -9.30 Modern Modern 0.52 Modern 0.93 Modern 0.70 Modern ModernSG30 Fresh Jul. 2006 35 7.3 533.5 79.84 20.8 6.97 -10.69 1900 500 0.60 Modern 0.89 900 0.61 Modern ModernSG29 Fresh Aug. 2007 30 368.4 87.11 15.1 7.16 -10.00 1100 Modern 0.58 Modern 0.90 300 0.93 500 ModernSG02 Brackish Jul. 2006 16 10.1 447.9 106.88 15.5 7.15 -11.86 Modern Modern 0.58 Modern 1.02 Modern ModernSG10 Brackish Jul. 2006 40 1.8 765.9 79.99 15.4 7.18 -10.34 1800 500 0.57 Modern 0.93 1200 ModernSG36 Brackish Jul. 2006 20 2.6 877.1 63.35 15.3 7.41 -11.94 3800 2400 1.07 4300 3200 ± 900DG04 Brackish Jul. 2006 65 <1 1056 70.46 16.6 7.05 -8.68 2900 1600 0.79 1000 1300 ± 600SG10 Brackish Aug. 2007 40 4.4 630.7 81.01 15.2 7.41 -11.56 1700 400 0.55 Modern 1.04 2100 0.90 900 ModernSG39 Brackish Aug. 2007 35 3.1 1057.9 54.23 16.1 7.51 -8.15 5100 3700 0.82 3400 0.75 2700 3200 ± 500SG47 Brackish Aug. 2007 35 2.6 755.5 62.01 15.3 7.74 -9.35 4000 2600 0.92 3300 1.02 4100 3400 ± 800SG48 Brackish Aug. 2007 30 6.8 754 80.02 15.2 7.37 -11.67 1800 500 1.04 2200 1.01 1900 1500 ± 700DG04 Brackish Aug. 2007 65 2.6 566.2 76.39 17.7 7.55 -9.52 2200 900 0.91 1400 1100 ± 100DG08 Brackish Aug. 2007 180 355.5 5.54 22 7.57 -9.79 23,900 22,600 0.53 18,700 0.90 23,100 0.82 22,300 21,700 ± 2400DG09 Brackish Aug. 2007 280 179.2 11.38 20 6.88 -10.10 18,000 16,600 0.62 14,000 0.84 16,500 2.71 26,200 18,300 ± 1100DG05 Saline Jul. 2006 125 <1 406.6 15.81 18 6.65 -10.58 15,200 13,900 0.68 12,100 0.82 13,600 13,200 ± 900DG06 Saline Jul. 2006 86 <1 578.9 30.22 16.8 6.94 -9.08 9900 8600 0.61 5900 0.80 8000 1.62 13,900 7500 ± 1400DG05 Saline Jul. 2007 125 176.3 12 18.5 6.92 -9.73 17,500 16,200 0.62 13,500 0.83 16,000 15,200 ± 1500SG41 Brine Jul. 2006 30 2.3 865.2 62.68 16.5 6.53 -12.93 3900 2500 0.72 1100 0.92 3200 2300 ± 700DG07 Brine Aug. 2007 60 3.5 463 37.2 16.1 6.58 -15.47 8200 6800 0.70 5300 1.07 8800 7000 ± 1000
Modern: Containing component of post 1950s recharge.a Uncorrected age calculated by original data.b STAT model (statistical correction) by Vogel (1970).c ALK model (alkalinity correction) by Tamers (1975).d d13C model by Pearson and Hanshaw (1970).e CMB model (chemical mass-balance correction) proposed by Fontes and Garnier (1979).
D.H
anet
al./Applied
Geochem
istry26
(2011)863–
883869
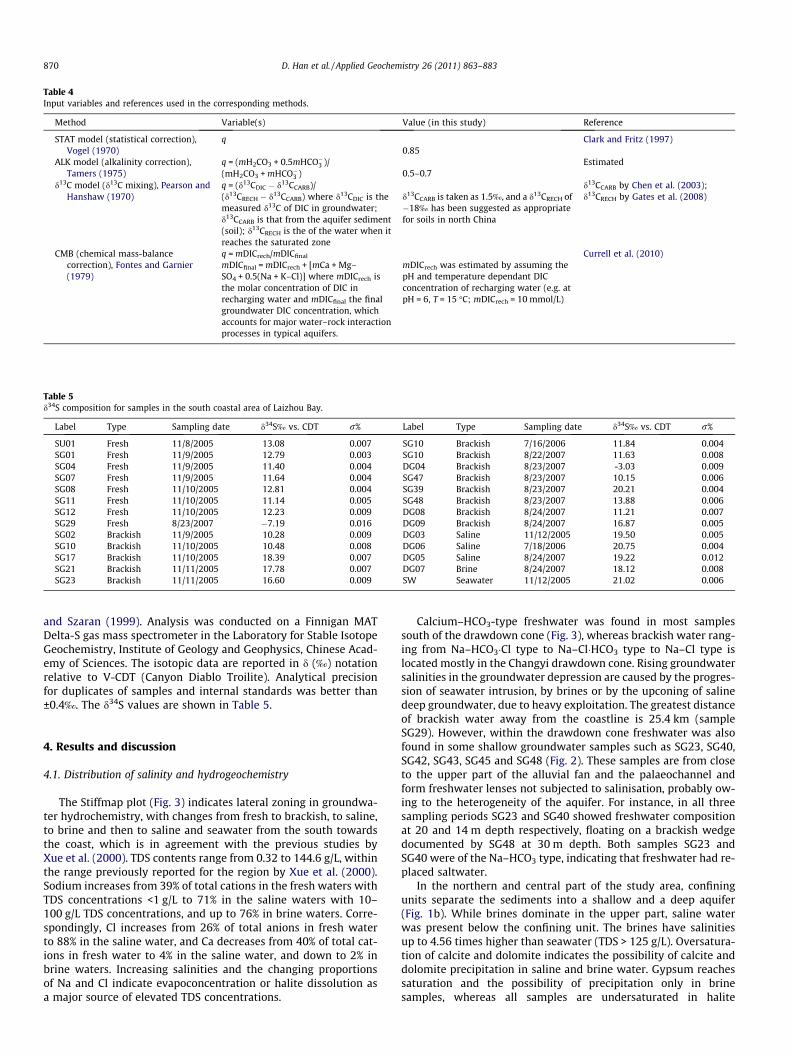
Table 4Input variables and references used in the corresponding methods.
Method Variable(s) Value (in this study) Reference
STAT model (statistical correction),Vogel (1970)
q0.85
Clark and Fritz (1997)
ALK model (alkalinity correction),Tamers (1975)
q = (mH2CO3 + 0.5mHCO�3 )/(mH2CO3 + mHCO�3 ) 0.5–0.7
Estimated
d13C model (d13C mixing), Pearson andHanshaw (1970)
q = (d13CDIC � d13CCARB)/(d13CRECH � d13CCARB) where d13CDIC is themeasured d13C of DIC in groundwater;d13CCARB is that from the aquifer sediment(soil); d13CRECH is the of the water when itreaches the saturated zone
d13CCARB is taken as 1.5‰, and a d13CRECH of�18‰ has been suggested as appropriatefor soils in north China
d13CCARB by Chen et al. (2003);d13CRECH by Gates et al. (2008)
CMB (chemical mass-balancecorrection), Fontes and Garnier(1979)
q = mDICrech/mDICfinal
mDICfinal = mDICrech + [mCa + Mg–SO4 + 0.5(Na + K–Cl)] where mDICrech isthe molar concentration of DIC inrecharging water and mDICfinal the finalgroundwater DIC concentration, whichaccounts for major water–rock interactionprocesses in typical aquifers.
mDICrech was estimated by assuming thepH and temperature dependant DICconcentration of recharging water (e.g. atpH = 6, T = 15 �C; mDICrech = 10 mmol/L)
Currell et al. (2010)
Table 5d34S composition for samples in the south coastal area of Laizhou Bay.
Label Type Sampling date d34S‰ vs. CDT r% Label Type Sampling date d34S‰ vs. CDT r%
SU01 Fresh 11/8/2005 13.08 0.007 SG10 Brackish 7/16/2006 11.84 0.004SG01 Fresh 11/9/2005 12.79 0.003 SG10 Brackish 8/22/2007 11.63 0.008SG04 Fresh 11/9/2005 11.40 0.004 DG04 Brackish 8/23/2007 -3.03 0.009SG07 Fresh 11/9/2005 11.64 0.004 SG47 Brackish 8/23/2007 10.15 0.006SG08 Fresh 11/10/2005 12.81 0.004 SG39 Brackish 8/23/2007 20.21 0.004SG11 Fresh 11/10/2005 11.14 0.005 SG48 Brackish 8/23/2007 13.88 0.006SG12 Fresh 11/10/2005 12.23 0.009 DG08 Brackish 8/24/2007 11.21 0.007SG29 Fresh 8/23/2007 �7.19 0.016 DG09 Brackish 8/24/2007 16.87 0.005SG02 Brackish 11/9/2005 10.28 0.009 DG03 Saline 11/12/2005 19.50 0.005SG10 Brackish 11/10/2005 10.48 0.008 DG06 Saline 7/18/2006 20.75 0.004SG17 Brackish 11/10/2005 18.39 0.007 DG05 Saline 8/24/2007 19.22 0.012SG21 Brackish 11/11/2005 17.78 0.007 DG07 Brine 8/24/2007 18.12 0.008SG23 Brackish 11/11/2005 16.60 0.009 SW Seawater 11/12/2005 21.02 0.006
870 D. Han et al. / Applied Geochemistry 26 (2011) 863–883
and Szaran (1999). Analysis was conducted on a Finnigan MATDelta-S gas mass spectrometer in the Laboratory for Stable IsotopeGeochemistry, Institute of Geology and Geophysics, Chinese Acad-emy of Sciences. The isotopic data are reported in d (‰) notationrelative to V-CDT (Canyon Diablo Troilite). Analytical precisionfor duplicates of samples and internal standards was better than±0.4‰. The d34S values are shown in Table 5.
4. Results and discussion
4.1. Distribution of salinity and hydrogeochemistry
The Stiffmap plot (Fig. 3) indicates lateral zoning in groundwa-ter hydrochemistry, with changes from fresh to brackish, to saline,to brine and then to saline and seawater from the south towardsthe coast, which is in agreement with the previous studies byXue et al. (2000). TDS contents range from 0.32 to 144.6 g/L, withinthe range previously reported for the region by Xue et al. (2000).Sodium increases from 39% of total cations in the fresh waters withTDS concentrations <1 g/L to 71% in the saline waters with 10–100 g/L TDS concentrations, and up to 76% in brine waters. Corre-spondingly, Cl increases from 26% of total anions in fresh waterto 88% in the saline water, and Ca decreases from 40% of total cat-ions in fresh water to 4% in the saline water, and down to 2% inbrine waters. Increasing salinities and the changing proportionsof Na and Cl indicate evapoconcentration or halite dissolution asa major source of elevated TDS concentrations.
Calcium–HCO3-type freshwater was found in most samplessouth of the drawdown cone (Fig. 3), whereas brackish water rang-ing from Na–HCO3�Cl type to Na–Cl�HCO3 type to Na–Cl type islocated mostly in the Changyi drawdown cone. Rising groundwatersalinities in the groundwater depression are caused by the progres-sion of seawater intrusion, by brines or by the upconing of salinedeep groundwater, due to heavy exploitation. The greatest distanceof brackish water away from the coastline is 25.4 km (sampleSG29). However, within the drawdown cone freshwater was alsofound in some shallow groundwater samples such as SG23, SG40,SG42, SG43, SG45 and SG48 (Fig. 2). These samples are from closeto the upper part of the alluvial fan and the palaeochannel andform freshwater lenses not subjected to salinisation, probably ow-ing to the heterogeneity of the aquifer. For instance, in all threesampling periods SG23 and SG40 showed freshwater compositionat 20 and 14 m depth respectively, floating on a brackish wedgedocumented by SG48 at 30 m depth. Both samples SG23 andSG40 were of the Na–HCO3 type, indicating that freshwater had re-placed saltwater.
In the northern and central part of the study area, confiningunits separate the sediments into a shallow and a deep aquifer(Fig. 1b). While brines dominate in the upper part, saline waterwas present below the confining unit. The brines have salinitiesup to 4.56 times higher than seawater (TDS > 125 g/L). Oversatura-tion of calcite and dolomite indicates the possibility of calcite anddolomite precipitation in saline and brine water. Gypsum reachessaturation and the possibility of precipitation only in brinesamples, whereas all samples are undersaturated in halite
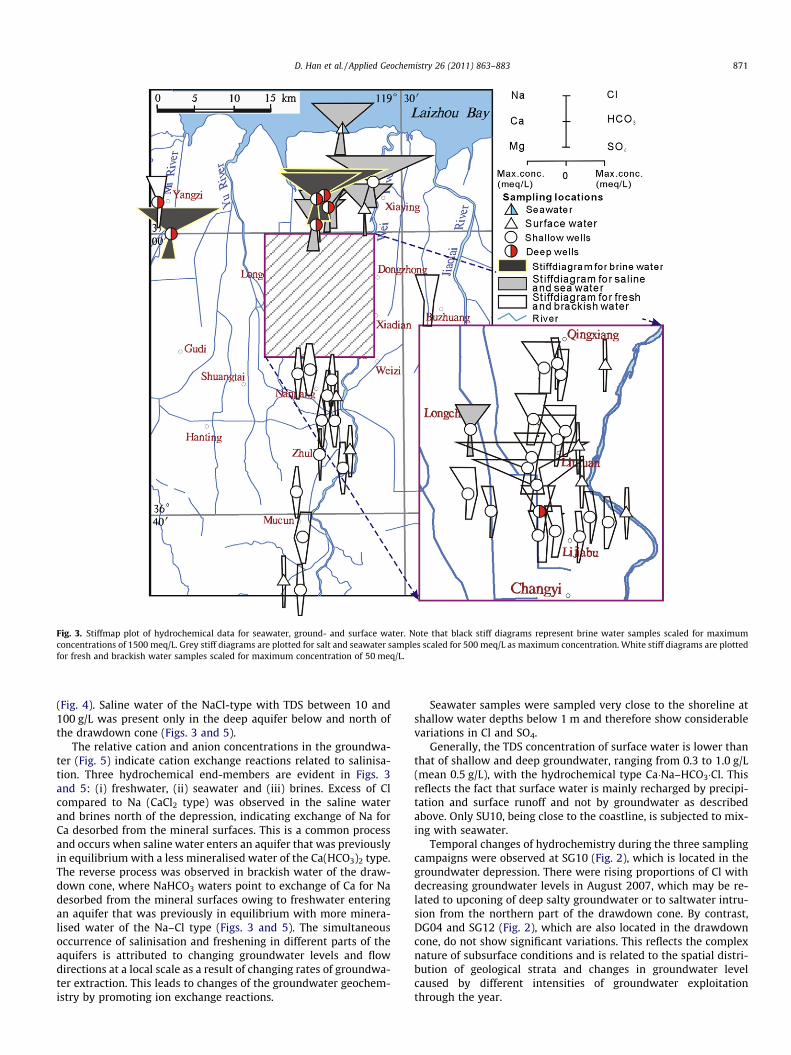
Fig. 3. Stiffmap plot of hydrochemical data for seawater, ground- and surface water. Note that black stiff diagrams represent brine water samples scaled for maximumconcentrations of 1500 meq/L. Grey stiff diagrams are plotted for salt and seawater samples scaled for 500 meq/L as maximum concentration. White stiff diagrams are plottedfor fresh and brackish water samples scaled for maximum concentration of 50 meq/L.
D. Han et al. / Applied Geochemistry 26 (2011) 863–883 871
(Fig. 4). Saline water of the NaCl-type with TDS between 10 and100 g/L was present only in the deep aquifer below and north ofthe drawdown cone (Figs. 3 and 5).
The relative cation and anion concentrations in the groundwa-ter (Fig. 5) indicate cation exchange reactions related to salinisa-tion. Three hydrochemical end-members are evident in Figs. 3and 5: (i) freshwater, (ii) seawater and (iii) brines. Excess of Clcompared to Na (CaCl2 type) was observed in the saline waterand brines north of the depression, indicating exchange of Na forCa desorbed from the mineral surfaces. This is a common processand occurs when saline water enters an aquifer that was previouslyin equilibrium with a less mineralised water of the Ca(HCO3)2 type.The reverse process was observed in brackish water of the draw-down cone, where NaHCO3 waters point to exchange of Ca for Nadesorbed from the mineral surfaces owing to freshwater enteringan aquifer that was previously in equilibrium with more minera-lised water of the Na–Cl type (Figs. 3 and 5). The simultaneousoccurrence of salinisation and freshening in different parts of theaquifers is attributed to changing groundwater levels and flowdirections at a local scale as a result of changing rates of groundwa-ter extraction. This leads to changes of the groundwater geochem-istry by promoting ion exchange reactions.
Seawater samples were sampled very close to the shoreline atshallow water depths below 1 m and therefore show considerablevariations in Cl and SO4.
Generally, the TDS concentration of surface water is lower thanthat of shallow and deep groundwater, ranging from 0.3 to 1.0 g/L(mean 0.5 g/L), with the hydrochemical type Ca�Na–HCO3�Cl. Thisreflects the fact that surface water is mainly recharged by precipi-tation and surface runoff and not by groundwater as describedabove. Only SU10, being close to the coastline, is subjected to mix-ing with seawater.
Temporal changes of hydrochemistry during the three samplingcampaigns were observed at SG10 (Fig. 2), which is located in thegroundwater depression. There were rising proportions of Cl withdecreasing groundwater levels in August 2007, which may be re-lated to upconing of deep salty groundwater or to saltwater intru-sion from the northern part of the drawdown cone. By contrast,DG04 and SG12 (Fig. 2), which are also located in the drawdowncone, do not show significant variations. This reflects the complexnature of subsurface conditions and is related to the spatial distri-bution of geological strata and changes in groundwater levelcaused by different intensities of groundwater exploitationthrough the year.

Fig. 4. The saturation indices (SI) for all water samples were calculated using PHREEQC version 2.8 (Parkhurst and Appelo, 1999).
Fig. 5. Piper diagram of the various water samples.
872 D. Han et al. / Applied Geochemistry 26 (2011) 863–883

D. Han et al. / Applied Geochemistry 26 (2011) 863–883 873
4.2. Cl/Br ratios and origin of salt
There are several possible sources of salt in groundwater, suchas seawater intrusion, mobilisation of formation water and evapo-rite dissolution from marine deposits.
Chloride/Br� ratios may be used to determine the causes ofgroundwater salinisation for water with TDS higher than 2–3 g/L(Cartwright et al., 2006; Alcalá and Custodio, 2008). The molarCl/Br ratio of seawater is around 655 (Cl = 550 mmol/L,Br = 0.84 mmol/L, Siemann, 2003), which has been constant forall oceans since the Permian (Drever, 1997) and can be taken asa reference value. Surface water and groundwater that have under-gone evaporation show similar ratios until halite precipitates.Since Br� is less compatible in precipitating salts, it is enriched rel-ative to Cl� in the residual brines, leading to Cl/Br ratios below 650.By contrast, precipitated salts are depleted in Br�, which causes Cl/
Fig. 6. Plots of Cl/Br vs. Cl of various water samples from the study area.
Fig. 7. Stable isotopic composition (a) and relationship between d18O and d-excess (b)meteoric water line (GMWL) corresponds to Craig (1961) and the local meteoric water ld18O and d2H values of the average monthly rainfall monitored between 1986 and 1990rainfall data were taken from the IAEA network.
Br ratios above 3000 for water that has dissolved halite (Mazor,1997).
Molar Cl/Br ratios in all samples are most variable at low salin-ity (Cl < 46 mmol/L), ranging from 7 to 1132 (Fig. 6). The lowest Cl/Br ratios in surface-water samples, up to 253 (SU02), were as-sumed to be the ratio of modern rainfall. Most fresh and brackishgroundwater in the shallow aquifers has Cl/Br ratios lower than253. The highest Cl/Br ratios, up to 1132, occur in groundwaterwith Cl� concentrations of <46 mmol/L (Fig. 6). Dissolution ofsmall volumes of halite from the unsaturated zone is the mostlikely mechanism that increases Cl/Br ratios. However, halite hasmolar Cl/Br ratios of �104 in many areas (McCaffrey et al., 1987;Kloppmann et al., 2001; Cartwright et al., 2004); hence the amountof halite dissolution must be minor. Brines (584–2435 mmol/L)have Cl/Br ratios of 253–667 with a mean value of 503 that isgenerally lower than the oceanic ratio of �650, showing relativeinvariance with increasing Cl� concentrations. It confirms thatevaporation is the dominant mechanism increasing salinity of thebrine groundwater. Additionally, away from coastal areas, ground-water commonly has Cl/Br ratios lower than the ocean value.
Groundwater with TDS below 2 g/L from shallow depths has alarge range of Cl/Br ratios, mostly below seawater. This is probablyrelated to anthropogenic input of Br� from agriculture indicated byelevated NO�3 concentrations (e.g., SG07 with NO�3 246 mg/L andSG30 with NO�3 228 mg/L). As discussed by Thomas (1994) Cl/Br ra-tios cannot be used to identify the salt origin in these samples. Al-most all Cl/Br ratios of samples with TDS above 2 g/L plot close toseawater, suggesting that relict seawater or recent seawater areimportant sources of salt rather than evaporite dissolution(Fig. 6). One sample of deep saline water (DG06) plots below sea-water, probably as a result from mixing with shallow water con-taminated with anthropogenic Br�.
4.3. 2H/18O isotopes and recharge conditions
Groundwater has d18O values of �9.7‰ to �1.3‰ and d2H val-ues of�72.7‰ to�21.0‰ (Table 1, Fig. 7). The local meteoric water
of the various water samples in the study area (relative to VSMOW). The globaline (LMWL, d2H = 7.8 d18O + 6.3, n = 8 from March to October, r2 = 0.78) is based onat Yantai station (37�3202400N, 121� 2400000E) some 250 km NE of Changyi city. The

Fig. 8. Diagram of d34SSO4 value vs. SO2�4 concentration. Insert shows the trend of the ion concentration.
874 D. Han et al. / Applied Geochemistry 26 (2011) 863–883
line (LMWL, d2H = 7.8 d18O + 6.3, n = 8, r2 = 0.78 from March toOctober) is based on d18O and d2H values of the average monthlyrainfall monitored between 1986 and 1990 at Yantai station(37�3202400N, 121� 2400000E) some 250 km NE of Changyi city (datafrom International Atomic Energy Agency/World MeteorologicalOrganisation (IAEA/WMO, 2006). Yantai station has similarclimatic and coastal conditions. Almost all samples plot on a linebelow the LMWL between end-members represented by low-mineralised freshwater (SG04), seawater and brines (Fig. 7). Freshgroundwater is depleted in both 18O and 2H, and there is anincreasing trend in both d18O and d2H in groundwater sampleswith increasing salinity from fresh water to brine water. This re-flects the increasing influence of evaporation as a major processproducing salinity.
Seawater represents an end-member enriched in isotopes andplots far below the LMWL. The strong evaporitic fingerprint of sea-water is due to the fact that the samples were taken at a very shal-low depth below 1 m very close to the shoreline.
The group of deep saline water samples (DG01, DG02, DG03,DG05, DG06), which are all located north of the depression, showsdepleted isotopic signatures compared to modern seawater (d18Oranging from �8.9‰ to �4.3‰, d2H ranging from �67.8‰ to62.8‰). On the other hand, these samples have Cl/Br ratios similarto seawater. Here the depleted isotopic signature is assigned todilution of the palaeo-ocean water which may occur along conti-nental margins by continental runoff. For example, Dakin et al.(1983) reported d18O values of seawater about �10.5‰ in GeorgiaStrait between Vancouver Island and the Mainland. Therefore, thedeep saline groundwater is presumed to have originated by seawa-ter intrusion during the last sea level rise after the last glacial per-iod around 10–15 ka ago (Yechieli et al., 2009). Earlier infiltrationof seawater during the previous interglacial periods with higherseawater level is not supported by the 14C data discussed below.
The brine samples plot on a line between seawater and fresh-water in spite of showing a higher salinity than seawater. Chlo-ride/Br ratios close to seawater ratios indicate that elevated TDScontents result from evapoconcentration. Therefore, the questionis how to explain the depleted isotope signatures, assuming thatevapoconcentration increases both salinity and isotope enrich-ment. Also in this case, a depleted initial seawater reservoir dueto mixing with depleted runoff from the continental margin incolder periods may account for the combination of low d18O values
and high salinities of the brines. Therefore, the modern brines areassumed to have also evolved from evapoconcentration and subse-quent intrusion of a palaeo-seawater reservoir after the formationof deep saline water discussed above.
Fig. 7 also shows that river water samples are characterised bysimilar isotopic signatures to those of shallow groundwater. Re-sults suggest that groundwater is recharged to some extent by riv-er water, although the more elevated TDS of fresh groundwateralso indicates mixing with more highly mineralised groundwater.
4.4. Origin of sulphate and d34S variations
Possible sources of SO2�4 in groundwater in Laizhou Bay are
evaporite dissolution, sulfide oxidation or mixing with seawaterand brines. Furthermore, the SO2�
4 concentrations can be reducedby SO2�
4 reduction. Numerous case studies have been conducted re-lated to isotopic composition of SO2�
4 in groundwater (Müller et al.,1966; Fontes and Zuppi, 1976; Hendry et al., 1989; Fennell andBentley, 1998) with the objective of determining sources of SO4
and redox processes. Sulphate minerals (gypsum, anhydrite, etc.)typically have d34SSO4 values between +9‰ and +24‰ (Shi et al.,2004). Sulphate of modern marine origin should have d34SSO4 val-ues close to 21‰, the value of current ocean water SO4 (Reeset al., 1978), whereas older sulphates of marine origin such asPermian sulphates can have quite different signatures. In general,d34SSO4 values of recycled evaporates range from +8 to +30‰
(Mayer, 2005) with an average value of +13.4‰ (Taberner et al.,2000). Sulphate reduction leads to enrichment in d34SSO4, whereassulfide oxidation results in negative d34SSO4 values (Clark and Fritz,1997).
To identify the SO4 origin and chemical redox reactions in thegroundwater, 26 water samples were selected for d34S analysis,including eight fresh, 13 brackish, one seawater and three salinewater samples (Table 5). Except for DG04 and SG29, most d34S datarange between 10‰ and 21‰ (Fig. 8).
Deep saline water plots in a narrow range slightly below 21‰,supporting a seawater origin of salinity consistent with the otherparameters discussed above. Also the brine sample plots very closeto the seawater composition, which favours a relict seawater originof the SO4 that concurs with the other findings. The slight depletionin d34S compared to modern seawater can be attributed to pyriteoxidation, which agrees with field data reporting pyrite in sediment
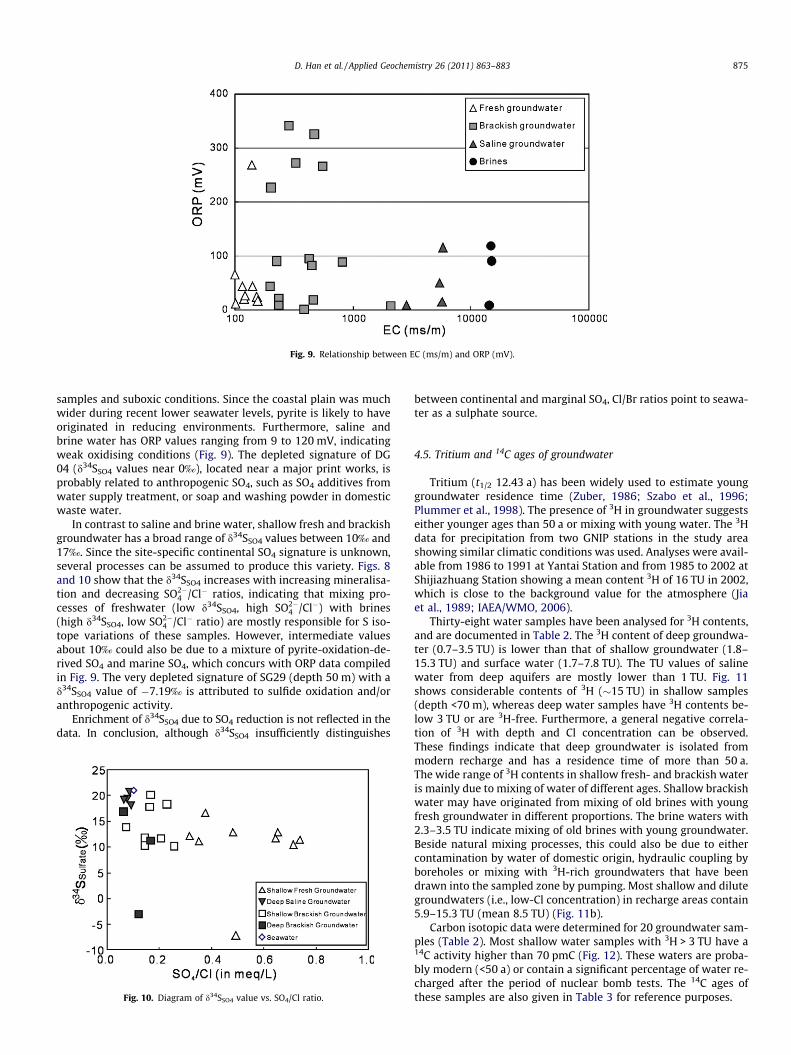
Fig. 9. Relationship between EC (ms/m) and ORP (mV).
D. Han et al. / Applied Geochemistry 26 (2011) 863–883 875
samples and suboxic conditions. Since the coastal plain was muchwider during recent lower seawater levels, pyrite is likely to haveoriginated in reducing environments. Furthermore, saline andbrine water has ORP values ranging from 9 to 120 mV, indicatingweak oxidising conditions (Fig. 9). The depleted signature of DG04 (d34SSO4 values near 0‰), located near a major print works, isprobably related to anthropogenic SO4, such as SO4 additives fromwater supply treatment, or soap and washing powder in domesticwaste water.
In contrast to saline and brine water, shallow fresh and brackishgroundwater has a broad range of d34SSO4 values between 10‰ and17‰. Since the site-specific continental SO4 signature is unknown,several processes can be assumed to produce this variety. Figs. 8and 10 show that the d34SSO4 increases with increasing mineralisa-tion and decreasing SO2�
4 /Cl� ratios, indicating that mixing pro-cesses of freshwater (low d34SSO4, high SO2�
4 /Cl�) with brines(high d34SSO4, low SO2�
4 /Cl� ratio) are mostly responsible for S iso-tope variations of these samples. However, intermediate valuesabout 10‰ could also be due to a mixture of pyrite-oxidation-de-rived SO4 and marine SO4, which concurs with ORP data compiledin Fig. 9. The very depleted signature of SG29 (depth 50 m) with ad34SSO4 value of �7.19‰ is attributed to sulfide oxidation and/oranthropogenic activity.
Enrichment of d34SSO4 due to SO4 reduction is not reflected in thedata. In conclusion, although d34SSO4 insufficiently distinguishes
Fig. 10. Diagram of d34SSO4 value vs. SO4/Cl ratio.
between continental and marginal SO4, Cl/Br ratios point to seawa-ter as a sulphate source.
4.5. Tritium and 14C ages of groundwater
Tritium (t1/2 12.43 a) has been widely used to estimate younggroundwater residence time (Zuber, 1986; Szabo et al., 1996;Plummer et al., 1998). The presence of 3H in groundwater suggestseither younger ages than 50 a or mixing with young water. The 3Hdata for precipitation from two GNIP stations in the study areashowing similar climatic conditions was used. Analyses were avail-able from 1986 to 1991 at Yantai Station and from 1985 to 2002 atShijiazhuang Station showing a mean content 3H of 16 TU in 2002,which is close to the background value for the atmosphere (Jiaet al., 1989; IAEA/WMO, 2006).
Thirty-eight water samples have been analysed for 3H contents,and are documented in Table 2. The 3H content of deep groundwa-ter (0.7–3.5 TU) is lower than that of shallow groundwater (1.8–15.3 TU) and surface water (1.7–7.8 TU). The TU values of salinewater from deep aquifers are mostly lower than 1 TU. Fig. 11shows considerable contents of 3H (�15 TU) in shallow samples(depth <70 m), whereas deep water samples have 3H contents be-low 3 TU or are 3H-free. Furthermore, a general negative correla-tion of 3H with depth and Cl concentration can be observed.These findings indicate that deep groundwater is isolated frommodern recharge and has a residence time of more than 50 a.The wide range of 3H contents in shallow fresh- and brackish wateris mainly due to mixing of water of different ages. Shallow brackishwater may have originated from mixing of old brines with youngfresh groundwater in different proportions. The brine waters with2.3–3.5 TU indicate mixing of old brines with young groundwater.Beside natural mixing processes, this could also be due to eithercontamination by water of domestic origin, hydraulic coupling byboreholes or mixing with 3H-rich groundwaters that have beendrawn into the sampled zone by pumping. Most shallow and dilutegroundwaters (i.e., low-Cl concentration) in recharge areas contain5.9–15.3 TU (mean 8.5 TU) (Fig. 11b).
Carbon isotopic data were determined for 20 groundwater sam-ples (Table 2). Most shallow water samples with 3H > 3 TU have a14C activity higher than 70 pmC (Fig. 12). These waters are proba-bly modern (<50 a) or contain a significant percentage of water re-charged after the period of nuclear bomb tests. The 14C ages ofthese samples are also given in Table 3 for reference purposes.

Fig. 11. Variation of 3H content with (a) depth and (b) Cl concentration in groundwaters.
876 D. Han et al. / Applied Geochemistry 26 (2011) 863–883
The contribution of ‘‘dead’’ C from the aquifer matrix was con-strained using d13C values. For the North China Plain, values of soilgas d13C are between �17‰ and �21‰ (Chen et al., 2003), and themean value of �19‰ was adopted. The d13C of the carbonate end-member was taken as 1.5‰ (Chen et al., 2003).
Table 3 compares 14C ages calculated by five different methods.Shallow groundwater turns out to be of modern age according tothe methods of Tamers (1975), CMB (chemical mass-balance cor-rection; Fontes and Garnier, 1979) and Pearson and Hanshaw(1970), whereas the STAT (statistical correction; Vogel, 1970)
Fig. 12. Plot of 14C activities (pmC) vs. 3H content (TU) in different groundwatersamples.
approach and uncorrected ages give much older ages not supportedby 3H data above 2 TU (Table 3). With regard to deep groundwater,the ages corrected after Pearson and Hanshaw (1970) yielded agevalues in samples with very low 14C concentrations, indicatingold, isolated groundwater (DG04, DG05, DG08 and DG09). The cal-culated ages of these samples concur with results obtained by theother methods. It is assumed that elevated 14C values are related tomixing with younger water, which is also supported by the 3H dataof these samples. The Tamers (1975) model assumes calcite disso-lution under closed conditions. It gives the most reliable results fordeep groundwater samples and is in agreement with the results ofthe STAT approach. The different age correction methods yieldedbroadly similar ages for most of the groundwater samples. Hence,a ‘mean age’ is calculated for each sample in Table 3. The ages oftwo brine samples (SG41 and DG07) are 2.3 ka and 7.0 ka, respec-tively. The 14C age would be from 7.5 ka to 15.2 ka for saline waterand from modern age to 21.7 ka for brackish water.
The variations in corrected 14C ages with depth and distancefrom the coastline are shown in Fig. 13 (data from the mean agevalues in Table 3). Most fresh groundwater falls in the moderngroundwater range along the groundwater flow path, indicatingfast circulation. Brackish groundwater in the shallow aquifershows modern ages (modern to �3.4 ka) in groundwater close tothe drawdown cone and about 16.6–20.3 ka between the draw-down and the ocean. The deep saline groundwater (80–125 mdepth) has ages of about 7.5–15.2 ka, and the age of brine wateris more than 2.3 ka. There is a vertically increasing trend in thebrine water ages (from SG41 at 30 m depth to DG07 at 60 mdepth), indicating that the stable thickness of the clay layerstrongly limits vertical mixing.

Fig. 13. Variation of the corrected 14C groundwater age with (a) depth and (b) distance from the coastline.
Fig. 14. Semilogarthmic plot of d18O vs. Cl.
D. Han et al. / Applied Geochemistry 26 (2011) 863–883 877
4.6. Mixing
In the d18O vs. Cl plot (Fig. 14) four different end-membersare visible: (i) freshwater, (ii) brines, (iii) deep saline water and(iv) seawater. Brackish groundwater is plotted between these
end-members. Based on the analysed hydrochemical composition,three mixing scenarios are proposed to explain the distributionof the samples (Fig. 15a).
Mix 1: Figs. 14 and 15a show that a large part of brackish waterin the drawdown cone (SG36, SG39, SG48; SG17, SG19) lies on a

Fig. 15. Mixing plot of Cl� concentration vs. d18O for the various water samples. The arrows show the probable mixing direction. (b) is zoomed from part of a.
878 D. Han et al. / Applied Geochemistry 26 (2011) 863–883
mixing line between freshwater and deep saline water and is notinfluenced by intrusion of modern seawater or brines. This indi-cates that upconing deep saline water has a greater effect on salin-isation than shallow brine water. The d18O variability of thefreshwater end-members is reflected also in the d18O variabilityof brackish water samples mixed with deep saline water. Onlyone sample located in the groundwater depression (SG38) indi-cates mixing with modern seawater.
Mix 2: Saline water samples SG38, DG05 and Z3-3 (20 m depth)lie on a freshwater–seawater mixing line (Fig. 15a). DG05 is locatedbetween the depression and the sea at 125 m depth, whereas SG 38is from the depression, indicating preferential intrusion of seawa-ter into areas of major groundwater extraction. Note that DG05shows mixing with deep saline water in July 2006 but mixing withmodern seawater in July 2007.
Mix 3: Saline water between the drawdown cone and the coast-line shows different origins of salt. Z3-1 (60–85 m depth) and SG49plot on a mixing line between freshwater and deep brine water. SG49 is located very close to the Wei River, which presumably consti-tutes the discharge area for deep brine water.
Provided that the Cl� ion concentration remains unaffected byevaporite dissolution or anthropogenic inputs, this parameter canbe regarded, in addition to d18O, as a reference parameter for
estimating the contribution of the different sources. Nonetheless,d18O shows a high variability in freshwater which significantlylimits mixing calculations for individual samples without detailedknowledge of local flow paths, which is beyond the scope of thisstudy.
4.7. Conceptual model
The results of this study provide a basis for a unifying concep-tual model that describes the major hydrochemical and physicalprocesses along a cross-section from north to south parallel tothe principal flow system (Fig. 16). The fact that the regional salin-ity distribution is in broad agreement with the general flow patternindicates that three-dimensional flow is only of local importanceand does not affect the overall findings. The compositions ofgroundwater from the coastal aquifers (Fig. 16a) represent theprincipal part of the data set used in this work. The distributionof isotopic composition for various water bodies is illustrated sche-matically in Fig. 16b. In the southern part of the shallow aquifer,low-Cl- and 3H-bearing groundwaters represent the isotopic com-position of modern precipitation (d18O = �11‰ to �12‰), indicat-ing that these groundwaters were recharged during warm climaticperiods such as the present.
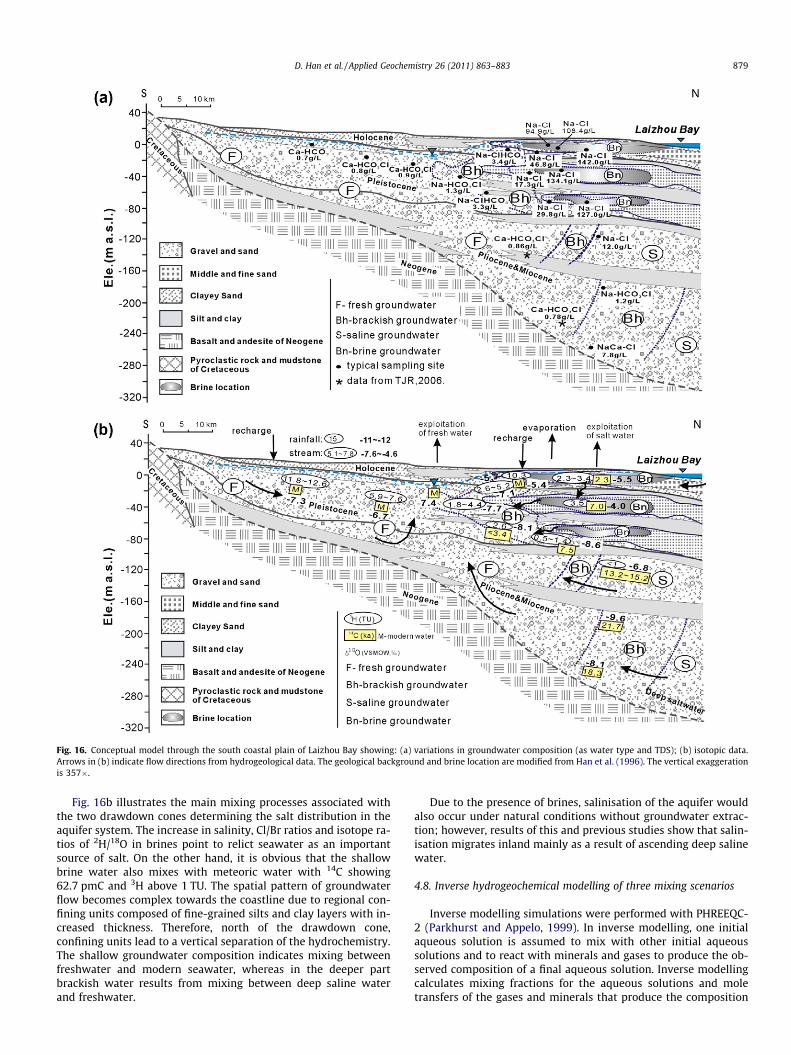
Fig. 16. Conceptual model through the south coastal plain of Laizhou Bay showing: (a) variations in groundwater composition (as water type and TDS); (b) isotopic data.Arrows in (b) indicate flow directions from hydrogeological data. The geological background and brine location are modified from Han et al. (1996). The vertical exaggerationis 357�.
D. Han et al. / Applied Geochemistry 26 (2011) 863–883 879
Fig. 16b illustrates the main mixing processes associated withthe two drawdown cones determining the salt distribution in theaquifer system. The increase in salinity, Cl/Br ratios and isotope ra-tios of 2H/18O in brines point to relict seawater as an importantsource of salt. On the other hand, it is obvious that the shallowbrine water also mixes with meteoric water with 14C showing62.7 pmC and 3H above 1 TU. The spatial pattern of groundwaterflow becomes complex towards the coastline due to regional con-fining units composed of fine-grained silts and clay layers with in-creased thickness. Therefore, north of the drawdown cone,confining units lead to a vertical separation of the hydrochemistry.The shallow groundwater composition indicates mixing betweenfreshwater and modern seawater, whereas in the deeper partbrackish water results from mixing between deep saline waterand freshwater.
Due to the presence of brines, salinisation of the aquifer wouldalso occur under natural conditions without groundwater extrac-tion; however, results of this and previous studies show that salin-isation migrates inland mainly as a result of ascending deep salinewater.
4.8. Inverse hydrogeochemical modelling of three mixing scenarios
Inverse modelling simulations were performed with PHREEQC-2 (Parkhurst and Appelo, 1999). In inverse modelling, one initialaqueous solution is assumed to mix with other initial aqueoussolutions and to react with minerals and gases to produce the ob-served composition of a final aqueous solution. Inverse modellingcalculates mixing fractions for the aqueous solutions and moletransfers of the gases and minerals that produce the composition

Table 7Defined mineral assemblage and calculated mole transfer of inverse modellingscenarios.
Present phases Phase mole transfers withminimal phases
Scenario 1 (Mix 1)CO2(g) Dolomite 2.009e�03Gypsum (dissolve only) Gypsum 1.005e�03Calcite (prec. only) CO2(g) 5.051e�03Dolomite (dissolve only) CaX2 �3.192e�03CaX2 NaX 1.340e�02MgX2 MgX2 �3.508e�03NaX
Mixing ratios: 0.8735 (SG40); 0.1266(DG06)
Scenario 2 (Mix 2)
880 D. Han et al. / Applied Geochemistry 26 (2011) 863–883
of the final aqueous solution. The basic approach in inverse model-ling is to account for the changes in moles between initial and finalsolutions by the dissolution or precipitation of minerals (Garrelsand Mackenzie, 1967; Parkhurst et al., 1982). As a result, PHRE-EQC-2 may deliver zero, one or more possible models with moletransfers explaining the difference between initial and final aque-ous solutions. PHREEQC-2 does not consider saturation indices,and, therefore, model results should always be checked for theirthermodynamical feasibility.
The mixing scenarios proposed in Section 4.6 are based on twoconservative parameters, Cl and d18O, but do not account for possi-ble chemical reactions and changing concentrations of otherparameters involved in these reactions. Therefore, inverse model-ling was carried out to identify hydrochemical reactions that ac-count for changes in water chemistry taking place during mixingand interaction of water with the present mineral assemblage ofthe aquifer. Furthermore, the thermodynamic feasibility of themixing scenarios proposed in Section 4.6 was verified, consideringalso the reactive components of the water samples involved.
To perform the simulations, PHREEQC requires the definition ofone or more initial aqueous solutions, one final aqueous solutionand a set of minerals and/or gases that may be present. Here, theinitial aqueous solutions represent the end-members whose mix-ture, combined with chemical reactions, accounts for the hydro-chemical composition of the final aqueous solution. The watersamples used to define initial and final solutions for the inversescenarios are compiled in Table 6. The model input files consistof field-measured pH, temperature and major ion concentrationsof each input solution. The number of models obtained with eachmodelling exercise run with PHREEQC-2 is also shown in Table 6.The criterion followed to select the best model was basically tochoose the thermodynamically feasible model with the smallestnumber of mineral phases and exchangers.
In all scenarios dolomite, calcite and gypsum were defined asrepresentative minerals of the aquifer material at the study site.The possibility of dissolution or precipitation of the respectivephases was defined according to the calculated saturation indicesof the input solutions. Calcite was oversaturated in the input solu-tions of all simulations, whereas gypsum and dolomite wereundersaturated. Therefore, calcite was only allowed to precipitate(but not to dissolve), whereas gypsum and dolomite were only al-lowed to dissolve (Table 7). Sinks and sources of inorganic C areconsidered by defining the CO2 phase. Furthermore, all simulationsincluded the possibility of cation exchange between Ca, Mg and Narelated to saltwater intrusion or refreshening aquifer conditions asdiscussed above.
To test the presented hypothetical conceptual model and to as-sess the hydrochemical reactions to the three mixing scenarios
Table 6Analysed water samples used to define initial and final solutions for the inversemixing simulations.
Initial aqueous solutions Final aqueous solutions Modelsobtained
Scenario 1 (Mix 1)(a) SG40 (shallow fresh water) SG36 (shallow brackish
water)2
(b) DG06 (deep saltwatersample)
Scenario 2 (Mix 2)(a) SG40 (shallow fresh water) SG38 (shallow saltwater) 3(b) SW (seawater),
Scenario 3 (Mix 3)(a) SU09 (fresh water) SG49 (shallow saltwater) 1(b) 501-6 (brine)
documented in Fig. 15a, the following scenarios were calculatedwith PHREEQC-2 including Cation Exchange (Table 6). The PITZERdatabase can be used to account for highly mineralised aqueoussolutions with a ionic strength above 0.5.
4.8.1. Scenario 1 (Mix 1 in Fig. 15a): Evolution of shallow brackishwater from mixing of freshwater with deep saline water
As indicated in Fig. 15b and discussed in the conceptual model,the chemical evolution observed in shallow brackish water isassumed to be a result of mixing between freshwater and deepsaline water. To verify this hypothesis and to identify possiblechemical reactions that occur during the mixing process, scenario1 was set up. Shallow brackish water located in the Changyidepression (sample SG36) was defined as the final solution result-ing from the mixing between the two initial end-member solutionsfreshwater (sample SG40) and deep saline water north of thedepression cone (DG06). The possibility of cation exchange be-tween Ca, Mg and Na related to saltwater intrusion or refresheningaquifer conditions was included in the simulation.
In this scenario a thermodynamically feasible solution wasfound when the mineral phases and ion exchange were introducedas indicated in Tables 6 and 7. The simulations suggest mixing pro-portions of 0.8735 (SG40) and 0.1266 (DG06), dissolution of dolo-mite and gypsum and ion exchange of Ca and Mg for Na. Thisreflects intrusion of freshwater into a saline aquifer leading to Narelease into intruding freshwater.
4.8.2. Scenario 2 (Mix 2 in Fig. 15a): Evolution of saline water frommixing of freshwater and seawater
The second inverse scenario tries to reproduce saline watersample SG 38 sampled in the Changyi depression and located on
Gypsum (dissolve only) Dolomite 1.346e�03CO2 (g) Gypsum 1.093e�02Calcite (prec. only) CO2(g) 3.592e�03Dolomite (dissolve only) CaX2 �9.558e�03CaX2 NaX 1.912e�02NaX
Mixing ratios: 0.49 (SG40); 0.51 (SW)
Scenario 3 (Mix 3)Gypsum (dissolve only) Dolomite 9.624e�04CO2(g) Gypsum 7.901e�03Calcite (prec. only) CO2(g) 2.680e�03Dolomite (dissolve only) CaX2 �1.041e�02CaX2 NaX 2.083e�02NaX
Mixing ratios: 0.67(SU09);0.33 (501-6)
Positive numbers of phase mole transfers indicate dissolution and negative num-bers precipitation of minerals. ‘‘Dissolve only’’ means that the respective mineral isnot allowed to precipitate. Concentrations in mol/L. CaX2, MgX2 and NaX representexchange species including stoichiometry of exchange ion and exchanger.

D. Han et al. / Applied Geochemistry 26 (2011) 863–883 881
the mixing line between fresh- and seawater. In this scenario, threethermodynamically feasible solutions were found when the min-eral phases and ion exchange were introduced as indicated in Table6. The simulations suggest mixing proportions of 0.49 (SG40) and0.51 (SW) combined with dissolution of dolomite and gypsum toreproduce saline water (SG 38). Ion exchange of Ca for Na pointsto intrusion of freshwater into a saline aquifer.
4.8.3. Scenario 3 (Mix 3 in Fig. 15a): Evolution of shallow saline waterfrom mixing of freshwater and deep brine water
The third inverse scenario was set up to verify the hypothesisthat the formation of shallow saline water represented by SG49 re-sults from mixing freshwater (SU09) with deep brines (501-6). Likescenario 2, results indicate mixing proportions of 0.67 (SU09) and0.33 (501-6), dissolution of dolomite and gypsum and ion ex-change of Ca for Na.
Modelling results show that all hypothetical mixing scenariosderived from conservative components were verified by the simu-lations. In all scenarios, mixing, dissolution of dolomite and gyp-sum and calcite precipitation account for the changes in molesbetween initial and final aqueous solutions.
5. Conclusions
The present study uses hydrochemical and isotopic evidence toexplore groundwater salinisation processes in the Quaternaryaquifer on the south coast of Laizhou Bay. The study describes acomplex coastal aquifer system showing a variety of groundwatercompositions with different ages, isotopic signatures and salinities.The general flow path towards the coast is disrupted by twogroundwater depressions due to groundwater exploitation leadingto intrusion of deep saline water, seawater and brines into theshallow freshwater aquifer system.
The origin of salinity is complex and could only be assessed bythe simultaneous evaluation of several hydrochemical and isotopicparameters.
The combination of d18O and Cl data enabled four different end-members to be identified: freshwater, brines, deep saline water,seawater and their respective mixtures. Chloride/Br ratios closeto modern seawater were applied to identify the evapoconcentra-tion of former seawater as the main process producing salinity ingroundwater. Nonetheless, brines and especially deep saline watershow very depleted isotopic ratios compared to modern seawater,indicating that intrusion of modern seawater would not accountfor this isotopic depletion. Therefore, an isotopically depleted, ini-tial seawater reservoir due to continental runoff in colder periods,subsequent evapoconcentration and palaeo-seawater intrusion isassumed to have produced the salinity in present brines and deepsaline groundwater. Carbon-14 data of deep, 3H-free, salinegroundwater yield ages of about 15 ka, pointing to seawater intru-sion having occurred during sea level rise since the last glacial per-iod around 10–15 ka ago. By contrast, brine water shows a widerange of 3H contents and 14C ages depending on the samplingdepth. This range is mainly due to the complex conditions of mix-ing, and no strict isolation from modern groundwater was ob-served. Although the low isotopic signatures in the brinescompared to modern seawater also require an initially depletedseawater reservoir, 14C dating and higher salinities reveal a laterevent of seawater intrusion characterised by a higher degree ofevapoconcentration. The d18O and Cl data indicate that most salin-isation of the brackish groundwater in the Changyi drawdown conestems from mixing of freshwater with ascending deep saline waterof older age. However, mixing with seawater was observed in onesample of the groundwater depression, pointing to preferentialflow of intruding seawater.
Hydrochemical and stable isotope data of samples taken be-tween the drawdown cone and the coast point to formation of sal-ine water due to mixing of freshwater with brines and seawater.One sample showed a temporal change of mixing with seawaterand brines from 2006 to 2007. Results suggest that seawater andbrines coexist in this part of the study area, indicating preferentialpathways of the different water types. The d34SSO4 data supportseawater intrusion as a possible source of SO2�
4 , although thismethod cannot exclude mineral dissolution.
Mixing scenarios were verified by hydrochemical simulationsquantifying processes of mixing, dolomite/gypsum dissolution, cal-cite precipitation and ion exchange to account for the changes inmoles between initial and final aqueous solutions.
The present research shows how the application of combinedparameters improves the identification of (i) salt sources, (ii)individual end-members and their hydrochemical evolution,(iii) different events of palaeo-seawater intrusion, and (iv) mix-ing proportions between these end-members. It further demon-strates the temporal change of isotopic compositions inseawater with limited connection to the ocean and its effecton the groundwater composition after intrusion. A refinedunderstanding of the dynamics in such complex hydrogeologicalsystems is essential to assess the impact of anthropogenic mea-sures on salinisation. The methodology used here can also be ap-plied to other field sites and may help to provide a reasonablebasis for effective control measures and sustainable watermanagement.
Acknowledgements
This study was financially supported by the National NaturalScience Foundation of China (40801018), and National ‘973 Pro-gram’ (No. 2010CB428805), and by the project of the China Geol-ogy Survey entitled ‘‘Assessment of Vulnerability andInvestigation of Environmental Geology in the Key Section of Cir-cum-Bohai-Sea Region’’. The authors would like to thank Ian Cart-wright, Chen Zongyu, Matthew J. Currell, and two anonymousreviewers for their helpful comments and review of the manu-script. The authors are grateful to Dr. Wang Peng, Dr. Liu Xin,and Dr. Xie Hailan, and Pan Tong, Tianjin Institute of Geologyand Mineral Resources, for their help and support during watersampling in the field and data collection.
Appendix A. Supplementary material
Supplementary data associated with this article can be found, inthe online version, at doi:10.1016/j.apgeochem.2011.02.007.
References
Alcalá, F.J., Custodio, E., 2008. Using the Cl/Br ratio as a tracer to identify the originof salinity in aquifers in Spain and Portugal. J. Hydrol. 359, 189–207.
Appelo, C.A.J., Postma, D., 2005. Geochemistry, Groundwater and Pollution, seconded. Taylor & Francis Group.
Bergelson, G., Nativ, R., Bein, A., 1999. Salinization and dilution history ofgroundwater discharging into the Sea of Galilee, the Dead Sea Transform,Israel. Appl. Geochem. 14, 91–118.
Cartwright, I., Weaver, T.R., Fifield, L.K., 2006. Cl/Br ratios and environmentalisotopes as indicators of recharge variability and groundwater flow: an examplefrom the southeast Murray Basin, Australia. Chem. Geol. 231, 38–56.
Cartwright, I., Weaver, T.R., Fulton, S., Nichol, C., Reid, M., Cheng, X., 2004.Hydrogeochemical and isotopic constraints on the origins of dryland salinity,Murray Basin, Victoria, Australia. Appl. Geochem. 19, 1233–1254.
Chen, H.H., Zhang, Y.X., Wang, X.M., Ren, Z.Y., Li, L., 1997. Salt-water intrusion in thelower reaches of the Weilhe River, Shandong Province, China. Hydrogeol. J. 5 (3),82–88.
Chen, Z.Y., Qi, J.X., Xu, J.M., Xu, J.M., Ye, H., Nan, Y.J., 2003. Paleoclimaticinterpretation of the past 30 ka from isotopic studies of the deep confinedaquifer of the North China Plain. Appl. Geochem. 18, 997–1009.

882 D. Han et al. / Applied Geochemistry 26 (2011) 863–883
Clark, I.D., Fritz, P., 1997. Environmental Isotopes in Hydrogeology. LewisPublishers, Boca Raton. pp. 144–207.
Coplen, T.B., 1988. Normalization of oxygen and hydrogen isotope data. Chem. Geol.72, 293–297.
Craig, H., 1961. Standard for reporting concentration of deuterium and oxygen-18 innatural water. Science 133, 1833–1834.
Currell, M.J., Cartwright, I., Bradley, D.C., Han, D.M., 2010. Recharge history andcontrols on groundwater quality in the Yuncheng Basin, north China. J. Hydrol.385, 216–229.
Custodio, E., Bruggeman, G.A., 1987. Groundwater problems in coastal areas. In:Studies and Reports in Hydrology (UNESCO), No.45, International HydrologicalProgramme (IHP), Paries.
Dakin, R.A., Farvolden, R.N., Cherry, J.A., Fritz, P., 1983. Origin of dissolved solids ingroundwater of Mayne Island, British Columbia, Canada. J. Hydrol. 63, 233–270.
Drever, J.I., 1997. The Geochemistry of Natural Waters: Surface and GroundwaterEnvironments. Prentice-Hall, New Jersey, USA.
Edmunds, W.M., Smedley, P.L., 2000. Residence time indicators in groundwater; theEast Midlands Triassic sandstone aquifer. Appl. Geochem. 15, 737–752.
Essaid, H.I., 1990. A multilayered sharp interface model of coupled freshwater andsaltwater flow in coastal systems: model development and application. WaterResour. Res. 26, 1431–1454.
Fennell, J., Bentley, L.R., 1998. Distribution of sulfate and organic carbon in a prairietill setting: natural versus industrial sources. Water Resour. Res. 34, 1781–1794.
Fetter, C.W., 1994. Applied Hydrogeology. Englewood Cliffs, Prentice Hall.Fontes, J.C., Garnier, J.M., 1979. Determination of the initial 14C activity of total
dissolved carbon: a review of existing models and a new approach. WaterResour. Res. 15, 399–413.
Fontes, J.C., Zuppi, G.M., 1976. Isotopes and Water Chemistry in Sulphide-BearingSprings of Central Italy. Interpretation of Environmental Isotope andHydrochemical Data in Ground Water Hydrology, Proc. Advisory GroupMeeting. IAEA, Vienna, Austria, pp. 143–158.
Garrels, R.M., Mackenzie, F.T., 1967. Origin of the chemical compositions of somesprings and lakes. In: Gould, R.F. (Ed.), Advances in Chemistry Series, No. 67,American Chemical Society, Washington, DC, pp. 222–242.
Gates, J.B., Edmunds, W.M., Darling, W.G., Ma, J., Pang, Z., Young, A.A., 2008.Conceptual model of recharge to southeastern Badain Jaran Desert groundwaterand lakes from environmental tracers. Appl. Geochem. 23, 3519–3534.
Grassi, S., Cortecci, G., 2005. Hydrogeology and geochemistry of the multilayeredconfined aquifer of the Pisa plain (Tuscany – Central Italy). Appl. Geochem. 20,41–54.
Grassi, S., Cortecci, G., Squarci, P., 2007. Groundwater resource degradation incoastal plains: the example of the Cecina area (Tuscany – Central Italy). Appl.Geochem. 22, 2273–2289.
Halas, S., Szaran, J., 1999. Low-temperature thermal decomposition of sulfates toSO2 for on-line 34S/32S analysis. Anal. Chem. 71, 3254–3257.
Han, F., Xue, Y.Q., Wu, J.C., 2001. Hydrochemical characteristics of groundwater insalt-water intrusion condition and genesis of brine along the south coast of theLaizhou Bay, China. Geol. Rev. 47 (1), 102–108 (in Chinese).
Han, Y.S., Meng, G.L., Wang, S.Q., 1996. Quaternary Underground Brine in theCoastal Areas of the Northern China. Science Press, Beijing. pp. 36–54 (Chapter4, in Chinese).
Hendry, M.J., Krouse, H.R., Shakur, M.A., 1989. Interpretation of oxygen and sulphurisotopes from dissolved sulfates in tills of Southern Alberta, Canada. WaterResour. Res. 25, 567–572.
IAEA/WMO, 2006. Global Network of Isotopes in Precipitation. The GNIP Database,Vienna. <http://www-naweb.iaea.org/napc/ih/IHS_resources_gnip.html>.
Ji, M.C., 1991. Some changes of resources and environment caused by seawaterintrusion. Environ. Sci. 12 (5), 62–66 (in Chinese).
Jia, Y.K., Zhang, H.P., Wang, D.S., Liu, E.K., Sun, J.C., 1989. Tritium distribution ofprecipitation in China. Site Invest. Sci. Technol. 4, 9–12.
Jones, B.F., Vengosh, A., Rosenthal, E., Yechieli, Y., 1999. Geochemical investigations.In: Bear, J.A., Cheng, H.-D., Sorek, S., Ouazar, D., Herrera, I. (Eds.), SeawaterIntrusion in Coastal Aquifers – Concepts, Methods and Practices. Kluwer, pp. 1–60 (Chapter 3).
Kim, Y., Lee, K.-S., Koh, D.-C., Lee, D.-H., Lee, S.-G., Park, W.-B., Koh, G.-W., Woo, N.-C., 2003. Hydrogeochemical and isotopic evidence of groundwater salinizationin a coastal aquifer: a case study in Jeju volcanic island, Korea. J. Hydrol. 270,282–294.
Kloppmann, W., Négrel, Ph., Casanova, J., Klinge, H., Schelkes, K., Guerrot, C., 2001.Halite dissolution derived brines in the vicinity of a Permian salt dome (NGerman Basin). Evidence from boron, strontium, oxygen, and hydrogenisotopes. Geochim. Cosmochim. Acta 65, 4087–4101.
Li, D.G., Zhao, M.H., Han, M., Jiang, A.X., Zhang, Z.L., 2000. A study of the shallowly-buried paleochannel zones in the south coast plain of the Laizhou Bay. MarineGeol. Quatern. Geol. 20 (1), 23–29 (in Chinese with English abstract).
Ma, F.S., Yang, Y.S., Yuan, R., Cai, Z., Pan, S., 2007. Study of shallow groundwaterquality evolution under saline intrusion with environmental isotopes andgeochemistry. Environ. Geol. 51, 1009–1017.
Marimuthu, S., Reynolds, D.A., Le Gal, L.C., 2005. A field study of hydraulic,geochemical and stable isotope relationships in a coastal wetlands system. J.Hydrol. 315, 93–116.
Mayer, B., 2005. Assessing source and transformations of sulfate and nitrate in thehydrosphere using isotope techniques. In: Aggarwal, P.K., Gat, J.R., Froehlich,K.F.O. (Eds.), Isotopes in the Water Cycle: Past, Present and Future of aDeveloping Science. Springer, Netherlands, pp. 7–89 (Chapter 6).
Mazor, E., 1997. Chemical and Isotopic Ground-Water Hydrology. Dekker, NY.
McCaffrey, M.A., Lazar, B., Holland, H.D., 1987. The evaporation path of seawaterand the coprecipitation of Br� and K+ with halite. J. Sed. Petrol. 57, 928–937.
Meng, G.L., Han, Y.S., Wang, S.Q., 1997. Types and district divisions of seawaterintrusion concerning southern coast of Laizhou Bay. J. Oceanog. Hunanhai BohaiSeas 15 (2), 25–32.
Möller, P., Rosenthal, E., Geyer, S., Flexer, A., 2007. Chemical evolution of salinewaters in the Jordan-Dead sea transform and in adjoining areas. Int. J. Earth Sci.(Geol. Rundsch.) 96, 541–566.
Müller, G., Nielsen, H., Ricke, W., 1966. Sulphur isotope abundance in formationwaters and evaporates from northern and southern Germany. Chem. Geol. 1,211–220.
Ning, J.S., 2004. The Research of Chemical Characters of the Underground Brinealong Laizhou Bay. Masters Ocean Univ., China. pp. 37–38 (in Chinese).
Nonner, J.C., 2006. Introduction to Hydrogeology. Taylor & Francis Group, London,UK.
Parkhurst, D.L., Appelo, C.A.J., 1999. User’s Guide to PHREEQC – A ComputerProgram for Speciation, Reaction-Path, 1D-Transport, and Inverse GeochemicalCalculation. US Geol. Surv. Water-Resour. Invest. Rep. 99-4259.
Parkhurst, D.L., Plummer, L.N., Thorstenson, D.C., 1982. BALANCE – A ComputerProgram for Calculating Mass Transfer for Geochemical Reactions in GroundWater. US Geol. Surv. Water-Resour. Invest. Rep. 82-14.
Pearson, F.J., Hanshaw, B.B., 1970. Sources of dissolved carbonate species ingroundwater and their effects on carbon-14 dating. In: IAEA (Ed.), IsotopeHydrology, IAEA, Vienna, pp. 271–285.
Pinder, G.F., 1973. A Galerkin-finite element simulation of groundwaterconcentration on Long Island. Water Resour. Res. 9, 1657–1669.
Plummer, L.N., Busenberg, E., Drenkard, S., Scholosser, P., Ekwurzel, B., Weppirnig,R., McConnell, J.B., Michel, R.L., 1998. Flow of river water into a karsticlimestone aquifer. 2. Dating the young fraction in groundwater mixtures in theupper Floridan aquifer near Valdosta, Georgia. Appl. Geochem. 8, 1017–1043.
Pulido-Leboeuf, P., 2004. Seawater intrusion and associated processes in a smallcoastal complex aquifer (Castell de Ferro, Spain). Appl. Geochem. 19, 1517–1527.
Rees, C.E., Jenkins, W.J., Monster, J., 1978. The sulphur isotopic composition of oceanwater sulfate. Geochim. Cosmochim. Acta 42, 377–381.
Rozanski, K., Gröning, M., 2004. Tritium assay in water samples using electrolyticenrichment and liquid scintillation spectrometry. In: IAEA-TECDOC-1401, Proc.Consultants Meeting on Quantifying Uncertainty in Nuclear AnalyticalMeasurements, 11–14 May 1998, Vienna, IAEA, Vienna, pp. 195–217.
Schiavo, M.A., Hauser, S., Povinec, P.P., 2009. Stable isotopes of water as a tool tostudy groundwater-seawater interactions in coastal south-eastern Sicily. J.Hydrol. 364, 40–49.
Sherif, M.M., Hamza, K.I., 2001. Mitigation of seawater intrusion by pumpingbrackish water. Transport Porous Media 43, 29–44.
Shi, Z.S., Chen, K.Y., Shi, J., He, H.J., Liu, B.J., 2004. Sulfur isotopic composition and itsgeological significance of the Paleogene sulfate rock deposited in DongpuDepression. Petrol. Explor. Develop. 31 (6), 44–46 (in Chinese).
Siemann, M.G., 2003. Extensive and rapid changes in seawater chemistry during thePhanerozoic: evidence from Br contents in basal halite. Terra Nova 15 (1), 243–248.
Sivan, O., Yechieli, Y., Herut, B., Lazar, B., 2005. Geochemical evolution and timescaleof seawater intrusion into the coastal aquifer of Israel. Geochim. Cosmochim.Acta 69, 579–592.
Szabo, A., Rice, D.E., Plummer, L.N., Busenberg, E., Drenkard, S., Schlosser, P., 1996.Age dating of ground water using chlorofluorocarbons, tritium/helium 3, andflow path analysis in an unconfined aquifer of the New Jersey coastal plain.Water Resour. Res. 32, 1023–1038.
Taberner, C., Cendón, D.I., Pueyo, J.J., Ayora, C., 2000. The use of environmentalmarkers to distinguish marine vs. continental deposition and to quantify thesignificance of recycling in evaporite basins. Sed. Geol. 137, 213–240.
Tamers, M.A., 1975. Validity of radiocarbon dates on groundwater. Geophys. Survey2, 217–239.
Thomas, L., 1994. Hydrogeochemische Untersuchungen an den Ölfeldwässern ausNW-Deutschland und dem Oberrheingraben und ihre Modellierung unter demAspekt der Entwicklung eines Expertensysthems für Fluid–Rock-Interactions(Diss.). Berliner Geowissenschaftliche Abhandlungen. Selbstverlag FachbereichGeowissenschaften, Berlin.
TJR, 2006. Report of ‘‘Study of Real-time Monitoring and Warning on Sea-Salt WaterIntrusion in Laizhou Bay – A case study of Changyi-Liutuan Profile’’, TianjinInstitute of Geology and Mineral Resources, pp. 37–38 (in Chinese)
Vengosh, A., Gill, J., Lee Davisson, M., Bryant Hudson, G., 2002. A multi-isotope (B, Sr,O, H and C) and age dating (3H–3He and 14C) study of groundwater from SalinasValley, California: hydrochemistry, dynamics, and contamination processes.Water Resour. Res. 38, 9.1–9.17.
Vogel, J.C., 1970. Carbon-14 dating of ground water. In: Isotope Hydrology 1970,STI/PUB/255, IAEA, Vienna, Austria, pp. 225–239.
Xue, Y.Q., Wu, J.C., Ye, S.J., Zhang, Y.X., 2000. Hydrogeological and hydrogeochemicalstudies for salt water intrusion on the South Coast of Laizhou Bay, China.Ground Water 38, 38–45.
Yechieli, Y., Kafri, U., Sivan, O., 2009. The inter-relationship between coastal sub-aquifers and the Mediterranean Sea, deduced from radioactive isotopesanalysis. Hydrogeol. J. 17, 265–274.
Zhang, Y.X., Xue, Y.Q., Chen, H.H., 1996. Deposit seawater characteristics in theStrata and its formation environment in the South Coastal Plain of Laizhou Baysince late Pleistocene. Acta Oceanol. Sinica 18 (6), 61–68 (in Chinese).

D. Han et al. / Applied Geochemistry 26 (2011) 863–883 883
Zhang, Z.L., Peng, L.M., 1998. The groundwater hydrochemical characteristics onseawater intruded in eastern and southern coasts of Laizhou Bay. China Environ.Sci. 18 (2), 121–125 (in Chinese).
Zhao, D.S., 1996. Research on Disaster Protection for Seawater Intrusion. ShandongPress of Sciences and Technology, Jinan, pp. 3–4 (in Chinese).
Zuber, A., 1986. Mathematical models for the interpretation of environmentalradioisotopes in groundwater systems. In: Fritz, P., Fontes, J.C. (Eds.), Handbookof Environmental Isotope Geochemistry, vol. 2. Elsevier Science Publishers,Amsterdam, pp. 1–59.