geo technical investigation report · 2019-08-22 · geo technical investigation report (1449 -r2...
TRANSCRIPT

TECHPRO ENGINEERS PVT. LTD. 131, MAITRI; 28 I.P. EXTN., PATPARGANJ, DELHI - 110092
PHONES: 011-22243298, 09310043298
e-mail: [email protected]
GEO TECHNICAL INVESTIGATION
REPORT (1449-R2-NALANDA UNIVERSITY)
AT THE SITE FOR
PROPOSED SITE FOR NEW CAMPUS OF
NALANDA UNIVERSITY, RAJGIR,
DISTT. NALANDA,
BIHAR
UNIVERSITY ENGINEER
NALANDA UNIVERSITY,
COUNCIL FOR SOCIAL DEVELOPMENT BUILDING,
LODHI ESTATE, NEW DELHI
FOR
C O N T E N T S
ACKNOWLEDGEMENTS
1. INTRODUCTION: .................................................................................................................................................................................... 1
2. SCOPE OF WORK: .................................................................................................................................................................................. 1
3. PROJECT LOCATION: ............................................................................................................................................................................ 2
4. OBSERVATIONS AT SITE: .................................................................................................................................................................... 2
5. FIELD INVESTIGATION: ....................................................................................................................................................................... 2
6. LABORATORY TESTS: .......................................................................................................................................................................... 4
7. WATER TABLE: ...................................................................................................................................................................................... 6
8. SITE STRATIGRAPHY: .......................................................................................................................................................................... 6
9. RECOMMENDATIONS: .......................................................................................................................................................................... 8
A P P E N D I C E S
APPENDIX A: BORE HOLES LOCATION PLAN.................................................................................................................................11
APPENDIX B: TABLE 1: SUMMARY OF TEST RESULTS (BH-1).............................................................................................12
SUMMARY OF TEST RESULTS (BH-2).............................................................................................14
SUMMARY OF TEST RESULTS (BH-3).............................................................................................16
SUMMARY OF TEST RESULTS (BH-4).............................................................................................18
SUMMARY OF TEST RESULTS (BH-5).............................................................................................20
APPENDIX B: TABLE 2: CBR TEST RESULT.............................................................................................................................. 22
APPENDIX B: TABLE 3: CHEMICAL TEST ON SOIL SAMPLES..............................................................................................24
APPENDIX B: TABLE 4: CHEMICAL TEST ON WATER SAMPLES.........................................................................................24
APPENDIX C: CHART 1: BORE LOG CHART (BH-1)..................................................................................................................25
CHART 2: BORE LOG CHART (BH-2)..................................................................................................................26
CHART 3: BORE LOG CHART (BH-3)..................................................................................................................27
CHART 4: BORE LOG CHART (BH-4)..................................................................................................................28
CHART 5: BORE LOG CHART (BH-5)..................................................................................................................29
APPENDIX D: GRAPH 1: GRAIN SIZE DISTRIBUTION CURVE (BH-1, Depth: 1.0, 2.50, 5.0, 8.0, 11.0, 14.0 m)...................30
GRAPH 2: GRAIN SIZE DISTRIBUTION CURVE (BH-1, Depth: 17.0, 20.0 m).................................................31
GRAPH 3: GRAIN SIZE DISTRIBUTION CURVE (BH-2, Depth: 1.0, 2.50, 5.0, 8.0, 11.0, 14.0 m)...................32
GRAPH 4: GRAIN SIZE DISTRIBUTION CURVE (BH-2, Depth: 17.0, 20.0 m).................................................33
GRAPH 5: GRAIN SIZE DISTRIBUTION CURVE (BH-3, Depth: 1.0, 2.50, 5.0, 8.0, 11.0, 14.0 m).....................34
GRAPH 6: GRAIN SIZE DISTRIBUTION CURVE (BH-3, Depth: 17.0, 20.0 m)...................................................35
GRAPH 7: GRAIN SIZE DISTRIBUTION CURVE (BH-4, Depth: 1.0, 2.50, 5.0, 8.0, 11.0, 14.0 m).....................36
GRAPH 8: GRAIN SIZE DISTRIBUTION CURVE (BH-4, Depth: 17.0, 20.0 m)...................................................37
GRAPH 9: GRAIN SIZE DISTRIBUTION CURVE (BH-5, Depth: 1.0, 2.50, 5.0, 8.0, 11.0, 14.0 m).....................38

GRAPH 10: GRAIN SIZE DISTRIBUTION CURVE (BH-5, Depth: 17.0, 20.0 m)...................................................39
APPENDIX D: TABLE 1: CALCULATIONS AND RESULTS....................................................................................................... 40
1. SHALLOW FOUNDATION........................................................................................................40
1.1 SHEAR FAILURE CRITERIA...................................................................................................40
1.1.1. ISOLATED FOOTING................................................................................................41
1.1.2. STRIP FOOTING............................................................................................................42
1.1.3. RAFT FOUNDATION....................................................................................................43
1.2. SETTLEMENT CRITERIA......................................................................................................46
1.2.1. ISOLATED FOOTING...................................................................................................47
1.2.2. STRIP FOOTING............................................................................................................48
1.2.3. RAFT FOUNDATION...................................................................................................49
2. DEEP FOUNDATION......................................................................................................51
2.1. PILE LOAD CAPACITY IN COMPRESSION & UPLIFT.....................................51
2.1.1. DESIGN PARAMETER FOR PILE..............................................................................51
2.1.2. DESIGN PARAMETER OF SOIL................................................................................51
2.1.3. NOTATIONS AND SYMBOLS...................................................................................51
2.1.4. END BEARING RESISTANCE OF PILE....................................................................52
2.1.5. FRICTIONAL RESISTANCE ALONG THE STEM OF PILE....................................50
2.1.6. COHESION ALONG THE STEM OF PILE.................................................................52
2.1.7. SELF WEIGHT OF PILE...............................................................................................57
2.2 LATERAL LOAD CAPACITIES OF PILES........................................................................58
APPENDIX E: COMPUTATION OF LIQUIFACTION POTENTIAL....................................................................... 59

___________________________________________________________ Regd. Office: 103, Ratandham, 12/483, McRobertsganj, Kanpur-208001
Phone: 0512-2525759, 09793209918
TECHPRO ENGINEERS PVT. LTD. (AN ISO 9001: 2008 Certified Company)
131, Maitri; 28 I.P. Extn., Patparganj, Delhi-110092 Tel. : 011-22243298, Mobile: 09310043298
e-mail: [email protected]
Web: www.techproindia.com
October 23rd
, 2014
A C K N O W L E D G E M E N T S
We feel pleasure to submit the report of Geo-technical investigation work conducted at
site for proposed construction at Nalanda University, Rajgir, Bihar.
We are thankful to Dr. Gopa Sabarwal, Vice Chancellor Nalanda University, for his trust
shown to us by awarding the work of soil investigation. We are also grateful to Er. M K Prasad
Engineer, Nalanda University, for their help rendered during and prior to the investigation work.
We are also thankful to our staff members for conducting field and laboratory test,
preparing the sketches and typing the report.
for Techpro Engineers Pvt. Ltd for Techpro Engineers Pvt. Ltd
(Arvind K. Garg) (Saurabh Agarwal)
B.Tech (Civil) B.Tech (Civil)
M.Tech. (Structures) M.Tech. (Geo Tech)
Managing Director Consultant

1449-R2-Nalanda University
T E C H P R O ENGINEERS PVT. LTD.
1
1. INTRODUCTION:
This report deals with Geo-technical investigation at the site for
proposed construction of new Campus of Nalanda University which consist of various blocks
of multi storied buildings, roads and other infrastructural facilities at Rajgir, Bihar. It is
proposed to construct up to four storied buildings. The work of geotechnical investigation has
been awarded to us, wide work order No. NU/229 dated 09-10-2014 from the office of
Nalanda University, Council for Social Development building, Lodhi Estate New Delhi.
The report includes the recommendations on type, depth and safe
allowable bearing capacity for the safe and strong foundation for the proposed building
structures and California Bearing ratio for construction of roads.
2. SCOPE OF WORK:
For the proposed construction of buildings structures, it is required
to determine the safe allowable bearing capacity together with necessary engineering
characteristics of underlying soil strata. Since the safe bearing capacity of soils must be
evaluated on the considerations covering shear failure and permissible settlement of sub-soil
strata as per IS: 6403-1981, IS: 1904-1978, IS: 8009 (part-I)-1976, and IS 2911 (part-1,
section -2)-2010 hence the scope of work is as follows:
2.1 Boring five numbers of boreholes of 150mm diameter within the proposed area of
construction up to a maximum depth of 20.00 meter.
2.2 Conducting the Standard Penetration Test (SPT) at every 1.50 metre interval or at change
of strata in all the boreholes.
2.3 Collecting disturbed soil samples at every 1.50 metre interval or at change of strata from
the boreholes.

1449-R2-Nalanda University
T E C H P R O ENGINEERS PVT. LTD.
2
2.4 Collecting undisturbed soil samples from the boreholes at 2.50 metre interval or change of
strata.
2.5 Transporting all the disturbed and undisturbed soil samples collected during the field
investigation for further examination and testing to our soil mechanics laboratory at Delhi.
2.6 Conducting the laboratory test on all the soil samples collected during field investigation
for determination of their engineering characteristics.
2.7 Compilation of field and laboratory test results, working out the safe allowable bearing
capacity and preparing the report including detailed recommendations and necessary
precautions.
3. PROJECT LOCATION:
The site for proposed construction of new campus of Nalanda
University is situated at Rajgir, Bihar. The site is located about 10.00 km from the main road
of Bihar Sarif to Nalanda
4. OBSERVATIONS AT SITE:
The following observations have been made at the site:-
4.1 Effects of saltpetre and termites have not been observed at the site.
4.2 The site is 0.50 metre below in reference with the adjacent road.
4.3 The site is not free from flooding and it may accumulate rain water on it..
5. FIELD INVESTIGATION:
The field investigation work at this site was carried out
from October 10th
; 2014 to October. 16th; 2014. The following investigation work was done:
5.1. Five numbers of boreholes of diameter 150 mm were made within the proposed
layout of the various buildings and ancillary structures. The boreholes were
progressed using manually operated augers and further advanced by use of
mechanically operated shell casing to the desired depth. Where caving of the

1449-R2-Nalanda University
T E C H P R O ENGINEERS PVT. LTD.
3
borehole occurred, casing was used to keep the borehole stable. All boreholes
were made up to the depth of 20.00 meter. The locations of boreholes have been
reported in “BOREHOLES LOCATION PLAN” in Appendix A.
5.2. Standard Penetration Tests were conducted as per IS: 2131-1981 at 1.50 metre
interval in all the bore holes. The number of blows for each 15 cm of penetration
was recorded. The blows required to penetrate the initial 15 cm of the split spoon
for seating the sampler is ignored due to the possible presence of loose materials or
cuttings from the drilling operation. The cumulative number of blows required to
penetrate the balance 30 cm of the 45 cm split spoon sampler is termed the SPT
value or the ‘N’ value. The results have been reported in table 1 of Appendix B
under the title “SUMMARY OF TEST RESULTS”.

1449-R2-Nalanda University
T E C H P R O ENGINEERS PVT. LTD.
4
5.3. Disturbed soil samples were collected from the boreholes at an interval of 1.50
metre. In the entire bore holes. Disturbed samples were collected from the split
spoon after conducting SPT. The samples were preserved in transparent polythene
bags. The results have been reported in table 1 of Appendix B under the title
“SUMMARY OF TEST RESULTS”.
5.4. Undisturbed soil samples were collected from the boreholes at 1.00 metre, 2.50
metre, 5.00 metre, 8.00 metre, 11.00 meter, 14.00 meter, 17.00 meter & 20.00
meter depth. Undisturbed samples were collected by attaching a 100 mm diameter
thin walled ‘Shelby’ tubes and driving the sampler using a 63.5 kg hammer in
accordance with IS:2132-1986. The tubes were sealed with wax at both ends. The
results have been reported in table 1 of Appendix B under the title “SUMMARY
OF TEST RESULTS”.
5.5 Undisturbed soil samples for performing California Bearing Ratio test have
been collected at locations marked as CBR-1 to CBR-19, in accordance with IS
2720 (part-16)-1987. CBR tests have been conducted on un soaked samples and after
soaking for 4 hours. The locations have been marked in Appendix-A Bore hole
location plan
5.6 Observation of water table has been made as per IS 6935-1973 and reported in
item No. 7 of the test report.
6 LABORATORY TESTS:
The laboratory-testing program was aimed at verifying the field classifications and
developing parameters for engineering analysis. All the tests were performed in accordance
with the current applicable IS specifications. The following laboratory tests were conducted
to determine the engineering characteristics of sub-soils:
1449-R2-Nalanda University
T E C H P R O ENGINEERS PVT. LTD.
5
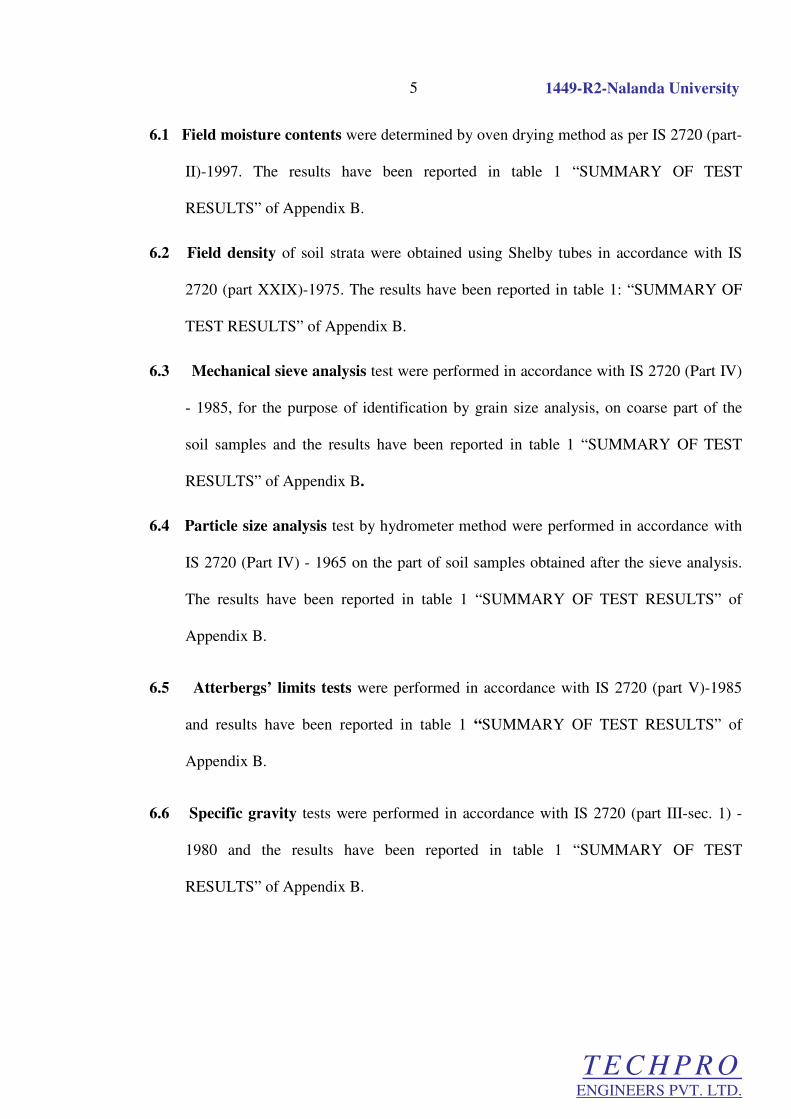
6.1 Field moisture contents were determined by oven drying method as per IS 2720 (part-
II)-1997. The results have been reported in table 1 “SUMMARY OF TEST
RESULTS” of Appendix B.
6.2 Field density of soil strata were obtained using Shelby tubes in accordance with IS
2720 (part XXIX)-1975. The results have been reported in table 1: “SUMMARY OF
TEST RESULTS” of Appendix B.
6.3 Mechanical sieve analysis test were performed in accordance with IS 2720 (Part IV)
- 1985, for the purpose of identification by grain size analysis, on coarse part of the
soil samples and the results have been reported in table 1 “SUMMARY OF TEST
RESULTS” of Appendix B.
6.4 Particle size analysis test by hydrometer method were performed in accordance with
IS 2720 (Part IV) - 1965 on the part of soil samples obtained after the sieve analysis.
The results have been reported in table 1 “SUMMARY OF TEST RESULTS” of
Appendix B.
6.5 Atterbergs’ limits tests were performed in accordance with IS 2720 (part V)-1985
and results have been reported in table 1 “SUMMARY OF TEST RESULTS” of
Appendix B.
6.6 Specific gravity tests were performed in accordance with IS 2720 (part III-sec. 1) -
1980 and the results have been reported in table 1 “SUMMARY OF TEST
RESULTS” of Appendix B.
1449-R2-Nalanda University
T E C H P R O ENGINEERS PVT. LTD.
6
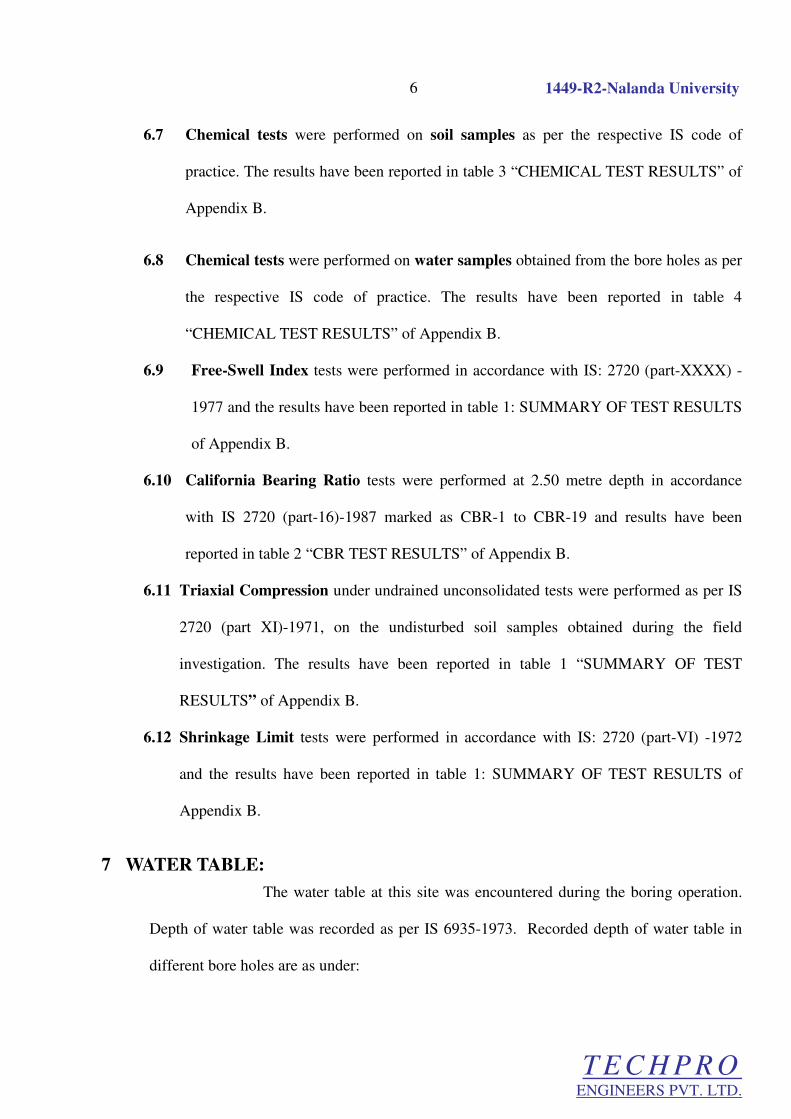
6.7 Chemical tests were performed on soil samples as per the respective IS code of
practice. The results have been reported in table 3 “CHEMICAL TEST RESULTS” of
Appendix B.
6.8 Chemical tests were performed on water samples obtained from the bore holes as per
the respective IS code of practice. The results have been reported in table 4
“CHEMICAL TEST RESULTS” of Appendix B.
6.9 Free-Swell Index tests were performed in accordance with IS: 2720 (part-XXXX) -
1977 and the results have been reported in table 1: SUMMARY OF TEST RESULTS
of Appendix B.
6.10 California Bearing Ratio tests were performed at 2.50 metre depth in accordance
with IS 2720 (part-16)-1987 marked as CBR-1 to CBR-19 and results have been
reported in table 2 “CBR TEST RESULTS” of Appendix B.
6.11 Triaxial Compression under undrained unconsolidated tests were performed as per IS
2720 (part XI)-1971, on the undisturbed soil samples obtained during the field
investigation. The results have been reported in table 1 “SUMMARY OF TEST
RESULTS” of Appendix B.
6.12 Shrinkage Limit tests were performed in accordance with IS: 2720 (part-VI) -1972
and the results have been reported in table 1: SUMMARY OF TEST RESULTS of
Appendix B.
7 WATER TABLE:
The water table at this site was encountered during the boring operation.
Depth of water table was recorded as per IS 6935-1973. Recorded depth of water table in
different bore holes are as under:

1449-R2-Nalanda University
T E C H P R O ENGINEERS PVT. LTD.
7
BORE HOLE NO. DEPTH OF WATER
TABLE(metre)
BH-1 1.60
BH-2 1.00
BH-3 1.00
BH-4 1.20
BH-5 1.00
8 SITE STRATIGRAPHY:
The classification of soil strata have been done with the help of
soil characteristics obtained in laboratory tests as per IS 1498-1978. The detailed nature of
the soil strata have been reported in table 1: “SUMMARY OF TEST RESULTS” of
Appendix B.
In general, all boreholes have soil strata which are non-expansive in nature,
containing no organic matter and harmful salts. The soil strata in all the bore holes
predominantly consist of Silts and Silty Clays with Intermediate plasticity.

1449-R2-Nalanda University
T E C H P R O ENGINEERS PVT. LTD.
8
9 RECOMMENDATIONS:
Keeping in mind, the field test results, laboratory test results and IS codes of practice the
following recommendations are hereby made:
9.1 Isolated footing shall be provided for all building structures to be constructed on
framed columns. The depth of the foundation shall be measured from the lowest relative
level of natural existing ground at the site.
Depth of foundation
(m)
Safe Bearing Capacity
(kN/m2)
1.50 80.00
2.00 90.00
2.50 100.00
9.3 Strip type of wall footing shall be provided for load bearing brick or stone masonry walls
in boundary wall etc. The depth and corresponding safe allowable bearing capacity shall
be as follows:
Depth of foundation
(metre)
Safe bearing capacity
(kN/m2)
1.00 60.00
1.25 64.00
1.50 66.00
9.4 Raft foundation may be provided for the all RCC framed columns of building structures.
The depth and corresponding safe allowable bearing capacity shall be as follows:
Depth of foundation
(Metre)
Safe bearing capacity
(kN/m2)
1.50 73.00
2.00 86.50

1449-R2-Nalanda University
T E C H P R O ENGINEERS PVT. LTD.
9
Depth of foundation
(Metre)
Safe bearing capacity
(kN/m2)
2.50 89.5
9.5 Pile Load Capacity:
Bored cast in-situ RCC Piles may also be provided for the foundation of the proposed
building structures: Load capacities of pile of diameter 450 mm and length 15.00 meter
for various bole holes have been listed in the table below:
Bore
No.
PILE LOAD CAPACITIES (kN)
For Pile Length =15.00 metre For Pile Length =18.00 metre
450450450450FFFF 500500500500FFFF 600600600600FFFF 450450450450FFFF 500500500500FFFF 600600600600FFFF
CO
MP
.
UP
LIF
T
CO
MP
.
UP
LIF
T
CO
MP
.
UP
LIF
T
CO
MP
.
UP
LIF
T
CO
MP
.
UP
LIF
T
CO
MP
.
UP
LIF
T
BH-1 300.0 236.0 358.0 280.0 482.0 369.0 360.0 291.0 433.0 347.0 585.0 461.0
BH-2 380.0 296.0 454.0 354.0 615.0 470.0 449.0 357.0 541.0 429.0 730.0 574.0
BH-3 405.0 311.0 487.0 369.0 657.0 486.0 492.0 394.0 593.0 472.0 803.0 629.0
BH-4 335.0 269.0 396.00 315.0 520.0 406.0 397.0 320.0 470.0 377.0 624.0 492.0
BH-5 335.0 261.0 407.0 314.0 559.0 420.0 395.0 317.0 484.0 386.0 668.0 524.0
9.6 All depth shall be measured from existing level of ground.
9.7 Calculations for assessment of liquefaction potential of the soil strata, has been made and
no such potential has been found.
9.8 If any loose pocket strata are found during the excavation, the foundation shall be laid
only after ensuring that the same has been cleared and appropriate remedial measures
have been adopted. If needed, the same may please be brought to the notice of the
undersigned
1449-R2-Nalanda University
T E C H P R O ENGINEERS PVT. LTD.
10
9.9 The modulus of subgrade reaction shall be taken as 2000 T/m3.
9.10 It is strongly recommended to do investigation with additional bore holes for individual
buildings as the distance between boreholes in quite large.
for Techpro Engineers Pvt. Ltd for Techpro Engineers Pvt. Ltd
(Arvind K. Garg) (Saurabh Agarwal)
B.Tech (Civil) B.Tech (Civil)
M.Tech. (Structures) M.Tech. (Geo Tech)
Managing Director Consultant
Delhi.

1449-R2-Nalanda University
T E C H P R O ENGINEERS PVT. LTD.
11
APPENDIX – A
BORE HOLES LOCATION PLAN
CBR
BH-1
BH-2
BH-3BH-4
BH-5
CBR-11
CBR-12
CBR-13
CBR-15
CBR-3
CBR-19
CBR-18
CBR-17
CBR-7
CBR-8
CBR-2
CBR-1
CBR-9
CBR-5
CBR-10
CBR-6
CBR-16
CBR-14
CBR-4
BORE HOLE

1449-R2-Nalanda University
T E C H P R O ENGINEERS PVT. LTD.
12
APPENDIX ‘B’
SUMMARY OF TEST RESULTS (BH-1)
Bo
re h
ole
dep
th
Soil Description
So
il c
lass
ific
atio
n
SPT Grain Size Analysis Density and
Moisture Atterberg Limits
Shear Strength
Parameters
Sh
rin
kag
e L
imit
(%
)
Fre
e S
wel
l In
dex
(%
)
Sp
ecif
ic G
rav
ity
G
s Consolidation
Characteristic
Ob
serv
ed
Co
rrec
ted
Gra
vel
(%
)
Co
urs
e S
and
(%)
Med
ium
San
d
(%)
Fin
e S
and
(%
)
Sil
t (%
)
Cla
y (
%)
mo
istu
re
Co
nte
nt
(%)
Bu
lk D
ensi
ty
(gm
/cc)
Dry
Den
sity
(gm
/ cc
)
Liq
uid
Lim
it
(%)
Pla
stic
Lim
it
(%)
Pla
stic
In
dex
(%)
Ty
pe
of
test
C
(KN
/m2)
Φ
(Deg
rees
)
Cc
Vo
id R
atio
,
e 0
1.00 Inorganic silty
clays of
intermediate
plasticity
CI - - 1 3 6 3 76 11 20.10 1.850 1.540 45 30 15 UU 30 11 11 12 2.66 0.120 0.727
1.50 - 9 12.88 - - - - - - 20.29 - - - - - - - - - - - - -
2.50
Inorganic clay
with high
plasticity
CH - - 2 3 5 3 69 18 28.13 1.925 1.502 54 27 27 UU 40 8 13 15 2.67 0.135 0.778
3.00 - 13 15.50 - - - - - - 23.30 - - - - - - - - - - - - -
4.50 - 17 16.87 - - - - - - 17.11 - - - - - - - - - - - - -
5.00
Inorganic clay
of intermediate
plasticity
CI - - 0 0 2 6 79 13 21.85 2.009 1.649 45 26 19 UU 30 9 12 11 2.67 0.125 0.619
6.00 - 19 16.21 - - - - - - 21.28 - - - - - - - - - - - - -
7.50 - 22 16.20 - - - - - - 19.05 - - - - - - - - - - - - -
8.00
Inorganic silts of
intermediate
plasticity
MI - - 2 1 1 8 76 12 17.12 1.940 1.656 40 26 14 UU 27 10 12 10 2.67 0.122 0.612
9.00 - 33 19.56 - - - - - - 17.60 - - - - - - - - - - - - -
10.50 - 34 18.71 - - - - - - 19.46 - - - - - - - - - - - - -
11.00 MI - 1 1 1 15 74 8 17.50 1.968 1.675 40 28 12 UU 22 13 - - 2.66 0.110 0.588
12.00 - 32 16.88 - - - - - - 14.96 - - - - - - - - - - - - -
13.50 - 42 19.34 - - - - - - 15.20 - - - - - - - - - - - - -

1449-R2-Nalanda University
T E C H P R O ENGINEERS PVT. LTD.
13
APPENDIX ‘B’
SUMMARY OF TEST RESULTS (BH-1)
Bo
re h
ole
dep
th
Soil Description
So
il c
lass
ific
atio
n
SPT Grain Size Analysis Density and
Moisture Atterberg Limits
Shear Strength
Parameters
Sh
rin
kag
e L
imit
(%
)
Fre
e S
wel
l In
dex
(%
)
Sp
ecif
ic G
rav
ity
G
s Consolidation
Characteristic
Ob
serv
ed
Co
rrec
ted
Gra
vel
(%
)
Co
urs
e S
and
(%)
Med
ium
San
d
(%)
Fin
e S
and
(%
)
Sil
t (%
)
Cla
y (
%)
mo
istu
re
Co
nte
nt
(%)
Bu
lk D
ensi
ty
(gm
/cc)
Dry
Den
sity
(gm
/ cc
)
Liq
uid
Lim
it
(%)
Pla
stic
Lim
it
(%)
Pla
stic
In
dex
(%)
Ty
pe
of
test
C
(KN
/m2)
Φ
(Deg
rees
)
Cc
Vo
id R
atio
,
e 0
14.00
Inorganic silts
of intermediate
plasticity
MI - 4 2 3 3 84 4 15.30 1.949 1.690 36 28 8 UU 17 18 - - 2.66 0.105 0.574
15.00 - 45 19.30 - - - - - - 15.44 - - - - - - - - - - - - -
16.50 - 38 16.20 - - - - - - 15.41 - - - - - - - - - - - - -
17.00 MI - - 2 1 3 6 82 6 15.40 1.956 1.695 40 28 12 UU 20 16 - 2.66 0.107 0.569
18.00 - 42 16.59 - - - - - - 15.39 - - - - - - - - - - - - -
19.50 - 57 19.99 - - - - - - 17.38 - - - - - - - - - - - - -
20.00 MI - - 2 2 3 7 81 5 18.30 2.017 1.705 36 28 8 UU 19 16 - - 2.66 0.105 0.560
1449-R2-Nalanda University
T E C H P R O ENGINEERS PVT. LTD.
14
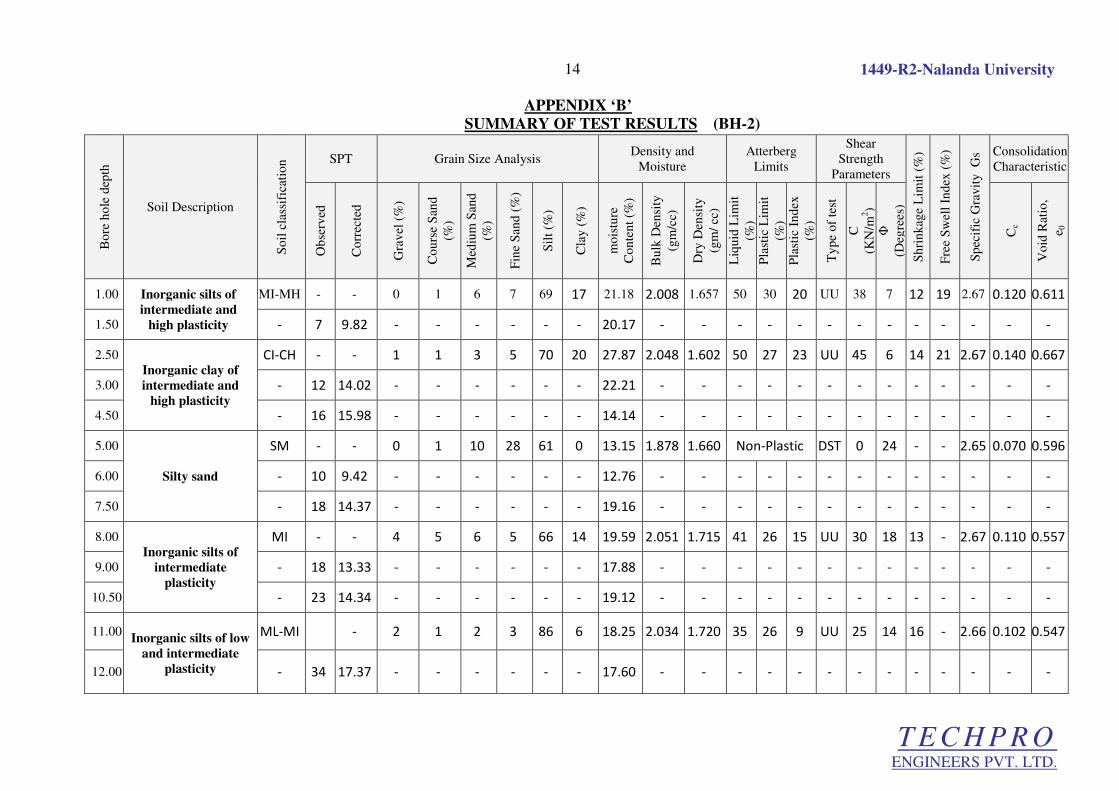
APPENDIX ‘B’
SUMMARY OF TEST RESULTS (BH-2)
Bo
re h
ole
dep
th
Soil Description
So
il c
lass
ific
atio
n SPT Grain Size Analysis Density and
Moisture
Atterberg
Limits
Shear
Strength
Parameters
Sh
rin
kag
e L
imit
(%
)
Fre
e S
wel
l In
dex
(%
)
Sp
ecif
ic G
rav
ity
G
s Consolidation
Characteristic
Ob
serv
ed
Co
rrec
ted
Gra
vel
(%
)
Co
urs
e S
and
(%)
Med
ium
San
d
(%)
Fin
e S
and
(%
)
Sil
t (%
)
Cla
y (
%)
mo
istu
re
Co
nte
nt
(%)
Bu
lk D
ensi
ty
(gm
/cc)
Dry
Den
sity
(gm
/ cc
)
Liq
uid
Lim
it
(%)
Pla
stic
Lim
it
(%)
Pla
stic
In
dex
(%)
Ty
pe
of
test
C
(KN
/m2)
Φ
(Deg
rees
)
Cc
Vo
id R
atio
,
e 0
1.00 Inorganic silts of
intermediate and
high plasticity
MI-MH - - 0 1 6 7 69 17 21.18 2.008 1.657 50 30 20 UU 38 7 12 19 2.67 0.120 0.611
1.50 - 7 9.82 - - - - - - 20.17 - - - - - - - - - - - - -
2.50
Inorganic clay of
intermediate and
high plasticity
CI-CH - - 1 1 3 5 70 20 27.87 2.048 1.602 50 27 23 UU 45 6 14 21 2.67 0.140 0.667
3.00 - 12 14.02 - - - - - - 22.21 - - - - - - - - - - - - -
4.50 - 16 15.98 - - - - - - 14.14 - - - - - - - - - - - - -
5.00
Silty sand
SM - - 0 1 10 28 61 0 13.15 1.878 1.660 Non-Plastic DST 0 24 - - 2.65 0.070 0.596
6.00 - 10 9.42 - - - - - - 12.76 - - - - - - - - - - - - -
7.50 - 18 14.37 - - - - - - 19.16 - - - - - - - - - - - - -
8.00
Inorganic silts of
intermediate
plasticity
MI - - 4 5 6 5 66 14 19.59 2.051 1.715 41 26 15 UU 30 18 13 - 2.67 0.110 0.557
9.00 - 18 13.33 - - - - - - 17.88 - - - - - - - - - - - - -
10.50 - 23 14.34 - - - - - - 19.12 - - - - - - - - - - - - -
11.00 Inorganic silts of low
and intermediate
plasticity
ML-MI - 2 1 2 3 86 6 18.25 2.034 1.720 35 26 9 UU 25 14 16 - 2.66 0.102 0.547
12.00 - 34 17.37 - - - - - - 17.60 - - - - - - - - - - - - -

1449-R2-Nalanda University
T E C H P R O ENGINEERS PVT. LTD.
15
APPENDIX ‘B’
SUMMARY OF TEST RESULTS (BH-2)
Bo
re h
ole
dep
th
Soil Description
So
il c
lass
ific
atio
n SPT Grain Size Analysis Density and
Moisture
Atterberg
Limits
Shear
Strength
Parameters
Sh
rin
kag
e L
imit
(%
)
Fre
e S
wel
l In
dex
(%
)
Sp
ecif
ic G
rav
ity
G
s Consolidation
Characteristic
Ob
serv
ed
Co
rrec
ted
Gra
vel
(%
)
Co
urs
e S
and
(%)
Med
ium
San
d
(%)
Fin
e S
and
(%
)
Sil
t (%
)
Cla
y (
%)
mo
istu
re
Co
nte
nt
(%)
Bu
lk D
ensi
ty
(gm
/cc)
Dry
Den
sity
(gm
/ cc
)
Liq
uid
Lim
it
(%)
Pla
stic
Lim
it
(%)
Pla
stic
In
dex
(%)
Ty
pe
of
test
C
(KN
/m2)
Φ
(Deg
rees
)
Cc
Vo
id R
atio
,
e 0
13.50
Inorganic silts of
intermediate
plasticity
- 41 18.73 - - - - - - 16.02 - - - - - - - - - - - - -
14.00 MI - 9 3 6 3 68 11 18.15 2.038 1.725 40 27 13 UU 28 20 13 - 2.66 0.107 0.542
15.00 - 37 16.46 - - - - - - 17.83 - - - - - - - - - - - - -
16.50 - 44 17.73 - - - - - - 19.34 - - - - - - - - - - - - -
17.00
Inorganic silts of
intermediate
plasticity
MI - - 4 2 4 3 75 12 17.25 2.005 1.710 42 28 14 UU 29 16 - - 2.66 0.108 0.556
18.00 - 45 17.16 - - - - - - 18.95 - - - - - - - - - - - - -
19.50 - 57 19.63 - - - - - - 18.74 - - - - - - - - - - - - -
20.00 Inorganic clay of
intermediate and
high plasticity
MI-MH - - 1 1 1 3 78 16 17.45 2.014 1.715 50 30 20 UU 45 9 - - 2.66 0.115 0.551

1449-R2-Nalanda University
T E C H P R O ENGINEERS PVT. LTD.
16
APPENDIX ‘B’
SUMMARY OF TEST RESULTS (BH-3)
Bo
re h
ole
dep
th
Soil Description
So
il c
lass
ific
atio
n SPT Grain Size Analysis
Density and
Moisture Atterberg Limits
Shear Strength
Parameters
Sh
rin
kag
e L
imit
(%
)
Fre
e S
wel
l In
dex
(%
)
Sp
ecif
ic G
rav
ity
G
s Consolidation
Characteristic
Ob
serv
ed
Co
rrec
ted
Gra
vel
(%
)
Co
urs
e S
and
(%)
Med
ium
San
d
(%)
Fin
e S
and
(%
)
Sil
t (%
)
Cla
y (
%)
mo
istu
re
Co
nte
nt
(%)
Bu
lk D
ensi
ty
(gm
/cc)
Dry
Den
sity
(gm
/ cc
)
Liq
uid
Lim
it
(%)
Pla
stic
Lim
it
(%)
Pla
stic
In
dex
(%)
Ty
pe
of
test
C
(KN
/m2)
Φ
(Deg
rees
)
Cc
Vo
id R
atio
,
e 0
1.00 Inorganic Silts
of intermediate
and high
plasticity
MI-MH - - 0 1 4 4 74 17 22.02 1.949 1.597 50 30 20 UU 40 7 11 17 2.67 0.120 0.672
1.50 - 7 9.89 - - - - - - 23.03 - - - - - - - - - - - - -
2.50
Inorganic silts of
High plasticity
MH - - 0 0 2 2 78 18 22.70 1.980 1.614 52 30 22 UU 42 6 13 19 2.67 0.122 0.654
3.00 - 9 10.61 - - - - - - 22.32 - - - - - - - - - - - - -
4.50 - 11 11.46 - - - - - - 24.29 - - - - - - - - - - - - -
5.00 MH - - 5 2 2 2 73 16 21.30 2.010 1.657 51 30 21 UU 42 16 12 15 2.67 0.115 0.611
6.00 - 17 15.11 - - - - - - 18.69 - - - - - - - - - - - - -
7.50 - 14 12.16 - - - - - - 16.55 - - - - - - - - - - - - -
8.00
Inorganic silts
of intermediate
plasticity
MI - - 1 4 6 5 70 14 17.50 2.128 1.811 45 28 17 UU 40 12 14 - 2.67 0.115 0.474
9.00 - 20 14.06 - - - - - - 17.62 - - - - - - - - - - - - -
10.50 - 22 13.86 - - - - - - 17.42 - - - - - - - - - - - - -
11.00 MI - 9 6 6 3 64 12 16.30 2.152 1.850 41 28 13 UU 38 20 10 - 2.67 0.105 0.443
12.00 - 26 14.39 - - - - - - 14.64 - - - - - - - - - - - - -
13.50 - 40 18.17 - - - - - - 16.75 - - - - - - - - - - - - -

1449-R2-Nalanda University
T E C H P R O ENGINEERS PVT. LTD.
17
APPENDIX ‘B’
SUMMARY OF TEST RESULTS (BH-3)
Bo
re h
ole
dep
th
Soil Description
So
il c
lass
ific
atio
n SPT Grain Size Analysis
Density and
Moisture Atterberg Limits
Shear Strength
Parameters
Sh
rin
kag
e L
imit
(%
)
Fre
e S
wel
l In
dex
(%
)
Sp
ecif
ic G
rav
ity
G
s Consolidation
Characteristic
Ob
serv
ed
Co
rrec
ted
Gra
vel
(%
)
Co
urs
e S
and
(%)
Med
ium
San
d
(%)
Fin
e S
and
(%
)
Sil
t (%
)
Cla
y (
%)
mo
istu
re
Co
nte
nt
(%)
Bu
lk D
ensi
ty
(gm
/cc)
Dry
Den
sity
(gm
/ cc
)
Liq
uid
Lim
it
(%)
Pla
stic
Lim
it
(%)
Pla
stic
In
dex
(%)
Ty
pe
of
test
C
(KN
/m2)
Φ
(Deg
rees
)
Cc
Vo
id R
atio
,
e 0
14.00
Inorganic silts
of intermediate
plasticity
MI - 2 2 6 4 77 9 16.30 2.140 1.840 42 28 14 UU 35 14 - - 2.67 0.108 0.451
15.00 - 48 19.66 - - - - - - 16.11 - - - - - - - - - - - - -
16.50 - 57 21.28 - - - - - - 16.69 - - - - - - - - - - - - -
17.00 MI - - 7 2 3 4 72 12 13.46 2.172 1.914 41 26 15 UU 35 18 - 2.67 0.107 0.395
18.00 - 65 22.42 - - - - - - 15.26 - - - - - - - - - - - - -
19.50 - 68 22.11 - - - - - - 14.22 - - - - - - - - - - - - -
20.00 MI - - 5 5 5 3 75 7 14.10 2.160 1.893 40 28 12 UU 25 16 - - 2.67 0 0.410

1449-R2-Nalanda University
T E C H P R O ENGINEERS PVT. LTD.
18
APPENDIX ‘B’
SUMMARY OF TEST RESULTS (BH-4) B
ore
ho
le d
epth
Soil Description
So
il c
lass
ific
atio
n SPT Grain Size Analysis
Density and
Moisture Atterberg Limits
Shear Strength
Parameters
Sh
rin
kag
e L
imit
(%
)
Fre
e S
wel
l In
dex
(%
)
Sp
ecif
ic G
rav
ity
G
s Consolidation
Characteristic
Ob
serv
ed
Co
rrec
ted
Gra
vel
(%
)
Co
urs
e S
and
(%)
Med
ium
San
d
(%)
Fin
e S
and
(%
)
Sil
t (%
)
Cla
y (
%)
mo
istu
re
Co
nte
nt
(%)
Bu
lk D
ensi
ty
(gm
/cc)
Dry
Den
sity
(gm
/ cc
)
Liq
uid
Lim
it
(%)
Pla
stic
Lim
it
(%)
Pla
stic
In
dex
(%)
Ty
pe
of
test
C
(KN
/m2)
Φ
(Deg
rees
)
Cc
Vo
id R
atio
,
e 0
1.00 Inorganic clay
of intermediate
and high
plasticity
CI-CH - - 0 1 2 2 75 20 21.90 1.871 1.535 50 30 22 UU 45 7 14 21 2.67 0.135 0.739
1.50 - 7 9.99 - - - - - - 21.77 - - - - - - - - - - - - -
2.50
Inorganic silts of
intermediate
plasticity
MI - - 3 1 3 2 75 16 25.63 1.936 1.541 48 28 20 UU 41 9 13 15 2.67 0.120 0.733
3.00 - 10 11.89 - - - - - - 21.84 - - - - - - - - - - - - -
4.50 - 11 11.57 - - - - - - 24.08 - - - - - - - - - - - - -
5.00 Inorganic Silts
of intermediate
and high
plasticity
MI-
MH - - 1 1 3 2 77 16 21.37 1.895 1.561 50 30 20 UU 45 11 12 - 2.67 0.120 0.710
6.00 - 15 14.34 - - - - - - 19.80 - - - - - - - - - - - - -
7.50 - 17 14.12 - - - - - - 18.02 - - - - - - - - - - - - -
8.00
Inorganic clay
of intermediate
plasticity
CI - - 1 1 1 2 80 15 20.81 1.945 1.610 45 26 19 UU 40 12 13 - 2.67 0.117 0.658
9.00 - 20 14.35 - - - - - - 17.26 - - - - - - - - - - - - -
10.50 - 23 14.59 - - - - - - 17.72 - - - - - - - - - - - - -
11.00 Inorganic silts
of intermediate
plasticity
MI - 1 3 2 6 75 13 17.76 1.945 1.652 42 27 15 UU 38 11 12 - 2.67 0.115 0.616
12.00 - 22 13.37 - - - - - - 17.17 - - - - - - - - - - - - -
13.50 - 31 15.70 - - - - - - 18.70 - - - - - - - - - - - - -

1449-R2-Nalanda University
T E C H P R O ENGINEERS PVT. LTD.
19
APPENDIX ‘B’
SUMMARY OF TEST RESULTS (BH-4) B
ore
ho
le d
epth
Soil Description
So
il c
lass
ific
atio
n SPT Grain Size Analysis
Density and
Moisture Atterberg Limits
Shear Strength
Parameters
Sh
rin
kag
e L
imit
(%
)
Fre
e S
wel
l In
dex
(%
)
Sp
ecif
ic G
rav
ity
G
s Consolidation
Characteristic
Ob
serv
ed
Co
rrec
ted
Gra
vel
(%
)
Co
urs
e S
and
(%)
Med
ium
San
d
(%)
Fin
e S
and
(%
)
Sil
t (%
)
Cla
y (
%)
mo
istu
re
Co
nte
nt
(%)
Bu
lk D
ensi
ty
(gm
/cc)
Dry
Den
sity
(gm
/ cc
)
Liq
uid
Lim
it
(%)
Pla
stic
Lim
it
(%)
Pla
stic
In
dex
(%)
Ty
pe
of
test
C
(KN
/m2)
Φ
(Deg
rees
)
Cc
Vo
id R
atio
,
e 0
14.00 MI - 1 1 3 3 80 12 18.60 1.981 1.670 42 27 15 UU 39 12 - - 2.67 0.112 0.599
15.00
Inorganic silts
of intermediate
plasticity
- 40 17.78 - - - - - - 18.50 - - - - - - - - - - - - -
16.50 - 40 16.88 - - - - - - 18.83 - - - - - - - - - - - - -
17.00 MI - - 2 2 4 5 80 7 15.30 1.949 1.690 40 28 12 UU 20 15 - 2.66 0.106 0.574
18.00 - 46 17.83 - - - - - - 13.55 - - - - - - - - - - - - -
19.50 - 58 20.35 - - - - - - 19.12 - - - - - - - - - - - - -
20.00 MI - - 3 1 3 3 83 7 19.50 2.037 1.705 40 28 12 UU 20 16 - - 2.66 0.105 0.560
1449-R2-Nalanda University
T E C H P R O ENGINEERS PVT. LTD.
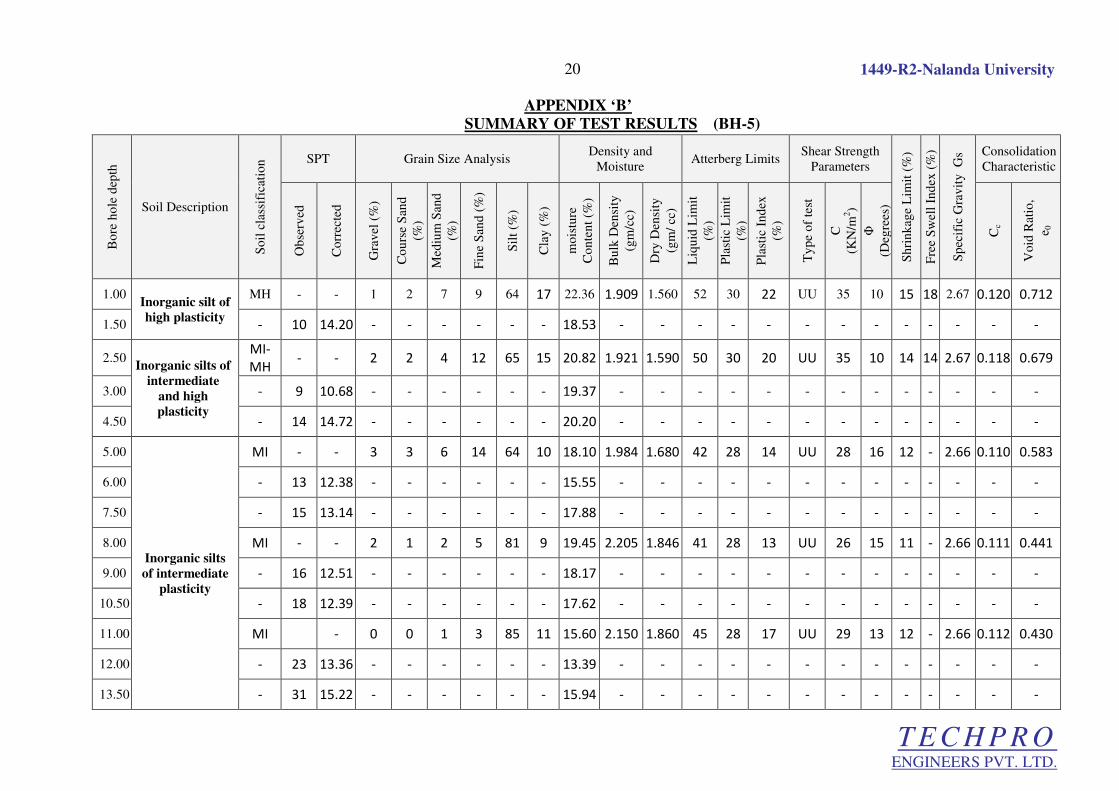
20
APPENDIX ‘B’
SUMMARY OF TEST RESULTS (BH-5) B
ore
ho
le d
epth
Soil Description
So
il c
lass
ific
atio
n SPT Grain Size Analysis
Density and
Moisture Atterberg Limits
Shear Strength
Parameters
Sh
rin
kag
e L
imit
(%
)
Fre
e S
wel
l In
dex
(%
)
Sp
ecif
ic G
rav
ity
G
s Consolidation
Characteristic
Ob
serv
ed
Co
rrec
ted
Gra
vel
(%
)
Co
urs
e S
and
(%)
Med
ium
San
d
(%)
Fin
e S
and
(%
)
Sil
t (%
)
Cla
y (
%)
mo
istu
re
Co
nte
nt
(%)
Bu
lk D
ensi
ty
(gm
/cc)
Dry
Den
sity
(gm
/ cc
)
Liq
uid
Lim
it
(%)
Pla
stic
Lim
it
(%)
Pla
stic
In
dex
(%)
Ty
pe
of
test
C
(KN
/m2)
Φ
(Deg
rees
)
Cc
Vo
id R
atio
,
e 0
1.00 Inorganic silt of
high plasticity
MH - - 1 2 7 9 64 17 22.36 1.909 1.560 52 30 22 UU 35 10 15 18 2.67 0.120 0.712
1.50 - 10 14.20 - - - - - - 18.53 - - - - - - - - - - - - -
2.50 Inorganic silts of
intermediate
and high
plasticity
MI-
MH - - 2 2 4 12 65 15 20.82 1.921 1.590 50 30 20 UU 35 10 14 14 2.67 0.118 0.679
3.00 - 9 10.68 - - - - - - 19.37 - - - - - - - - - - - - -
4.50 - 14 14.72 - - - - - - 20.20 - - - - - - - - - - - - -
5.00
Inorganic silts
of intermediate
plasticity
MI - - 3 3 6 14 64 10 18.10 1.984 1.680 42 28 14 UU 28 16 12 - 2.66 0.110 0.583
6.00 - 13 12.38 - - - - - - 15.55 - - - - - - - - - - - - -
7.50 - 15 13.14 - - - - - - 17.88 - - - - - - - - - - - - -
8.00 MI - - 2 1 2 5 81 9 19.45 2.205 1.846 41 28 13 UU 26 15 11 - 2.66 0.111 0.441
9.00 - 16 12.51 - - - - - - 18.17 - - - - - - - - - - - - -
10.50 - 18 12.39 - - - - - - 17.62 - - - - - - - - - - - - -
11.00 MI - 0 0 1 3 85 11 15.60 2.150 1.860 45 28 17 UU 29 13 12 - 2.66 0.112 0.430
12.00 - 23 13.36 - - - - - - 13.39 - - - - - - - - - - - - -
13.50 - 31 15.22 - - - - - - 15.94 - - - - - - - - - - - - -
1449-R2-Nalanda University
T E C H P R O ENGINEERS PVT. LTD.
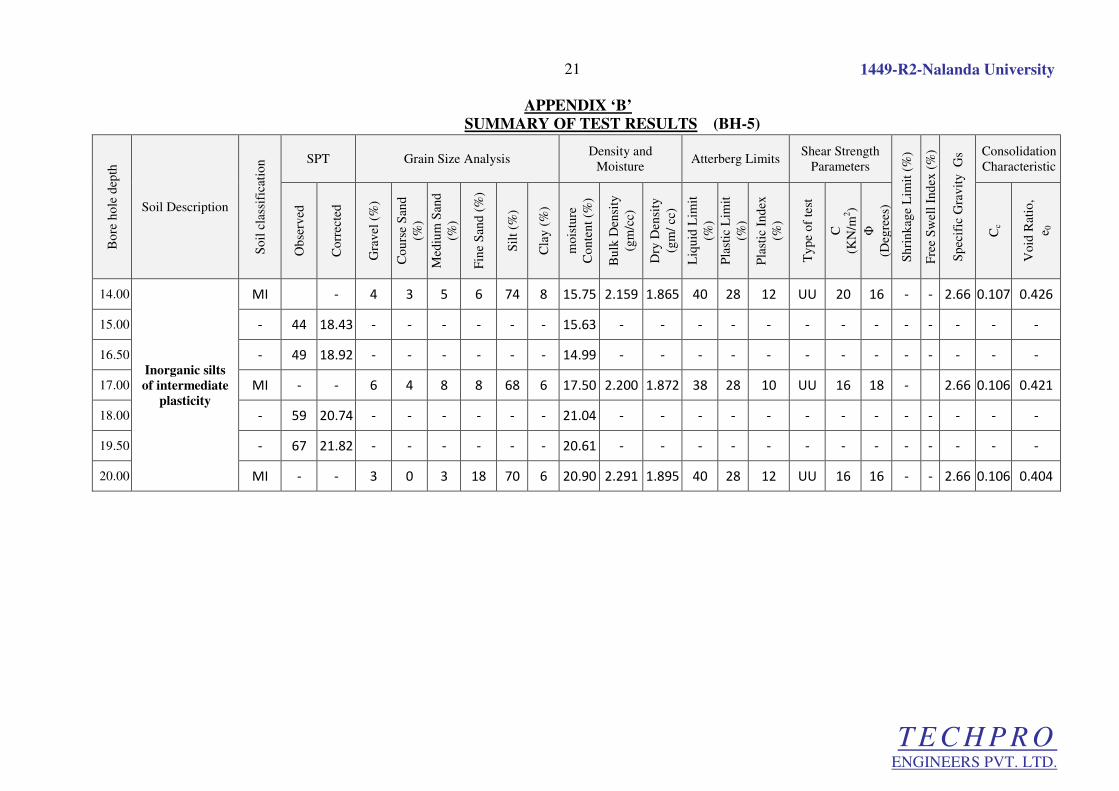
21
APPENDIX ‘B’
SUMMARY OF TEST RESULTS (BH-5) B
ore
ho
le d
epth
Soil Description
So
il c
lass
ific
atio
n SPT Grain Size Analysis
Density and
Moisture Atterberg Limits
Shear Strength
Parameters
Sh
rin
kag
e L
imit
(%
)
Fre
e S
wel
l In
dex
(%
)
Sp
ecif
ic G
rav
ity
G
s Consolidation
Characteristic
Ob
serv
ed
Co
rrec
ted
Gra
vel
(%
)
Co
urs
e S
and
(%)
Med
ium
San
d
(%)
Fin
e S
and
(%
)
Sil
t (%
)
Cla
y (
%)
mo
istu
re
Co
nte
nt
(%)
Bu
lk D
ensi
ty
(gm
/cc)
Dry
Den
sity
(gm
/ cc
)
Liq
uid
Lim
it
(%)
Pla
stic
Lim
it
(%)
Pla
stic
In
dex
(%)
Ty
pe
of
test
C
(KN
/m2)
Φ
(Deg
rees
)
Cc
Vo
id R
atio
,
e 0
14.00
Inorganic silts
of intermediate
plasticity
MI - 4 3 5 6 74 8 15.75 2.159 1.865 40 28 12 UU 20 16 - - 2.66 0.107 0.426
15.00 - 44 18.43 - - - - - - 15.63 - - - - - - - - - - - - -
16.50 - 49 18.92 - - - - - - 14.99 - - - - - - - - - - - - -
17.00 MI - - 6 4 8 8 68 6 17.50 2.200 1.872 38 28 10 UU 16 18 - 2.66 0.106 0.421
18.00 - 59 20.74 - - - - - - 21.04 - - - - - - - - - - - - -
19.50 - 67 21.82 - - - - - - 20.61 - - - - - - - - - - - - -
20.00 MI - - 3 0 3 18 70 6 20.90 2.291 1.895 40 28 12 UU 16 16 - - 2.66 0.106 0.404
1449-R2-Nalanda University
T E C H P R O ENGINEERS PVT. LTD.
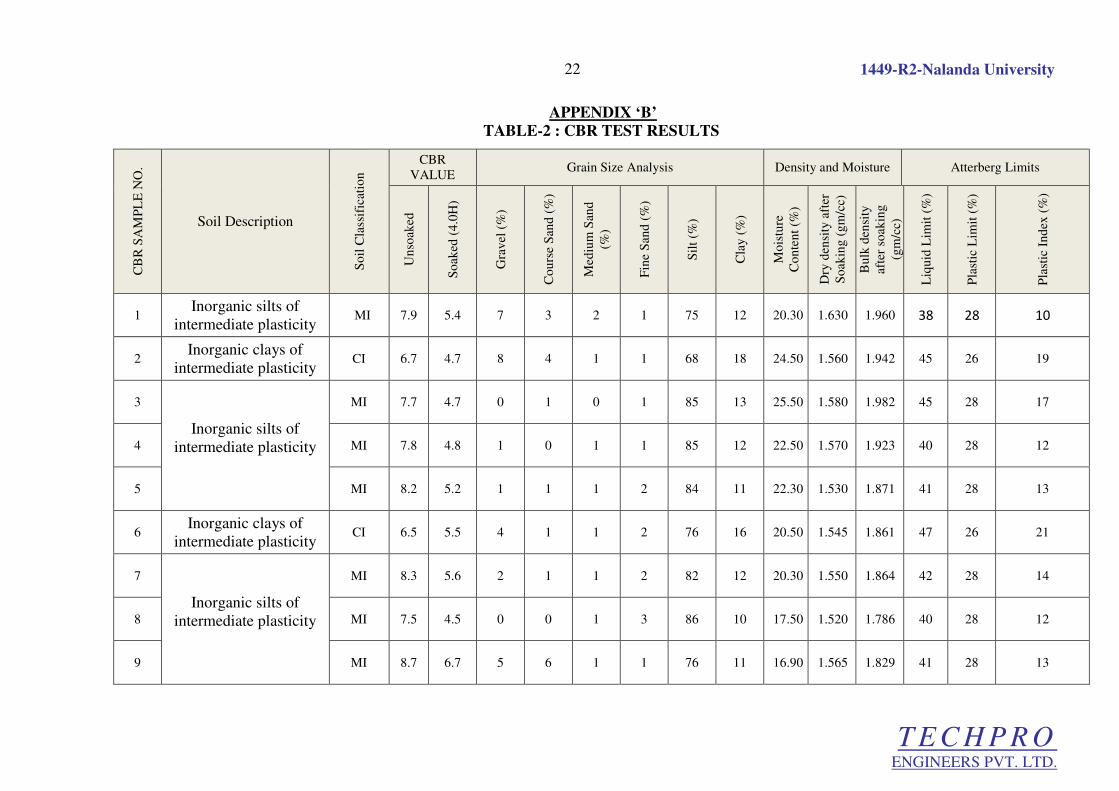
22
APPENDIX ‘B’
TABLE-2 : CBR TEST RESULTS C
BR
SA
MP
LE
NO
.
Soil Description
So
il C
lass
ific
atio
n
CBR
VALUE Grain Size Analysis Density and Moisture Atterberg Limits
Un
soak
ed
So
aked
(4.0
H)
Gra
vel
(%
)
Co
urs
e S
and
(%
)
Med
ium
San
d
(%)
Fin
e S
and
(%
)
Sil
t (%
)
Cla
y (
%)
Mo
istu
re
Co
nte
nt
(%)
Dry
den
sity
aft
er
So
akin
g (
gm
/cc)
Bu
lk d
ensi
ty
afte
r so
akin
g
(gm
/cc)
Liq
uid
Lim
it (
%)
Pla
stic
Lim
it (
%)
Pla
stic
In
dex
(%
)
1 Inorganic silts of
intermediate plasticity MI 7.9 5.4 7 3 2 1 75 12 20.30 1.630 1.960 38 28 10
2 Inorganic clays of
intermediate plasticity CI 6.7 4.7 8 4 1 1 68 18 24.50 1.560 1.942 45 26 19
3
Inorganic silts of
intermediate plasticity
MI 7.7 4.7 0 1 0 1 85 13 25.50 1.580 1.982 45 28 17
4 MI 7.8 4.8 1 0 1 1 85 12 22.50 1.570 1.923 40 28 12
5 MI 8.2 5.2 1 1 1 2 84 11 22.30 1.530 1.871 41 28 13
6 Inorganic clays of
intermediate plasticity CI 6.5 5.5 4 1 1 2 76 16 20.50 1.545 1.861 47 26 21
7
Inorganic silts of
intermediate plasticity
MI 8.3 5.6 2 1 1 2 82 12 20.30 1.550 1.864 42 28 14
8 MI 7.5 4.5 0 0 1 3 86 10 17.50 1.520 1.786 40 28 12
9 MI 8.7 6.7 5 6 1 1 76 11 16.90 1.565 1.829 41 28 13

1449-R2-Nalanda University
T E C H P R O ENGINEERS PVT. LTD.
23
CB
R S
AM
PL
E N
O.
Soil Description
So
il C
lass
ific
atio
n
CBR
VALUE Grain Size Analysis Density and Moisture Atterberg Limits
Un
soak
ed
So
aked
(4.0
Hou
rs)
Gra
vel
(%
)
Co
urs
e S
and
(%
)
Med
ium
San
d
(%)
Fin
e S
and
(%
)
Sil
t (%
)
Cla
y (
%)
Mo
istu
re C
on
ten
t
(%)
Dry
den
sity
aft
er
So
akin
g (
gm
/cc)
Bu
lk d
ensi
ty a
fter
soak
ing
(gm
/cc)
Liq
uid
Lim
it (
%)
Pla
stic
Lim
it (
%)
Pla
stic
In
dex
(%
)
10
Inorganic silts of
intermediate plasticity
MI 7.9 6.4 11 9 2 1 70 7 20.50 1.560 1.879 40 28 12
11 MI 7.7 6.0 12 5 2 5 66 11 15.90 1.565 1.813 41 28 13
12 MI 7.5 5.0 0 3 5 2 80 10 22.50 1.580 1.935 47 26 21
13 MI 8.1 6.2 0 7 12 5 66 11 18.30 1.575 1.863 42 28 14
14 MI 7.9 5.4 0 2 1 0 85 12 12.50 1.560 1.755 40 28 12
15 MI 7.8 5.6 0 1 1 0 88 10 12.80 1.570 1.771 41 28 13
16 MI 7.5 6.0 0 1 8 8 76 12 20.10 1.530 1.837 40 28 12
17 MI 7.9 6.9 0 1 6 7 76 10 21.18 1.520 1.849 41 28 13
18 MI 7.9 6.5 0 1 4 4 79 12 22.02 1.521 1.858 47 26 21
19 MI 7.1 6.5 0 1 2 2 84 11 21.90 1.530 1.865 42 28 14

1449-R2-Nalanda University
T E C H P R O ENGINEERS PVT. LTD.
24
APPENDIX-B
TABLE-3 : CHEMICAL TEST RESULTS ON SOIL SAMPLES
Bore
No.
Depth of
Sample
(m)
pH
Salt (mg/litre)
Sulphates Chlorides
BH-1 2.50 7.30 230 240
BH-2 2.50 7.50 235 266
BH-3 2.50 7.40 245 255
BH-4 2.50 7.45 238 245
BH-5 2.50 7.55 220 235
APPENDIX-B
TABLE-4 : CHEMICAL TEST RESULTS ON WATER SAMPLES
Bore
No.
Depth of
Sample
(m)
pH
Salt (mg/litre)
Sulphates Chlorides Hardness Iron
BH-1 1.60 7.60 225 265 1250 1.2
BH-2 1.00 7.50 235 270 1300 1.1
BH-3 1.00 7.40 240 275 1320 1.3
BH-4 1.20 7.70 230 280 1300 1.1
BH-5 1.00 7.50 225 260 1350 1.3

1449-R2-Nalanda University
T E C H P R O ENGINEERS PVT. LTD.
25
APPENDIX- C
CHART 1: - BORE LOG CHART (BH-1)

1449-R2-Nalanda University
T E C H P R O ENGINEERS PVT. LTD.
26
APPENDIX- C
CHART 2: - BORE LOG CHART (BH-2)

1449-R2-Nalanda University
T E C H P R O ENGINEERS PVT. LTD.
27
APPENDIX- C
CHART 3: - BORE LOG CHART (BH-3)
1449-R2-Nalanda University
T E C H P R O ENGINEERS PVT. LTD.
28
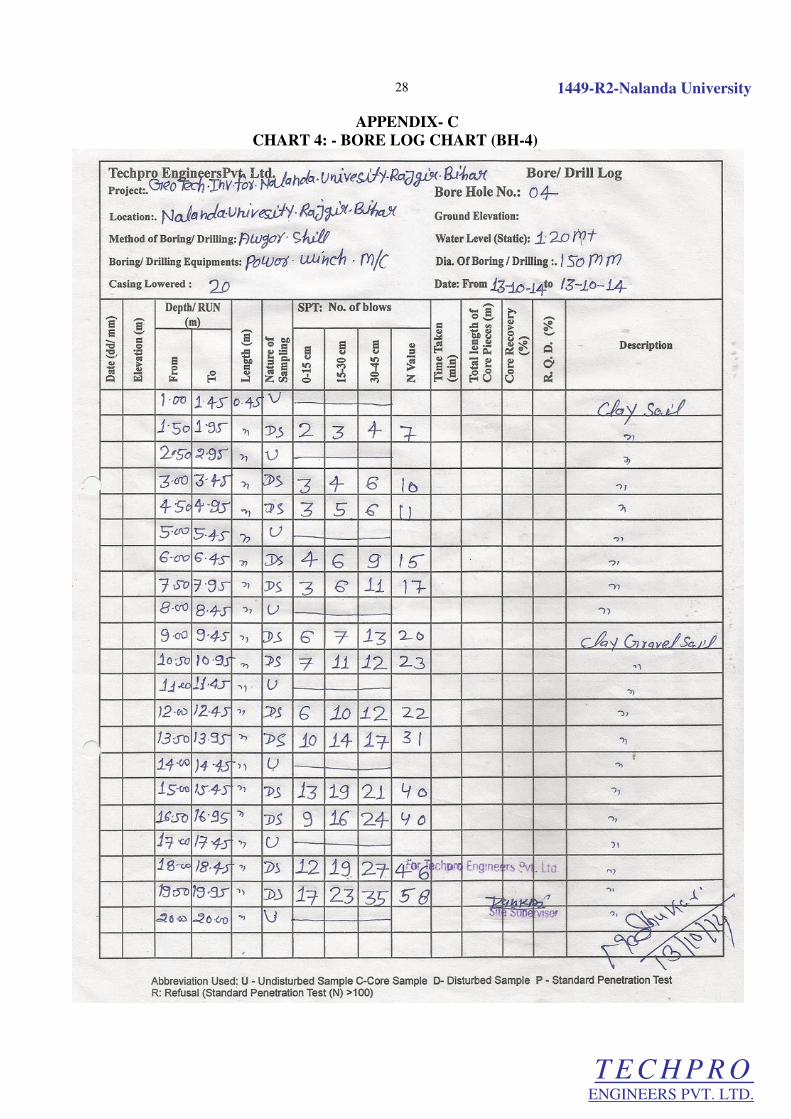
APPENDIX- C
CHART 4: - BORE LOG CHART (BH-4)

1449-R2-Nalanda University
T E C H P R O ENGINEERS PVT. LTD.
29
APPENDIX- C
CHART 5: - BORE LOG CHART (BH-5)

GRAPH 1:
Note: - These are software generated curve
144930
APPENDIX ‘D’ GRAPH 1: PARTICLE GRADATION CURVE (BH-1)
These are software generated curve
1449-R2-Nalanda University
T E C H P R O ENGINEERS PVT. LTD.
GRAPH 2: PARTICLE GRADATION CURVE (BH
Note: - These are software generated curve
144931
APPENDIX ‘D’ GRAPH 2: PARTICLE GRADATION CURVE (BH-1)
These are software generated curve
1449-R2-Nalanda University
T E C H P R O ENGINEERS PVT. LTD.
GRAPH 3
Note: - These are software generated curve
144932
APPENDIX ‘D’ GRAPH 3: PARTICLE GRADATION CURVE (BH-2)
These are software generated curve
1449-R2-Nalanda University
T E C H P R O ENGINEERS PVT. LTD.

GRAPH 4: PARTICLE GRADATION CURVE (BH
Note: - These are software generated curve
144933
APPENDIX ‘D’ GRAPH 4: PARTICLE GRADATION CURVE (BH-2)
These are software generated curve
1449-R2-Nalanda University
T E C H P R O ENGINEERS PVT. LTD.

GRAPH
Note: - These are software generated curve
144934
APPENDIX ‘D’ GRAPH 5: PARTICLE GRADATION CURVE (BH-3)
These are software generated curve
1449-R2-Nalanda University
T E C H P R O ENGINEERS PVT. LTD.

GRAPH
Note: - These are software generated curve
144935
APPENDIX ‘D’ GRAPH 6: PARTICLE GRADATION CURVE (BH-3)
These are software generated curve
1449-R2-Nalanda University
T E C H P R O ENGINEERS PVT. LTD.

GRAPH
Note: - These are software generated curve
144936
APPENDIX ‘D’ GRAPH 7: PARTICLE GRADATION CURVE (BH-4)
These are software generated curve
1449-R2-Nalanda University
T E C H P R O ENGINEERS PVT. LTD.

GRAPH
Note: - These are software generated curve
144937
APPENDIX ‘D’ GRAPH 8: PARTICLE GRADATION CURVE (BH-4)
These are software generated curve
1449-R2-Nalanda University
T E C H P R O ENGINEERS PVT. LTD.

GRAPH
Note: - These are software generated curve
144938
APPENDIX ‘D’ GRAPH 9: PARTICLE GRADATION CURVE (BH-5)
software generated curve
1449-R2-Nalanda University
T E C H P R O ENGINEERS PVT. LTD.

GRAPH 10: PARTICLE GRADATION CURVE (BH
Note: - These are software generated curve
144939
APPENDIX ‘D’ GRAPH 10: PARTICLE GRADATION CURVE (BH-5)
These are software generated curve
1449-R2-Nalanda University
T E C H P R O ENGINEERS PVT. LTD.

1449-R2-Nalanda University
T E C H P R O ENGINEERS PVT. LTD.
40
APPENDIX ‘D’
CALCULATIONS AND RESULTS
Looking at the site condition, sub soil stratification and type of proposed structure, calculations
have been done for both shallow footings and deep foundation.
1. SHALLOW FOUNDATION:
The safe allowable bearing capacity of the foundation for the
proposed building structures has been calculated on the shear failure criteria suggested as per IS
6403-1981, IS: 1904-1978: Settlement Criteria as per IS: 8009 (part-I)-1976 and Design of Pile
foundations as per IS 2911(Part 1/Sec 2) 2010.
1.1 SHEAR FAILURE CRITERIA:
Based on C-φφφφ values:
Type of shear failure = Mixed
(Interpolation in between General and
Local shear failure)
Factor of safety (F.S.) = 3.00
Depth of critical water table = 0.00 meter
Net allowable bearing capacity: = qna (kN/m2)
qna = (1 / F.S.) [0.667c Nc Sc dc + q (Nq - 1) Sq dq + 0.5 B γ Nγ Sγ dγW’]
Where,
B = Width of foundation (metre)
D = Depth of foundation (metre)
φ = Angle of shearing resistance (degree)
c = Cohesion intercept (kN/m2)
γ = Bulk density of soil above the base of footing (kN/m3)
q = Effective overburden (kN/m2)
Nc, Nq, Nγ = Bearing capacity coefficient based on initial void ratio e0
dc, dq, dγ = depth factors
W’ = Water table correction factor
1449-R2-Nalanda University
T E C H P R O ENGINEERS PVT. LTD.
41
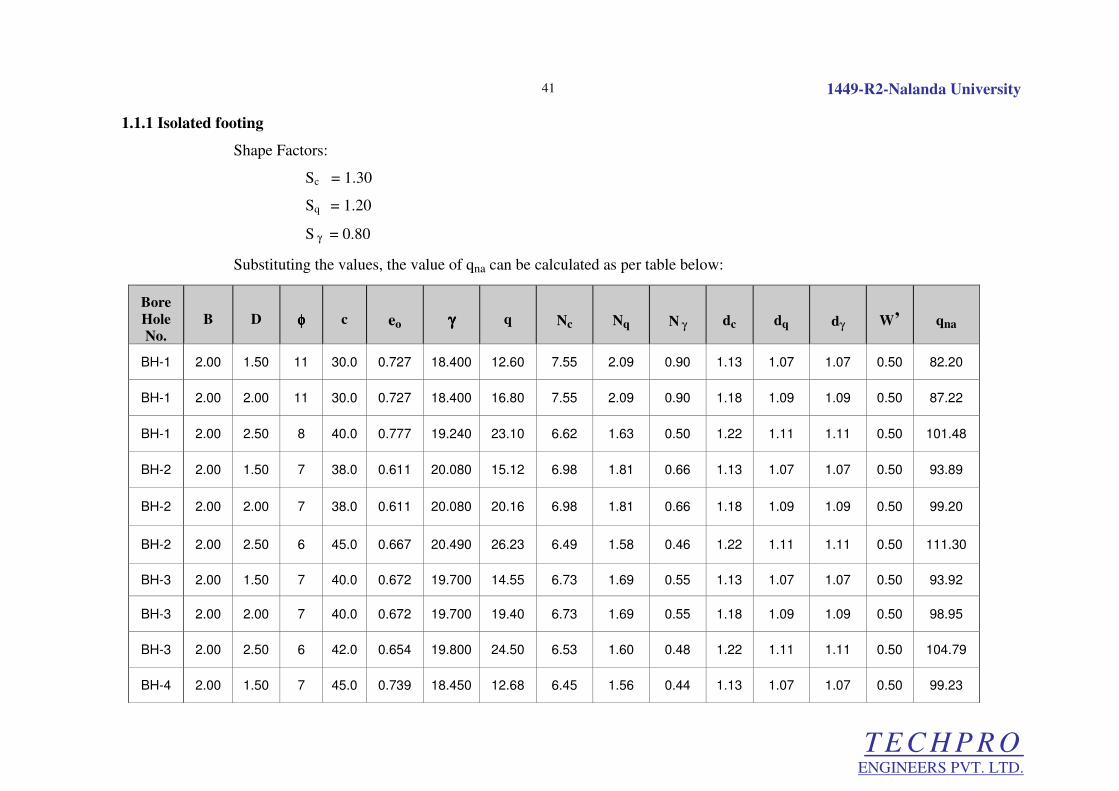
1.1.1 Isolated footing
Shape Factors:
Sc = 1.30
Sq = 1.20
S γ = 0.80
Substituting the values, the value of qna can be calculated as per table below:
Bore
Hole
No.
B D φφφφ c eo γγγγ q Nc Nq N γ dc dq dγ W’ qna
BH-1 2.00 1.50 11 30.0 0.727 18.400 12.60 7.55 2.09 0.90 1.13 1.07 1.07 0.50 82.20
BH-1 2.00 2.00 11 30.0 0.727 18.400 16.80 7.55 2.09 0.90 1.18 1.09 1.09 0.50 87.22
BH-1 2.00 2.50 8 40.0 0.777 19.240 23.10 6.62 1.63 0.50 1.22 1.11 1.11 0.50 101.48
BH-2 2.00 1.50 7 38.0 0.611 20.080 15.12 6.98 1.81 0.66 1.13 1.07 1.07 0.50 93.89
BH-2 2.00 2.00 7 38.0 0.611 20.080 20.16 6.98 1.81 0.66 1.18 1.09 1.09 0.50 99.20
BH-2 2.00 2.50 6 45.0 0.667 20.490 26.23 6.49 1.58 0.46 1.22 1.11 1.11 0.50 111.30
BH-3 2.00 1.50 7 40.0 0.672 19.700 14.55 6.73 1.69 0.55 1.13 1.07 1.07 0.50 93.92
BH-3 2.00 2.00 7 40.0 0.672 19.700 19.40 6.73 1.69 0.55 1.18 1.09 1.09 0.50 98.95
BH-3 2.00 2.50 6 42.0 0.654 19.800 24.50 6.53 1.60 0.48 1.22 1.11 1.11 0.50 104.79
BH-4 2.00 1.50 7 45.0 0.739 18.450 12.68 6.45 1.56 0.44 1.13 1.07 1.07 0.50 99.23

1449-R2-Nalanda University
T E C H P R O ENGINEERS PVT. LTD.
42
Bore
Hole
No.
B D φφφφ c eo γγγγ q Nc Nq N γ dc dq dγ W’ qna
BH-4 2.00 2.00 7 45.0 0.739 18.450 16.90 6.45 1.56 0.44 1.18 1.09 1.09 0.50 104.08
BH-4 2.00 2.50 9 41.0 0.733 19.370 23.43 6.97 1.80 0.65 1.22 1.11 1.11 0.50 110.95
BH-5 2.00 1.50 10 35.0 0.712 19.100 13.65 7.36 1.99 0.81 1.13 1.07 1.07 0.50 92.15
BH-5 2.00 2.00 10 35.0 0.712 19.100 18.20 7.36 1.99 0.81 1.18 1.09 1.09 0.50 97.54
BH-5 2.00 2.50 10 35.0 0.679 19.210 23.03 7.56 2.09 0.89 1.22 1.11 1.11 0.50 106.81
1.1.2 Strip footing:
Shape Factors:
Sc = 1.00
Sq = 1.00
S γ = 1.00
Substituting the values, the value of qna can be calculated as per table below
Bore
Hole
No.
B D φφφφ c eo γγγγ q Nc Nq N γ dc dq dγ W’ qna
BH-1 1.50 1.00 11 30.0 0.727 18.400 8.40 7.55 2.09 0.90 1.12 1.06 1.06 0.50 61.61
BH-1 1.50 1.25 11 30.0 0.727 18.400 10.50 7.55 2.09 0.90 1.15 1.07 1.07 0.50 63.97
BH-1 1.50 1.50 11 30.0 0.727 18.400 12.60 7.55 2.09 0.90 1.18 1.09 1.09 0.50 66.35

1449-R2-Nalanda University
T E C H P R O ENGINEERS PVT. LTD.
43
Bore
Hole
No.
B D φφφφ c eo γγγγ q Nc Nq N γ dc dq dγ W’ qna
BH-2 1.50 1.00 7 38.0 0.611 20.080 10.08 6.98 1.81 0.66 1.12 1.06 1.06 0.50 70.52
BH-2 1.50 1.25 7 38.0 0.611 20.080 12.60 6.98 1.81 0.66 1.15 1.07 1.07 0.50 73.06
BH-2 1.50 1.50 7 38.0 0.611 20.080 15.12 6.98 1.81 0.66 1.18 1.09 1.09 0.50 75.61
BH-3 1.50 1.00 7 40.0 0.672 19.700 9.70 6.73 1.69 0.55 1.12 1.06 1.06 0.50 70.68
BH-3 1.50 1.25 7 40.0 0.672 19.700 12.13 6.73 1.69 0.55 1.15 1.07 1.07 0.50 73.10
BH-3 1.50 1.50 7 40.0 0.672 19.700 14.55 6.73 1.69 0.55 1.18 1.09 1.09 0.50 75.54
BH-4 1.50 1.00 7 45.0 0.739 18.450 8.45 6.45 1.56 0.44 1.12 1.06 1.06 0.50 74.90
BH-4 1.50 1.25 7 45.0 0.739 18.450 10.56 6.45 1.56 0.44 1.15 1.07 1.07 0.50 77.28
BH-4 1.50 1.50 7 45.0 0.739 18.450 12.68 6.45 1.56 0.44 1.18 1.09 1.09 0.50 79.67
BH-5 1.50 1.00 10 35.0 0.712 19.100 9.10 7.36 1.99 0.81 1.12 1.06 1.06 0.50 69.15
BH-5 1.50 1.25 10 35.0 0.712 19.100 11.38 7.36 1.99 0.81 1.15 1.07 1.07 0.50 71.70
BH-5 1.50 1.50 10 35.0 0.712 19.100 13.65 7.36 1.99 0.81 1.18 1.09 1.09 0.50 74.28
1.1.3 Raft Foundation:
Shape Factors:

1449-R2-Nalanda University
T E C H P R O ENGINEERS PVT. LTD.
44
Sc = 1.00
Sq = 1.00
S γ = 1.00
Substituting the values, the value of qna can be calculated as per table below:
Bore
Hole
No.
B D φφφφ c eo γγγγ q Nc Nq N γ dc dq dγ W’ qna
BH-1 10.00 1.50 11 30.0 0.727 18.400 12.60 7.55 2.09 0.90 1.03 1.01 1.01 0.50 84.24
BH-1 10.00 2.00 11 30.0 0.727 18.400 16.80 7.55 2.09 0.90 1.04 1.02 1.02 0.50 86.72
BH-1 10.00 2.50 8 40.0 0.777 19.240 23.10 6.62 1.63 0.50 1.04 1.02 1.02 0.50 89.67
BH-2 10.00 1.50 7 38.0 0.611 20.080 15.12 6.98 1.81 0.66 1.03 1.01 1.01 0.50 90.91
BH-2 10.00 2.00 7 38.0 0.611 20.080 20.16 6.98 1.81 0.66 1.04 1.02 1.02 0.50 93.27
BH-2 10.00 2.50 6 45.0 0.667 20.490 26.23 6.49 1.58 0.46 1.04 1.02 1.02 0.50 97.20
BH-3 10.00 1.50 7 40.0 0.672 19.700 14.55 6.73 1.69 0.55 1.03 1.01 1.01 0.50 88.76
BH-3 10.00 2.00 7 40.0 0.672 19.700 19.40 6.73 1.69 0.55 1.04 1.02 1.02 0.50 90.83
BH-3 10.00 2.50 6 42.0 0.654 19.800 24.50 6.53 1.60 0.48 1.04 1.02 1.02 0.50 92.04
BH-4 10.00 1.50 7 45.0 0.739 18.450 12.68 6.45 1.56 0.44 1.03 1.01 1.01 0.50 90.54
BH-4 10.00 2.00 7 45.0 0.739 18.450 16.90 6.45 1.56 0.44 1.04 1.02 1.02 0.50 92.24

1449-R2-Nalanda University
T E C H P R O ENGINEERS PVT. LTD.
45
Bore
Hole
No.
B D φφφφ c eo γγγγ q Nc Nq N γ dc dq dγ W’ qna
BH-4 10.00 2.50 9 41.0 0.733 19.370 23.43 6.97 1.80 0.65 1.04 1.02 1.02 0.50 100.02
BH-5 10.00 1.50 10 35.0 0.712 19.100 13.65 7.36 1.99 0.81 1.03 1.01 1.01 0.50 91.61
BH-5 10.00 2.00 10 35.0 0.712 19.100 18.20 7.36 1.99 0.81 1.04 1.02 1.02 0.50 94.13
BH-5 10.00 2.50 10 35.0 0.679 19.210 23.03 7.56 2.09 0.89 1.04 1.02 1.02 0.50 101.40

1449-R2-Nalanda University
T E C H P R O ENGINEERS PVT. LTD.
46
1.2 SETTLEMENT CRITERIA:
Settlement of the soil layer below the base of footing is given by;
Si = [{Ht/(1 + e0) }Cc log10 {(p0 + ∆p)/p0}]
Where
z = Mid depth of clay layer considered (metre)
p0 = Effective overburden at depth z (kN/m2)
e0 = Void ratio at depth z corresponding to p0
∆p = Pressure increment (kN/m2) = (IB x q)
IB = Boussinesq coefficient
Cc = Compression Index
Ht = Thickness of clay layer considered (mm)
St = Total settlement of all layers
Final corrected settlement:
S = λ. Df . Si. Rf
λ = Field settlement correction factor = 0.70
Df = Depth factor
qs = Safe bearing pressure (kN/m2)
Rf = Rigidity factor = 1.00 for Isolated and strip footings and 0.8 for Raft
The settlement of various footing at different depth and base width can be calculated as per
the following table:

1449-R2-Nalanda University
T E C H P R O ENGINEERS PVT. LTD.
47
1.2.1 Isolated Footing:
BORE NO.
B L D Qna LAYER Ht z γγγγ p0 e0 Cc Ib ∆∆∆∆p Si Df S
BH-1 2.00 2.00 1.50 82.20 1.50 4.50 3000 3.00 10.00 30.00 0.777 0.135 0.180 14.80 40 0.770 21
BH-1 2.00 2.00 2.00 87.22 2.00 5.00 3000 3.50 10.00 35.00 0.777 0.135 0.180 15.70 37 0.740 19
BH-1 2.00 2.00 2.50 101.48 2.50 5.50 3000 4.00 10.00 40.00 0.777 0.135 0.180 18.27 37 0.720 19
BH-2 2.00 2.00 1.50 93.89 1.50 4.50 3000 3.00 10.00 30.00 0.667 0.140 0.180 16.90 49 0.770 26
BH-2 2.00 2.00 2.00 99.20 2.00 5.00 3000 3.50 10.00 35.00 0.667 0.140 0.180 17.86 45 0.740 23
BH-2 2.00 2.00 2.50 111.30 2.50 5.50 3000 4.00 10.00 40.00 0.667 0.140 0.180 20.03 44 0.720 22
BH-3 2.00 2.00 1.50 93.92 1.50 4.50 3000 3.00 10.00 30.00 0.654 0.122 0.180 16.91 43 0.770 23
BH-3 2.00 2.00 2.00 98.95 2.00 5.00 3000 3.50 10.00 35.00 0.654 0.122 0.180 17.81 40 0.740 20
BH-3 2.00 2.00 2.50 104.79 2.50 5.50 3000 4.00 10.00 40.00 0.654 0.122 0.180 18.86 37 0.720 19
BH-4 2.00 2.00 1.50 99.23 1.50 4.50 3000 3.00 10.00 30.00 0.733 0.120 0.180 17.86 42 0.770 23
BH-4 2.00 2.00 2.00 104.08 2.00 5.00 3000 3.50 10.00 35.00 0.733 0.120 0.180 18.73 39 0.740 20
BH-4 2.00 2.00 2.50 110.95 2.50 5.50 3000 4.00 10.00 40.00 0.733 0.120 0.180 19.97 37 0.720 18
BH-5 2.00 2.00 1.50 92.15 1.50 4.50 3000 3.00 10.00 30.00 0.679 0.118 0.180 16.59 40 0.770 22
BH-5 2.00 2.00 2.00 97.54 2.00 5.00 3000 3.50 10.00 35.00 0.679 0.118 0.180 17.56 37 0.740 19
BH-5 2.00 2.00 2.50 106.81 2.50 5.50 3000 4.00 10.00 40.00 0.679 0.118 0.180 19.23 36 0.720 18

1449-R2-Nalanda University
T E C H P R O ENGINEERS PVT. LTD.
48
1.2.2 Strip Footing:
BORE NO.
B L D Qna LAYER Ht z γγγγ p0 e0 Cc Ib ∆∆∆∆p Si Df S
BH-1 1.50 1.50 1.00 61.61 1.00 3.25 2250 2.13 10.00 21.25 0.727 0.120 0.460 28.34 58 0.670 27
BH-1 1.50 1.50 1.25 63.97 1.25 3.50 2250 2.38 10.00 23.75 0.727 0.120 0.460 29.43 55 0.640 25
BH-1 1.50 1.50 1.50 66.35 1.50 3.75 2250 2.63 10.00 26.25 0.777 0.135 0.460 30.52 57 0.630 25
BH-2 1.50 1.50 1.00 70.52 1.00 3.25 2250 2.13 10.00 21.25 0.611 0.120 0.460 32.44 67 0.670 32
BH-2 1.50 1.50 1.25 73.06 1.25 3.50 2250 2.38 10.00 23.75 0.611 0.120 0.460 33.61 64 0.640 29
BH-2 1.50 1.50 1.50 75.61 1.50 3.75 2250 2.63 10.00 26.25 0.667 0.140 0.460 34.78 69 0.630 31
BH-3 1.50 1.50 1.00 70.68 1.00 3.25 2250 2.13 10.00 21.25 0.672 0.120 0.460 32.51 65 0.670 31
BH-3 1.50 1.50 1.25 73.10 1.25 3.50 2250 2.38 10.00 23.75 0.672 0.120 0.460 33.63 62 0.640 28
BH-3 1.50 1.50 1.50 75.54 1.50 3.75 2250 2.63 10.00 26.25 0.611 0.115 0.460 34.75 59 0.630 26
BH-4 1.50 1.50 1.00 74.90 1.00 3.25 2250 2.13 10.00 21.25 0.739 0.135 0.460 34.46 73 0.670 34
BH-4 1.50 1.50 1.25 77.28 1.25 3.50 2250 2.38 10.00 23.75 0.739 0.135 0.460 35.55 69 0.640 31
BH-4 1.50 1.50 1.50 79.67 1.50 3.75 2250 2.63 10.00 26.25 0.733 0.120 0.460 36.65 59 0.630 26
BH-5 1.50 1.50 1.00 69.15 1.00 3.25 2250 2.13 10.00 21.25 0.712 0.120 0.460 31.81 63 0.670 29
BH-5 1.50 1.50 1.25 71.70 1.25 3.50 2250 2.38 10.00 23.75 0.712 0.120 0.460 32.98 60 0.640 27
BH-5 1.50 1.50 1.50 74.28 1.50 3.75 2250 2.63 10.00 26.25 0.670 0.118 0.460 34.17 58 0.630 25

1449-R2-Nalanda University
T E C H P R O ENGINEERS PVT. LTD.
49
1.2.3 Raft Foundations:
BORE NO.
B L D Qna LAYER Ht z γγγγ p0 e0 Cc Ib ∆∆∆∆p Si Df S St
BH1 10.00 10.00 1.50 73.00 1.50 3.50 2000 2.50 10.00 25.00 0.778 0.135 0.780 56.94 78 0.970 43
BH1 10.00 10.00 1.50 73.00 3.50 6.50 3000 5.00 10.00 50.00 0.619 0.125 0.590 43.07 63 0.970 34
BH1 10.00 10.00 1.50 73.00 6.50 9.50 3000 8.00 10.00 80.00 0.612 0.122 0.340 24.82 27 0.970 14
BH1 10.00 10.00 1.50 73.00 9.50 12.50 3000 11.00 10.00 110.00 0.588 0.110 0.180 13.14 10 0.970 6
BH1 10.00 10.00 1.50 73.00 12.50 15.50 3000 14.00 10.00 140.00 0.574 0.105 0.100 7.30 4 0.970 2
BH1 10.00 10.00 1.50 73.00 15.50 18.50 3000 17.00 10.00 170.00 0.569 0.107 0.050 3.65 2 0.970 1 100
BH1 10.00 10.00 2.00 86.72 2.00 3.50 1500 2.75 10.00 27.50 0.778 0.135 0.780 67.65 61 0.970 33
BH1 10.00 10.00 2.00 86.72 3.50 6.50 3000 5.00 10.00 50.00 0.619 0.125 0.590 51.17 71 0.970 39
BH1 10.00 10.00 2.00 86.72 6.50 9.50 3000 8.00 10.00 80.00 0.612 0.122 0.340 29.49 31 0.970 17
BH1 10.00 10.00 2.00 86.72 9.50 12.50 3000 11.00 10.00 110.00 0.588 0.110 0.180 15.61 12 0.970 7
BH1 10.00 10.00 2.00 86.72 12.50 15.50 3000 14.00 10.00 140.00 0.574 0.105 0.100 8.67 5 0.970 3
BH1 10.00 10.00 2.00 86.72 15.50 18.50 3000 17.00 10.00 170.00 0.569 0.107 0.050 4.34 2 0.970 1 99
BH1 10.00 10.00 2.50 89.67 2.50 3.50 1000 3.00 10.00 30.00 0.778 0.135 0.780 69.95 40 0.970 22
BH1 10.00 10.00 2.50 89.67 3.50 6.50 3000 5.00 10.00 50.00 0.619 0.125 0.590 52.91 73 0.970 39

1449-R2-Nalanda University
T E C H P R O ENGINEERS PVT. LTD.
50
BORE NO.
B L D Qna LAYER Ht z γγγγ p0 e0 Cc Ib ∆∆∆∆p Si Df S St
BH1 10.00 10.00 2.50 89.67 6.50 9.50 3000 8.00 10.00 80.00 0.612 0.122 0.340 30.49 32 0.970 17
BH1 10.00 10.00 2.50 89.67 9.50 12.50 3000 11.00 10.00 110.00 0.588 0.110 0.180 16.14 12 0.970 7
BH1 10.00 10.00 2.50 89.67 12.50 15.50 3000 14.00 10.00 140.00 0.574 0.105 0.100 8.97 5 0.970 3
BH1 10.00 10.00 2.50 89.67 15.50 18.50 3000 17.00 10.00 170.00 0.569 0.107 0.050 4.48 2 0.970 1 89

1449-R2-Nalanda University
T E C H P R O ENGINEERS PVT. LTD.
51
2. DEEP FOUNDATION:
2.1 PILE LOAD CAPACITY IN COMPRESSION & UPLIFT:
Calculations have been made for cast-in-situ bored RCC piles as per IS 2911 (part-1,
section -2)-2010.
2.1.1 Design parameter for pile:
Material : RCC
Type : Cast-in-situ bored pile
Diameter : 0.45 metre
Length : 15.00 meter
Cut off length : 2.00 meter
2.1.2 Design parameter of soils:
Coefficient of earth pressure Ka = 1.00
Max. Depth for overburden = 15 x Dia.
Factor of safety (FS) = 2.50
Critical Depth of water table = 0.00 meter
2.1.3 Notations and symbols:
Quc = Ultimate load carrying capacity of pile in compression (kN)
Qut = Ultimate load carrying capacity of pile in Uplift (kN)
Qac = Net allowable load capacity of the pile in compression (kN)
Qat = Net allowable load capacity of the pile in Uplift (kN)
Qb = Ultimate bearing capacity in End Bearing resistance (kN)
Qf = Ultimate bearing capacity in stem friction (kN)
Qc = Ultimate bearing capacity in cohesion (kN)
Qw = Gross weight of pile (kN)
1449-R2-Nalanda University
T E C H P R O ENGINEERS PVT. LTD.
52
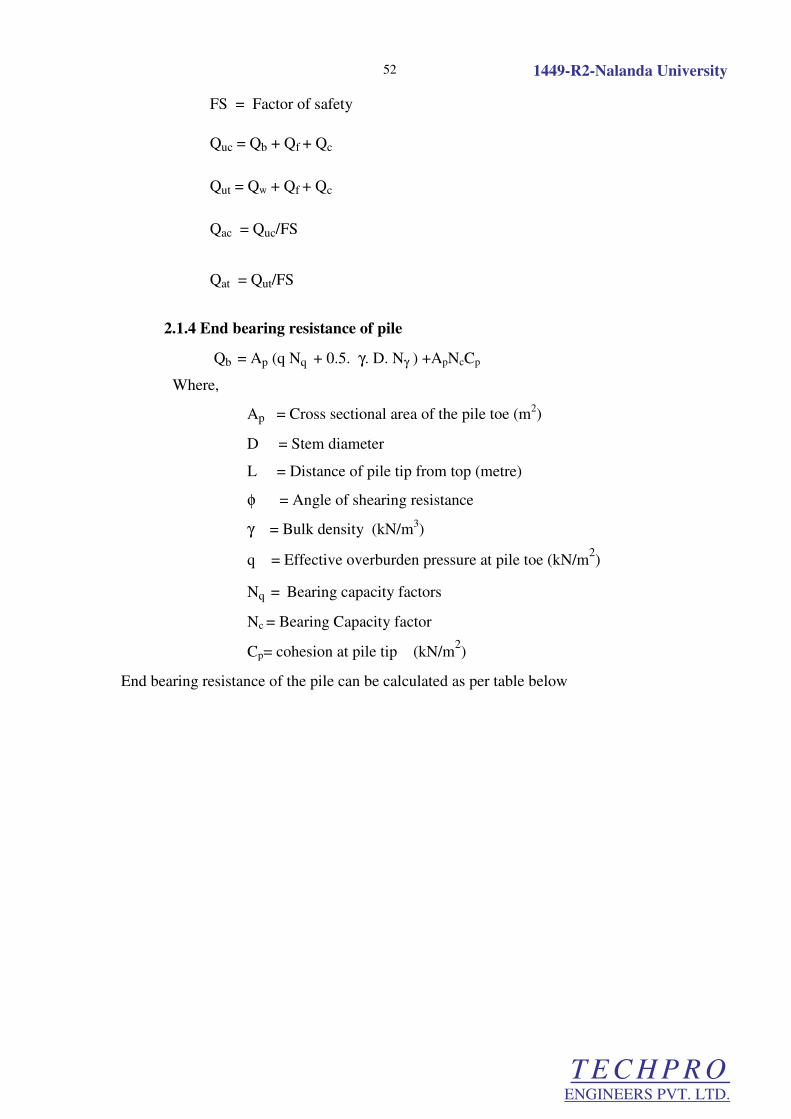
FS = Factor of safety
Quc = Qb + Qf + Qc
Qut = Qw + Qf + Qc
Qac = Quc/FS
Qat = Qut/FS
2.1.4 End bearing resistance of pile
Qb = Ap (q Nq + 0.5. γ. D. Nγ ) +ApNcCp
Where,
Ap = Cross sectional area of the pile toe (m2)
D = Stem diameter
L = Distance of pile tip from top (metre)
φ = Angle of shearing resistance
γ = Bulk density (kN/m3)
q = Effective overburden pressure at pile toe (kN/m2)
Nq = Bearing capacity factors
Nc = Bearing Capacity factor
Cp= cohesion at pile tip (kN/m2)
End bearing resistance of the pile can be calculated as per table below

1449-R2-Nalanda University
T E C H P R O ENGINEERS PVT. LTD.
53
Bore
No.
D (m) L (m) Pile
Length
Ap φ γ2 Nq Ny
CP q Qb
BH-1 0.45 17.00 15.00 0.1591 16.00 19.50 4.43 3.20 20.00 64.80 75.42
BH-2 0.45 17.00 15.00 0.1591 16.00 20.37 4.43 3.20 29.00 67.84 90.55
BH-3 0.45 17.00 15.00 0.1591 18.00 21.72 5.42 4.29 35.00 74.93 116.49
BH-4 0.45 17.00 15.00 0.1591 15.00 19.68 3.94 2.65 20.00 62.10 68.49
BH-5 0.45 17.00 15.00 0.1591 18.00 21.99 5.42 4.29 16.00 74.93 89.32
2.1.5 Frictional resistance along the stem of pile
Qf = ∑ Ki. qi. tan δi. Asi
Where,
∑ = Sum of frictional resistance of all layers considered
Ki = Coefficient of earth pressure
qi = Effective overburden pressure in KN/m2 at mid depth of i
th layer
δi = Angle of wall friction between pile and soil of ith
layer
(Taken equal to φ)
Asi = Surface area of pile stem in ith
layer
The frictional resistance of pile stem can be calculated as per the table below

1449-R2-Nalanda University
T E C H P R O ENGINEERS PVT. LTD.
54
Bore
Hole
No.
Layer (m) Mean
Depth
(m)
Length Cumulative
length γ1 γ2 qi Asi φ δi Ki Qi ∑ Qi
BH-1
2.00 5.00 3.50 3.00 3.00 19.24 9.24 32.34 4.24 8.00 8.00 1.50 28.93 28.93
5.00 8.00 6.50 3.00 6.00 20.10 10.10 62.64 4.24 9.00 9.00 1.50 63.14 92.07
8.00 11.00 9.50 3.00 9.00 19.40 9.40 62.64 4.24 10.00 10.00 1.50 70.29 162.36
11.00 14.00 12.50 3.00 12.00 19.68 9.68 62.64 4.24 13.00 13.00 1.50 92.04 254.40
14.00 17.00 15.50 3.00 15.00 19.48 9.48 62.64 4.24 18.00 18.00 1.50 129.53 383.93
BH-2
2.00 5.00 3.50 3.00 3.00 20.49 10.49 36.72 4.24 6.00 6.00 1.50 24.56 24.56
5.00 8.00 6.50 3.00 6.00 18.84 8.84 63.24 4.24 24.00 24.00 1.50 179.18 203.74
8.00 11.00 9.50 3.00 9.00 20.52 10.52 63.24 4.24 18.00 18.00 1.50 130.76 334.50
11.00 14.00 12.50 3.00 12.00 20.33 10.33 63.24 4.24 14.00 14.00 1.50 100.34 434.84
14.00 17.00 15.50 3.00 15.00 20.11 10.11 63.24 4.24 20.00 20.00 1.50 146.48 581.32
BH-3
2.00 5.00 3.50 3.00 3.00 19.80 9.80 34.30 4.24 6.00 6.00 1.50 22.94 22.94
5.00 8.00 6.50 3.00 6.00 20.10 10.10 64.60 4.24 16.00 16.00 1.50 117.89 140.83
8.00 11.00 9.50 3.00 9.00 21.29 11.29 64.60 4.24 12.00 12.00 1.50 87.39 228.22
11.00 14.00 12.50 3.00 12.00 21.51 11.51 64.60 4.24 20.00 20.00 1.50 149.64 377.86
14.00 17.00 15.50 3.00 15.00 21.47 11.47 64.60 4.24 14.00 14.00 1.50 102.51 480.37
BH-4 2.00 5.00 3.50 3.00 3.00 19.37 9.37 32.80 4.24 9.00 9.00 1.50 33.06 33.06
5.00 8.00 6.50 3.00 6.00 18.95 8.95 59.65 4.24 11.00 11.00 1.50 73.79 106.84

1449-R2-Nalanda University
T E C H P R O ENGINEERS PVT. LTD.
55
Bore
Hole
No.
Layer (m) Mean
Depth
(m)
Length Cumulative
length γ1 γ2 qi Asi φ δi Ki Qi ∑ Qi
8.00 11.00 9.50 3.00 9.00 19.45 9.45 59.65 4.24 12.00 12.00 1.50 80.69 187.53
11.00 14.00 12.50 3.00 12.00 19.46 9.46 59.65 4.24 11.00 11.00 1.50 73.79 261.32
14.00 17.00 15.50 3.00 15.00 19.81 9.81 59.65 4.24 12.00 12.00 1.50 80.69 342.00
BH-5
2.00 5.00 3.50 3.00 3.00 19.21 9.21 32.24 4.24 10.00 10.00 1.50 36.17 36.17
5.00 8.00 6.50 3.00 6.00 19.74 9.74 61.46 4.24 16.00 16.00 1.50 112.15 148.33
8.00 11.00 9.50 3.00 9.00 22.06 12.06 61.46 4.24 15.00 15.00 1.50 104.80 253.12
11.00 14.00 12.50 3.00 12.00 21.50 11.50 61.46 4.24 13.00 13.00 1.50 90.30 343.42
14.00 17.00 15.50 3.00 15.00 21.57 11.57 61.46 4.24 16.00 16.00 1.50 112.15 455.57
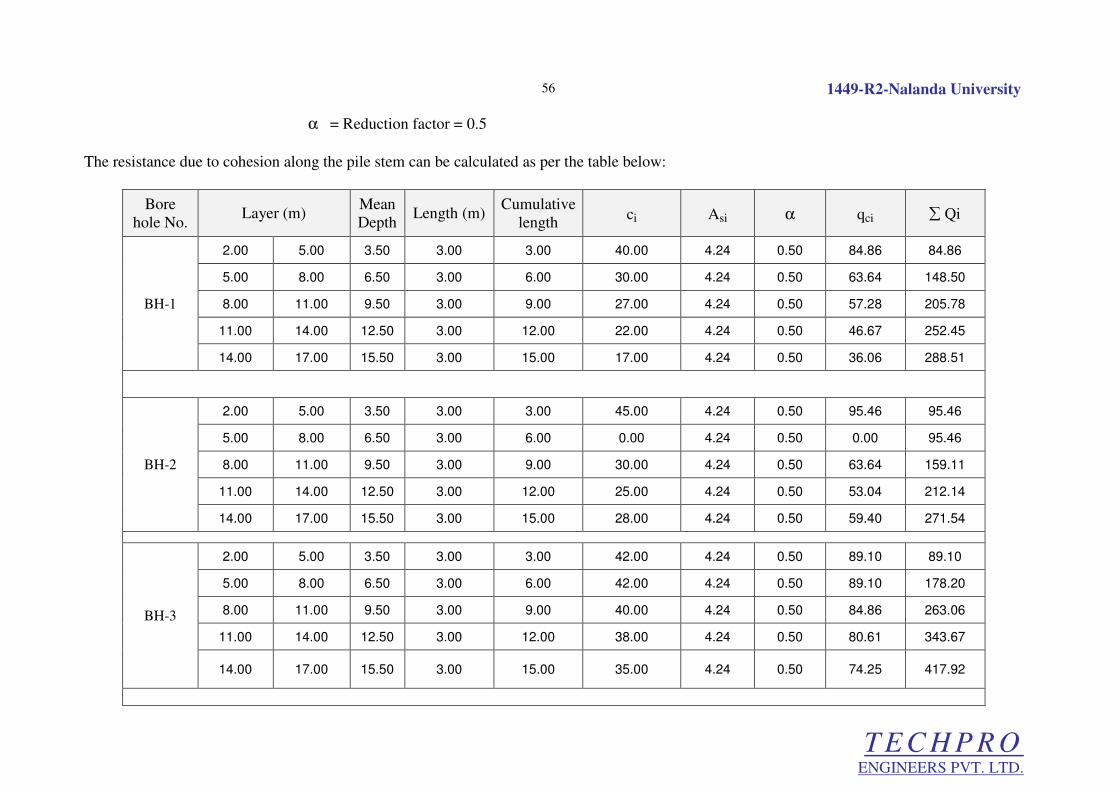
2.1.6 Cohesion along the stem of pile
Qc = ∑ ci. Asi. α
Where,
∑ = Sum of frictional resistance of all layers considered
ci = Average cohesion in ith
layer
Asi = Surface area of pile stem in ith
layer
1449-R2-Nalanda University
T E C H P R O ENGINEERS PVT. LTD.
56
α = Reduction factor = 0.5
The resistance due to cohesion along the pile stem can be calculated as per the table below:
Bore
hole No. Layer (m)
Mean
Depth Length (m)
Cumulative
length ci Asi α qci ∑ Qi
BH-1
2.00 5.00 3.50 3.00 3.00 40.00 4.24 0.50 84.86 84.86
5.00 8.00 6.50 3.00 6.00 30.00 4.24 0.50 63.64 148.50
8.00 11.00 9.50 3.00 9.00 27.00 4.24 0.50 57.28 205.78
11.00 14.00 12.50 3.00 12.00 22.00 4.24 0.50 46.67 252.45
14.00 17.00 15.50 3.00 15.00 17.00 4.24 0.50 36.06 288.51
BH-2
2.00 5.00 3.50 3.00 3.00 45.00 4.24 0.50 95.46 95.46
5.00 8.00 6.50 3.00 6.00 0.00 4.24 0.50 0.00 95.46
8.00 11.00 9.50 3.00 9.00 30.00 4.24 0.50 63.64 159.11
11.00 14.00 12.50 3.00 12.00 25.00 4.24 0.50 53.04 212.14
14.00 17.00 15.50 3.00 15.00 28.00 4.24 0.50 59.40 271.54
BH-3
2.00 5.00 3.50 3.00 3.00 42.00 4.24 0.50 89.10 89.10
5.00 8.00 6.50 3.00 6.00 42.00 4.24 0.50 89.10 178.20
8.00 11.00 9.50 3.00 9.00 40.00 4.24 0.50 84.86 263.06
11.00 14.00 12.50 3.00 12.00 38.00 4.24 0.50 80.61 343.67
14.00 17.00 15.50 3.00 15.00 35.00 4.24 0.50 74.25 417.92

1449-R2-Nalanda University
T E C H P R O ENGINEERS PVT. LTD.
57
Bore
hole No. Layer (m)
Mean
Depth Length (m)
Cumulative
length ci Asi α qci ∑ Qi
BH-4
2.00 5.00 3.50 3.00 3.00 41.00 4.24 0.50 86.98 86.98
5.00 8.00 6.50 3.00 6.00 45.00 4.24 0.50 95.46 182.44
8.00 11.00 9.50 3.00 9.00 40.00 4.24 0.50 84.86 267.30
11.00 14.00 12.50 3.00 12.00 38.00 4.24 0.50 80.61 347.91
14.00 17.00 15.50 3.00 15.00 39.00 4.24 0.50 82.74 430.65
BH-5
2.00 5.00 3.50 3.00 3.00 35.00 4.24 0.50 74.25 74.25
5.00 8.00 6.50 3.00 6.00 28.00 4.24 0.50 59.40 133.65
8.00 11.00 9.50 3.00 9.00 26.00 4.24 0.50 55.16 188.81
11.00 14.00 12.50 3.00 12.00 29.00 4.24 0.50 61.52 250.33
14.00 17.00 15.50 3.00 15.00 20.00 4.24 0.50 42.43 292.76
2.1.7 Self weight of pile
Self weight of pile (Depth 15.00 metre) (Qw) = (π/4) x (0.45)2 x 15.00 x (25-10) = 35.80 kN

1449-R2-Nalanda University
T E C H P R O ENGINEERS PVT. LTD.
58
2.2 Lateral Load Capacity of Piles:
Factor T = 5∫ (EI/k1)
Where,
E= Modulus of elasticity of RCC in piles (kg/cm2 )
I = Moment of inertia of pile section = (π/64). D4
(cm4)
D = Diameter of pile (cm)
k1 = Coefficient based on soil properties (from Table 1 as IS 2911 (part-1, section -2)2010 = 0.500
Total embedded length of pile = L (cm)
Cantilever length of pile = L1 = 0.00 cm
For a Pile with fixed head,
Permissible deflection (y) = QLf3/12EI = 5 mm = 0.50 cm
Or, Ultimate lateral load capacity of pile (Q) = 6EI/ Lf3
(kg)
The values of lateral load capacities of piles have been computed as per the table below:
D
(cm)
L
(mm) E I T L1 L1/T Lf/T Lf
Q
(kg)
45 1500 250000 201186.91 158.677 0 0 2.18 345.92 7290.88
50 1500 250000 306640.63 172.6315 0 0 2.18 376.34 8629.62
60 1500 250000 635850.00 199.7399 0 0 2.18 435.43 11552.65
45 1800 250000 201186.91 158.677 0 0 2.18 345.92 7290.88
50 1800 250000 306640.63 172.6315 0 0 2.18 376.34 8629.62
60 1800 250000 635850.00 199.7399 0 0 2.18 435.43 11552.65
Values of lateral load capacities of piles of other length will remain same for the corresponding diameter.

1449-R2-Nalanda University
T E C H P R O ENGINEERS PVT. LTD.
59
APPENDIX ‘E’
COMPUTATIONS OF LIQUIFACTION POTENTIAL
Bore Hole No. : BH-1 Reference: "Semi-Emperical Procedures for Evaluating Liquefaction Potential During Earthquakes"
by I.M. Idriss and R.W. Boulanger (2004), Proceedings, 11th Int'l Conf. On Soil Dynamics & Earthquake Engg
Maximum Shear Stress at depth "h" during
earthquake τmax
= γh
amax g
where
γ = bulk density of soil γh = Total Overburden presure
h = depth
g = acceleration due to gravity
amax = peak ground acceleration
Since soil column acts as a deformable body, actual shear stress at depth h, (τmax)act is taken as
(τmax)act = rd γh
amax
g
rd = stress reduction factor, to be computed using the following correlation :
For z <= 34 m, Ln (rd) = α(z) + β(z) M
α(z) = -1.012 - 1.126 sin [(z/11.73) +5.133]
β(z) = 0.106+0.118 sin [(z/11.28) + 5.142]
For z > 34 m, rd = 0.12 e0.22M
Average equivalent uniform shear stress, τav = Cycic Stress Ratio =
τav = 0.65 rd γh
amax
g
Cyclic Stress Ratio, CSR =
τav
σv'
Depth of Water Table = 0.0
m
Depth, m Soil Classification
So
ilTyp
e*
C,G
or
H
De
nsity
T/m
3
From To
0.0 20.0 Silts C 1.90
* For "Soil Type", Enter : C (Cohesive soil), G (Granular soil) or H (Hard soils/Dense Sands/Rock) or F(Heterogeneous Fill)
Surcharge Load at Ground Level :
Nil
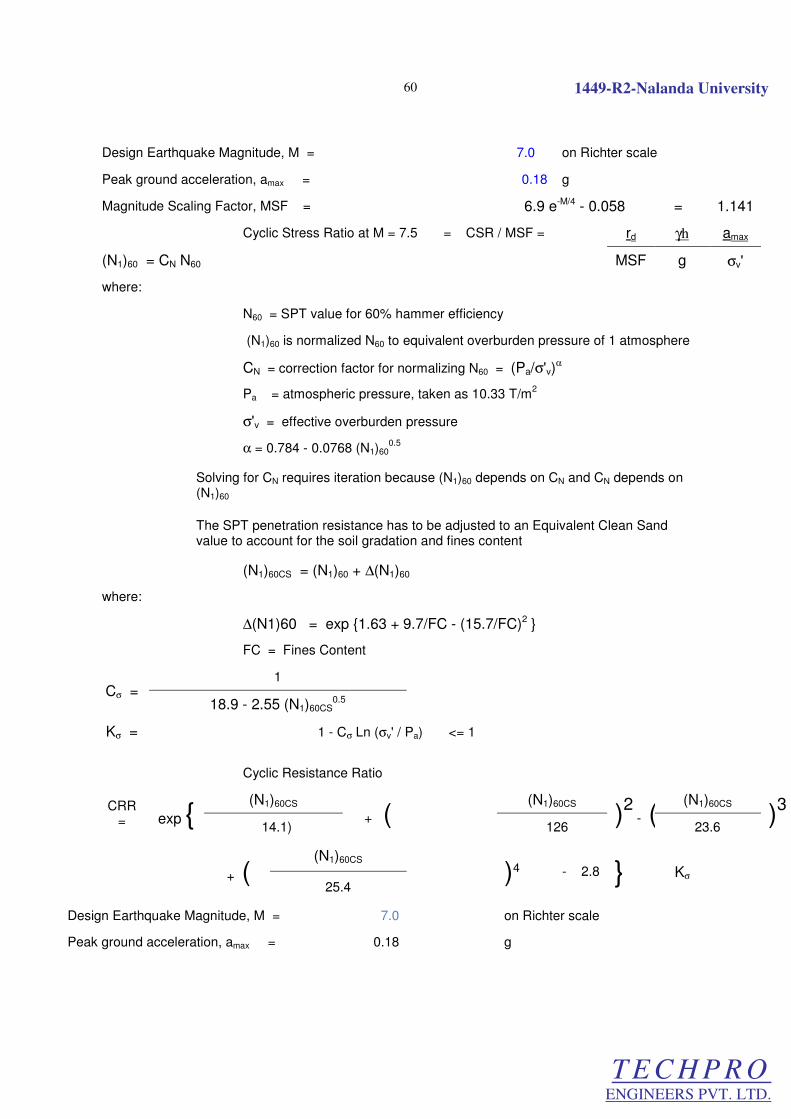
1449-R2-Nalanda University
T E C H P R O ENGINEERS PVT. LTD.
60
Design Earthquake Magnitude, M = 7.0 on Richter scale
Peak ground acceleration, amax = 0.18 g
Magnitude Scaling Factor, MSF = 6.9 e-M/4 - 0.058 = 1.141
Cyclic Stress Ratio at M = 7.5 = CSR / MSF = rd γh amax
(N1)60 = CN N60
MSF g σv'
where:
N60 = SPT value for 60% hammer efficiency
(N1)60 is normalized N60 to equivalent overburden pressure of 1 atmosphere
CN = correction factor for normalizing N60 = (Pa/σ'v)
α
Pa = atmospheric pressure, taken as 10.33 T/m
2
σ'v = effective overburden pressure
α = 0.784 - 0.0768 (N1)60
0.5
Solving for CN requires iteration because (N1)60 depends on CN and CN depends on (N1)60
The SPT penetration resistance has to be adjusted to an Equivalent Clean Sand value to account for the soil gradation and fines content
(N1)60CS = (N1)60 + ∆(N1)60
where:
∆(N1)60 = exp {1.63 + 9.7/FC - (15.7/FC)2 }
FC = Fines Content
Cσ = 1
18.9 - 2.55 (N1)60CS
0.5
Kσ =
1 - Cσ Ln (σv' / Pa) <= 1
Cyclic Resistance Ratio
CRR = exp {
(N1)60CS
+ (
(N1)60CS
)2 - (
(N1)60CS
)3
14.1) 126 23.6
+ (
(N1)60CS )4
- 2.8 } Kσ
25.4
Design Earthquake Magnitude, M = 7.0 on Richter scale
Peak ground acceleration, amax = 0.18 g

1449-R2-Nalanda University
T E C H P R O ENGINEERS PVT. LTD.
61
Dep
th m
Co
rre
cte
d N
Valu
e, N
60
Fin
es C
on
ten
t (F
C),
%
To
tal O
verb
urd
en
Pre
ssu
re,
σσ σσto
t, T
/m2
Eff
ecti
ve
Ove
rbu
rden
Pre
ssu
re,
σσ σσv',
T/m
2
CN αααα CN
(N1) 6
0
∆∆ ∆∆(N
1) 6
0 C
S
(N1) 6
0 C
S
1.95 6.379 87 3.71 1.76 1.700 0.565 1.700 8.13 5.523 13.66
3.45 9.214 89 6.56 3.11 1.700 0.480 1.700 15.66 5.5172 21.18
4.95 13.655 77 9.41 4.46 1.450 0.442 1.450 19.81 5.5533 25.36
6.45 15.262 83 12.26 5.81 1.291 0.443 1.291 19.70 5.535 25.24
7.95 19.751 90 15.11 7.16 1.165 0.416 1.165 23.01 5.5143 28.52
9.45 29.626 85 17.96 8.51 1.071 0.351 1.071 31.72 5.529 37.25
10.95 32.130 82 20.81 9.86 1.016 0.345 1.016 32.66 5.538 38.19
12.45 30.240 87 23.66 11.21 0.971 0.368 0.971 29.35 5.523 34.87
13.95 39.690 88 26.51 12.56 0.940 0.315 0.940 37.33 5.5201 42.85
15.45 42.525 80 29.36 13.91 0.913 0.305 0.913 38.84 5.5441 44.38
16.95 35.910 88 32.21 15.26 0.871 0.355 0.871 31.27 5.5201 36.79
18.45 39.690 86 35.06 16.61 0.852 0.337 0.852 33.82 5.526 39.34
19.95 53.865 88 37.91 17.96 0.866 0.259 0.866 46.67 5.5201 52.19
Values
computed by iterative process
Design Earthquake Magnitude, M = 7.0 on Richter scale
Peak ground acceleration, amax = 0.18 g
Dep
th m
So
il T
yp
e
rd
Cycli
c S
tres
s R
ati
o
Cycli
c S
tres
s R
ati
o,
at
M =
7.5
Facto
r o
f S
afe
ty
ag
ain
st
Liq
uefa
cti
on
Remarks
1.95 C 0.9871 0.244 0.2137 NA Cohesive Soil
3.45 C 0.9684 0.239 0.2096 NA Cohesive Soil
4.95 C 0.9472 0.234 0.205 NA Cohesive Soil
6.45 C 0.9238 0.228 0.2 NA Cohesive Soil
7.95 C 0.8988 0.222 0.1946 NA Cohesive Soil
9.45 C 0.8724 0.215 0.1889 NA Cohesive Soil

1449-R2-Nalanda University
T E C H P R O ENGINEERS PVT. LTD.
62
10.95 C 0.8453 0.209 0.183 NA Cohesive Soil
12.45 C 0.8179 0.202 0.177 NA Cohesive Soil
13.95 C 0.7904 0.195 0.1711 NA Cohesive Soil
15.45 C 0.7634 0.1886 0.1652 NA Cohesive Soil
16.95 C 0.7371 0.1821 0.1596 NA Cohesive Soil
18.45 C 0.7118 0.1758 0.1541 NA Cohesive Soil
19.95 C 0.6878 0.1699 0.1489 NA Cohesive Soil
In Granular soils / sands, If Factor of Safety < 1, Liquefiable
In Granular soils / sands, If Factor of Safety >= 1.0, No Liquefaction
End of report