genworth financial 2006 cost of care survey · genworth financial 2006 cost of care survey. letter...
TRANSCRIPT

M A R C H 2 0 0 6
Nursing Homes, Assisted Living Facilities and Home Care Providers
37522 03/27/06
GENWORTH FINANCIAL 2006 COST OF CARE SURVEY

L E T T E R F R O M B U C K S T I N S O N
While there is increasing awareness of long term care issues, and public policy in support of longterm care planning continues to evolve, too many Americans are still unprepared. The fact is, longterm care doesn’t become a real issue for most of us until it hits home.
We commissioned our first annual cost of care study in 2001. Since then, the study has receivedextensive recognition and earned an industry-wide reputation for reliability. It is the resourcefinancial professionals and consumers turn to when planning for long term care needs.
This year we contacted more than 9,000 nursing homes, assisted living facilities and home careproviders, with some significant conclusions. While rising costs on facilities have slowed,escalating home care costs outpaced the rate of inflation. The different types of home health aidssurveyed in our study show costs increasing to an average of $25.32 an hour—a 13% increaseover 2005 costs. The cost of care study shows what costs are, by type of care and region, so youcan plan to live better, not just longer.
Our people helped pioneer the development of long term care insurance over thirty years ago andwe take our industry-leading role seriously. When company data revealed that nearly 40 percent ofour claimants receive care for Alzheimer’s, we decided to partner with the Alzheimer’s Associationto help raise public awareness about the disease. We are committed to helping individuals makedifficult long term care planning decisions. That is why, for the past five years, we have conductedand published the results of our study. Our experience is our strength—you can use it to preparefor the future.
Sincerely,
Buck StinsonPresident and CEOGenworth Financial Long Term Care Insurance Division
1

2
Assisted Living Facilities: Assisted livingfacilities (ALFs) were surveyed to determine therates for private one-bedroom units. All ALFssurveyed were licensed by the state as assistedliving facilities or other comparable residentialcare facilities.• Nationally, the average monthly cost for a
private one-bedroom unit is $2,691.20(implying a daily rate of $88.48/day), reflectingan average annual cost of $32,294.40 – a 6.7% increase over 2005 survey rates($30,265/yr.). These rates exclude any one-time community or entrance fees.
• Nationally, the average one-bedroom rateincreased $2,029 per year ($169/mo.)compared with Genworth’s 2005 survey.
• The highest annual costs for one-bedroomunits in ALFs is the Bridgeport area ofConnecticut ($57,566.52 excluding communityfees) and the state of New Jersey, excludingthe Newark and Edison areas, ($51,314.41excluding community fees).
• North Dakota ($20,714 excluding communityfees) and Arkansas ($20,937 excludingcommunity fees) have the lowest annual costfor a one-bedroom unit in an ALF.
• Approximately 33% of the ALFs surveyedcharge a one-time fee, commonly referred toas a community or entrance fee, ranging from$50 to $8,490 with a national average one-time fee of $1,369.68.
Home Care: Home care providers wereclassified into three types, according tocertification and licensure status. The threeprovider types are:• Medicare certified home care providers.
These providers are also licensed.
• Non-certified but licensed home careproviders.
• Non-certified and non-licensed home care providers.
E X E C U T I V E S U M M A R Y
Genworth Financial’s current cost of caresurvey is based on information gathered byCareScout in January and February 2006.Telephone interviews were conducted in 88separate U.S. regions, encompassing morethan 9,000 nursing homes, assisted livingfacilities and home care providers.
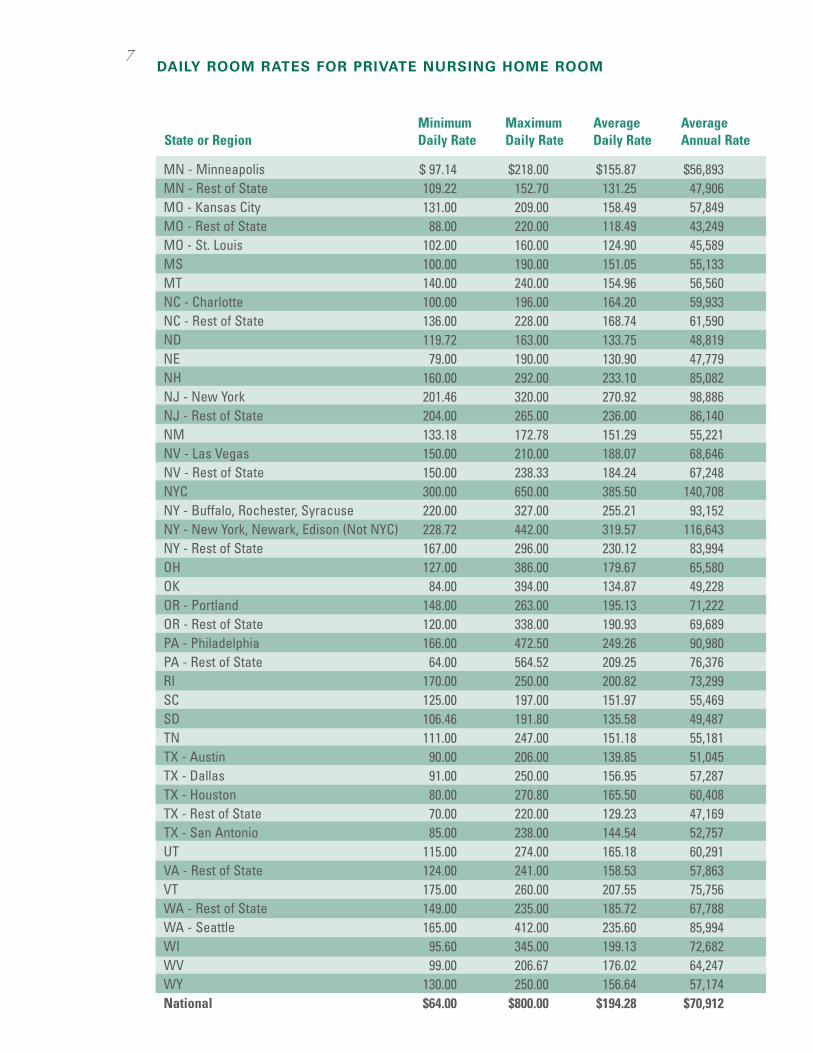
Nursing Homes: Medicare certified nursinghomes were surveyed to determine private payrates for private and semi-private rooms.• Nationally, the average annual cost for a
private room (single occupant) is $70,912($194.28/day), reflecting a 2.2% increaseover 2005 rates ($190.20/day).
• Nationally, the average annual private roomrate at a nursing home increased by $1,490($4.08/day), compared to the 2005 survey.
• Alaska continues to have the highest averageannual cost, at $191,140, for a private room,followed by New York City at $140,708.
• Louisiana and Missouri (excluding St. Louisand Kansas City) had the lowest averageannual costs for a private room, at $42,304and $43,249, respectively.
• The average annual cost for a semi-privateroom (double occupancy) is $62,532($171.32/day), a 2.3% increase over 2005rates ($167.44/day).
• Researchers also found that, on average, thecost of care for a private nursing home roomin America’s urban areas was 17% greaterthan in non-urban areas. The greatestdisparity exists in New York City, where the cost of care was 68% greater than thecost of care in New York’s non-urban areas.The cost of care in San Francisco is 45%greater than the cost of care in California’snon-urban regions.

3
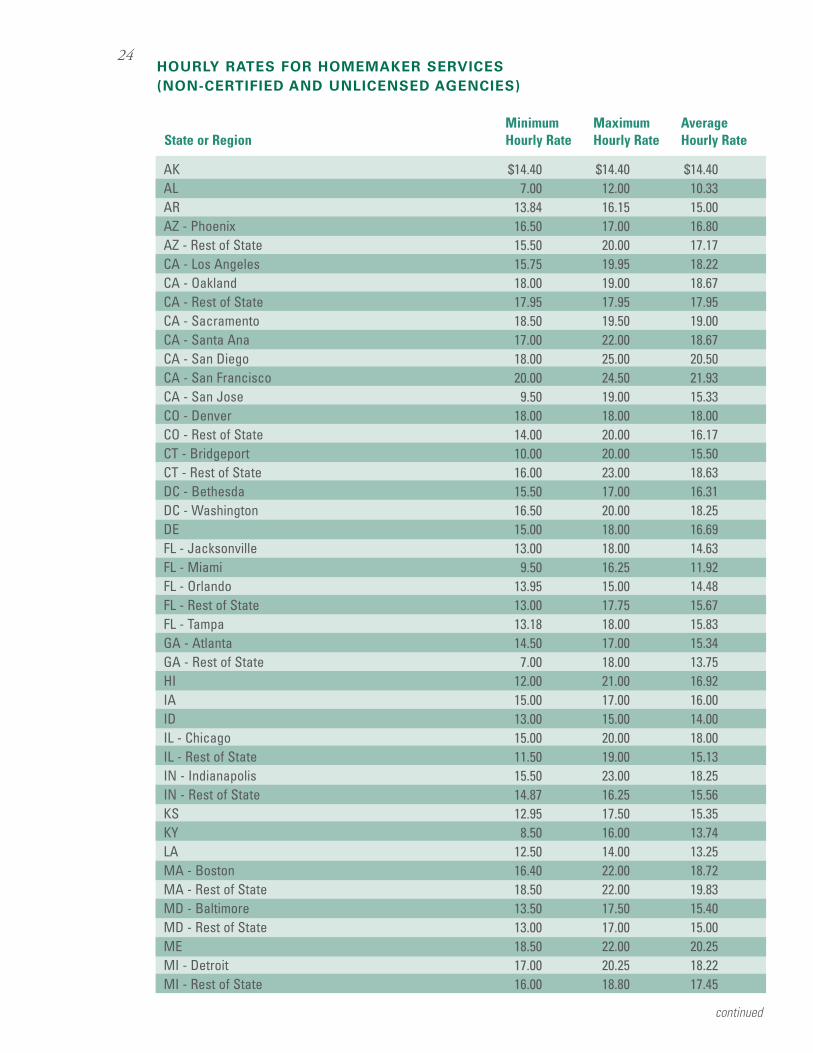
• Unlike certified home care providers, thenon-certified providers also offer homemakerservices. Nationally, non-certified but licensedproviders charge $17.73 per hour (a 5%increase compared with 2005 surveyresults), while non-certified and unlicensedproviders charge $16.45 per hour (flatcompared to 2005).
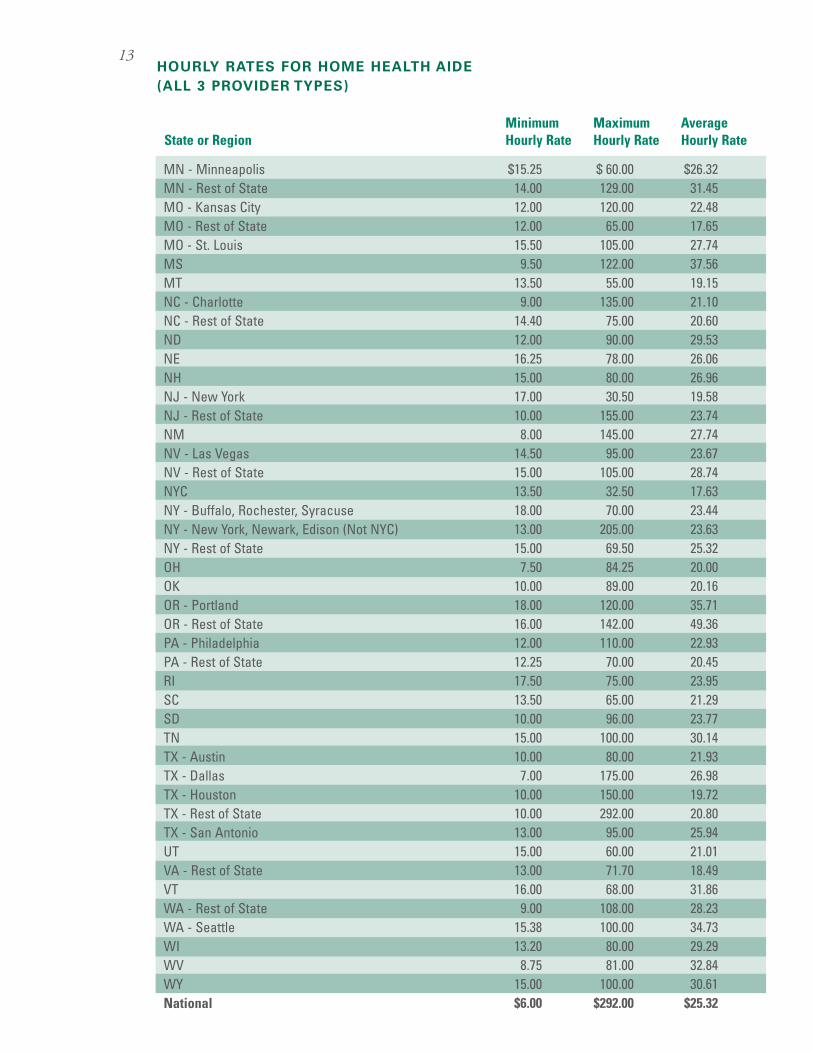
Researchers surveyed all three home healthprovider types to determine the hourly chargefor care provided by certified Home HealthAides. Also, the two types of non-certifiedproviders were surveyed to determine thehourly charge to provide homemaker services.
• Across all home care provider types, theaverage hourly rate for home health aides is $25.32, a 13% increase over 2005 survey results. The average hourly rate forhomemaker services is $17.09, a 3% increase over 2005 survey results.
• Certified home care providers charge themost for home health aides, averaging $36.22per hour (a 17% increase over 2005),compared to $22.15 per hour charged by non-certified but licensed providers (a 19%increase over 2005), and $17.57 per hourcharged by non-certified and unlicensedproviders (flat compared to 2005).
certified but licensed providers, and non-certifiedand non-licensed providers).Regional designations are given to provide moreaccurate estimates in areas where there arelarge variations in costs. For example,Philadelphia and surrounding counties areseparated from the rest of Pennsylvaniabecause care is markedly more expensive inthat region than in the rest of the state. Thismethod yields more meaningful figures thanproviding a single average rate for every state.
Nursing Homes: Researchers conductedtelephone interviews among a sampling ofnursing homes across the 50 states and theDistrict of Columbia, based on counties.
M E T H O D O L O G Y
CareScout, based in Wellesley, Massachusetts,specializes in eldercare provider databases andhelps families select appropriate providersnationwide. CareScout conducted the surveyfor Genworth Financial, contacting over 25,000providers and completing over 9,000 surveysduring January and February 2006. Thosesurveyed include nursing homes, assisted livingfacilities and home care providers in all 50states and the District of Columbia.
Genworth’s study is the most comprehensiveand in-depth survey of its kind. In addition tonursing homes, the Genworth survey includesassisted living facilities and three types of homecare providers (Medicare certified providers, non-
continued

4
The monthly rate usually includes three mealsper day and sometimes includes basic care-related supervision. It typically does not includeadditional costs for care such as therapy,rehabilitation or medication costs.
Home Care: Researchers conducted telephoneinterviews among a sampling of home careproviders across the 88 regions, polling aminimum of 10 percent of the home careproviders per region. In many areas the samplesize was significantly larger. Over 3,300providers completed the survey. All rates areweekday (Monday – Friday) rates.
Three types of home care providers weresurveyed. The three types are:1. Medicare certified and licensed home
care providers2.Non-certified but licensed home care
providers 3.Non-certified and non-licensed home
care providers
Researchers surveyed all three home healthprovider types to determine hourly charges toprovide care by certified Home Health Aides.Home Health Aides provide personal care butnot medical care. For example, a Home HealthAide typically helps with bathing, dressing,transferring and toileting, but not with cathetersor injections.
Researchers also surveyed the two types ofnon-certified providers to determine hourlycharges to provide homemaker services.Homemakers generally do not provide hands-oncare; their services usually include help withshopping, finances, cooking, running errands,transportation and/or providing companionship.
M E T H O D O L O G Y C O N T.
Within the 88 designated regions, researcherspolled a minimum of 15 percent of all certifiedand licensed nursing homes. In no region didless than 10 providers complete the survey, andin many areas the sample size was significantlylarger. More than 2,300 providers completedthe survey.
The survey evaluated the cost of care for aprivate room (single occupant) and a semi-private room (two occupants) in Medicarecertified nursing facilities. Medicare certifiednursing homes represent more than 95% of allnursing homes in the U.S. Rates for transitionalcare units (typically hospital based) were notincluded. The daily room charge usually includesservices beyond room and board, such as threemeals a day, laundry, sundries, basic nursesupervision and generic brand, non-prescriptionpharmaceuticals.
Assisted Living Facilities: Within the 88regions surveyed, researchers polledapproximately 10 percent of the licensedfacilities. In no region did less than 10 facilitiescomplete the survey, and in many areas thesample size was significantly larger. More than3,300 providers completed the survey.
Unlike nursing homes, there is no national,uniform regulatory protocol for assisted livingfacilities. As a consequence, the licensingstandards vary from state to state. CareScoutresearchers interviewed assisted living facilitieslicensed according to the requirements of the state in which the assisted living facilitywas located.
The survey evaluated the monthly rent for aprivate, one-bedroom unit in an assisted livingfacility. Researchers also procuredcommunity/entrance fee data. Community andentrance fee rates are not included in theaverage monthly assisted living rate data tables.

5
L I S T O F R AT E TA B L E S
Daily/Annual Room Rates for Private Nursing Home Room ………………………………………Page 6
Daily/Annual Room Rates For Semi-Private Nursing Home Room ………………………………Page 8
Monthly/Annual Rates for Assisted Living Facility – Private One Bedroom ……………………Page 10
Hourly Rates For Home Health Aide ………………………………………………………………Page 12(All 3 Provider Types)
Hourly Rates for Home Health Aide ………………………………………………………………Page 14(Medicare Certified Agencies)
Hourly Rates For Home Health Aide ………………………………………………………………Page 16(Non-Certified but Licensed Agencies)
Hourly Rates For Home Health Aide ………………………………………………………………Page 18(Non-Certified and Unlicensed Agencies)
Hourly Rates For Homemaker Services ……………………………………………………………Page 20(Both Non-Certified Provider Types)
Hourly Rates For Homemaker Services ……………………………………………………………Page 22(Non-Certified but Licensed Agencies)
Hourly Rates For Homemaker Services ……………………………………………………………Page 24(Non-Certified and Unlicensed Agencies)

continued
AKALARAZ - PhoenixAZ - Rest of StateCA - Los AngelesCA - OaklandCA - Rest of StateCA - SacramentoCA - Santa AnaCA - San DiegoCA - San FranciscoCA - San JoseCO - DenverCO - Rest of StateCT - BridgeportCT - Rest of StateDC - BethesdaDC - WashingtonDEFL - JacksonvilleFL - MiamiFL - OrlandoFL - Rest of StateFL - TampaGA - AtlantaGA - Rest of StateHIIAIDIL - ChicagoIL - Rest of StateIN - IndianapolisIN - Rest of StateKSKYLAMA - BostonMA - Rest of StateMD - BaltimoreMD - Rest of StateMEMI - DetroitMI - Rest of State
$285.00115.0099.00
169.00146.00130.00145.00145.00175.00175.00145.00195.00170.00143.00125.00239.00254.00179.00155.00168.00130.00130.00150.00137.00167.00135.00110.00206.00105.00145.0085.0085.83
125.00105.0097.0090.0096.67
220.00200.00170.00148.00160.00107.07149.00
$800.00235.00188.00290.00200.00340.00340.00290.00392.00350.00250.00335.00350.00200.00252.00379.00394.00247.00279.00208.00217.00350.00244.00286.00392.00205.00181.00355.00210.00179.00230.00281.64245.00246.00185.00185.00207.00350.00322.00275.00220.00290.00274.00210.00
$523.67147.46127.22199.72175.08203.95242.27184.97241.13247.99197.59268.40254.00169.82164.89337.70314.86216.89219.98196.70175.42224.99187.94181.31209.55159.77134.91270.92130.50155.25167.05155.84176.05162.92122.04152.41115.90282.07273.45201.91181.20219.43173.14182.68
$191,14053,82346,43572,89863,90474,44288,42967,51488,01290,51672,12097,96692,71061,98460,185
123,261114,92479,16580,29371,79664,02882,12168,59866,17876,48658,31649,24298,88647,63356,66660,97356,88264,25859,46644,54555,63042,304
102,95699,80973,69766,13880,09263,19666,678
Minimum Maximum Average AverageState or Region Daily Rate Daily Rate Daily Rate Annual Rate
DAILY ROOM RATES FOR PRIVATE NURSING HOME ROOM6
MN - MinneapolisMN - Rest of StateMO - Kansas CityMO - Rest of StateMO - St. LouisMSMTNC - CharlotteNC - Rest of StateNDNENHNJ - New YorkNJ - Rest of StateNMNV - Las VegasNV - Rest of StateNYCNY - Buffalo, Rochester, SyracuseNY - New York, Newark, Edison (Not NYC)NY - Rest of StateOHOKOR - PortlandOR - Rest of StatePA - PhiladelphiaPA - Rest of StateRISCSDTNTX - AustinTX - DallasTX - HoustonTX - Rest of StateTX - San AntonioUTVA - Rest of StateVTWA - Rest of StateWA - SeattleWIWVWYNational
$ 97.14109.22131.0088.00
102.00100.00140.00100.00136.00119.7279.00
160.00201.46204.00133.18150.00150.00300.00220.00228.72167.00127.0084.00
148.00120.00166.0064.00
170.00125.00106.46111.0090.0091.0080.0070.0085.00
115.00124.00175.00149.00165.0095.6099.00
130.00$64.00
$218.00152.70209.00220.00160.00190.00240.00196.00228.00163.00190.00292.00320.00265.00172.78210.00238.33650.00327.00442.00296.00386.00394.00263.00338.00472.50564.52250.00197.00191.80247.00206.00250.00270.80220.00238.00274.00241.00260.00235.00412.00345.00206.67250.00
$800.00
$155.87131.25158.49118.49124.90151.05154.96164.20168.74133.75130.90233.10270.92236.00151.29188.07184.24385.50255.21319.57230.12179.67134.87195.13190.93249.26209.25200.82151.97135.58151.18139.85156.95165.50129.23144.54165.18158.53207.55185.72235.60199.13176.02156.64
$194.28
$56,89347,90657,84943,24945,58955,13356,56059,93361,59048,81947,77985,08298,88686,14055,22168,64667,248
140,70893,152
116,64383,99465,58049,22871,22269,68990,98076,37673,29955,46949,48755,18151,04557,28760,40847,16952,75760,29157,86375,75667,78885,99472,68264,24757,174
$70,912
Minimum Maximum Average AverageState or Region Daily Rate Daily Rate Daily Rate Annual Rate
DAILY ROOM RATES FOR PRIVATE NURSING HOME ROOM7

continued
AKALARAZ - PhoenixAZ - Rest of StateCA - Los AngelesCA - OaklandCA - Rest of StateCA - SacramentoCA - Santa AnaCA - San DiegoCA - San FranciscoCA - San JoseCO - DenverCO - Rest of StateCT - BridgeportCT - Rest of StateDC - BethesdaDC - WashingtonDEFL - JacksonvilleFL - MiamiFL - OrlandoFL - Rest of StateFL - TampaGA - AtlantaGA - Rest of StateHIIAIDIL - ChicagoIL - Rest of StateIN - IndianapolisIN - Rest of StateKSKYLAMA - BostonMA - Rest of StateMD - BaltimoreMD - Rest of StateMEMI - DetroitMI - Rest of State
$285.00110.0086.00
125.00121.00115.00145.00135.00108.83134.00145.00184.00149.00126.00123.00229.00225.00163.00131.00156.00130.00120.00145.00126.00147.00127.00105.00206.0097.00
134.0085.0079.17
112.00100.0089.0070.0085.17
210.00200.00160.00138.00148.00107.07138.00
$800.00169.00168.00175.00180.00200.00240.00290.00205.00234.00215.00268.00277.00175.00175.00360.00361.00214.00257.00198.00197.00223.33209.00212.00196.00173.60176.00295.72160.00162.75187.00218.00187.00183.00140.00169.00111.35328.00317.00250.00194.00235.00203.00190.00
$489.83134.45114.58151.94149.08155.07187.64166.05170.52175.74172.50221.47189.73151.29154.75308.60289.40193.37194.61185.40160.82179.60170.61163.13173.94147.96126.94247.25115.93148.28141.66128.74154.71137.16112.24137.41100.56255.97258.05191.46165.64196.93157.87168.65
$178,788 49,074 41,822 55,458 54,414 56,601 68,489 60,608 62,240 64,145 62,963 80,837 69,251 55,221 56,484
112,639 105,631 70,580 71,033 67,671 58,699 65,554 62,273 59,542 63,488 54,005 46,333 90,246 42,314 54,122 51,706 46,990 56,469 50,063 40,968 50,155 36,704 93,429 94,188 69,883 60,459 71,879 57,623 61,557
Minimum Maximum Average AverageState or Region Daily Rate Daily Rate Daily Rate Annual Rate
DAILY ROOM RATES FOR SEMI-PRIVATE NURSING HOME ROOM8

MN - MinneapolisMN - Rest of StateMO - Kansas CityMO - Rest of StateMO - St. LouisMSMTNC - CharlotteNC - Rest of StateNDNENHNJ - New YorkNJ - Rest of StateNMNV - Las VegasNV - Rest of StateNYCNY - Buffalo, Rochester, SyracuseNY - New York, Newark, Edison (Not NYC)NY - Rest of StateOHOKOR - PortlandOR - Rest of StatePA - PhiladelphiaPA - Rest of StateRISCSDTNTX - AustinTX - DallasTX - HoustonTX - Rest of StateTX - San AntonioUTVA - Rest of StateVTWA - Rest of StateWA - SeattleWIWVWYNational
$ 82.9995.27
116.0085.9097.0085.00
131.0095.00
131.00102.2068.00
160.00200.00189.00123.18140.00135.00275.00210.00223.40161.00115.0064.00
143.00120.00166.0059.00
155.00115.0098.46
104.0075.0085.0080.0070.0075.24
114.00109.00175.00145.00160.0095.6099.00
120.00$59.00
$194.00135.74157.00158.00128.00165.00152.00184.00203.00132.00168.00252.00296.58241.00158.82177.00191.67600.00317.00425.00284.00262.00153.00206.00198.83278.00282.36220.00167.50138.77208.00135.83143.00166.00160.00146.00150.00219.00210.00197.00236.00241.50191.17200.00
$800.00
$132.01115.24138.14107.65110.70142.95139.81154.25156.79118.08117.21213.25245.92216.10140.45165.15171.81369.90247.47303.49219.68158.47105.85174.17166.04218.04187.58184.13140.72124.79137.08106.74107.86118.0096.78
106.13130.62144.84189.73168.29200.60175.46167.91142.77
$171.32
$48,184 42,063 50,421 39,292 40,406 52,177 51,031 56,301 57,228 43,099 42,782 77,836 89,761 78,877 51,264 60,280 62,711
135,014 90,327
110,774 80,183 57,842 38,635 63,572 60,605 79,585 68,467 67,207 51,363 45,548 50,034 38,960 39,369 43,070 35,325 38,737 47,676 52,867 69,251 61,426 73,219 64,043 61,287 52,111
$62,532
Minimum Maximum Average AverageState or Region Daily Rate Daily Rate Daily Rate Annual Rate
DAILY ROOM RATES FOR SEMI-PRIVATE NURSING HOME ROOM9

continued
AKALARAZ - PhoenixAZ - Rest of StateCA - Los AngelesCA - OaklandCA - Rest of StateCA - SacramentoCA - Santa AnaCA - San DiegoCA - San FranciscoCA - San JoseCO - DenverCO - Rest of StateCT - BridgeportCT - Rest of StateDC - BethesdaDC - WashingtonDEFL - JacksonvilleFL - MiamiFL - OrlandoFL - Rest of StateFL - TampaGA - AtlantaGA - Rest of StateHIIAIDIL - ChicagoIL - Rest of StateIN - IndianapolisIN - Rest of StateKSKYLAMA - BostonMA - Rest of StateMD - BaltimoreMD - Rest of StateMEMI - DetroitMI - Rest of State
$2,000.001,100.001,000.00
650.00400.00
1,100.001,500.00
980.00900.00
1,400.00890.00898.00
1,000.001,575.001,700.003,800.001,300.001,700.001,200.00
800.001,400.001,200.001,500.00
685.00854.00888.00
1,100.001,000.001,300.001,500.001,200.001,000.00
900.00900.00
1,950.001,039.001,600.002,775.002,435.00
700.00561.50525.00716.50600.00
$5,400.003,600.002,415.004,000.003,600.005,000.006,000.005,550.004,000.006,000.005,800.006,700.005,000.004,300.004,443.506,450.004,714.005,300.005,250.005,190.005,000.003,987.503,500.005,100.003,500.004,800.003,800.007,000.004,725.004,500.004,950.006,500.003,500.002,970.004,500.004,200.003,000.006,600.004,950.005,715.004,050.006,735.005,000.007,200.00
$3,750.402,033.211,744.792,355.952,527.092,725.812,765.562,541.012,617.072,755.622,674.053,172.592,580.402,866.252,513.774,797.213,323.003,335.682,779.213,575.532,626.922,469.842,366.002,384.712,081.372,370.682,042.942,739.512,647.082,501.613,385.213,052.982,156.952,276.982,788.002,164.762,276.074,243.133,696.172,465.662,337.483,758.112,854.932,005.94
$45,005 24,399 20,937 28,271 30,325 32,710 33,187 30,492 31,405 33,067 32,089 38,071 30,965 34,395 30,165 57,567 39,876 40,028 33,351 42,906 31,523 29,638 28,392 28,617 24,976 28,448 24,515 32,874 31,765 30,019 40,623 36,636 25,883 27,324 33,456 25,977 27,313 50,918 44,354 29,588 28,050 45,097 34,259 24,071
Minimum Maximum Average AverageState or Region Monthly Rate Monthly Rate Monthly Rate Annual Rate
MONTHLY RATES FOR ASSISTED LIVING FACILITY –
PRIVATE ONE BEDROOM
10

MN - MinneapolisMN - Rest of StateMO - Kansas CityMO - Rest of StateMO - St. LouisMSMTNC - CharlotteNC - Rest of StateNDNENHNJ - New YorkNJ - Rest of StateNMNV - Las VegasNV - Rest of StateNYCNY - Buffalo, Rochester, SyracuseNY - New York, Newark, Edison (Not NYC)NY - Rest of StateOHOKOR - PortlandOR - Rest of StatePA - PhiladelphiaPA - Rest of StateRISCSDTNTX - AustinTX - DallasTX - HoustonTX - Rest of StateTX - San AntonioUTVA - Rest of StateVTWA - Rest of StateWA - SeattleWIWVWYNational
$1,256.00617.00
1,400.001,125.001,390.00
625.001,722.001,725.001,500.00
890.001,800.001,300.002,940.002,670.00
800.001,795.001,000.00
978.001,181.501,289.00
873.00500.00700.00
1,604.001,925.00
500.00737.00
1,180.00900.00
1,173.001,000.002,200.001,150.00
650.001,020.00
550.001,350.001,000.00
950.001,400.003,000.001,800.001,025.001,500.00$400.00
$3,980.004,410.005,000.003,985.003,500.004,046.443,910.004,260.004,195.002,345.004,000.005,650.007,410.005,612.006,660.002,925.003,595.007,999.004,905.005,250.005,250.004,995.002,725.004,540.003,875.008,970.005,100.004,300.004,150.002,500.003,000.004,400.003,940.005,387.503,925.003,395.002,995.007,110.003,750.004,275.004,500.004,650.004,500.003,330.00
$8,970.00
$3,122.602,029.302,683.601,996.592,270.942,129.582,325.273,078.752,619.551,726.182,484.883,290.944,203.704,276.202,635.382,189.502,238.463,731.802,817.073,030.782,679.742,548.882,052.382,575.112,713.572,732.882,020.622,371.502,165.981,984.712,160.003,336.502,687.502,588.312,261.072,334.201,951.332,940.052,515.332,948.183,556.873,133.352,415.872,143.00
$2,691.20
$37,471 24,352 32,203 23,959 27,251 25,555 27,903 36,945 31,435 20,714 29,819 39,491 50,444 51,314 31,625 26,274 26,862 44,782 33,805 36,369 32,157 30,587 24,629 30,901 32,563 32,795 24,247 28,458 25,992 23,817 25,920 40,038 32,250 31,060 27,133 28,010 23,416 35,281 30,184 35,378 42,682 37,600 28,990 25,716
$32,294
Minimum Maximum Average AverageState or Region Monthly Rate Monthly Rate Monthly Rate Annual Rate
MONTHLY RATES FOR ASSISTED LIVING FACILITY –
PRIVATE ONE BEDROOM
11

continued
AKALARAZ - PhoenixAZ - Rest of StateCA - Los AngelesCA - OaklandCA - Rest of StateCA - SacramentoCA - Santa AnaCA - San DiegoCA - San FranciscoCA - San JoseCO - DenverCO - Rest of StateCT - BridgeportCT - Rest of StateDC - BethesdaDC - WashingtonDEFL - JacksonvilleFL - MiamiFL - OrlandoFL - Rest of StateFL - TampaGA - AtlantaGA - Rest of StateHIIAIDIL - ChicagoIL - Rest of StateIN - IndianapolisIN - Rest of StateKSKYLAMA - BostonMA - Rest of StateMD - BaltimoreMD - Rest of StateMEMI - DetroitMI - Rest of State
$13.506.00
13.8410.0012.0013.7518.0013.0017.7514.0017.0015.0010.5013.0015.0017.0011.0015.5010.0015.0015.008.009.00
13.5012.0014.007.50
12.0015.0012.0010.0011.5015.5014.8712.009.009.00
16.4018.5010.0013.0016.5012.5015.95
$100.0090.0080.8545.00
113.00145.00200.00155.00162.0090.00
198.00210.0037.0065.0037.8540.0060.00
125.0080.0079.0075.0035.0030.00
119.0075.00
198.0075.00
134.00119.6075.00
165.00175.0070.00
130.0095.0090.00
100.0040.0027.5060.0065.0064.00
125.0030.00
$42.7826.8029.4219.1322.8824.5734.3728.1743.2423.6033.4544.9724.3823.3920.6822.1726.2724.9921.2628.5619.2115.3017.3120.5421.1132.7822.3727.3522.3921.0624.5627.8922.8827.6224.0521.2025.7722.1221.9919.7322.0526.6922.9318.43
Minimum Maximum AverageState or Region Hourly Rate Hourly Rate Hourly Rate
HOURLY RATES FOR HOME HEALTH AIDE
(ALL 3 PROVIDER TYPES)
12
MN - MinneapolisMN - Rest of StateMO - Kansas CityMO - Rest of StateMO - St. LouisMSMTNC - CharlotteNC - Rest of StateNDNENHNJ - New YorkNJ - Rest of StateNMNV - Las VegasNV - Rest of StateNYCNY - Buffalo, Rochester, SyracuseNY - New York, Newark, Edison (Not NYC)NY - Rest of StateOHOKOR - PortlandOR - Rest of StatePA - PhiladelphiaPA - Rest of StateRISCSDTNTX - AustinTX - DallasTX - HoustonTX - Rest of StateTX - San AntonioUTVA - Rest of StateVTWA - Rest of StateWA - SeattleWIWVWYNational
$15.2514.0012.0012.0015.509.50
13.509.00
14.4012.0016.2515.0017.0010.008.00
14.5015.0013.5018.0013.0015.007.50
10.0018.0016.0012.0012.2517.5013.5010.0015.0010.007.00
10.0010.0013.0015.0013.0016.009.00
15.3813.208.75
15.00$6.00
$ 60.00129.00120.0065.00
105.00122.0055.00
135.0075.0090.0078.0080.0030.50
155.00145.0095.00
105.0032.5070.00
205.0069.5084.2589.00
120.00142.00110.0070.0075.0065.0096.00
100.0080.00
175.00150.00292.0095.0060.0071.7068.00
108.00100.0080.0081.00
100.00$292.00
$26.3231.4522.4817.6527.7437.5619.1521.1020.6029.5326.0626.9619.5823.7427.7423.6728.7417.6323.4423.6325.3220.0020.1635.7149.3622.9320.4523.9521.2923.7730.1421.9326.9819.7220.8025.9421.0118.4931.8628.2334.7329.2932.8430.61
$25.32
Minimum Maximum AverageState or Region Hourly Rate Hourly Rate Hourly Rate
HOURLY RATES FOR HOME HEALTH AIDE
(ALL 3 PROVIDER TYPES)
13

continued
AKALARAZ - PhoenixAZ - Rest of StateCA - Los AngelesCA - OaklandCA - Rest of StateCA - SacramentoCA - Santa AnaCA - San DiegoCA - San FranciscoCA - San JoseCO - DenverCO - Rest of StateCT - BridgeportCT - Rest of StateDC - BethesdaDC - WashingtonDEFL - JacksonvilleFL - MiamiFL - OrlandoFL - Rest of StateFL - TampaGA - AtlantaGA - Rest of StateHIIAIDIL - ChicagoIL - Rest of StateIN - IndianapolisIN - Rest of StateKSKYLAMA - BostonMA - Rest of StateMD - BaltimoreMD - Rest of StateMEMI - DetroitMI - Rest of State
$70.1511.0013.8410.0012.0015.0018.0013.0019.0014.0017.5015.0022.0013.0015.0019.0011.0015.5010.0018.0015.008.009.00
14.0012.0014.0013.5020.4517.0012.0010.0013.7516.5015.0012.0015.009.00
19.0020.0010.0015.0017.0012.5015.95
$100.0090.0070.0045.00
113.00145.00200.00155.00162.0090.00
198.00210.0030.0065.0037.8540.0060.00
125.0080.0075.0075.0020.0030.00
119.0075.00
198.0075.00
134.00119.6075.00
165.00175.0070.00
130.0095.0090.00
100.0040.0027.5060.0065.0050.00
125.0030.00
$85.0852.7532.3520.6329.6637.2759.8544.9388.9532.5957.3681.1425.8026.1225.4024.3234.0040.4423.7034.9423.3215.6618.4526.7426.0565.4537.2942.2830.2130.4534.8933.4228.5745.6736.9233.5048.0626.5524.7821.6033.3029.7531.2819.33
Minimum Maximum AverageState or Region Hourly Rate Hourly Rate Hourly Rate
HOURLY RATES FOR HOME HEALTH AIDE
(MEDICARE CERTIFIED AGENCIES)
14

MN - MinneapolisMN - Rest of StateMO - Kansas CityMO - Rest of StateMO - St. LouisMSMTNC - CharlotteNC - Rest of StateNDNENHNJ - New YorkNJ - Rest of StateNMNV - Las VegasNV - Rest of StateNYCNY - Buffalo, Rochester, SyracuseNY - New York, Newark, Edison (Not NYC)NY - Rest of StateOHOKOR - PortlandOR - Rest of StatePA - PhiladelphiaPA - Rest of StateRISCSDTNTX - AustinTX - DallasTX - HoustonTX - Rest of StateTX - San AntonioUTVA - Rest of StateVTWA - Rest of StateWA - SeattleWIWVWYNational
$16.0014.0014.7514.0015.5013.0013.509.00
14.4012.0016.5015.0017.0010.008.00
17.0020.0014.2518.0013.0018.007.50
10.0020.0020.0012.0015.0017.5014.7010.0015.0010.007.00
10.0010.0013.0015.0013.0016.009.00
15.3813.2016.0015.00$7.00
$60.00129.00120.0065.00
105.00122.0055.00
135.0075.0072.0078.0080.0030.50
155.00145.0095.00
105.0032.5070.00
205.0069.5084.2589.00
120.00142.00110.0070.0075.0065.0020.00
100.0080.00
110.00150.00292.0095.0060.0071.7068.00
108.00100.0080.0081.00
100.00$292.00
$31.3046.5033.6320.6345.0762.4327.5529.2427.8330.3430.9735.2020.0032.7543.8834.3047.4220.4430.0137.0239.1521.1526.5456.1580.6532.8429.0226.5029.6317.2350.9029.8230.8425.3227.2437.5024.8523.4440.7143.9153.5941.9849.6041.82
$36.22
Minimum Maximum AverageState or Region Hourly Rate Hourly Rate Hourly Rate
HOURLY RATES FOR HOME HEALTH AIDE
(MEDICARE CERTIFIED AGENCIES)
15

continued
AKALARAZ - PhoenixAZ - Rest of StateCA - Los AngelesCA - OaklandCA - Rest of StateCA - SacramentoCA - Santa AnaCA - San DiegoCA - San FranciscoCA - San JoseCO - DenverCO - Rest of StateCT - BridgeportCT - Rest of StateDC - BethesdaDC - WashingtonDEFL - JacksonvilleFL - MiamiFL - OrlandoFL - Rest of StateFL - TampaGA - AtlantaGA - Rest of StateHIIAIDIL - ChicagoIL - Rest of StateIN - IndianapolisIN - Rest of StateKSKYLAMA - BostonMA - Rest of StateMD - BaltimoreMD - Rest of StateMEMI - DetroitMI - Rest of State
$20.006.00
13.8415.9516.5013.7518.0016.6017.7515.5017.0022.0022.0016.0015.0018.0020.0016.5017.0020.0015.7513.0013.9513.5016.8514.0011.0017.0018.0015.0018.5019.0018.0016.0017.0016.0012.0017.5019.5018.0015.0016.5017.5016.00
$25.0040.0080.8520.0023.5028.0025.0026.5024.0024.0031.0070.0037.0045.0020.0040.0030.0020.0050.0079.0018.9535.0019.0021.0025.9520.0022.0022.4526.0019.2221.5072.0025.5030.0020.0020.0017.0022.0023.0028.0022.0064.0020.9722.00
$23.6715.9140.9018.6920.6019.2521.7520.5920.8819.2621.4831.4225.5023.0517.5024.9524.8017.9421.8333.0017.4518.3316.1517.7719.5817.0715.9520.1720.9617.7419.6733.3820.8321.6418.5016.9614.4220.4221.3520.6017.8429.8118.8918.02
Minimum Maximum AverageState or Region Hourly Rate Hourly Rate Hourly Rate
HOURLY RATES FOR HOME HEALTH AIDE
(NON-CERTIFIED BUT LICENSED AGENCIES)
16

MN - MinneapolisMN - Rest of StateMO - Kansas CityMO - Rest of StateMO - St. LouisMSMTNC - CharlotteNC - Rest of StateNDNENHNJ - New YorkNJ - Rest of StateNMNV - Las VegasNV - Rest of StateNYCNY - Buffalo, Rochester, SyracuseNY - New York, Newark, Edison (Not NYC)NY - Rest of StateOHOKOR - PortlandOR - Rest of StatePA - PhiladelphiaPA - Rest of StateRISCSDTNTX - AustinTX - DallasTX - HoustonTX - Rest of StateTX - San AntonioUTVA - Rest of StateVTWA - Rest of StateWA - SeattleWIWVWYNational
$22.0016.7512.0014.5016.5013.5013.5016.0014.4016.5018.0021.0017.5017.0013.5018.9515.0015.0019.5014.0015.0014.0014.0018.0016.0018.0014.5017.5017.5018.5015.5016.0015.7511.2512.9514.0017.0014.5021.0016.0019.5020.0012.0015.00$6.00
$37.5055.0020.0020.0025.0050.0020.0021.0019.0090.0072.0031.0024.0022.0060.0023.0040.0019.0022.0022.0021.5064.0027.6075.0020.0024.0022.0030.0017.5096.0060.0018.00
175.0019.5045.0050.0027.0020.0065.0024.9570.0045.0080.0025.00
$175.00
$27.4229.8516.7516.7019.5837.8316.0417.5316.8043.0029.2924.1920.0818.9724.0020.9820.8316.5420.5718.3619.4221.4517.9328.6718.0620.4417.9221.5617.5036.3322.8816.7336.3416.8421.7821.5819.9416.5333.5019.8428.9327.2536.9919.39
$22.15
Minimum Maximum AverageState or Region Hourly Rate Hourly Rate Hourly Rate
HOURLY RATES FOR HOME HEALTH AIDE
(NON-CERTIFIED BUT LICENSED AGENCIES)
17

continued
AKALARAZ - PhoenixAZ - Rest of StateCA - Los AngelesCA - OaklandCA - Rest of StateCA - SacramentoCA - Santa AnaCA - San DiegoCA - San FranciscoCA - San JoseCO - DenverCO - Rest of StateCT - BridgeportCT - Rest of StateDC - BethesdaDC - WashingtonDEFL - JacksonvilleFL - MiamiFL - OrlandoFL - Rest of StateFL - TampaGA - AtlantaGA - Rest of StateHIIAIDIL - ChicagoIL - Rest of StateIN - IndianapolisIN - Rest of StateKSKYLAMA - BostonMA - Rest of StateMD - BaltimoreMD - Rest of StateMEMI - DetroitMI - Rest of State
$13.507.25
13.8415.9517.0015.7521.0018.5018.5017.0019.5020.0020.5020.0015.0017.0017.0016.0016.5015.0015.009.50
15.0015.0013.1814.507.50
12.0015.0015.0016.5011.5015.5014.8715.959.00
13.5016.4018.5016.0013.0019.0017.0016.00
$24.0016.0016.1521.5020.0018.0022.0019.4521.0022.0023.5024.5024.0022.0022.0017.5023.0017.0020.0020.0018.4516.2522.0019.0022.0017.3518.0023.5017.0015.0020.5020.0023.0016.2517.5016.0016.0022.0022.0017.5017.0022.0020.2519.00
$19.5811.7515.0018.0718.3817.1921.5018.9819.8818.9621.5022.3621.8321.0019.1517.2520.0016.5818.2517.7516.8611.9217.3317.1217.6915.8113.8819.6016.0015.0019.1316.8819.2515.5616.7313.1514.8319.3819.8317.0015.0020.5018.6117.95
Minimum Maximum AverageState or Region Hourly Rate Hourly Rate Hourly Rate
HOURLY RATES FOR HOME HEALTH AIDE
(NON-CERTIFIED AND UNLICENSED AGENCIES)
18

MN - MinneapolisMN - Rest of StateMO - Kansas CityMO - Rest of StateMO - St. LouisMSMTNC - CharlotteNC - Rest of StateNDNENHNJ - New YorkNJ - Rest of StateNMNV - Las VegasNV - Rest of StateNYCNY - Buffalo, Rochester, SyracuseNY - New York, Newark, Edison (Not NYC)NY - Rest of StateOHOKOR - PortlandOR - Rest of StatePA - PhiladelphiaPA - Rest of StateRISCSDTNTX - AustinTX - DallasTX - HoustonTX - Rest of StateTX - San AntonioUTVA - Rest of StateVTWA - Rest of StateWA - SeattleWIWVWYNational
$15.2516.0016.0012.0017.009.50
13.8515.5016.5014.5016.2521.5017.5018.5013.5014.5017.9513.5019.7515.5015.5012.7516.0020.00
NA15.5012.2517.6013.5015.5015.2516.9512.0017.0012.0015.5016.5014.0017.5016.9018.2018.508.75NA
$7.25
$22.9520.0019.7518.0020.5014.0013.8517.5318.5016.0019.2521.5019.5020.5017.0016.9518.0017.0019.7515.5020.0020.5016.0025.00
NA15.5016.0030.0020.0020.2518.0021.5015.5017.0016.0022.0020.0016.9923.0025.0026.0018.7514.50
NA$30.00
$20.2318.0017.0515.6318.5612.4213.8516.5217.1715.2517.9221.5018.6719.5015.3315.7317.9815.9019.7515.5017.4017.4016.0022.32
NA15.5014.4223.8016.7517.7516.6319.2313.7517.0013.3918.7518.2515.5021.3820.9521.6618.6311.92
NA$17.57
Minimum Maximum AverageState or Region Hourly Rate Hourly Rate Hourly Rate
HOURLY RATES FOR HOME HEALTH AIDE
(NON-CERTIFIED AND UNLICENSED AGENCIES)
19

continued
AKALARAZ - PhoenixAZ - Rest of StateCA - Los AngelesCA - OaklandCA - Rest of StateCA - SacramentoCA - Santa AnaCA - San DiegoCA - San FranciscoCA - San JoseCO - DenverCO - Rest of StateCT - BridgeportCT - Rest of StateDC - BethesdaDC - WashingtonDEFL - JacksonvilleFL - MiamiFL - OrlandoFL - Rest of StateFL - TampaGA - AtlantaGA - Rest of StateHIIAIDIL - ChicagoIL - Rest of StateIN - IndianapolisIN - Rest of StateKSKYLAMA - BostonMA - Rest of StateMD - BaltimoreMD - Rest of StateMEMI - DetroitMI - Rest of State
$12.506.00
13.0015.9511.0013.7518.0016.0017.7515.5014.0015.009.50
15.0014.0010.0014.0014.5016.0015.0013.009.50
13.9513.0013.1813.007.00
12.0015.0013.0015.0011.5015.0014.8712.728.50
12.0014.0018.5013.5013.0016.0016.0014.00
$25.0014.9516.1517.9522.0023.0025.0024.5022.0022.0025.0025.0023.5019.5020.0020.0023.0020.0050.0023.0018.0025.0019.0019.0018.0017.5022.0021.0022.5019.2220.0022.5025.5027.0020.0016.0018.0022.0022.0018.0018.0022.0020.2518.80
$18.0511.4114.3516.8817.4618.1419.8918.5119.4418.2119.5021.3717.8717.8216.8416.7117.9716.6419.8219.4715.7414.3215.3015.9616.4915.8014.8517.4817.3314.7818.1718.8218.0716.7515.5314.8313.3818.9419.7116.3315.7519.1217.8017.15
Minimum Maximum AverageState or Region Hourly Rate Hourly Rate Hourly Rate
HOURLY RATES FOR HOMEMAKER SERVICES
(BOTH NON-CERTIFIED PROVIDER TYPES)
20

MN - MinneapolisMN - Rest of StateMO - Kansas CityMO - Rest of StateMO - St. LouisMSMTNC - CharlotteNC - Rest of StateNDNENHNJ - New YorkNJ - Rest of StateNMNV - Las VegasNV - Rest of StateNYCNY - Buffalo, Rochester, SyracuseNY - New York, Newark, Edison (Not NYC)NY - Rest of StateOHOKOR - PortlandOR - Rest of StatePA - PhiladelphiaPA - Rest of StateRISCSDTNTX - AustinTX - DallasTX - HoustonTX - Rest of StateTX - San AntonioUTVA - Rest of StateVTWA - Rest of StateWA - SeattleWIWVWYNational
$17.0015.0015.0014.6515.009.50
13.8514.0014.5014.5013.0015.0014.5017.0012.5014.5015.0013.5015.5012.0014.5012.7514.0016.0015.0015.5012.2514.7512.0011.5015.0012.0012.0011.2512.4512.0014.5014.0017.5015.9018.2014.008.75
12.50$6.00
$28.0021.5417.2520.0024.5030.0017.0017.5318.5017.0016.7523.5024.0019.5020.0019.0022.5017.2519.0021.6821.0021.5018.0024.0018.0024.0018.0020.0018.0022.0025.0021.5018.5018.5016.9544.5021.0016.5065.0019.9526.0047.2514.7519.50
$65.00
$21.0018.9416.2016.2118.6114.2314.4815.6116.1115.2115.5219.6718.3818.3914.9917.4518.0015.6917.1716.9017.3916.4114.7019.5016.6517.1415.2918.1415.1816.1717.5217.6315.1916.2114.1419.2915.8214.5225.9417.7620.9019.4912.4916.38
$17.09
Minimum Maximum AverageState or Region Hourly Rate Hourly Rate Hourly Rate
HOURLY RATES FOR HOMEMAKER SERVICES
(BOTH NON-CERTIFIED PROVIDER TYPES)
21

continued
AKALARAZ - PhoenixAZ - Rest of StateCA - Los AngelesCA - OaklandCA - Rest of StateCA - SacramentoCA - Santa AnaCA - San DiegoCA - San FranciscoCA - San JoseCO - DenverCO - Rest of StateCT - BridgeportCT - Rest of StateDC - BethesdaDC - WashingtonDEFL - JacksonvilleFL - MiamiFL - OrlandoFL - Rest of StateFL - TampaGA - AtlantaGA - Rest of StateHIIAIDIL - ChicagoIL - Rest of StateIN - IndianapolisIN - Rest of StateKSKYLAMA - BostonMA - Rest of StateMD - BaltimoreMD - Rest of StateMEMI - DetroitMI - Rest of State
$12.506.00
13.0015.9511.0013.7518.0016.0017.7515.5014.0015.0015.0015.0015.0016.0014.0014.5016.0021.5015.7512.0013.9513.5015.8513.0011.0016.0015.5013.9615.0022.5015.0015.0012.7215.7512.0014.0018.5016.5015.0016.0016.0014.00
$25.0014.9514.0017.9522.0023.0025.0024.5022.0020.0020.0025.0023.5019.5020.0019.5020.5020.0050.0023.0017.9525.0019.0019.0018.0017.5022.0020.0022.5019.2220.0022.5025.5027.0020.0016.0018.0022.0020.5018.0018.0020.0020.0018.50
$21.7012.4913.7016.9517.7518.0521.1019.0619.8817.7518.5020.8020.4017.6417.5017.9117.3016.9621.3922.2516.8516.7216.1216.2417.1516.2515.9418.0318.6615.5618.3322.5017.8817.9315.7015.9213.5019.1619.5817.2516.5017.9817.3816.84
Minimum Maximum AverageState or Region Hourly Rate Hourly Rate Hourly Rate
HOURLY RATES FOR HOMEMAKER SERVICES
(NON-CERTIFIED BUT LICENSED AGENCIES)
22

MN - MinneapolisMN - Rest of StateMO - Kansas CityMO - Rest of StateMO - St. LouisMSMTNC - CharlotteNC - Rest of StateNDNENHNJ - New YorkNJ - Rest of StateNMNV - Las VegasNV - Rest of StateNYCNY - Buffalo, Rochester, SyracuseNY - New York, Newark, Edison (Not NYC)NY - Rest of StateOHOKOR - PortlandOR - Rest of StatePA - PhiladelphiaPA - Rest of StateRISCSDTNTX - AustinTX - DallasTX - HoustonTX - Rest of StateTX - San AntonioUTVA - Rest of StateVTWA - Rest of StateWA - SeattleWIWVWYNational
$17.0016.7515.0014.6515.0012.0014.0014.0014.5014.5015.0015.0014.5017.0013.5016.9515.0015.0017.0012.0015.0013.9514.0016.0015.0016.5013.9514.7512.0011.5015.0012.0015.7511.2512.5012.0015.5014.0021.0016.0019.5014.0012.0012.50$6.00
$28.0029.0017.2520.0024.5030.0017.0017.0018.0017.0016.5023.5024.0019.0020.0019.0022.5017.2519.0021.6821.0020.0018.0020.0018.0024.0018.0020.0018.0022.0025.0019.0018.5018.5016.9544.5021.0016.5065.0019.9526.0047.2514.7519.50
$65.00
$22.1021.5416.4016.9119.3816.2015.1015.4415.8015.6715.9919.8319.4317.7716.0017.7418.1715.7518.0017.1118.2216.2815.4018.0016.6518.7716.1618.2815.1816.9418.4116.0516.6215.9114.6820.0817.1315.0432.0017.8821.8820.9113.6016.38
$17.73
Minimum Maximum AverageState or Region Hourly Rate Hourly Rate Hourly Rate
HOURLY RATES FOR HOMEMAKER SERVICES
(NON-CERTIFIED BUT LICENSED AGENCIES)
23
continued
AKALARAZ - PhoenixAZ - Rest of StateCA - Los AngelesCA - OaklandCA - Rest of StateCA - SacramentoCA - Santa AnaCA - San DiegoCA - San FranciscoCA - San JoseCO - DenverCO - Rest of StateCT - BridgeportCT - Rest of StateDC - BethesdaDC - WashingtonDEFL - JacksonvilleFL - MiamiFL - OrlandoFL - Rest of StateFL - TampaGA - AtlantaGA - Rest of StateHIIAIDIL - ChicagoIL - Rest of StateIN - IndianapolisIN - Rest of StateKSKYLAMA - BostonMA - Rest of StateMD - BaltimoreMD - Rest of StateMEMI - DetroitMI - Rest of State
$14.407.00
13.8416.5015.5015.7518.0017.9518.5017.0018.0020.009.50
18.0014.0010.0016.0015.5016.5015.0013.009.50
13.9513.0013.1814.507.00
12.0015.0013.0015.0011.5015.5014.8712.958.50
12.5016.4018.5013.5013.0018.5017.0016.00
$14.4012.0016.1517.0020.0019.9519.0017.9519.5022.0025.0024.5019.0018.0020.0020.0023.0017.0020.0018.0018.0016.2515.0017.7518.0017.0018.0021.0017.0015.0020.0019.0023.0016.2517.5016.0014.0022.0022.0017.5017.0022.0020.2518.80
$14.4010.3315.0016.8017.1718.2218.6717.9519.0018.6720.5021.9315.3318.0016.1715.5018.6316.3118.2516.6914.6311.9214.4815.6715.8315.3413.7516.9216.0014.0018.0015.1318.2515.5615.3513.7413.2518.7219.8315.4015.0020.2518.2217.45
Minimum Maximum AverageState or Region Hourly Rate Hourly Rate Hourly Rate
HOURLY RATES FOR HOMEMAKER SERVICES
(NON-CERTIFIED AND UNLICENSED AGENCIES)
24

MN - MinneapolisMN - Rest of StateMO - Kansas CityMO - Rest of StateMO - St. LouisMSMTNC - CharlotteNC - Rest of StateNDNENHNJ - New YorkNJ - Rest of StateNMNV - Las VegasNV - Rest of StateNYCNY - Buffalo, Rochester, SyracuseNY - New York, Newark, Edison (Not NYC)NY - Rest of StateOHOKOR - PortlandOR - Rest of StatePA - PhiladelphiaPA - Rest of StateRISCSDTNTX - AustinTX - DallasTX - HoustonTX - Rest of StateTX - San AntonioUTVA - Rest of StateVTWA - Rest of StateWA - SeattleWIWVWYNational
$18.7515.0016.0015.5017.009.50
13.8514.0015.1714.5013.0018.0017.0018.5012.5014.5017.5013.5015.5015.5014.5012.7514.0019.00
NA15.5012.2516.0013.5014.5015.2516.9012.0016.0012.4515.0014.5014.0017.5015.9018.2015.958.75NA
$7.00
$21.0018.0016.0015.5018.5013.7513.8517.5318.5015.0016.7521.0017.5019.5014.9518.9518.0017.0018.0020.0020.0021.5014.0024.00
NA15.5016.0020.0016.5017.5018.0021.5015.5017.0016.0022.0014.5014.0022.5020.0021.4521.0014.00
NA$25.00
$19.9016.3316.0015.5017.8312.2513.8515.7716.4214.7515.0519.5017.3319.0013.9817.1517.8215.6316.3316.6916.5516.5314.0021.00
NA15.5014.4218.0015.1716.4816.6319.2013.7516.5013.5918.5014.5014.0019.8817.6319.9118.0711.38
NA$16.45
Minimum Maximum AverageState or Region Hourly Rate Hourly Rate Hourly Rate
HOURLY RATES FOR HOMEMAKER SERVICES
(NON-CERTIFIED AND UNLICENSED AGENCIES)
25

26
Regional Definitions with Average Daily Rates for Nursing Home Private Rooms and Semi-Private Rooms …………………………………………Page 27
Map of Regions with Nursing Home Private Daily Room Rate Comparison……………………Page 31
Map of Regions with Nursing Home Semi-Private Daily Room Rate Comparison ……………Page 32
L I S T O F R E G I O N S

continued
AK All countiesAL All countiesAR All countiesAZ - Phoenix Maricopa, PinalAZ - Rest-of-State All remaining countiesCA - Los Angeles Los AngelesCA - Oakland Alameda, Contra CostaCA - Rest-of-State All remaining countiesCA - Sacramento El Dorado, Yolo, Placer, SacramentoCA - Santa Ana OrangeCA - San Diego San DiegoCA - San Francisco Marin, San Mateo, San FranciscoCA - San Jose Santa Clara, San BenitoCO - Denver Jefferson, Park, Clear Creek,
Adams, Gilpin, Douglas, Denver,Elbert, Broomfield
CO - Rest-of-State All remaining countiesCT - Bridgeport FairfieldCT - Rest-of-State All remaining countiesDC - Bethesda Frederick, MontgomeryDC - Washington Charles County, Prince Georges and
Calvert County in MD; All remainingcounties in DC; Manassas City,Warren, Stafford, Spotsylvania,Fairfax, Manassas Park City, FairfaxCity, Prince William, Clarke,Fredricksburg City, Falls Church City,Loudoun, Fauquier, Alexandria CityCounties in VA.
DE All remaining countiesFL - Jacksonville Baker, Clay, St Johns, Nassau, DuvalFL - Miami Miami-Dade, Broward, Palm BeachFL - Orlando Osceola, Seminole, Orange, LakeFL - Rest-of-State All remaining countiesFL - Tampa Hillsborough, Pasco, Hernando,
PinellasGA - Atlanta Haralson, Newton, Walton, Lamar,
Fulton, Barrow, Pickens, DeKalb,Bartow, Gwinnett, Butts, Coweta,Paulding, Cherokee, Jasper, Clayton,Meriwether, Cobb, Douglas, Spalding,Forsyth, Carroll, Henry, Dawson,Rockdale, Pike, Fayette, and Heard
GA - Rest-of-State All remaining counties
87414870717884778176 74868265
6498
1819
143025292731
35
33
$523.67147.46127.22199.72175.08203.95242.27184.97241.13247.99197.59268.40254.00169.82
164.89337.70314.86216.89219.98
196.70175.42224.99187.94181.31209.55
159.77
134.91
$489.83134.45114.58151.94149.08155.07187.64166.05170.52175.74172.50221.47189.73151.29
154.75308.60289.40193.37194.61
185.40160.82179.60170.61163.13173.94
147.96
126.94
Nursing Home Nursing HomePrivate Room Semi-PrivateAverage Room Average
State or Region Counties Territory ID Daily Rate Daily Rate
LIST OF REGIONS27

continued
HI All countiesIA All countiesID All countiesIL - Chicago Will, McHenry, DuPage, Cook, Kane,
Kendall, Grundy, DeKalbIL - Rest-of-State All remaining countiesIN - Indianapolis Brown, Shelby, Hendricks, Marion,
Johnson, Hamilton, Hancock,Morgan, Boone, Putnam
IN - Rest-of-State All remaining countiesKS All counties (excluding portions of
state within MO-Kansas City region)KY All countiesLA All countiesMA - Boston Essex, Norfolk, Suffolk, Middlesex,
PlymouthMA - Rest-of-State All remaining countiesMD - Baltimore Baltimore city, Harford, Anne
Arundel, Queen Annes, Baltimore,Howard, Carroll
MD - Rest-of-State All remaining countiesME All countiesMI - Detroit Livingston, Lapeer, Oakland,
St Clair, Wayne, MacombMI - Rest-of-State All remaining countiesMN - Minneapolis Washington, Carver, Ramsey, Isanti,
Hennepin, Scott, Wright, Anoka,Sherburne, Dakota, Chisago
MN - Rest-of-State All remaining countiesMO - Kansas City Wyandotte, Miami, Johnson, Franklin,
Leavenworth, Linn Counties in KS;Bates, Cass, Lafayette, Clinton,Jackson, Ray, Clay, Platte, andCaldwell Counties in MO
MO - Rest-of-State All remaining countiesMO - St. Louis St Charles, Crawford, Washington,
Warren, Lincoln, Jefferson, St Louis,St Louis city, Franklin
MS All countiesMT All countiesNC - Charlotte Anson, Cabarrus, Mecklenburg,
Gaston, UnionNC - Rest-of-State All remaining countiesND All counties
88517242
4340
3757
38472
717
151
34
3652
5053
4946
446826
2363
$270.92130.50155.25167.05
155.84176.05
162.92122.04
152.41115.90282.07
273.45201.91
181.20219.43173.14
182.68155.87
131.25158.49
118.49124.90
151.05154.96164.20
168.74133.75
$247.25115.93148.28141.66
128.74154.71
137.16112.24
137.41100.56255.97
258.05191.46
165.64196.93157.87
168.65132.01
115.24138.14
107.65110.70
142.95139.81154.25
156.79118.08
Nursing Home Nursing HomePrivate Room Semi-PrivateAverage Room Average
State or Region Counties Territory ID Daily Rate Daily Rate
LIST OF REGIONS28

continued
NE All countiesNH All countiesNJ - New York Bergen, Union, Hunterdon,
Monmouth, Somerset, Morris,Sussex, Middlesex, Passaic, Hudson,Ocean, Essex
NJ - Rest-of-State All remaining countiesNM All countiesNV - Las Vegas ClarkNV - Rest-of-State All remaining countiesNYC New YorkNY - Buffalo- Oswego, Niagara, Onondaga,
Rochester Orleans, Monroe, Erie, Wayne,-Syracuse Livingston, Ontario, Madison
NY - Newark - Kings, Westchester, Rockland,Edison Putnam, Queens, Bronx, Richmond,(Not NYC) Nassau, Suffolk
NY - Rest-of-State All remaining countiesOH All countiesOK All countiesOR - Portland Columbia, Washington, Multnomah,
Clackamas, Yamhill Counties in OR;Clark, Skamania Counties in WA
OR - Rest-of-State All remaining countiesPA - Philadelphia New Castle County in DE; Cecil
County in MD; Gloucester, Salem,Burlington, Camden Counties in NJ;Philadelphia, Delaware, Bucks,Montgomery, Chester Counties in PA
PA - Rest-of-State All remaining countiesRI All countiesSC All countiesSD All countiesTN All countiesTX - Austin Bastrop, Caldwell, Williamson,
Hays, TravisTX - Dallas Ellis, Tarrant, Wise, Delta, Kaufman,
Collin, Dallas, Rockwall, Johnson,Parker, Hunt, Denton
TX - Houston Liberty, Austin, San Jacinto,Montgomery, Chambers, Waller,Brazoria, Harris, Galveston, Fort Bend
TX - Rest-of-State All remaining counties
604
11
126673751021
5
16325985
7913
203
28623956
55
54
61
$130.90233.10270.92
236.00151.29188.07184.24385.50255.21
319.57
230.12179.67134.87195.13
190.93249.26
209.25200.82151.97135.58151.18139.85
156.95
165.50
129.23
$117.21213.25245.92
216.10140.45165.15171.81369.90247.47
303.49
219.68158.47105.85174.17
166.04218.04
187.58184.13140.72124.79137.08106.74
107.86
118.00
96.78
Nursing Home Nursing HomePrivate Room Semi-PrivateAverage Room Average
State or Region Counties Territory ID Daily Rate Daily Rate
LIST OF REGIONS29

TX - San Antonio Wilson, Atascosa, Bandera, Bexar,Medina, Comal, Kendall, Guadalupe
UT All countiesVA - Rest-of-State All remaining countiesVT All countiesWA - Rest-of-State All remaining countiesWA - Seattle Snohomish, Pierce, KingWI All countiesWV All countiesWY All counties
58
69226
8083452467
$144.54
165.18158.53207.55185.72235.60199.13176.02156.64
$106.13
130.62144.84189.73168.29200.60175.46167.91142.77
Nursing Home Nursing HomePrivate Room Semi-PrivateAverage Room Average
State or Region Counties Territory ID Daily Rate Daily Rate
LIST OF REGIONS30

31M
AP
OF
RE
GIO
NS
WIT
H N
UR
SIN
G H
OM
E P
RIV
AT
E D
AIL
Y R
OO
M R
AT
E C
OM
PA
RIS
ON
Maui
020
0
Mile
s
Nur
sing
Hom
es: P
rivat
e, D
aily
Roo
m R
ates
Leas
t Exp
ensi
ve ($
115-
$158
/day
)M
oder
atel
y Ex
pens
ive
($15
9-$1
95/d
ay)
Mos
t Exp
ensi
ve ($
196-
$550
/day
)
Cana
da
Mex
ico
Cana
da
Paci
fic
Oce
anG
ulf
of A
lask
a
Paci
fic
Oce
an
Arc
tic
Oce
an
MA RIM
E
NJ
PA
CT
AZ
FL
CA
NC
VAW
V
MD
KY
AL
SC
ID
MN
TX
AR
MS
NV
CO
GA
IA
IL
IN
KS
LA
MI
MO
MT
ND NE
NH
NM
NY
OH
OK
OR
SD
TN
UT
VT
WA
WI
WY
AK
HI
DE
02 03
04 0807
1621
05
06 10
18
71
27
82
8186
80
23
22
1514
76
01
0911 12
13
17
20
24
25
26 28 29
30 31
32
33
34 35
36
37
38
3940
41
42
43 44
45
46
47
4849
50
5152
53
54
55
5657
58
59
60
61
6263
6465
6667
68
69
7072
73
74
75
77 78
7983
85
19
87
88
84

32
Maui
020
0
Mile
s
Nur
sing
Hom
es: S
emi-P
rivat
e, D
aily
Roo
m R
ates
Leas
t Exp
ensi
ve ($
94-$
158/
day)
Mod
erat
ely
Expe
nsiv
e ($
159-
$195
/day
)M
ost E
xpen
sive
($19
6-$5
50/d
ay)
Cana
da
Mex
ico
Cana
da
Paci
fic
Oce
anG
ulf
of A
lask
a
Paci
fic
Oce
an
Arc
tic
Oce
an
MA RIM
E
NJ
PA
CT
AZ
FL
CA
NC
VAW
V
MD
KY
AL
SC
ID
MN
TX
AR
MS
NV
CO
GA
IA
IL
IN
KS
LA
MI
MO
MT
ND NE
NH
NM
NY
OH
OK
OR
SD
TN
UT
VT
WA
WI
WY
AK
HI
DE
02 03
04 0807
1621
05
06 10
18
71
27
82
8186
80
23
22
1514
76
01
0911 12
13
17
20
24
25
26 28 29
30 31
32
33
34 35
36
37
38
3940
41
42
43 44
45
46
47
4849
50
5152
53
54
55
5657
58
59
60
61
6263
6465
6667
68
69
7072
73
74
75
77 78
7983
85
19
87
88
84
MA
P O
F R
EG
ION
S W
ITH
NU
RS
ING
HO
ME
SE
MI-
PR
IVA
TE
DA
ILY
RO
OM
RA
TE
CO
MP
AR
ISO
N

A B O U T C A R E S C O U T
Headquartered in Wellesley, Massachusetts, CareScout helps Americans in every state findquality care providers at preferred rates. Large employers, insurance companies, riskunderwriters and families rely on CareScout's proprietary quality of care ratings systems,discount network and database of more than 77,000 nursing homes, assisted living facilities and home care agencies.
A B O U T G E N W O R T H F I N A N C I A L
Genworth Financial (NYSE: GNW) is a leading insurance holding company, serving the lifestyle protection, retirement income, investment and mortgage insurance needs of more than15 million customers, with operations in 24 countries, including the U.S., Canada, Australia, theU.K. and more than a dozen other European countries. The Long Term Care Insurance Divisionof Genworth Financial is the leading provider of long term care insurance in the United States.For more information, visit genworth.com.
Alzheimer's Association and Genworth Financial, Inc. have entered into a strategic relationship that permits Genworth'suse of the Association's trademarks and/or logos. The use of the Alzheimer's Association logo does not constitute anendorsement of the Company's products and services.
Study conducted by: CareScout Helping Americans Make Intelligent, Informed Eldercare Decisions.©2006 Genworth Financial, Inc. and National Eldercare Referral Systems, Inc. (CareScout). All rights reserved. Genworth, Genworth Financial and the Genworth logo are service marks of Genworth Financial, Inc.