genotyping escherichia coli isolates by pulsed-field gel ...15489/fulltext01.pdf · genotyping...
TRANSCRIPT

1
Genotyping Escherichia coli isolates by Pulsed-Field Gel Electrophoresis Master thesis in Cell Molecular Biology
Shahnaz Askarian Nameghi Södertörn Högskola Stockholm 2007
Supervisor: Hong Fang, PhD. Clinical Microbiology Karolinska University Hospital Examinator: Sara Sjöling

2
Table of contents Abstract 3 Abbreviation 4 Introduction 5 Escherichia coli (E- coli) Extended-spectrum beta-lactamse (ESBL) Pulsed-Field Gel Electrophoresis (PFGE) Background Aims of the study 8 Materials and methods 9 Bacterial isolates PFGE method Restriction enzyme Gel electrophoresis PGEF pattern analysis Results 12 Discussion 16 References 19 Index 22

3
ABSTRACT Transmission of bacterial strains between patients is a serious problem in hospitals and with the increasing rate of antibiotic resistance the problem has farther escalated. Enterobacteriaceae produced extended-spectrum beta-lactamses (ESBLs), especially Escherichia coli (E-coli), are increasingly important nosocomial pathogens (7, 8). These bacteria are often multiple resistant and are responsible for many intestinal infections and urinary tract infections (2, 5). With the more frequent use of invasive devices in hospital care, these types of nosocomial infections have increased, particularly in seriously ill patients. In order to diminish transmission of bacterial strains between patients and to study the epidemiology of these bacteria, it is of great importance to develop rapid and specific methods to be able to subtype on strain-level, i.e. to create a fingerprint of the isolates. The method may be based on phenotypic or genotypic characteristics of the microorganism. Any typing method must have high reproducibility and discrimination power to differentiate unrelated strains and also to demonstrate relationship of organisms deriving from the same source. In the present project, a Pulsed-Field Gel Electrophoresis (PFGE) assay for genotyping clinical E. coli isolates was used. PFGE can be used as a genotyping tool and is widely used to type bacteria and trace nosocomial infection. However, the method is time-consuming and relatively expensive in compare with other methods like PCR. In this study, a total of 93 strains were collected. The study was aimed to investigate the genotypes of the collected isolates and to identify and potential the outbreak strains. The isolates investigated were genotypically diverse shown by a variety of PFGE banding patterns. However, clusters of closely related isolates involved in outbreaks were also identified. In conclusion, when analyzing a large number of strains, a combination of a rapid phenotyping or genotyping method and a powerful genotyping method like PFGE would be an appropriate strategy for studying clonal relationship among isolates e.g. for detecting cross-transmission of nosocomial pathogens.

4
ABBERIVIATION
ICU; Intensive Care Unit
E-coli; Escherichia coli
ESBL; Extended Spectrum Beta Lactamase
PFGE; Pulsed-Field Gel Electrophoresis
MDR; Multi-Drug Resistant
PHAC; Public Health Agency of Canada
IMS; Immunomagnetic Separation
PCR; Polymerase Chain Reaction
UK; United Kingdom
Kb; kilo base
OD; Optical Density
DNA; Deoxyribonucleic acid

5
INTRODUCTION
a) Escherichia coli (E-coli) E. coli is one of the dominating species of bacteria living in the lower intestines of mammals, known as gut flora (1). When located in the large intestine, it actually assists with waste processing, vitamin K production and food absorption (2, 5). Discovered in 1885 by Theodor Escherich, a German pediatrician and bacteriologist, E. coli is an abundant microorganism: the number of individual E. coli bacteria in the feces that a human defecates in one day average between 100 billion and 10 trillion (3, 6). The E. coli is one of hundreds strains of the bacterium that cause illness in humans. As with all Gram-negative organisms, E. coli is unable to sporulate. Thus, treatments which kill all active bacteria, such as pasteurization or simple boiling, are effective for their eradication, without requiring the more rigorous sterilization which also deactivates spores (4, 6). As a result of their adaptation to mammalian intestines, E. coli grow best in vivo or at the higher temperatures characteristic of such an environment, rather than the cooler temperatures found in soil and other environments (6). E. coli can generally cause several intestinal and extra-intestinal infections such as urinary tract infections, meningitis, peritonitis, mastitis, specticemia and Gram-negative pneumonia (2, 5). Although it is more common in females due to the shorter urinary tract, urinary tract infection is seen in both males and females. It is found roughly equal proportions in elderly men and women. If E. coli bacteria escape the intestinal tract through a perforation and enter the abdomen, they usually cause peritonitis that can be fatal without prompt treatment (5, 6).
b) Extended-Spectrum beta- Lactamases (ESBLs) Members of the family Enterobacteriaceae commonly express plasmid-encoded β-lactamases (e.g., TEM-1, TEM-2, and SHV-1) which confer resistance to penicillin but not to expanded-spectrum cephalosporins (9). In the mid-1980s a new group of enzymes, the extended-spectrum β-lactamases (ESBLs), was detected. ESBLs are beta-lactamases that hydrolyze extended-spectrum cephalosporins with an oxyimino side chain, e.g., CTX-M (10). These cephalosporins include cefotaxime, ceftriaxone, and ceftazidime, as well as the oxyimino-monobactam aztreonam. ESBLs confer resistance to expanded-spectrum cephalosporins (e.g. ceftriaxime, cefotaxime, and ceftazidime), aztreonam, and related oxyimino-beta lactamas (10, 11). Typically, they drive from genes for TEM-1, TEM-2, or SHV-1 by mutations that alter the amino acid composition around the active site of these β-lactamases. This extends the spectrum of β-lactam antibiotics susceptible to hydrolysis by these enzymes (9, 10). The ESBLs are frequently plasmid encoded. Plasmids responsible for ESBL production frequently carry genes encoding resistance to other drug classes (for

6
example, aminoglycosides) (12). Therefore, antibiotic options in the treatment of ESBL-producing organisms are extremely limited. Carbapenems are the treatment of choice for serious infections due to ESBL-producing organisms, yet carbapenem-resistant isolates have recently been reported (11, 12). ESBL-producing organisms may appear susceptible to some extended-spectrum cephalosporins. However, treatment which such antibiotics have been associated with high failure rates (10).
c) Pulsed-Field Gel Electrophoresis (PFGE) PFGE can be used for the comparison of large genomic DNA fragments after digestion with a restriction enzyme. Since the bacterial chromosome is typically a circular molecule, this digestion yields several linear molecules of DNA (40). The basic concept of interpretation of such this experiment is generally the following: when comparing two strains that are clonal (i.e. the same strain), the sites at which the restriction enzymes act on the DNA and the length between these sites should be identical (13). Therefore, after digestion of the DNA and electrophoresis through an agarose gel, if the DNA banding patterns between any two isolates is identical, then these isolates are considered the same strain. Conversely, if two isolates are not the same strain, then the sites at which the restriction enzymes act on the DNA and the length between these sites would be different; thus their DNA banding patterns will be different (13,14). The preparation of genomic DNA suitable for PFGE begins by lysing bacteria that are encased in agarose blocks (14). After multiple washes, the DNA within the agarose is digested with restriction enzymes and electrophoresis using PFGE. PFGE differs from conventional agarose electrophoresis in that the orientation of the electric field across the gel is periodically changed in contrast to being unidirectional and constant in standard electrophoresis (13). The variability in the electric field allows PFGE to resolve very large fragments (>600 kb) (15). There are a variety of PFGE conditions that differ in how the pulses of electrophoretic current are delivered to the agarose gel, thereby affecting the DNA reorientation and separation (16).

7
Background ESBL producing E. coli Antimicrobial resistance is the ability of a microorganism to withstand an antimicrobial compound. ESBLs are enzymes that confer upon their host organism the ability to resist a wide range of therapeutic beta-lactam antimicrobials (e.g. penicillin and cephalosporin) (17). One such group of enzymes is the CTX-M group which is divided into various types based on genetic structure; other groups are TEM and SHV which were found before (9, 18). Since around year 2000, first in Poland and Spain, later on in France and the UK, dramatic shifts have been detected in the prevalence and types of extended-spectrum β-lactamases (ESBLs) in Europe (20, 24). Before these findings, most producers were nosocomial isolates, often Klebsiella spp. or Staphylococcus spp, from specialist care units, with mutant TEM or SHV extended-spectrum β-lactamases. Subsequently, CTX-M ESBLs have become dominant, with much greater penetration into Escherichia coli, and with many infections in hospitalized patients, usually with underlying disease, recent antibiotic usage, or healthcare contact (19). The degree of clonality among producers varies with the country, as does the enzyme type produced, with group 9 (CTX-M-9 and -14) enzymes dominant in Spain and group 1 enzymes (particularly CTX-M-3 and-15) dominant elsewhere (19, 28). Irrespective of the particular enzyme, most producers are multi-resistant. These changing patterns present major therapeutic and infection control challenges, with the public health intervention points unclear (20). E. coli is considers to be one of the most important human pathogens of ‘animal origin’ which causes serious clinical complications (23). One of the most common methods to isolate E. coli is the immunomagnetic separation (IMS) technique which employs specific antibodies coupled to magnetic beads to bind and extract cells from enrichment broths followed by plating onto sorbitol MacConkey agar supplemented with cefixime and potassium tellurite (CT-SMAC) plates (22). Strain variation among E. coli colonies isolated by the IMS technique can be detected by pulsed-field gel electrophoresis (PFGE) (21). Extended-spectrum β-lactamases (ESBLs) are enzymes capable of hydrolyzing cephalosporin, thereby causing resistance to those drugs which include these components. Since the first ESBL was identified in Germany in the 1980s, they have been identified worldwide (10).Outbreaks of hospital-acquired ESBL-producing enterobacteria has been reported in some European countries, Asia, and United States (20). ESBL-producing enterobacteria have also been identified in the Nordic-countries, but nosocomial outbreaks had not been reported until 2004 (17, 24). Fang and colleagues reported the study confirming the nosocomial outbreak of ESBL-producing E. coli in southern Stockholm in 2002, which is the first documented hospital-acquired ESBL outbreak in Sweden (8).

8
Public Health Agency of Canada (PHAC) published a report which describes the initial of an on-going investigation of related outbreaks of a clone of multi-drug resistant (MDR), extended spectrum beta-lactamases (ESBL)-producing Escherichia coli in long term care facilities (LTCFs) in the Durham, York, and Torento (26). These are the first reported outbreaks of ESBL-producing E. coli described in Canada (26). Extended-spectrum beta-lactamases (ESBLs) are enzymes that confer resistance to a broad spectrum of beta-lactam antibiotics including newer extended-spectrum agents such as the ureidopenicillins, the indanylpenicillins and the third and forth generation cephalosporins (17). Third generation cephalosporin resistance in Escherichia coli and in Klebsiella species is usually due to one of two resistance mechanisms, a Class A ESBL (“classical ESBL”) or a Class C ESBL (“AmpC”). Class A ESBL is typically plasmid-mediated, whereas Class C ESBL is typically chromosomal, although numerous exceptions to this rule have been reported (27). The increase in ESBL-mediated resistance amongst E. coli and Klebsiella isolates worldwide make this a major public health threat (29, 30). Efforts to understand and control the spread of these resistant organisms are necessary. At present, there is little evidence and recommendations to direct management of these organisms in healthcare facilities. A recent multi-institutional outbreak of Class A ESBL E. coli in Ontario prompted debate as to optimal management (27). AIM OF THE STUDY The study was aimed to optimize a PFGE method for genotyping Escherichia coli and to genotype E. coli isolates producing ESBLs by the technique, and to identify any potential outbreak strains.

9
MATERIALS AND METHODS Bacterial isolates Ninety-three E. coli isolates collected at the Department of Clinical Microbiology at Karolinska University Hospital Huddinge were included in this study. Most of the isolates were ESBL-producers. Pulsed-field gel electrophoresis method Day 1 The isolates were grown overnight on blood agar plates at 37°C. Day 2 The bacteria were incorporated into agarose plugs as described below, in order to protect the DNA against breakage and also to allow the free flow of lytic solutions. About two loops of bacteria were washed by suspension buffer (substrate in Huddinge hospital), centrifuged and re-suspension, the pellet was re-suspended in suspension-buffer (substrate in Huddinge hospital), two times. The optical density (OD) was measured by nanometer machine (Nano Drop, ND 1000 Spectrophotometer, Saveen Werner, Sweden) at 610 nm. According to our experiments the optimized OD was between 0.4 and 0.5, so the bacterial suspension was diluted by SE-buffer (substrate in Huddinge hospital), to reach the OD. 150 µL of bacterial suspension was transferred to an eppendorf and incubated at 50 °C in a water-bath for maximum 15 minutes. Two percent low melting agarose (SeaPlaque® GTG®agarose; USA) was prepared with SE-buffer and boiled in a microwave oven until it became clear and was then placed in the same water-bath.150 µL Low melting agarose was filled in an eppendorf tube and at the same time 6 µL lysozyme 25mg/ml (SIGMA, Saint Louis, M. O., USA) and 7.5 µL Proteinase K 20mg/ml (SIGMA, St. Louis, M. O., USA) were added and mixed carefully with a peptide. Immediately after mixing, 100 µL of the mixture was transferred to wells on the agarose gel, two wells for each sample, and then they were stored in a fridge at +4°C, to solidify. A 2 mL sterile micro centrifuge tube was filled with 450 µL lyseringbuffer (0.5 mol / l EDTA pH 8.0, sarkosyl 1 %), and 50 µL lysozyme, and then the plug from the well was transferred to this tube. The plugs were incubated at 37 °C for one hour and then they were washed by 1x TE-buffer (10mM Tris pH 7.5, 1mM EDTA pH 7.5). The DNA plugs were incubated 24 hours at 55 °C in 1 ml Proteinase K-buffer (substrate in Huddinge hospital), and 20 µL Proteinase K. Day 3 The DNA plugs were washed four times in 1 x TE-buffer for 30 minutes, and then stored in 1 ml 1x TE-buffer in a fridge at +4 °C. The samples can keep up till 6 months if the buffer is changed every month.

10
Restriction enzyme digestion 1/3 of each plug was cut and transferred to 1x buffer D (Promega, WI, USA), for 15 minutes at room temperature. The plugs were then transferred to a tube containing a restriction enzyme mixture (175 µL distilled water, 20 µL 10 buffer D and 5µL XbaI enzyme, Promega, WI, USA). The tubes were incubated over night at 37 °C to digest the E. coli DNA. Gel electrophoresis A 2% gel was prepared by using molecular grade agarose in 120 ml of 0.5x TBE diluted by distilled water from 10x TBE stock (108 g Tris base, 55 g Boric acid, 40 ml M EDTA pH 8.0 and distilled water to a volume of 1000 ml) and poured into a freshly cleaned gel-casting frame, once the agarose had cooled to 60 °C. The gel tray and comb were wiped with alcohol and a lint-free tissue immediately prior to pouring the agarose in order to avoid dust particles, which can cause speckling in the gel. Once set, the gel was positioned centrally in the contour-clamped homogeneous electric field (CHEF) (Bio-Rad, Hercules, CA, USA) tank and covered with 1200 mL of 0.5x TBE. The running temperature was set at 14 °C. The recommended reference E. coli HS150 was positioned in the first, in the last, and in the middle well to allow later normalization of electrophoresis patterns across the gel. The total run time was 20 hours, the first block switch time was 5.3 sec. and the second-block switch time was 34.9 sec. The voltage was 6 V/cm or 200 V. For the CHEF Mapper system, the included angle was 120° and the ramp factor was linear. The gels were stained for 30 to 45 minutes in ethidium bromide (1 µg/ml) and destined for 30 to 45 minutes in tab-water. Gels were viewed under UV transillumination and photographed. Digital images were stored electronically as TIFF files and analyzed visually. PFGE pattern analysis Grouping of PFGE genotypes and subtypes was done by visual evaluation. The following criteria were used for the visual analyses according to Tenover: to interpret the SNA fragment patterns generated by PFGE and transform them into epidemiological useful information, the microbiologist must understand how to compare PFGE patterns and how random genetic events can alter the patterns. If the PFGE patterns isolates are not distinguishable from each other but distinctly are different from those of epidemiologically unrelated strains, they are representing the outbreak strain. During the course of an outbreak PFGE patterns are under alteration by random genetic events, including point mutation and insertions and deletions of DNA. These alterations make difficulty in interpretation of the patterns. Microbiologists assign correctly the pattern of each isolate to one of the four categories by knowing effects of such genetic events on the patterns: indistinguishable from the outbreak pattern, closely related to the outbreak pattern, possibly related to the outbreak pattern, or unrelated to the outbreak pattern. The criteria proposed herein are reliable if PFGE resolves at last 10 distinct fragments. When fewer bands are detected, the robustness and discriminatory ability of the criteria are unknown, Table: 1(27, 39).

11
Table 1: Criteria for interpreting PFGE patterns (27).
The goal of strain typing studies is to provide laboratory evidence that epidemiologically related isolates collected during an outbreak of disease are also genetically related and thus represent the same strain. This information helps to understand and control the spread of disease in both hospitals and communities. If one wants to use the results of strain typing for infection control decisions, it is of importance to consider that; (i) isolates representing the outbreak strain are the recent progeny of a single (or common) precursor, (ii) such isolates will have the same genotype, and (iii) epidemiologically unrelated isolates will have different genotypes. In practice, typing is most effective as an aid to outbreak investigation when it is applied to small set of isolates that are epidemiologically related –like the present study with just ninety three isolates-. The isolates should be obtained from patients and environmental sources that are related to (i) the area in which infections are occurring –two adjacent hospitals in southern Stockholm-, (ii) the period during which the infections occurred –last six months in the year 2002-, and (iii) a common source of infection –urine and wound origins- (8, 27). Typing studies performed on isolates for which epidemiologic information is not and will not be available may produce misleading information. Strain typing data do not substitute for epidemiologic data. Rather, the two datasets should be developed independently but analyzed together to determine whether an outbreak has occurred (27).
12
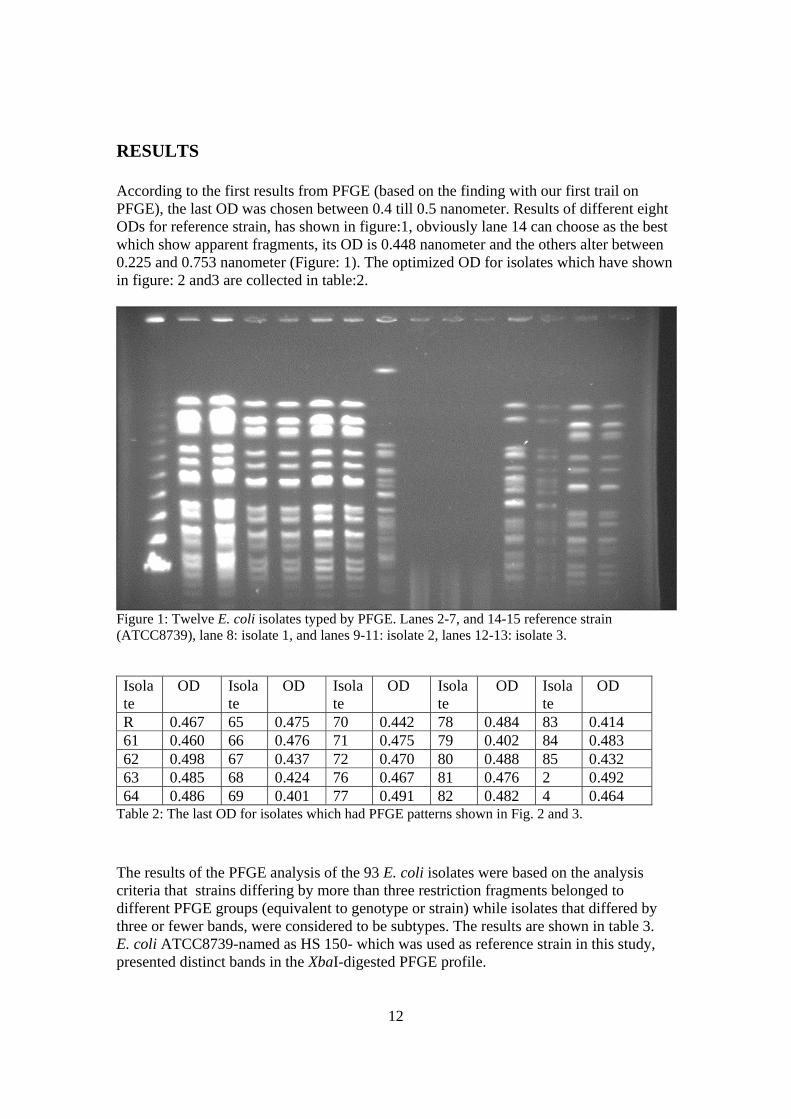
RESULTS According to the first results from PFGE (based on the finding with our first trail on PFGE), the last OD was chosen between 0.4 till 0.5 nanometer. Results of different eight ODs for reference strain, has shown in figure:1, obviously lane 14 can choose as the best which show apparent fragments, its OD is 0.448 nanometer and the others alter between 0.225 and 0.753 nanometer (Figure: 1). The optimized OD for isolates which have shown in figure: 2 and3 are collected in table:2.
Figure 1: Twelve E. coli isolates typed by PFGE. Lanes 2-7, and 14-15 reference strain (ATCC8739), lane 8: isolate 1, and lanes 9-11: isolate 2, lanes 12-13: isolate 3. Isolate
OD Isolate
OD Isolate
OD Isolate
OD Isolate
OD
R 0.467 65 0.475 70 0.442 78 0.484 83 0.414 61 0.460 66 0.476 71 0.475 79 0.402 84 0.483 62 0.498 67 0.437 72 0.470 80 0.488 85 0.432 63 0.485 68 0.424 76 0.467 81 0.476 2 0.492 64 0.486 69 0.401 77 0.491 82 0.482 4 0.464
Table 2: The last OD for isolates which had PFGE patterns shown in Fig. 2 and 3. The results of the PFGE analysis of the 93 E. coli isolates were based on the analysis criteria that strains differing by more than three restriction fragments belonged to different PFGE groups (equivalent to genotype or strain) while isolates that differed by three or fewer bands, were considered to be subtypes. The results are shown in table 3. E. coli ATCC8739-named as HS 150- which was used as reference strain in this study, presented distinct bands in the XbaI-digested PFGE profile.

13
Group Bacteria A (10.7%) 28, 38, 44, 48, 54, 55, 57, 60, 67, 50 B (22.5%) 1, 11, 17, 30, 19, 73, 74, 75, 77, 81, 82, 83, 84, 85, 87, 88, 89, 90,
91, 92, C1 (22.5%) C2 (7.51%)
3, 7, 12, 13, 14, 18, 20, 21, 23, 31, 39, 40, 42, 45, 59, 62, 63, 65, 66, 69, 71 24, 25, 35, 36, 41, 47, 68
D (12.9%) 4, 6, 8, 16, 27, 34, 37, 43, 58, 64, 70, 93 E (19.3%) 5, 9, 10, 15, 22, 26, 29, 32, 33, 46, 49, 51, 52, 53, 56, 61, 72, 86 F (4.3%) 76, 78, 79, 80
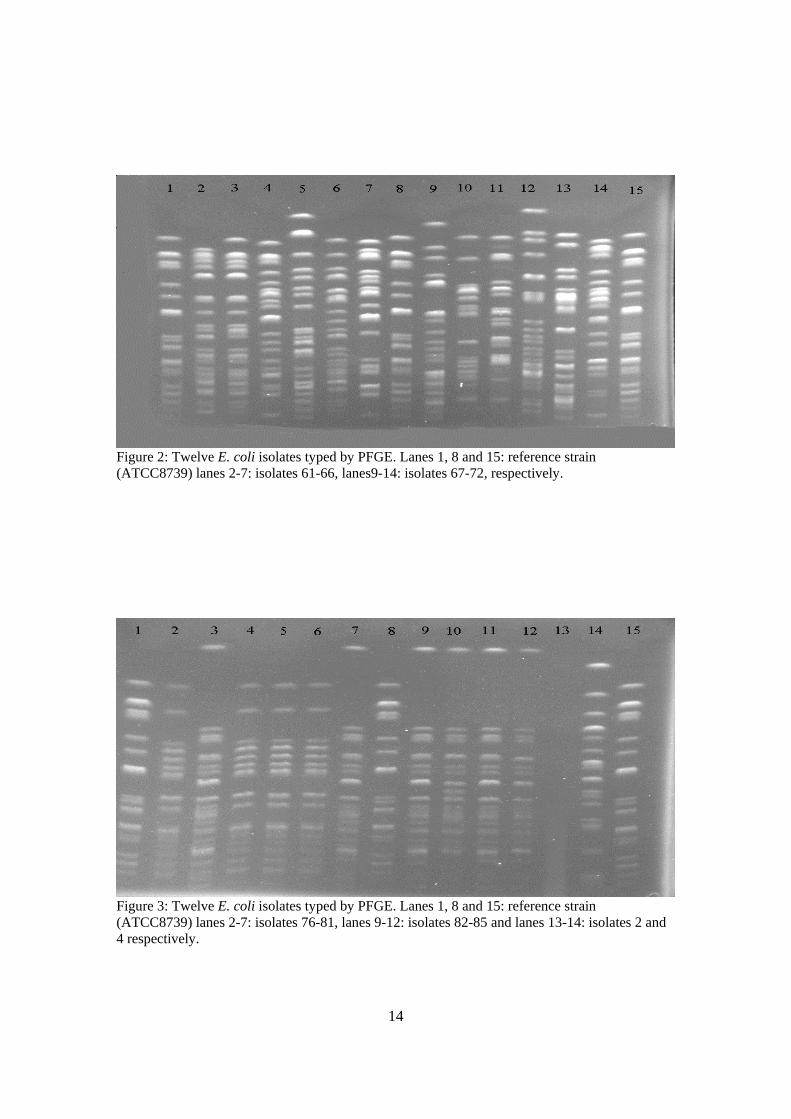
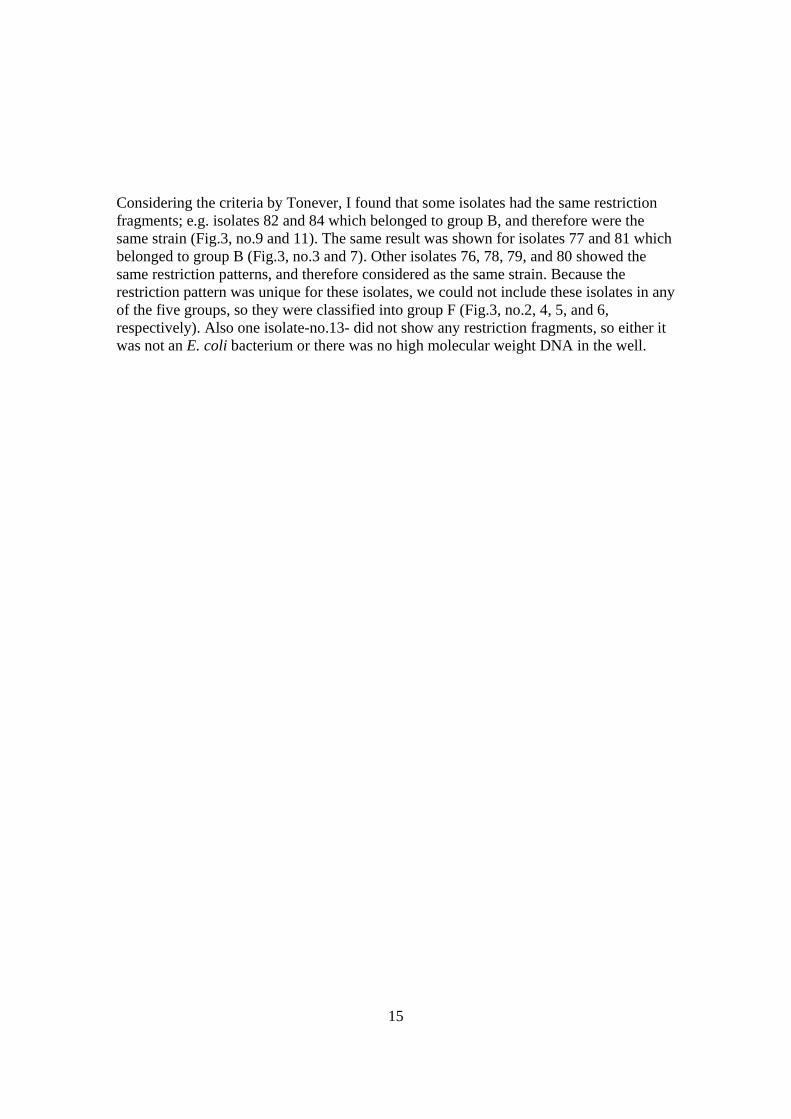
Table3: Ninety three isolates were grouped in five subtypes: 10 isolates belonged to group A, 21 bacteria in group B, 28 of them belonged to group C1 and C2, 12 bacteria in group D and 18 bacteria in group E. Isolates 76, 78, 79, and 80 have shown exactly same fragments, they were classified to group F, isolate 2 was not E. coli (Fig.3). Results in table 3 and figure 2, show that isolates 62, 63, 65, 66, 69, and 71 (no. 3, 4, 6, 7, 11, and 13 respectively in Fig.2) belonged to group C1, since their first restriction fragment is exactly same as in reference HS150 (no.1, 8, and 15 in Fig.2). Isolate 68 (no.10 in Fig.2) also started at the same position as other isolates in group C1, but then differed by more than three restriction fragments. Therefore, it belonged to another subtype named as C2. Isolate 67 (no.9 in Fig.2) belonged to group A, where the first restriction fragment was larger than reference HS150. Those isolates that belonged to group E, contained the largest restriction fragment starting at the second rod compared with reference HS150 like isolates 61 and 72 (no.2 and 14 in Fig.2). There were also examples of group D in Fig.2, with the largest restriction fragment starting at the third rod compared with the reference HS150. Isolates 64 and 70 (no.5 and 12) belonged to group D. From figure 3, it was clear that another group-named group B- could be identified, which showed one larger fragment and then no fragments until fifth rod of the reference HS 150. Isolates 77, 81, 82, 83, 84, and 85 (no.3, 7, 9, 10, 11, and 12, respectively in Fig.3) belonged to group B. Isolate 4 (no.14 in Fig.3) belonged to group D which already has been explained. Further gel images belong to other isolates and results from analyses of how they were grouped are shown at the end of this paper.
14
Figure 2: Twelve E. coli isolates typed by PFGE. Lanes 1, 8 and 15: reference strain (ATCC8739) lanes 2-7: isolates 61-66, lanes9-14: isolates 67-72, respectively.
Figure 3: Twelve E. coli isolates typed by PFGE. Lanes 1, 8 and 15: reference strain (ATCC8739) lanes 2-7: isolates 76-81, lanes 9-12: isolates 82-85 and lanes 13-14: isolates 2 and 4 respectively.
15
Considering the criteria by Tonever, I found that some isolates had the same restriction fragments; e.g. isolates 82 and 84 which belonged to group B, and therefore were the same strain (Fig.3, no.9 and 11). The same result was shown for isolates 77 and 81 which belonged to group B (Fig.3, no.3 and 7). Other isolates 76, 78, 79, and 80 showed the same restriction patterns, and therefore considered as the same strain. Because the restriction pattern was unique for these isolates, we could not include these isolates in any of the five groups, so they were classified into group F (Fig.3, no.2, 4, 5, and 6, respectively). Also one isolate-no.13- did not show any restriction fragments, so either it was not an E. coli bacterium or there was no high molecular weight DNA in the well.

16
DISCUSSION Escherichia coli is a common pathogen and has been reported from many hospitalized patients recently. During the June till October 2002, samples were collected from patients in two adjacent hospitals in southern Stockholm, according to previous research done by Fang and colleagues (8). Ninety three of all resistant E. coli isolates produced ESBLs were collected for this study. Subtyping of isolates to the strain level has been increasingly important in order to verify if organisms are clonally related, i.e. have a common origin in suspected nosocomial outbreaks or possible cross-transmission events (36). Several approaches have been used for subtyping of bacterial isolates, including both phenotyping and genotyping so called fingerprinting methods; flagellin typing (Fla), random amplified polymorphic DNA (RAPD), amplified fragment length polymorphism (AFLP), multilocus enzyme electrophoresis (MEE), nucleotide sequencing (NS), polymerase chain reaction (PCR) and pulse field gel electrophoresis (PFGE) (40).Genotyping methods may be compared on the basis of a range of criteria, including sensivity, availability, reproducibility, rapidity, ease of use, and cost. One of the most important characteristic is discriminatory power of the technique (40). With these points of importance, during my experiments, I considered that PFGE is a method which has some disadvantages, the long time required and the cost of equipment and also restriction enzyme are considerable. These methods must fulfill several criteria in order to be useful. All methods have in common that they must have the power to clearly differentiate between unrelated strains, demonstrate relationship for isolates originated from the same strain and be reproducible. Further, each method must be evaluated and optimized for each species it will be applied to. PFGE is a genomic based method that has been successfully used for the subtyping of several bacterial species (28, 35). In a previous study where PFGE and AP-PCR were compared for genotyping of Helicobacter pylori, it was revealed that both methods discriminated the bacterial strains equally well (36). In a previous study, the PFGE method was used for identification of nosocomial outbreaks of E. coli producing ESBLs in Stockholm (28). The main aim of the present project was to optimize the PFGE method, and to investigate and identify the outbreak strain. The first parameter which I need to optimize was the best OD for bacterial suspension in the preparing step. By choosing one isolate and also reference strain and then making almost 10 different OD between 0.2 until 0.7 nanometer, the optimized OD was something between 0.4 and 0.5 nanometer, because the PGFE patterns in this range have shown qualified patterns, distinct and apparent, which is very important in comparing fragments visually. The minimum consume time for doing PFGE is five days, according to the protocol which I used as reference in material and method part (31). I used a comb with 15 sample places, three of them belonged to references, it means any time I was able to run just 12

17
samples, considering the number of samples (93), and double check (+93), it takes almost long time to get the results, although this was a small project. The outbreak of nosocomial bacteria is of great importance. Recently, researchers warned about an epidemic outbreak in Europe (7, 20). Potential difficulties may arise when using PFGE to analyze epidemiological scenarios involving large numbers of study centers or long timescales (41). PFGE has been used in many studies to show the international spread of Methicillin-Resistant Staphylococcus Aureus (MRSA), and the criteria used for microepidemiological analyses have frequently been employed (41). According to another report, the major disadvantage of PFGE and other methods that compare DNA fragments on gel is the difficulty of comparing the results obtained in different laboratories, even when reagents and conditions are standardized (39). The restriction enzyme which is the most important effectors for producing DNA fragments in PFGE, is of importance. It is specific for each bacteria, and I used the XbaI enzyme which was isolated from the Xanthomonas badrii bacterium and which recognizes the nucleotide sequence 5'...T/CTAGA...3' 3'...AGATC/T...5' in the DNA of E. coli isolates (15, 16). As I mentioned before, the cost of the restriction enzyme, is a disadvantage of the PFGE technique (33). According to Hong and colleagues (8), they detected two clones of isolates as outbreak. During this work I used some of these isolates for genotyping. When I compared my results (fig. 3) with their findings, I found that some of them are the same strain. Isolates 3 and 7, also isolates 9 and 11 in figure 3, which included clone one are the same strain, because they show exactly the same PFGE patterns. Isolates 4 and 5, and also isolates 6 and 2 in figure 3 showed the same PFGE patterns as clone two. These isolates belonged to the same strain. However, further analyses is necessary in order to confirm this. For example, if I would have useed another restriction enzyme and I would have received the same result, then those two strains could be confirmed as the same. Other technique could also help in further confirmation. According to my genotyping, the isolates which were identified as clone one in the previous study (77, 81, 85, 84, 82, 74, 73, 83, and 75), were in group B. Other isolates of clone two (79, 76, 78, and 80), were considered as group F. According to the data that Hong and colleagues (8) showed all of the isolates came from the same source (urine or wound) although from different patients, . Tenover criteria (27) are very simple and helpful for genotyping a group of bacteria which are related and closed together. It seems that by optimizing the PFGE technique as I have described in this work, and by using the Tenover criteria, I managed to get the right results and to group the isolates into their respective groups. Before PFGE can be considered reliable for typing a given bacterial species, the technique must be validated by demonstrating that when restriction fragment patterns are

18
analyzed by PFGE, epidemiologically unrelated isolates generate unique fragment patterns and epidemiologically related isolates generate indistinguishable or, on occasion, closely related fragment patterns. Discriminatory power and reproducibility are important attributes in any typing system. For most of the common bacterial pathogens, the validity of PFGE for molecular typing is well established (27). PFGE is the genotyping method proven to be superior to most other biochemical and molecular typing methods with its high discriminatory powers regarding different bacterial strains. However, the method is time-consuming and the whole procedure can take as long as four days. This may reduce the ability to analyze large numbers of isolates; it is also an expensive method that requires sophisticated equipment (37). Considering that the PFGE method takes a long time, in another study, they found that PCR melting profile (PCR-MP) technique is a rapid method that offers good discriminatory power, excellent reproducibility and may be applied for epidemiological studies. They suggested that there is at least a similar power of discrimination between the present gold standard PFGE and a PCR MP method. Data presented there demonstrate the complexity of the epidemiological concerning E.coli that may occur in a hospital (33). The increased development of resistant strains causing severe nosocomial infections has been a major driving force for the development of new antibiotics but more importantly to find a way of preventing the spread. Better hygienic procedure in hospital and improved isolation of patients have shown to limit the spread of resistant strain (15).Rapid diagnosis of pathogens, minimizing the use of invasive devices and a rational use of antimicrobials may also limit or even prevent the spread of resistant strains. Epidemiological studies regarding dissemination pathways of potential pathogens in the community and hospital wards are of great importance.

19
REFERENCES
1- Akil I., Yilmaz O., Kuruepe S., Deqwrli K., Kavukcu S.Influenceof oral intake of Saccharomyces boulardii on Escherichia coli in entric flora. Pdiatr. Nephrol 21 (6), 807-810 (2006).
2- Rendon MA., Puente JC., Erdem AC., Monterio V., Vazques A., Kupar JB., Giron JA. Commensal and pathogenic Escherichia coli use a common pilus adherence factor for epithelial cell colonization. Pro. Nat. Acad. Sci. USA. 104 (25), 10637-10642 (2007).
3- Shulman ST., Friedmann HC., Sims RH. Theodor Escherich: the first pediatric in fectious disease physician. Clin. Infect. Dis. 45 (8), 1025-1029 (2007).
4- Goldwater PN. Treatment and prevention of Escherichia coli infection and hemolytic uremic syndrome. Expert Rev. Anti. Infect. Ther. 5(4), 653-663 (2007).
5- Anatoliotaki M., Galanakis E., Schinaki A., Stefanaki S., Mavrokosta M., Tsilimiqaki A. Antimicrobial resistance of urinary tract phatogens in children in Crete, Greece. Scand. J. Infect. Dis. 39 (8), 671-675 (2007).
6- http://en.wikipedia.org/wiki/Escherichia_coli 7- Cars O., Söderblom T., Struwe J. Resistenta tarmbakterier med ESBL-
sammaställning av de första sex månadernas anmälningar. Published by smittskuddsinstitutet (Swedish Institue for Infectious Disease) EPI-aktuellt, Vol. 6, nr. 38 (20 sseptember 2007).
8- Hong Fong, Christina Lundberg, Barbro Olsson, Göran Hedin, Emma Lindbäck, Åsa Rosenberg, and Johan Stuwe. Molecular epidemiological analysis of Escherichia coli isolates producing Extended-Spectrum beta Lactamases for identification of nosocomial outbreks in Stockholm, Sweden. Journal of Clinical Microbiology 42, 5917-5920 (2004).
9- Harbak. Clinically important beta-lactamases of gram-negative bacteria: extended-spectrum beta-lactamases (ESBL). Epidemiol. Mikrobil. Imunol. 56 (3), 103-111 (2007).
10- http://en.wikipedia.org/wiki/Beta-Lactamase 11- Rossolini GM., Docquier JD. New beta-lactamases: a paradigm for the rapid
response of bacterial evolution in the clinical setting. Future. Microbiol. 1, 295-308 (2006).
12- Bradford, P. A. Extended-spectrum beta-lactamases in the 21th century: characterization, epidemiology, and detection of this important resistance threat. Clin. Mirobiol. Rev. 14, 933-951 (2001).
13- Goering, R.V. Pulsed-field gel electrophoresis. In: Persing,D.H., Tenover, F.C., Versalovic, J., Tang, Y-W., Unger, E.R., Relman, D.A., and White, T.J., editors. Molecular Microbiology; Diagnostic Principles and Practice. Washington, D.C.: American Society for Microbiology; 2004: 185-196.
14- http://www.medvetnet.org/cms/templates/doc.php 15- G. Chu. Pulsed-Field Gel Electrophoresis: Theory and practice. Methods: A
comparison to methods in enzymology 2, 129-142 (1990). 16- R. Goering. Molecular epidemiology of nosocomial infection: Analysis of
chromosomal restriction fragments patterns by PFGE. Infect. Control Hosp. Epidemiol. 14, 595-600 (1993).

20
17- Manninen R., Auvienen H., Hoovinen P. Resistance to second and third-generation cephalosporins among Escherichia coli and Klebsiella species is rare in Finland. Clin. Microbiol. Infect. 3, 408-413 (1997).
18- http://www.defra.gov.uk/animalh/diseases/zoonoses/esbl.htm 19- Garan J., Xercavins M., Kodriquez M., Gome Z., Vera JR., Coll I., Vidal D.,
Liovet T., Ruiz A. Emergence and dissemination of quinolone-resistant Escherichia coli in the community. Antimicrob Agents chemother. 43 (11), 2736-2741 (1999).
20- David M. Livermore, Rafael Canton, Marek Ginadkowski, Patrice Nordman, Gian Maria Rossolini, Guillaume Arlet, Teresa M. Coque, Juan Ayala, Izabela Kern-Zdanowicz, Francesco Luzzaro, Laurent Poirel and Neil Woodford.CTX-M: Changing the face of ESBLs in Europe. Journal of Antimirobial Chemotherapy 59, 165-174 (2007).
21- L. Vali, A. Hamouda, M.C. Pearce, H. I. Knight, J. Evans and S.G.B. Amyes. Detection of genetic disversity by PFGE among E. coli 0157 isolated from bovine faecal samples by immunomagnetic separation technique. Letters in Applied Microbiology 44, 19-23 (2007).
22- Stephens TP., Loneragan GH., Chaney WE., Branham LA., Brashears MM. Development and validation of a most probable number immunomagnetic Escherichia coli O157 in cattle feces. J. Food. Prot. 70 (5), 1072-1075 (2007).
23- Mohapatra BR., Broersma K., Nordin R., Mazmder A. Evaluation of repetitive extragenetic palindromic-PCR for discrimination of fecal Escherichia coli from human and different domestic and wild-animals. Microbiol. Immunol. 51 (8), 733-740 (2007).
24- Naseer U., Natås OB., Haldorsen BC., Bue B., Gundt H., Walsh TR., Sundsfjord A. Nosocomial outbreak of CTX-M-15-producing Escherichia coli in Norway. APMIS. 115 (2), 120-126 (2007).
25- Swaminathan B., Barrett, T.J., Hunter, S.B., Tauxe, R.V., and CDC PulseNet Task force. PulseNet: the molecular subtyping network for foodborne bacterial disease surveillance, United States. Emerg. Infect. Dis. 7, 382-389 (2001).
26- Outbreaks of multi-drug resistant Escherichia coli in long-term care facities in the Durham, York and Torento regions of Ontario. Canada Communicable Disease Report 28, 14-16 (2002).
27- Fred C. Tenover, Robert D. Arbeit, Richard V. Goerring, Patricia A. Mickelsen, Barbara E. Muuay, David H. Persing, and Bala Swaminathan. Guest Commentary: Interpreting chromosomal DNA restriction produced by Pulsed-Field Gel Electrophoresis: Criteria for bacterial strain typing. Journal of Clinical Micribiology 33, 2223-2239 (1995).
28- Thierry Nass, Cynthia Oxacelay, and Patrice Nordmann. Identification of CTX-M-type Extended-Spectrum beta –Lactamase genes using real-time PCR and pyrosequencing. Antimicrobial Agents and Chemotherapy 51, 223-230 (2007).
29- Hansen D. S., Sirot D., Kolmos H. J. Extended spectrum beta-lactamases in Danish Klebsiella isolates. Ugeskr. Lager. 160, 2261-2262 (1998).
30- Richard V.Goering. Molecular Microbiology: diagnostic principles and practice. 2004 ASM Press, Wshington, D.C.

21
31- S. Murchan, M. Kaufman, A. Deplano, R. de Ryck, M. Struelens and collegues. Harmonization of PFGE protocols for epidemiological typing of strains of methicillin-resistant Staphylococcus aureus: a single approach developed by consensus in 10 European laboratories and its application for tracing the spread of related strains. Journal of Clinical Microbiology 41, 1574-1585 (2003).
32- Mato R., Lencastre H., Roberts R., Tomas A. Multiplicity of genetic backgrounds among vancomycin-resistant Enterococcus faecium isolates recovered from an outbreak in a New York City Hospital. Microbial Drug Resistance 3, 309-317 (19969.
33- B. Krawczyk, A. Sledzinska, A. Samet, M. Bronk, J. Komarnicka, J. Leibner, J. Kur. Molecular typing of clinical isolates of Escherichia coli by a new PCR method. 17th ECCMID, 31 March- 03 April 2007, Munich, Germany.
34- Thal, L. A., J. Silverman, S. Donabedian and M. J. Zervos. The effect of Tn916 insertions on contour-clamped homogeneous electrophoresis patterns of Enterococcus faecium . Journal of Clinical Micribiology 35, 969-972 (1997).
35- B. Murray, K. Singh, J. Don Heath, B. Sharma, G. Weinstock. Comparison of genomic DNAs of different enterococcal isolates using restriction endonucleases with infrequent recognition sites. Journal of Clinical Microbiology 9, 2059-2063 (1990).
36- I. Adamsson, C. Edlund, R. Seensalu, L. Engstrand. The use of AP-PCR and flaA-RFLP typing investigate treatment failure in Helicobacter pylori infection. Clinical Micribiology and Infection 6, 265-267 (2002).
37- D.M. Olive and P. Bean. Principles and applications of methods for DNA-based typing of microbial organisms. Journal of Clinical Microbiology 37, 1661-1669 (1999).
38- Jessica E., Cooper and Edward J., Feil. Multilocus sequence typing – What is resolved? TRENDES in Microbiology. 12 (8), 373-377 (2004).
39- Mark C. Enright, Nicholas P. J. Day, Catrin E. Davies, Sharon J. Peacock, Brian G. Spratt. Multilocus sequence typing for characterization of methicillin-resistant and methicillin-susceptible clones of Staphylococcus aureus. JCM. 38 (3), 1008-1015 (2000).
40- Trudy M. Wassenaar and Diane G. Newell. Minireview, Genotyping of Campylobacter spp. Ap. and Env. Microbiol. 66 (1), 1-9 (2000).
41- Barry D. Cookson, Mark C. Enright and theur colleagues. Evaluation of molecular typing in characterizing a European collection of epidemic methicillin-resistant Staphylococcus aureus, strain: the HARMONY collection. JCM. 45 (6), 1830-1837 (2007).
22
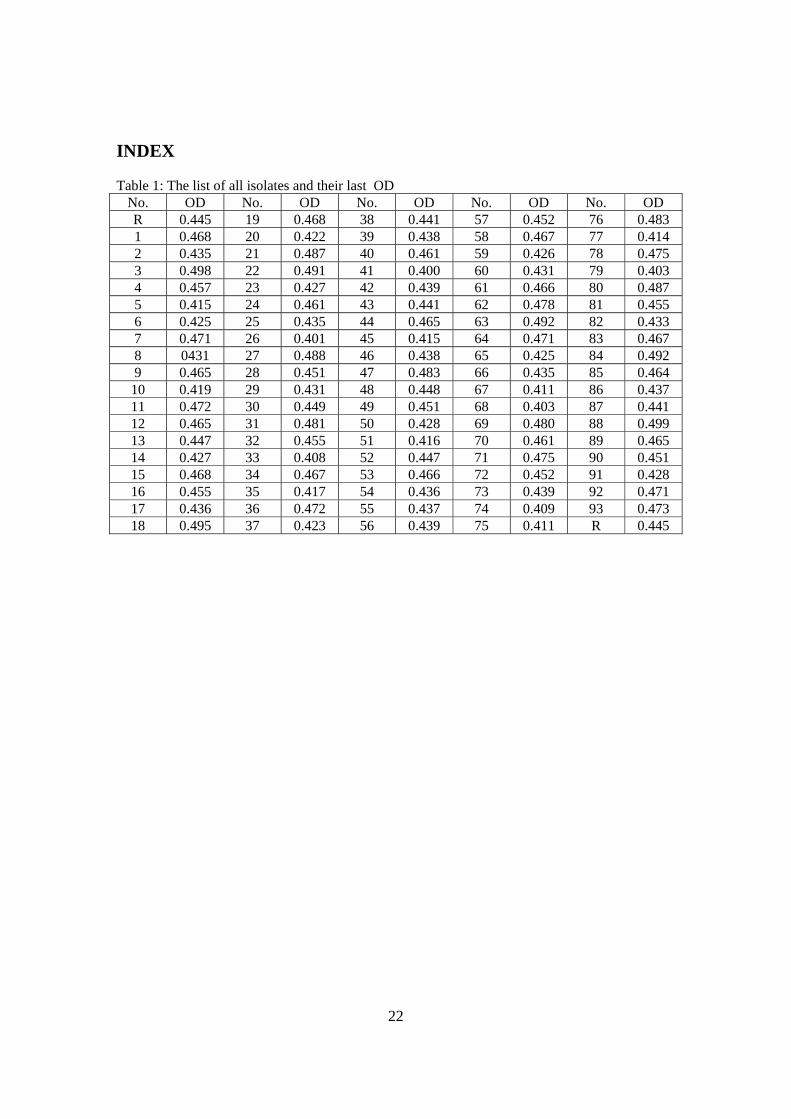
INDEX Table 1: The list of all isolates and their last OD
No. OD No. OD No. OD No. OD No. OD R 0.445 19 0.468 38 0.441 57 0.452 76 0.483 1 0.468 20 0.422 39 0.438 58 0.467 77 0.414 2 0.435 21 0.487 40 0.461 59 0.426 78 0.475 3 0.498 22 0.491 41 0.400 60 0.431 79 0.403 4 0.457 23 0.427 42 0.439 61 0.466 80 0.487 5 0.415 24 0.461 43 0.441 62 0.478 81 0.455 6 0.425 25 0.435 44 0.465 63 0.492 82 0.433 7 0.471 26 0.401 45 0.415 64 0.471 83 0.467 8 0431 27 0.488 46 0.438 65 0.425 84 0.492 9 0.465 28 0.451 47 0.483 66 0.435 85 0.464 10 0.419 29 0.431 48 0.448 67 0.411 86 0.437 11 0.472 30 0.449 49 0.451 68 0.403 87 0.441 12 0.465 31 0.481 50 0.428 69 0.480 88 0.499 13 0.447 32 0.455 51 0.416 70 0.461 89 0.465 14 0.427 33 0.408 52 0.447 71 0.475 90 0.451 15 0.468 34 0.467 53 0.466 72 0.452 91 0.428 16 0.455 35 0.417 54 0.436 73 0.439 92 0.471 17 0.436 36 0.472 55 0.437 74 0.409 93 0.473 18 0.495 37 0.423 56 0.439 75 0.411 R 0.445
23
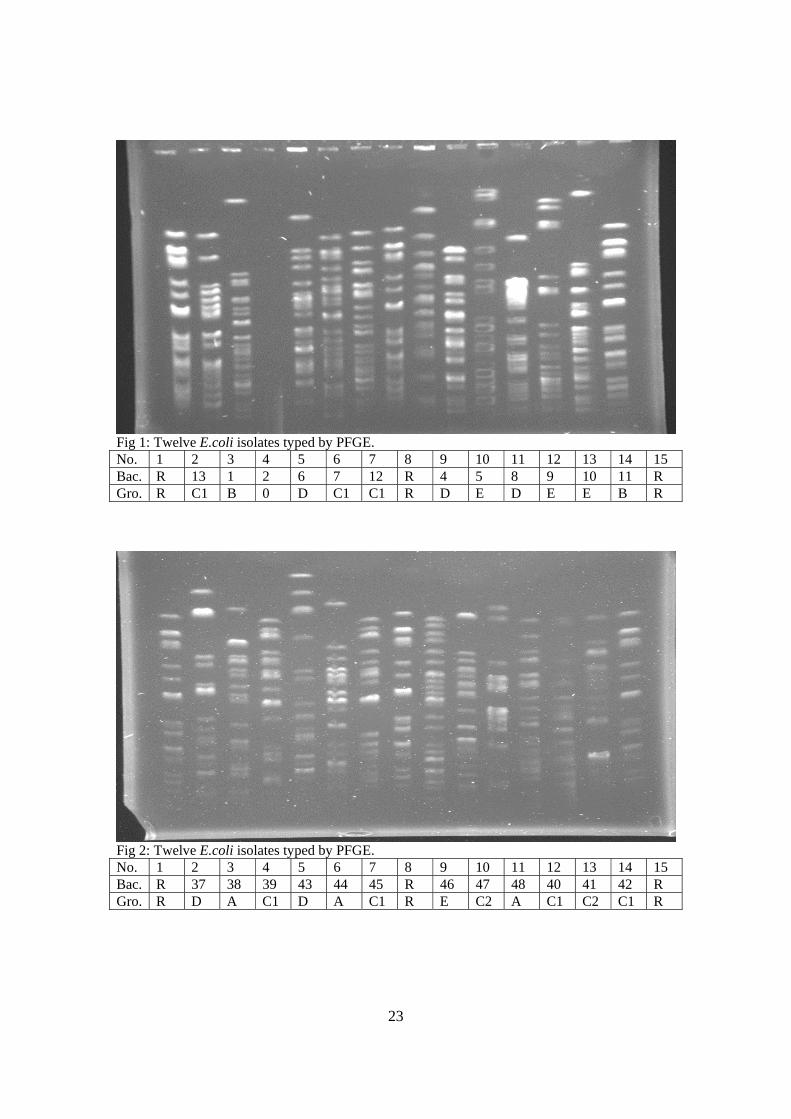
Fig 1: Twelve E.coli isolates typed by PFGE. No. 1 2 3 4 5 6 7 8 9 10 11 12 13 14 15 Bac. R 13 1 2 6 7 12 R 4 5 8 9 10 11 R Gro. R C1 B 0 D C1 C1 R D E D E E B R
Fig 2: Twelve E.coli isolates typed by PFGE. No. 1 2 3 4 5 6 7 8 9 10 11 12 13 14 15 Bac. R 37 38 39 43 44 45 R 46 47 48 40 41 42 R Gro. R D A C1 D A C1 R E C2 A C1 C2 C1 R
24
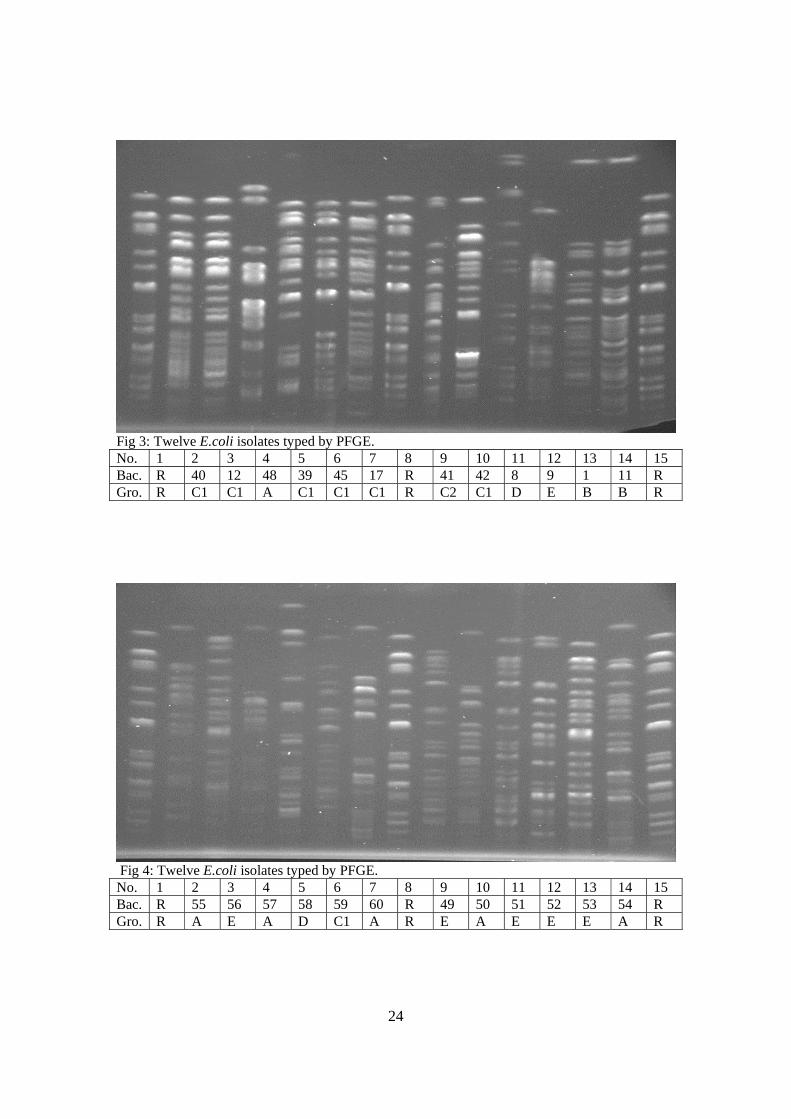
Fig 3: Twelve E.coli isolates typed by PFGE. No. 1 2 3 4 5 6 7 8 9 10 11 12 13 14 15 Bac. R 40 12 48 39 45 17 R 41 42 8 9 1 11 R Gro. R C1 C1 A C1 C1 C1 R C2 C1 D E B B R
Fig 4: Twelve E.coli isolates typed by PFGE. No. 1 2 3 4 5 6 7 8 9 10 11 12 13 14 15 Bac. R 55 56 57 58 59 60 R 49 50 51 52 53 54 R Gro. R A E A D C1 A R E A E E E A R

25
Fig 5: Twelve E.coli isolates typed by PFGE. No. 1 2 3 4 5 6 7 8 9 10 11 12 13 14 15 Bac. R 20 21 22 23 24 25 R 13 4 30 8 35 36 R Gro. R C1 C1 E C1 C2 C2 R C1 D B D C2 C2 R
Fig 6: Twelve E.coli isolates typed by PFGE. No. 1 2 3 4 5 6 7 8 9 10 11 12 13 14 15 Bac. R 14 15 16 17 18 19 R 27 6 41 9 8 34 R Gro. R C1 E D B C1 B R D D C2 E D D R

26
Fig 7: Twelve E.coli isolates typed by PFGE. No. 1 2 3 4 5 6 7 8 9 10 11 12 13 14 15 Bac. R 60 55 38 28 56 57 R 3 31 48 59 44 5 R Gro. R A A A A E A R C1 C1 A C1 A E R
Fig 8: Twelve E.coli isolates typed by PFGE. No. 1 2 3 4 5 6 7 8 9 10 11 12 13 14 15 Bac. R 86 73 74 75 87 88 R 89 90 91 92 9 17 R Gro. R E B B B B B R B B B B E B R

27