genomically biased accumulation of seed storage … hu,* norma l. houston,†,1 dharminder...
TRANSCRIPT

- 1 -
Genomically biased accumulation of seed storage proteins in
allopolyploid cotton
Guanjing Hu,* Norma L. Houston,†,1 Dharminder Pathak,*,2 Linnea Schmidt,*,3
Jay J. Thelen† and Jonathan F. Wendel*
*Department of Ecology, Evolution, and Organismal Biology, Iowa State University,
Ames, IA 50011
†Division of Biochemistry and Interdisciplinary Plant Group, Christopher S. Bond
Life Sciences Center, University of Missouri, Columbia, MO 65211
1 Present address: DuPont Corporation, Wilmington, DE 19805 2 Present address: Department of plant breeding and Genetics, Punjab Agricultural University, Ludhiana, Punjab, India 3 Present address: Anschutz Medical Campus, University of Colorado, Aurora, CO 80045
Genetics: Published Articles Ahead of Print, published on September 9, 2011 as 10.1534/genetics.111.132407
Copyright 2011.
- 2 -
Running title
Proteomic analysis of seed proteins in allopolyploid and diploid cotton
Key words
polyploidy, comparative proteomics, Gossypium, biased expression
Corresponding author
Jonathan F. Wendel
Department of Ecology, Evolution, and Organismal Biology, Iowa State University,
Ames, IA 50011
Email address: [email protected]
Phone: 515-294-7172
Fax: 515-294-1337
- 3 -
ABSTRACT
Allopolyploidy is an important process during plant evolution that results in the
reunion of two divergent genomes into a common nucleus. Many of the immediate as
well as longer-term genomic and epigenetic responses to polyploidy have become
appreciated. To investigate the modifications of gene expression at the proteome level
caused by allopolyploid formation, we conducted a comparative analysis of cotton
seed proteomes from the allopolyploid G. hirsutum (AD-genome) and its model A-
genome and D-genome diploid progenitors. An unexpectedly high level of divergence
among the three proteomes was found, with about one-third of all protein forms being
genome-specific. Comparative analysis showed that there is a higher degree of
proteomic similarity between the allopolyploid and its D-genome donor than its A-
genome donor, reflecting a biased accumulation of seed proteins in the allopolyploid.
Protein identification and genetic characterization of high abundance proteins
revealed that two classes of seed storage proteins, vicilins and legumins, comprise the
major component of cotton seed proteomes. Analyses further indicate differential
regulation or modification of homoeologous gene products, as well as novel patterns
in the polyploid proteome that may result from the interaction between homoeologous
gene products. Our findings demonstrate that genomic merger and doubling have
consequences that extend beyond the transcriptome into the realm of the proteome,
and that unequal expression of proteins from diploid parental genomes may occur in
allopolyploids.

- 4 -
INTRODUCTION
Genome doubling, or polyploidization, is a phenomenon prevalent in eukaryotes and
particularly in higher plants. Genomic studies indicate that all angiosperm species
have undergone at least two rounds of polyploidization during their evolutionary
history, with most lineages having experienced additional whole genome duplications
(Cui et al. 2006; Jiao et al. 2011). Allopolyploid species are particularly intriguing in
that their formation entails the merger of diverged genomes, which often results in
myriad dramatic and large-scale genomic and transcriptomic responses (Wendel
2000; Comai 2005), including structural and epigenetic modifications (Shaked et al.
2001; Gaeta et al. 2007; Buggs et al. 2009; Ha et al. 2009; Schnable et al. 2011), as
well as changes in gene expression (Wang et al. 2006; Bottley and Koebner 2008;
Flagel et al. 2008; Hovav et al. 2008; Flagel et al. 2009; Rapp et al. 2009; Flagel and
Wendel 2010; Koh et al. 2010). Compared to their progenitors, polyploids often
display different physiological, morphological and ecological phenotypes (Pires et al.
2004; Gaeta et al. 2007; Anssour et al. 2009; Ni et al. 2009; Ramsey 2011), which
suggests functional and phenotypic evolution may be driven by these genomic
changes.
Notwithstanding these and other recent insights into the genomic and transcriptomic
consequences of genomic merger and doubling, the fate of translated gene products, i.
e., the proteome, remains poorly studied in the context of polyploidization. Because
protein levels are influenced by post-translational processing and inherent variation in
stability, it is difficult to infer the representation and regulation of proteins and
participating metabolic pathways from transcriptomic data alone, and the correlation
between protein and transcript expression levels has been shown to vary extensively
- 5 -
depending on the system being analyzed and profiling approach used (Hajduch et al.
2010). As proteins represent the key players in cellular activities, characterizing the
proteome using appropriately targeted approaches constitutes an important component
of the evolutionary analysis of polyploidy and its consequences. A classical proteomic
technique, two-dimensional gel electrophoresis (2-DE), has the potential to assess the
expression patterns of proteins displayed by polyploid species relative to their diploid
progenitors, as demonstrated in Brassica (Albertin et al. 2005; Albertin et al. 2006;
Albertin et al. 2007). This technique allows the resolution of hundreds of protein
spots within a single gel, which are accessible to identification through Mass
Spectrometry (MS) analysis; moreover, some post-translational modifications
corresponding to protein activities can be inferred via interpretation of the on-gel and
MS properties. This comparative quantification of resolved spot profiles permits a
proteome-scale comparison of the polyploid and its parental species.
Over the past decade, Gossypium has emerged as a model for studies of polyploidy,
particularly with respect to the genomic and transcriptomic consequences of
allopolyploidization (Adams et al. 2003; Senchina et al. 2003; Grover et al. 2004;
Grover et al. 2007; Flagel et al. 2008; Hovav et al. 2008; Chaudhary et al. 2009;
Flagel et al. 2009; Rapp et al. 2009; Flagel and Wendel 2010; Salmon et al. 2010). As
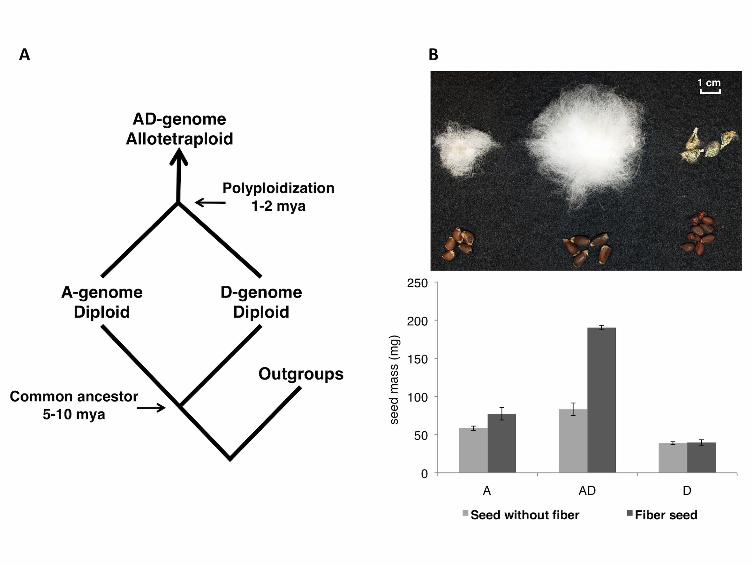
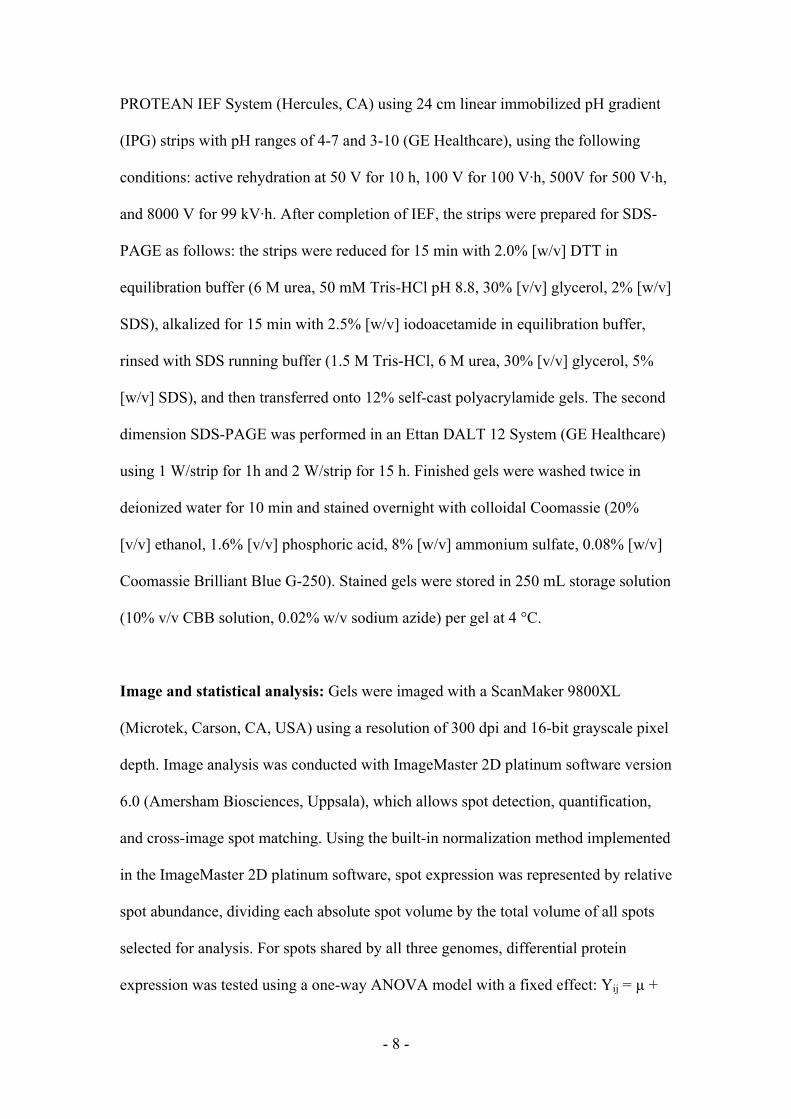
shown in Figure 1A, A- and D-genome Gossypium diverged for approximately 5-10
million years before becoming reunited in an allopolyploid nucleus about 1-2 million
years ago (Wendel and Cronn 2003). Extensive research has identified the best
models of the diploid progenitors involved in the creation of the allopolyploid lineage,
the latter which includes the most important of the cultivated species, G. hirsutum.
This well-documented evolutionary framework, coupled with the substantial
- 6 -
resources available, e. g., a comprehensive EST database (Udall et al. 2006a; Udall et
al. 2006b), and the prior genomic/transcriptomic research into the consequences of
polyploidy (Adams et al. 2003; Senchina et al. 2003; Grover et al. 2004; Grover et al.
2007; Flagel et al. 2008; Hovav et al. 2008; Chaudhary et al. 2009; Flagel et al. 2009;
Rapp et al. 2009; Flagel and Wendel 2010; Salmon et al. 2010), makes Gossypium an
excellent system to extend research on genomic merger and doubling to the proteomic
level. In this study, we profile and analyze the proteomes of cotton seeds in the
polyploid (AD genome) G. hirsutum, and its two model diploid progenitors, G.
herbaceum (A genome) and G. raimondii (D genome). Despite being best known for
fiber production, the high-quality oil and proteins produced in the seeds of
domesticated G. hirsutum have increased the agronomic and economic importance of
cotton as a crop plant. The increased interest in cotton seeds (e.g., Sunilkumar et al.
2006), and the relatively simplified protein composition of mature, dormant seeds,
makes cotton a useful model for studying protein accumulation in the context of
polyploidy.
MATERIALS AND METHODS
Plant materials: Three Gossypium species were used in the present study: one
polyploid species G. hirsutum var. Acala Maxxa (AD-genome), and two diploid
species that represent the model diploid progenitors of allopolyploid cotton, namely
G. herbaceum (A1-73; A-genome) and G. raimondii (D-genome). For each species,
seeds were collected and pooled from three to four plants that were grown in the Pohl
Conservatory at Iowa State University, Ames, Iowa. After boll opening, mature seeds
were hand-harvested and air-dried at room temperature for at least one month. Prior to
protein extraction, the fiber-containing seeds were de-linted with concentrated
- 7 -
sulphuric acid. The weight of the seeds collected was measured both before and after
de-linting.
Protein extraction: Total protein was isolated from mature desiccated seeds based
upon a phenol extraction procedure successfully applied to other oilseeds (Hajduch et
al. 2005; Hajduch et al. 2006; Hajduch et al. 2007; Houston et al. 2009). Briefly, for
each sample, 250 mg of de-linted seeds was ground to a fine powder in liquid nitrogen
with a mortar and pestle, and homogenized with 10 mL of a 1:1 mixture of extraction
buffer (100 mM Tris-HCl pH 8.8, 900 mM sucrose, 10 mM EDTA and 0.4% [v/v] 2-
mercaptoethanol) and Tris-saturated phenol. The homogenate was agitated for 30 min
and centrifuged at 4000 rpm for 30 min at 4°C. The upper phenol phase was extracted
and combined with 5 volumes of 0.1 M ammonium acetate in methanol and placed at
-20°C for overnight protein precipitation. The protein pellet was subsequently
collected via centrifugation for 30 min at 4°C. The recovered pellet was thoroughly
washed over 4 washing steps: once with 0.1 M ammonium acetate in methanol, twice
with 80% acetone, and once with 70% ethanol. The final pellet was dried at room
temperature and solubilized in Isoelectric Focusing (IEF) buffer (8 M urea, 2 M
thiourea, 2% [w/v] CHAPS, 2% [v/v] Triton X-100, 50 mM DTT). Protein
concentration was determined using the modified Bradford total protein assay
(Bradford, 1976) from Bio-Rad (Hercules, CA) using bovine gamma globulin as
standard.
2-DE: As described in (Hajduch et al. 2005), 1 mg of seed proteins was dissolved in
450 µL IEF buffer and separated by Isoelectric Focusing (IEF) for the first dimension
and by SDS-PAGE in the second dimension. IEF was performed in a Bio-Rad
- 8 -
PROTEAN IEF System (Hercules, CA) using 24 cm linear immobilized pH gradient
(IPG) strips with pH ranges of 4-7 and 3-10 (GE Healthcare), using the following
conditions: active rehydration at 50 V for 10 h, 100 V for 100 V·h, 500V for 500 V·h,
and 8000 V for 99 kV·h. After completion of IEF, the strips were prepared for SDS-
PAGE as follows: the strips were reduced for 15 min with 2.0% [w/v] DTT in
equilibration buffer (6 M urea, 50 mM Tris-HCl pH 8.8, 30% [v/v] glycerol, 2% [w/v]
SDS), alkalized for 15 min with 2.5% [w/v] iodoacetamide in equilibration buffer,
rinsed with SDS running buffer (1.5 M Tris-HCl, 6 M urea, 30% [v/v] glycerol, 5%
[w/v] SDS), and then transferred onto 12% self-cast polyacrylamide gels. The second
dimension SDS-PAGE was performed in an Ettan DALT 12 System (GE Healthcare)
using 1 W/strip for 1h and 2 W/strip for 15 h. Finished gels were washed twice in
deionized water for 10 min and stained overnight with colloidal Coomassie (20%
[v/v] ethanol, 1.6% [v/v] phosphoric acid, 8% [w/v] ammonium sulfate, 0.08% [w/v]
Coomassie Brilliant Blue G-250). Stained gels were stored in 250 mL storage solution
(10% v/v CBB solution, 0.02% w/v sodium azide) per gel at 4 °C.
Image and statistical analysis: Gels were imaged with a ScanMaker 9800XL
(Microtek, Carson, CA, USA) using a resolution of 300 dpi and 16-bit grayscale pixel
depth. Image analysis was conducted with ImageMaster 2D platinum software version
6.0 (Amersham Biosciences, Uppsala), which allows spot detection, quantification,
and cross-image spot matching. Using the built-in normalization method implemented
in the ImageMaster 2D platinum software, spot expression was represented by relative
spot abundance, dividing each absolute spot volume by the total volume of all spots
selected for analysis. For spots shared by all three genomes, differential protein
expression was tested using a one-way ANOVA model with a fixed effect: Yij = µ +

- 9 -
Gi + eij, where µ represents the overall mean, Gi denotes a genome fixed effect, and eij
is the random error term used for significance test. When spots were shared by all
three genomes, the hypothesis of additive parental expression in the allopolyploid was
tested; for this, a spot was considered additive with respect to expression if the spot
abundance in the polyploid AD-genome was equal to the average abundance found in
the parental A- and D-genomes. Any deviation from the average parental value was
considered non-additive expression, which then was further categorized by comparing
the AD-genome value to both diploid values. Possible deviations from additivity
include: parental genomic dominance (where the expression found in the AD-genome
is statistically equal to one parental value for spots differentially expressed between
parents), and transgressive expression (where the expression in the polyploid AD-
genome statistically falls either below or above that found in both parental genomes).
The p-values of these analyses were adjusted for multiple testing (Benjamini and
Hochberg 1995), and the false discovery rate (FDR) was controlled at 5%.
MS analyses: Selected spots for protein identification were excised from gels and
subjected to in-gel trypsin digestion followed by LC-MS/MS (liquid chromatography-
tandem mass spectrometry) using an LTQ XL ProteomeX ion trap mass spectrometer
(Thermo-Fisher, San Jose, CA). Tandem mass spectral data were searched against the
Arabidopsis protein database and an in-house Gossypium EST/contig translated
database (provided by J Udall), using SEQUEST, which is part of the BioWorks
3.1SR1 software suite (ThermoFisher, San Jose, CA). The instrument and searching
parameters were applied according to (Hajduch et al. 2006).

- 10 -
Genetic analysis: Primer sequences (Table S1) designed to amplify the suite of SSP
genes were derived from the conserved regions of each SSP gene in Gossypium,
identified from the alignment of publicly available G. hirsutum sequences [GenBank:
M19378.1, M16891.1, M69188.1, M16936.1] and SSP ESTs (identified by blast hits
against an in-house cotton EST database). Amplified PCR products were excised from
1.0% agarose gels, purified using Qiaquick gel purification kit (Qiagen Inc., Valencia,
CA), and cloned with the pGEM®-T Easy Vector System (Promega, Wisconsin).
Cloned products were sequenced using the Applied Biosystems 3730xl DNA
Analyzer at ISU DNA facility. Because the PCR products are approximately 2000bp
in length, internal primers were also designed for sequencing. The resulting sequences
were aligned with those derived from GenBank and the cotton EST database using
MUSCLE (Edgar 2004) and inspected manually. The obtained Gossypium SSP gene
sequences were deposited in Genbank under accession numbers JN602029-JN602047.
Neighbor-joining analysis was conducted on the aligned sequences using PAUP*
(Swofford 2001). Uncorrected (“p”) DNA/RNA distances were set for distance
analysis and missing data were ignored for affected pair-wise comparisons.
RESULTS
The proteomic profiles of mature cotton seeds: Allopolyploid G. hirsutum var.
Acala Maxxa (AD genome) and representatives of its diploid progenitors (A genome
G. herbaceum and D genome G. raimondii) were used to profile the cotton seed
proteome. Mature seed mass and size of intact and de-linted seeds were recorded
before protein extraction (Figure 1B). The protein yields from phenol extraction
ranged from 6.3% to 8.9 % (dry weight) without significant variation among three

- 11 -
genomes, which is in agreement with the seed protein contents previously reported for
Gossypium (Frampton et al. 1958; Pandey and Thejappa 1975).
Mature seed proteins from each genome were isolated in biological quadruplicate for
two-dimensional gel electrophoretic (2-DE) separation (Figure S1). In order to
construct a high-quality proteomic map, two overlapping ranges of immobilized pH
gradient (IPG) strips were used for the first dimensional Isoelectric Focusing (IEF): a
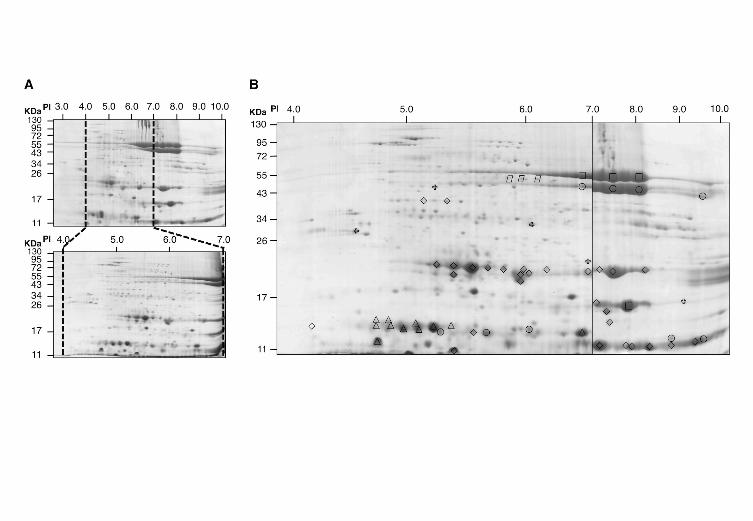
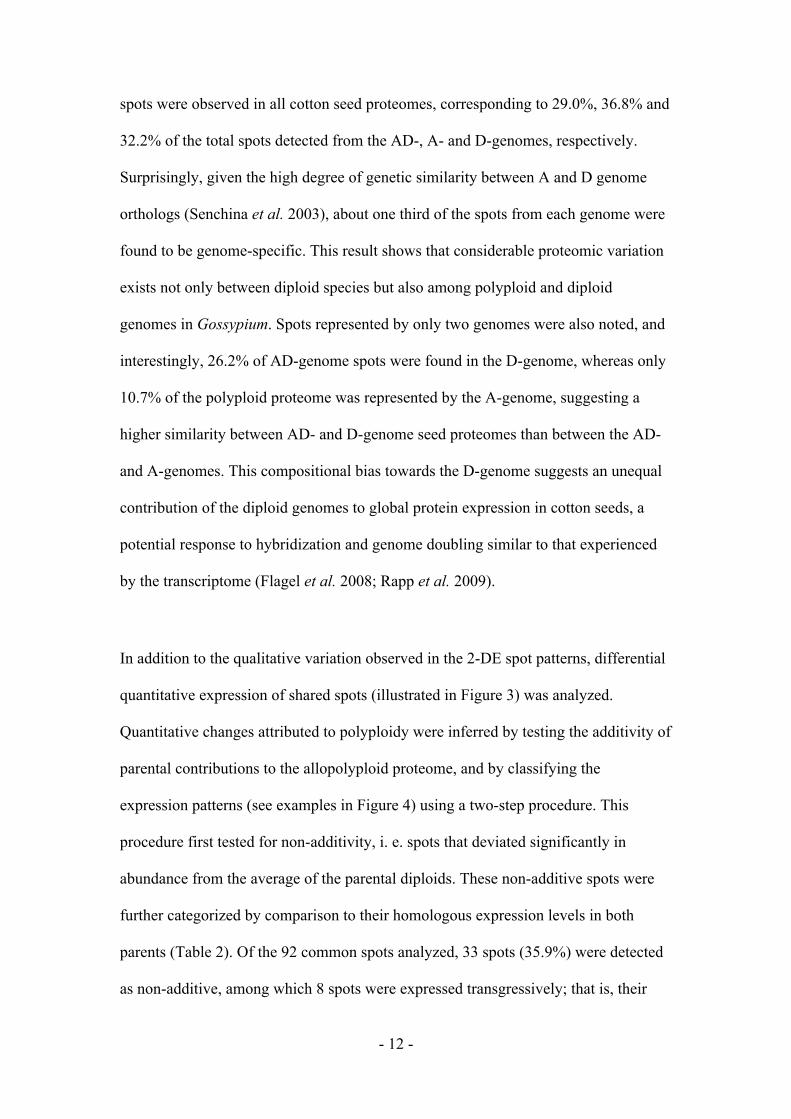
broader range pH 3-10 strip and a narrower range pH 4-7 strip. As shown in Figure
2A, the use of pH range 4-7 largely enhanced spot resolution in the signal-dense area
of pH 3-10; therefore, the proteomic profiles were constructed using spots detected in
the pH 4-7 gels and the subsection of the pH 3-10 gels containing the pH 7-10 region.
For each gel of each pH range, detected spots were matched within biological
replicates and then between genomes. Spot detection was only considered for spots
reproducibly represented by at least three biological replicates; spots meeting this
criterion were selected for profiling and subjected to qualitative and quantitative
analyses. According to this criterion, 646 spots were confidently detected from pH 4-7
gels, and 208 spots were resolved from pH 3-10 gels (pH 7 to 10 region only). Of the
854 total spots, 315 were present in the polyploid (AD-genome) seed proteome, and
fewer were recovered from the A- and D-genome seed proteomes (250 and 289 spots,
respectively).
Comparative proteomics of allopolyploid G. hirsutum and models of its diploid
progenitors: Proteomic profiles of the allopolyploid and two progenitor diploid
species were first compared qualitatively through spot matching between genomes
(Table 1; File S1). The pairwise comparison between genomes revealed that only 92
- 12 -
spots were observed in all cotton seed proteomes, corresponding to 29.0%, 36.8% and
32.2% of the total spots detected from the AD-, A- and D-genomes, respectively.
Surprisingly, given the high degree of genetic similarity between A and D genome
orthologs (Senchina et al. 2003), about one third of the spots from each genome were
found to be genome-specific. This result shows that considerable proteomic variation
exists not only between diploid species but also among polyploid and diploid
genomes in Gossypium. Spots represented by only two genomes were also noted, and
interestingly, 26.2% of AD-genome spots were found in the D-genome, whereas only
10.7% of the polyploid proteome was represented by the A-genome, suggesting a
higher similarity between AD- and D-genome seed proteomes than between the AD-
and A-genomes. This compositional bias towards the D-genome suggests an unequal
contribution of the diploid genomes to global protein expression in cotton seeds, a
potential response to hybridization and genome doubling similar to that experienced
by the transcriptome (Flagel et al. 2008; Rapp et al. 2009).
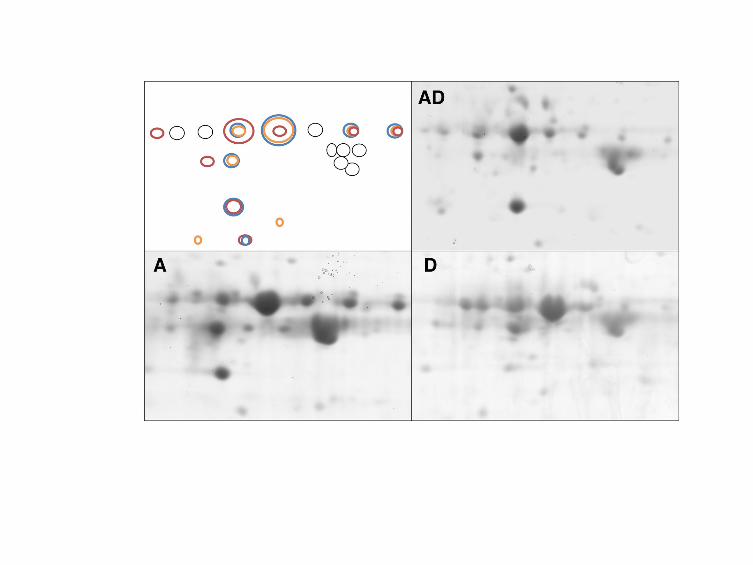
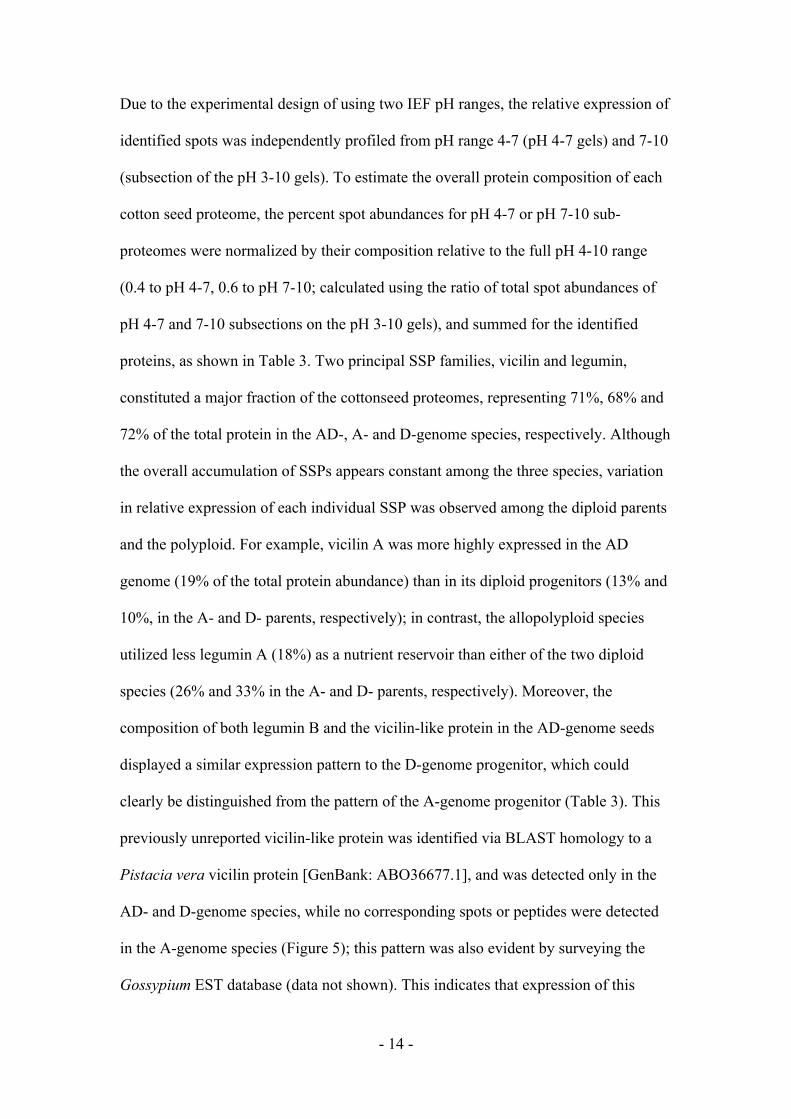
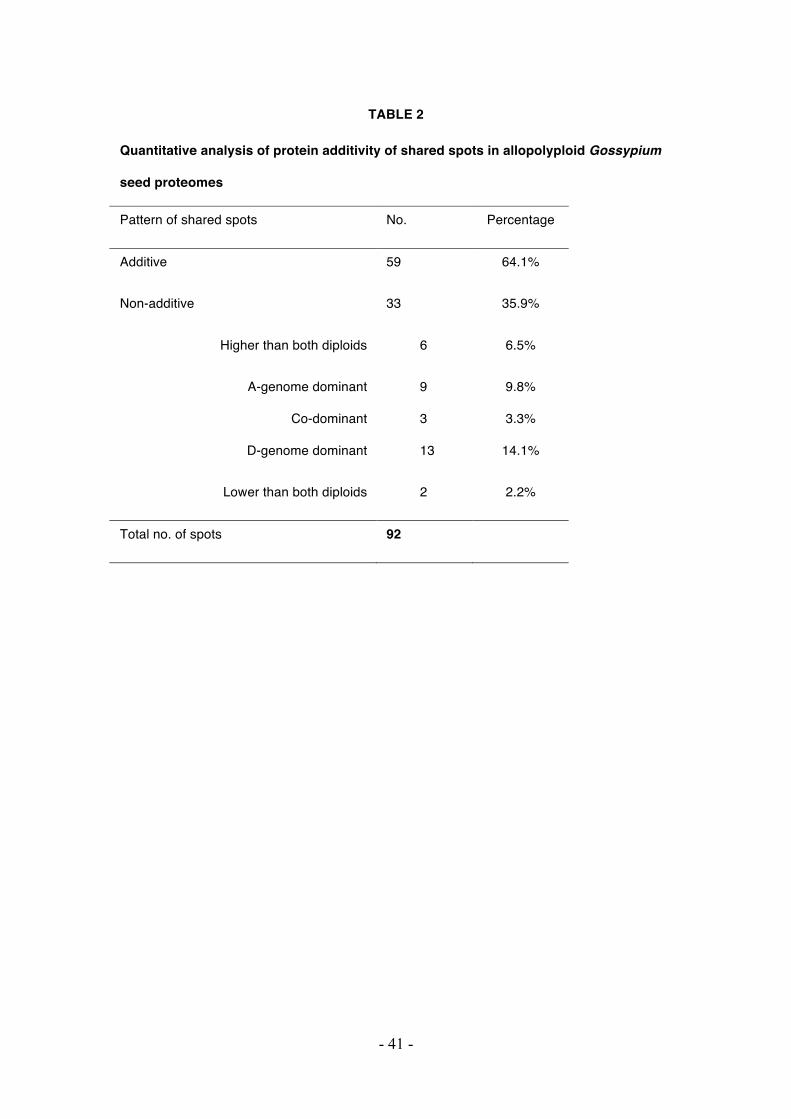
In addition to the qualitative variation observed in the 2-DE spot patterns, differential
quantitative expression of shared spots (illustrated in Figure 3) was analyzed.
Quantitative changes attributed to polyploidy were inferred by testing the additivity of
parental contributions to the allopolyploid proteome, and by classifying the
expression patterns (see examples in Figure 4) using a two-step procedure. This
procedure first tested for non-additivity, i. e. spots that deviated significantly in
abundance from the average of the parental diploids. These non-additive spots were
further categorized by comparison to their homologous expression levels in both
parents (Table 2). Of the 92 common spots analyzed, 33 spots (35.9%) were detected
as non-additive, among which 8 spots were expressed transgressively; that is, their

- 13 -
expression was either greater or less than both parental diploids. Twenty-two non-
additive spots displayed statistically equivalent expression as one of the two diploid
parents, and 13 and 9 spots were sorted into the D-dominant and A-dominant patterns,
respectively. The remaining 3 spots displayed an intermediate level of expression
between the parental values and were considered co-dominant.
Identification of major components of cotton seed proteomes: To characterize and
compare the major components of seed proteomes in the three Gossypium species,
high-abundance spots (>1% mean relative volume of each genome at each pH range)
were targeted for Mass Spectrometry (MS)-based protein identification. Because it is
also of interest to determine the proteins or functional categories that contribute to the
expression patterns observed in the polyploid, representative spots from the
expression categories defined in Table 2 were also included for protein identification.
According to these nonexclusive criteria, a total of 199 spots corresponding to
approximately 80% of the total spot abundance for the three species were subjected to
tandem MS analysis. Searching against a custom Gossypium and Arabidopsis protein
database successfully identified 155 spots (62 from AD-genome, 55 from A-genome,
and 53 from D-genome; see File S2 for spot selection and identification). The
majority of the identified spots (140 spots) belonged to the category of seed storage
proteins (SSPs), including vicilin A (19 spots), vicilin B (5 spots), legumin A (83
spots) and legumin B (27 spots), and one vicilin-like gene (6 spots) not previously
reported in Gossypium. The remaining spots (9.7%, 15/155) identified were classified
to the functional categories of cellular organization (4 spots), molecular function (4
spots), and stress response (3 spots).
- 14 -
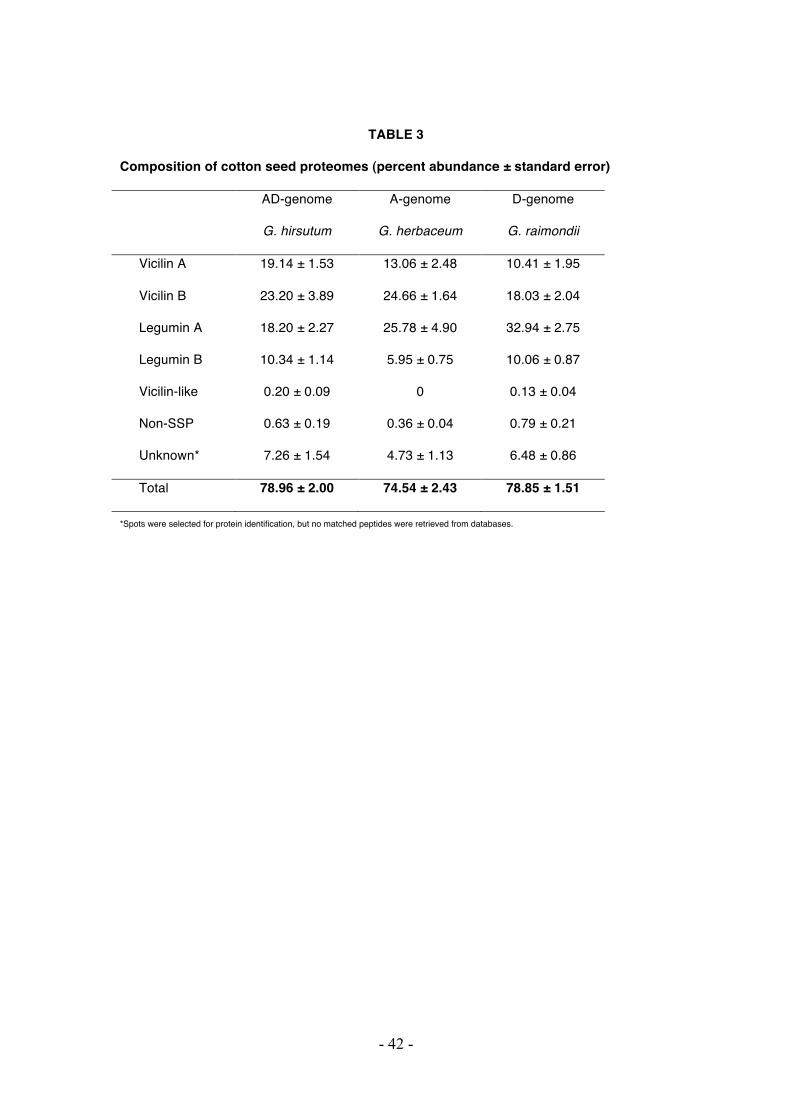
Due to the experimental design of using two IEF pH ranges, the relative expression of
identified spots was independently profiled from pH range 4-7 (pH 4-7 gels) and 7-10
(subsection of the pH 3-10 gels). To estimate the overall protein composition of each
cotton seed proteome, the percent spot abundances for pH 4-7 or pH 7-10 sub-
proteomes were normalized by their composition relative to the full pH 4-10 range
(0.4 to pH 4-7, 0.6 to pH 7-10; calculated using the ratio of total spot abundances of
pH 4-7 and 7-10 subsections on the pH 3-10 gels), and summed for the identified
proteins, as shown in Table 3. Two principal SSP families, vicilin and legumin,
constituted a major fraction of the cottonseed proteomes, representing 71%, 68% and
72% of the total protein in the AD-, A- and D-genome species, respectively. Although
the overall accumulation of SSPs appears constant among the three species, variation
in relative expression of each individual SSP was observed among the diploid parents
and the polyploid. For example, vicilin A was more highly expressed in the AD
genome (19% of the total protein abundance) than in its diploid progenitors (13% and
10%, in the A- and D- parents, respectively); in contrast, the allopolyploid species
utilized less legumin A (18%) as a nutrient reservoir than either of the two diploid
species (26% and 33% in the A- and D- parents, respectively). Moreover, the
composition of both legumin B and the vicilin-like protein in the AD-genome seeds
displayed a similar expression pattern to the D-genome progenitor, which could
clearly be distinguished from the pattern of the A-genome progenitor (Table 3). This
previously unreported vicilin-like protein was identified via BLAST homology to a
Pistacia vera vicilin protein [GenBank: ABO36677.1], and was detected only in the
AD- and D-genome species, while no corresponding spots or peptides were detected
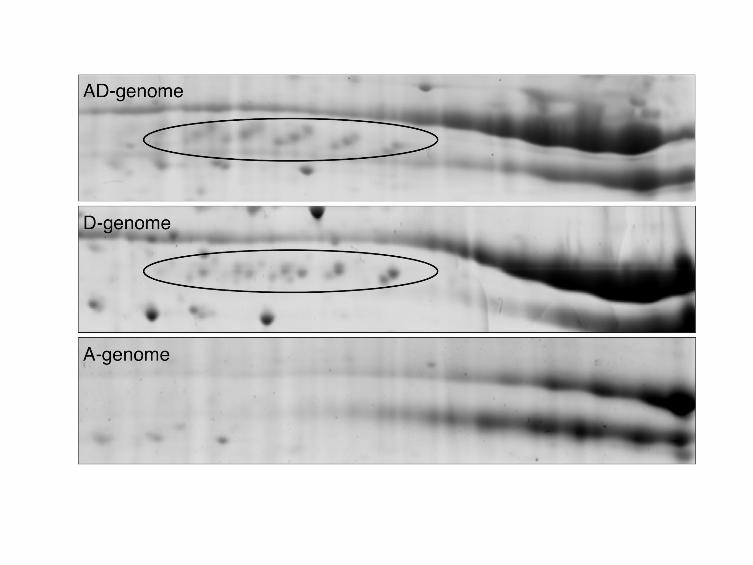
in the A-genome species (Figure 5); this pattern was also evident by surveying the
Gossypium EST database (data not shown). This indicates that expression of this
- 15 -
vicilin-like gene may be specific to the diploid D-genome species, and was
subsequently recruited into AD-genome species during or post-allopolyploidization.
Genetic analysis of Gossypium SSP genes: The major Gossypium SSPs have
previously been characterized (Dure and Chlan 1981; Galau et al. 1983; Chlan et al.
1986; Chlan et al. 1987; Dure 1989; Galau et al. 1991), although complete gene
sequences were limited to G. hirsutum. In surveying the Gossypium EST databases, a
considerable level of nucleotide diversity became evident, not only for the
orthologous genes obtained from the diploid species, but also for copies found in the
G. hirsutum EST database. These data indicated that some of the major SSPs in
Gossypium are encoded by multigene families (data not shown). Thus, to understand
the genetic basis of the proteomic profiles and their compositional diversity, gene
family structures were characterized using conserved primers designed to amplify
each SSP from four Gossypium species: AD-genome G. hirsutum var. Acala Maxxa,
D-genome G. raimondii and two A-genome species G. herbaceum (which was used in
the proteomic analysis, noted as A1 here) and G. arboreum (another putative A-
genome progenitor of allopolyploid cotton, noted as A2, included for additional
perspective on the genetic diversity of Gossypium SSP genes).
Vicilin A and vicilin B, which share 72% amino acid similarity, belong to the vicilin
(7S globulin or alpha globulin) gene family (Chlan et al. 1987), and represent the first
discovered cotton SSPs. To test the single-copy status for both vicilins, over ten
sequences per gene were generated from each of the four Gossypium species
mentioned above. After removing sequencing errors and redundancy, both vicilins
were determined to exist as single-copy genes in the diploid genomes (A1, A2, D),
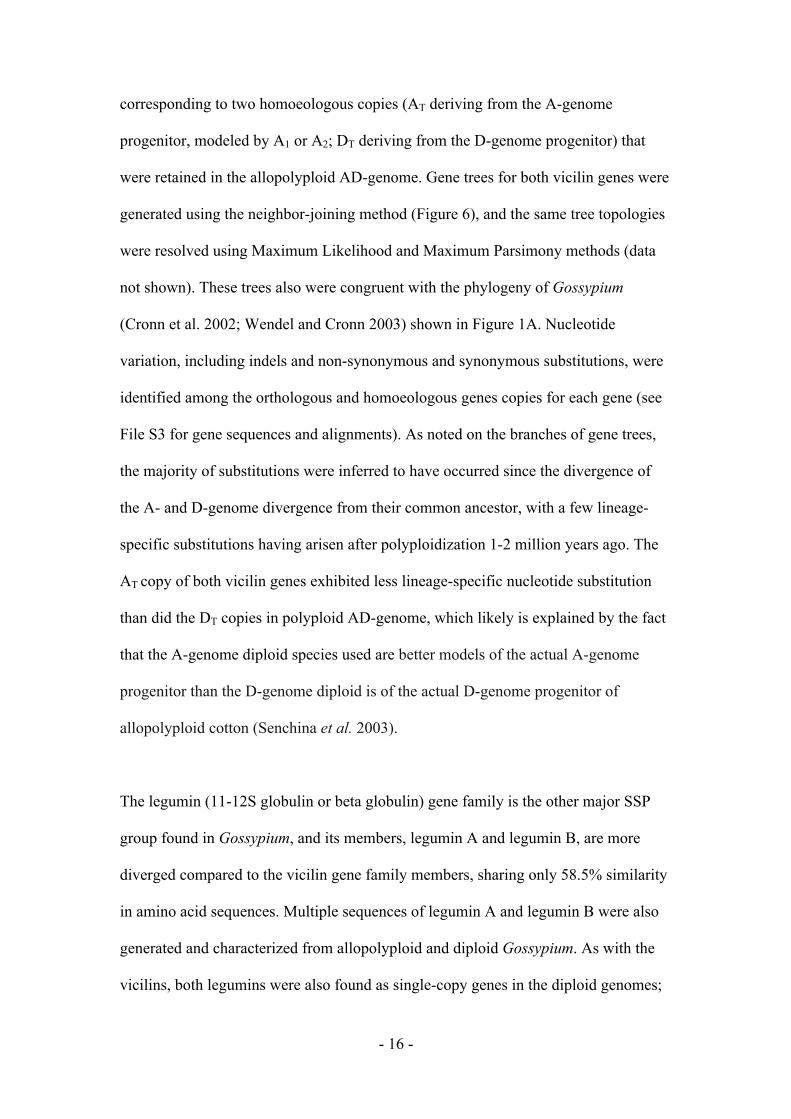
- 16 -
corresponding to two homoeologous copies (AT deriving from the A-genome
progenitor, modeled by A1 or A2; DT deriving from the D-genome progenitor) that
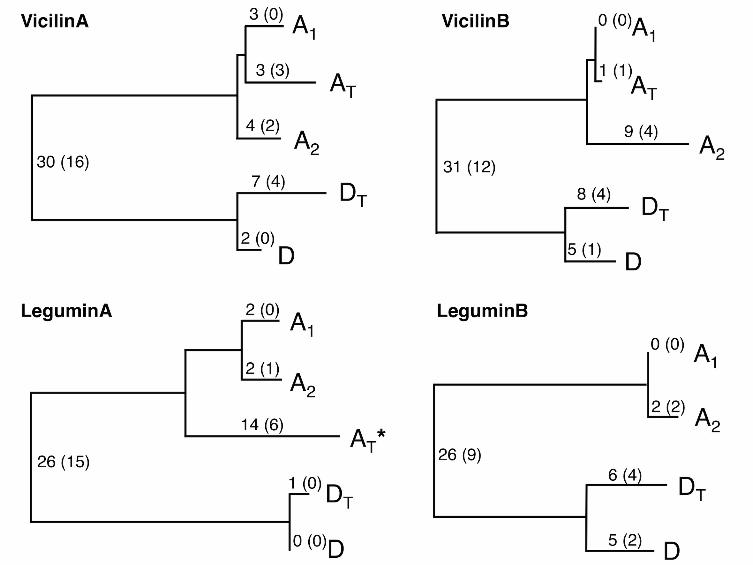
were retained in the allopolyploid AD-genome. Gene trees for both vicilin genes were
generated using the neighbor-joining method (Figure 6), and the same tree topologies
were resolved using Maximum Likelihood and Maximum Parsimony methods (data
not shown). These trees also were congruent with the phylogeny of Gossypium
(Cronn et al. 2002; Wendel and Cronn 2003) shown in Figure 1A. Nucleotide
variation, including indels and non-synonymous and synonymous substitutions, were
identified among the orthologous and homoeologous genes copies for each gene (see
File S3 for gene sequences and alignments). As noted on the branches of gene trees,
the majority of substitutions were inferred to have occurred since the divergence of
the A- and D-genome divergence from their common ancestor, with a few lineage-
specific substitutions having arisen after polyploidization 1-2 million years ago. The
AT copy of both vicilin genes exhibited less lineage-specific nucleotide substitution
than did the DT copies in polyploid AD-genome, which likely is explained by the fact
that the A-genome diploid species used are better models of the actual A-genome
progenitor than the D-genome diploid is of the actual D-genome progenitor of
allopolyploid cotton (Senchina et al. 2003).
The legumin (11-12S globulin or beta globulin) gene family is the other major SSP
group found in Gossypium, and its members, legumin A and legumin B, are more
diverged compared to the vicilin gene family members, sharing only 58.5% similarity
in amino acid sequences. Multiple sequences of legumin A and legumin B were also
generated and characterized from allopolyploid and diploid Gossypium. As with the
vicilins, both legumins were also found as single-copy genes in the diploid genomes;

- 17 -
however, only the D-genome derived copy was detected for legumin B in the AD-
genome. This observation was further supported by the absence of an A-genome
derived copy in the cotton EST database. Two possible explanations exist for the loss
of the original A-genome derived copy in the polyploid: gene deletion and concerted
evolution that resulted in the homogenization of the homoeologous pair towards the
D-genome derived copy, a phenomenon previously demonstrated for ribosomal genes
in allotetraploid Gossypium (Wendel et al. 1995), and more recently for numerous
protein-coding genes (Salmon et al. 2010). Interestingly, despite the fact that both A-
and D-genome derived copies were recovered for legumin A, a non-synonymous
substitution in the A-genome derived copy of legumin A caused a premature stop
codon. Additionally, an accelerated rate of nucleotide substitution in the legumin A
A-genome derived copy was also observed (Figure 6), which suggests that this copy is
non-functional. Together, these observations suggest that there exist different
regulatory mechanisms and uneven selection pressures on vicilin and legumin genes,
even though they both function as storage proteins in cotton seeds.
Detailed proteomic characterization of Gossypium SSPs: An observation common
to 2-DE gels, and pertinent to the analysis of the SSP proteome in Gossypium, is that
numerous spots often correspond to isoforms of the same protein accession, as
previously demonstrated with 2-DE analyses of SSPs in pea, soybean, rapeseed and
Arabidopsis (Hajduch et al. 2005; Hajduch et al. 2006; Higashi et al. 2006; Bourgeois
et al. 2009). By contrasting the isoform peptide sequences obtained through MS
analysis to the full-length proteins, the on-gel spot location and the computationally
predicted location can be examined to determine the formation and features of SSP
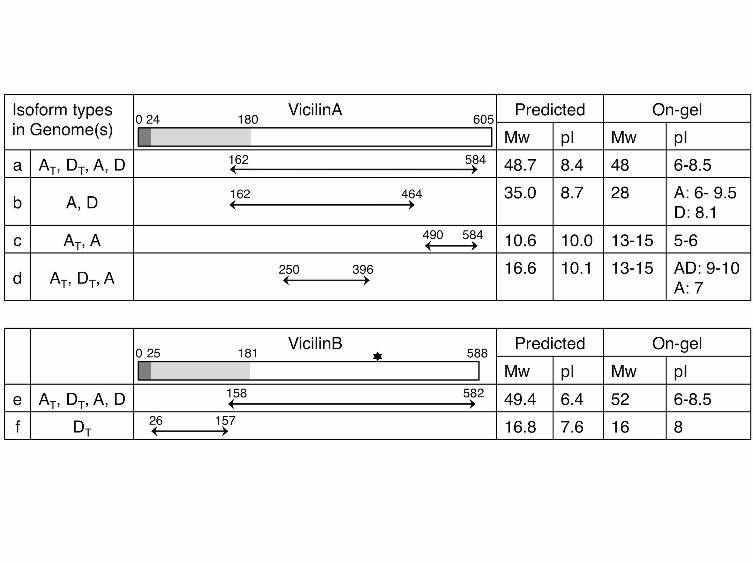
isoforms, used here to characterize the isoforms of the vicilins (Figure 7). In the three
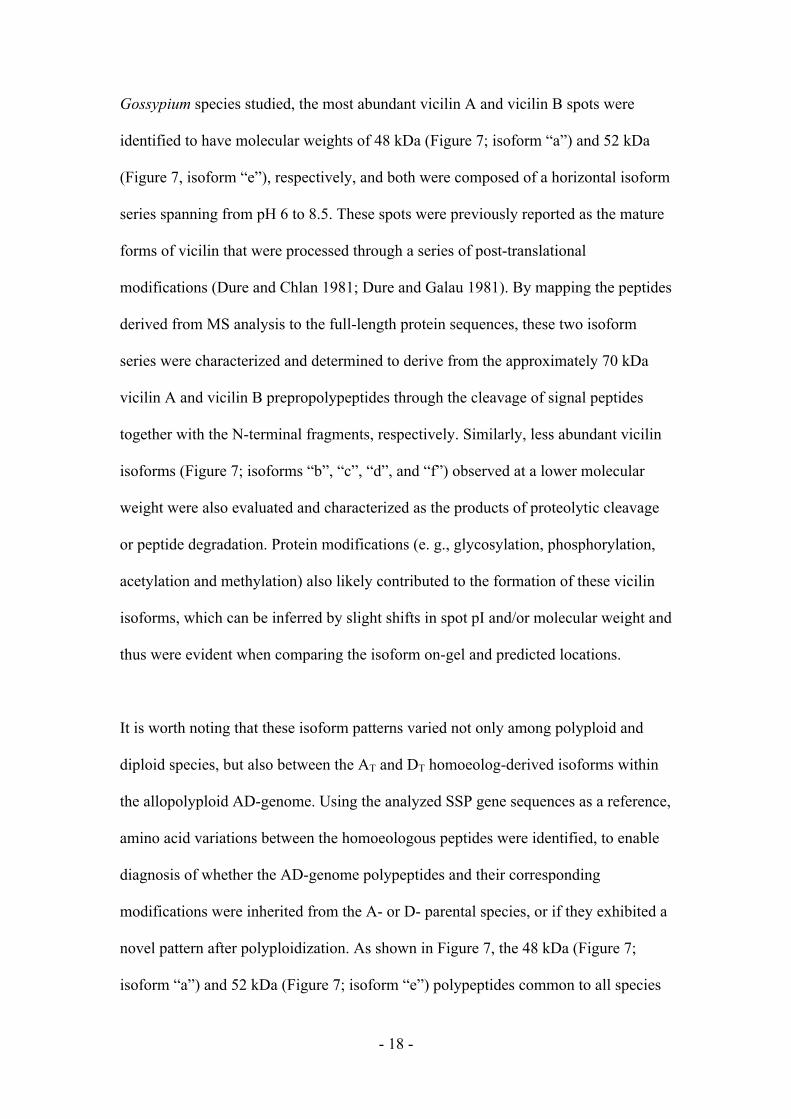
- 18 -
Gossypium species studied, the most abundant vicilin A and vicilin B spots were
identified to have molecular weights of 48 kDa (Figure 7; isoform “a”) and 52 kDa
(Figure 7, isoform “e”), respectively, and both were composed of a horizontal isoform
series spanning from pH 6 to 8.5. These spots were previously reported as the mature
forms of vicilin that were processed through a series of post-translational
modifications (Dure and Chlan 1981; Dure and Galau 1981). By mapping the peptides
derived from MS analysis to the full-length protein sequences, these two isoform
series were characterized and determined to derive from the approximately 70 kDa
vicilin A and vicilin B prepropolypeptides through the cleavage of signal peptides
together with the N-terminal fragments, respectively. Similarly, less abundant vicilin
isoforms (Figure 7; isoforms “b”, “c”, “d”, and “f”) observed at a lower molecular
weight were also evaluated and characterized as the products of proteolytic cleavage
or peptide degradation. Protein modifications (e. g., glycosylation, phosphorylation,
acetylation and methylation) also likely contributed to the formation of these vicilin
isoforms, which can be inferred by slight shifts in spot pI and/or molecular weight and
thus were evident when comparing the isoform on-gel and predicted locations.
It is worth noting that these isoform patterns varied not only among polyploid and
diploid species, but also between the AT and DT homoeolog-derived isoforms within
the allopolyploid AD-genome. Using the analyzed SSP gene sequences as a reference,
amino acid variations between the homoeologous peptides were identified, to enable
diagnosis of whether the AD-genome polypeptides and their corresponding
modifications were inherited from the A- or D- parental species, or if they exhibited a
novel pattern after polyploidization. As shown in Figure 7, the 48 kDa (Figure 7;
isoform “a”) and 52 kDa (Figure 7; isoform “e”) polypeptides common to all species

- 19 -
analyzed were expressed by both homoeologous genes in AD-genome. Alternatively,
only AT polypeptides (Figure 7; isoform “c”) were recovered in the acidic 12-15 kDa
region, consistent with the A-genome-specific pattern in diploids. A novel
modification in the allopolyploid was observed for the 17 kDa vicilin B polypeptides
(Figure 7; isoform “f”), which appears to be the result of retention of the N-terminal
fragment of the vicilinB precursor in the allopolyploid only (whereas the parental
diploids experience cleavage and degradation of this fragment). The polypeptides of
this fragment were further determined to originate from expression of the DT
homoeolog of vicilinB; however, not enough peptide information was recovered to
completely rule out the presence of AT homoeolog products. Altogether, these
findings suggest differential regulation or modification of homoeologous gene
products, as well as novel patterns in the polyploid proteome that may result from the
interaction between homoeologous gene products.
More than thirty spots were identified corresponding to legumin isoforms in each
Gossypium species, commonly distributed at molecular weights of 30 kDa, 17-20 kDa
and 11-12 kDa as legumin A, and at a molecular weight of 11-13 kDa as legumin B.
As with vicilins, these legumin isoforms are also processed through a series of
modifications, including proteolytic cleavage and peptide degradation. Isoform
analysis through peptide mapping indicated that the 30 kDa polypeptides of legumin
A derived from the C-terminal fragment of the 58 kDa prepropolypeptide (see File S4
for peptide mapping analysis). Other isoform peptide sequences obtained through MS
analysis failed to be clustered and mapped to continuous polypeptide regions, perhaps
reflecting a lower peptide coverage recovered from MS analysis compared to that of
vicilins. The contribution of homoeologous polypeptides within the allopolyploid was

- 20 -
also evaluated, showing that all peptides detected for legumin A and legumin B were
encoded by the DT gene copy. This result is consistent with the gene family structure
of legumins: in the allopolyploid AD-genome, only the D-genome derived copy of
legumin B exists, and the A-genome derived copy of legumin A appears to be non-
functional, due to a premature stop codon (as noted above). Considering this strict DT
homoeologous expression of legumin isoforms in the AD-genome, the legumin SSPs
are possibly the key components that contribute to the biased accumulation of cotton
seed proteins in allopolyploid cotton.
DISCUSSION
Vicilin and legumin are the major proteins in mature cotton seeds: Seed storage
proteins, which accumulate during seed filling and store nutrients for seed
germination and seedling growth, comprise one of the most important protein
categories in plant seeds. Due to their high abundance in nature and their economic
importance as a major source of dietary protein, detailed studies of SSPs date to the
early part of the 20th century (Osborne 1924), when Osborne classified them
according to their solubility in water (albumin), neutral saline (globulin),
alcohol/water mixtures (prolamin), and acids or alkalis (glutelin). The most widely
distributed and prevalent SSP group is globulin, which can be divided based on the
sedimentation rate of their aggregated forms into the 7S vicilins and 11/12S legumins
(Shewry et al. 1995). In our survey of the most abundant cotton seed proteins, nearly
all of the proteins identified belong to the vicilin and legumin families, comprising
60-70% of the total seed proteins in abundance and suggesting that vicilins and
legumins are the major component of mature cotton seeds, as well as the major cotton
SSPs.

- 21 -
Quantification of the SSPs, made possible by 2-DE technology, permitted the precise
estimation of each SSP category in cotton seeds. In agreement with prior research,
which characterized the two principal forms of vicilin as occurring at 48 kDa and 52
kDa (Dure and Chlan 1981; Dure and Galau 1981; Dure et al. 1981; Chlan et al.
1986), these vicilin isoforms were also observed as the most abundant proteins on our
proteomic maps. Their relative abundances (37% in AD-genome, 36% in A-genome
and 28% in D-genome), however, were a little higher than the previous estimate of
27% by cylindrical SDS-PAGE (Dure and Chlan 1981). In addition to these vicilin
isoforms, the overall composition of vicilins and legumins was also estimated,
together with a water-soluble fraction of SSPs termed as albumin in prior research,
which suggested that each of these three SSP categories may account for up to 1/3 of
the total protein amount in cotton seeds (Youle and Huang 1979; Youle and Huang
1981). Subsequent research, which characterized the albumin mRNA, noted that not
only does albumin encode a low molecular weight protein of only 139 amino acids,
but the albumin mRNA makes up a much smaller proportion of the total mRNA pool
(2%) in developing seeds, when compared to vicilins (15%) and legumins (30%)
(Hughes and Galau 1989; Galau et al. 1992). It is not surprising, then, that this protein
was not detected in our proteomic analyses, which encompass approximately 80% of
total seed protein abundance. The discrepancy between previous protein
quantifications and the current analysis is likely due to the more ambiguous
classification of globulin and albumin in early studies, which were based on protein
solubility and sedimentation rates instead of actual sequences. Although intact
globulins are mostly insoluble in water, their degraded or cleaved forms can gain
higher water-solubility and display a molecular weight similar to that of albumin;
- 22 -
therefore, these albumin-like globulin forms could contribute to overestimation of the
amount of albumin in cotton seeds. Because mature albumins are typically cleaved
into smaller polypeptides which fall outside of the effective separation range of SDS-
PAGE, we cannot rule out the possibility that the poor representation of albumin in
the present protein profiles may be due to a technical limitation of 2-DE profiling;
however, other estimates of protein abundances, which rely on amino acid
composition, concur with our assessment. That is, cotton seeds have been
characterized as deficient in sulfur-containing amino acids, indicating that sulfur-rich
proteins (such as albumin) constitute a low fraction of the total seed proteins
(Bressani et al. 1966; Chlan et al. 1986; Galau et al. 1991; Galau et al. 1992).
Biased accumulation of D-genome proteins in polyploid cotton seeds:
Allopolyploidization involves the merger of two different, and often divergent,
genomes, whose reconciliation in a common nucleus often leads to myriad changes,
including unequal integration and expression of the two merging genomes. Recent
studies into the consequences of allopolyploidization have underscored this possibility
of nonequivalence by demonstrating biased expression among homoeologs and a
phenomenon termed transcriptional genome dominance (Rapp et al. 2009). In F1
hybrids between the allotetraploids Arabidopsis thaliana and A. arenosa, an analysis
of nonadditively expressed genes revealed that, for those genes more highly expressed
in A. thaliana, the F1 allotetraploid hybrid preferentially exhibited repressed
expression, much like that in A. arenosa (Wang et al. 2006). In the recently formed
natural allotetraploid Tragopogon miscellus, higher levels of expression have been
reported for homoeologs originating in T. dubius versus those originating in T.
- 23 -
pratensis (Buggs et al. 2010). Similar studies in allopolyploid wheat have also
demonstrated nonequivalent expression patterns among homoeologs (Bottley et al.
2006; Bottley et al. 2008; Bottley and Koebner 2008; Pumphrey et al. 2009). In
cotton, biased expression of D-genome homoeologs has been reported for petal and
fiber tissues in G. hirsutum (Flagel et al. 2008; Hovav et al. 2008). These data were
later extended to a synthetic F1 hybrid and the other four natural allotetraploid species
that originated from the same genomic merger and doubling, an analysis that
suggested that the D genome homoeolog bias was established during genome merger
and was subsequently retained during the divergence of all five extant allopolyploid
species (Flagel and Wendel 2010). This observation was later augmented by the
discovery of the phenomenon of transcriptional genomic dominance, whereby gene
expression levels in a nascent (synthetic) AD-genome allopolyploid mimicked those
in the parental D genome more often than those of the A genome (Rapp et al. 2009).
Because this was true both for genes that were up- and down-regulated in D relative
to A, we termed this phenomenon genomic dominance (in this case biased toward D).
A natural extension of these transcriptional characterizations regarding the
nonequivalence accompanying polyploidy is to ask whether similar patterns are
exhibited at the protein level, and whether any observed nonequivalencies are linked
to phenotypic and functional variations. Attempts to address these questions were first
made in allopolyploid Brassica using a neosynthesized tetraploid (Albertin et al.
2006; Albertin et al. 2007), where little qualitative variation (less than 1% deviation
in spot presence/absence) was observed between the neosynthesized B. napus
allotetraploid and its diploid progenitors, B. oleracea and B. rapa. For the 25%-38%
of spots displaying quantitative difference (i. e., those expressed non-additively),

- 24 -
expression patterns were slightly closer to that of B. rapa parent rather than B.
oleracea, in accordance with a previous study that suggested bias toward the B. rapa
genome in the transcriptional expression of rRNA genes (Chen and Pikaard 1997).
The lack of genomic and transcriptomic data, however, makes it difficult to infer the
structural and functional significance of these observations in Brassica. In the present
work, we profiled total mature seed proteins in a naturally formed allotetraploid
whose genomic and transcriptomic reactions to genomic merger and doubling have
been extensively studied (Adams et al. 2003; Senchina et al. 2003; Grover et al. 2004;
Grover et al. 2007; Flagel et al. 2008; Hovav et al. 2008; Chaudhary et al. 2009;
Flagel et al. 2009; Rapp et al. 2009; Flagel and Wendel 2010; Salmon et al. 2010),
and address the question whether the D-genome bias and dominance previously
observed in the transcriptome of polyploid cotton is reflected at the protein level.
Consistent with transcriptomic data suggesting D-genome dominance (Rapp et al.
2009), the proteome of the allopolyploid was more similar to the D-genome parent,
with 26.2% of the 2-DE spots detected in the allopolyploid being present only in the
progenitor D-genome versus 10.7% which were present only in the A-genome diploid
(Table 1). This observation was extended by quantitative profiling of shared spots,
which displayed a higher level of non-additive expression equivalent to that of the
progenitor D-genome than to that of the A-genome (14.1% “D-genome dominant”
versus 9.8% “A-genome dominant”; Table 2). Hence, the cotton seed proteome
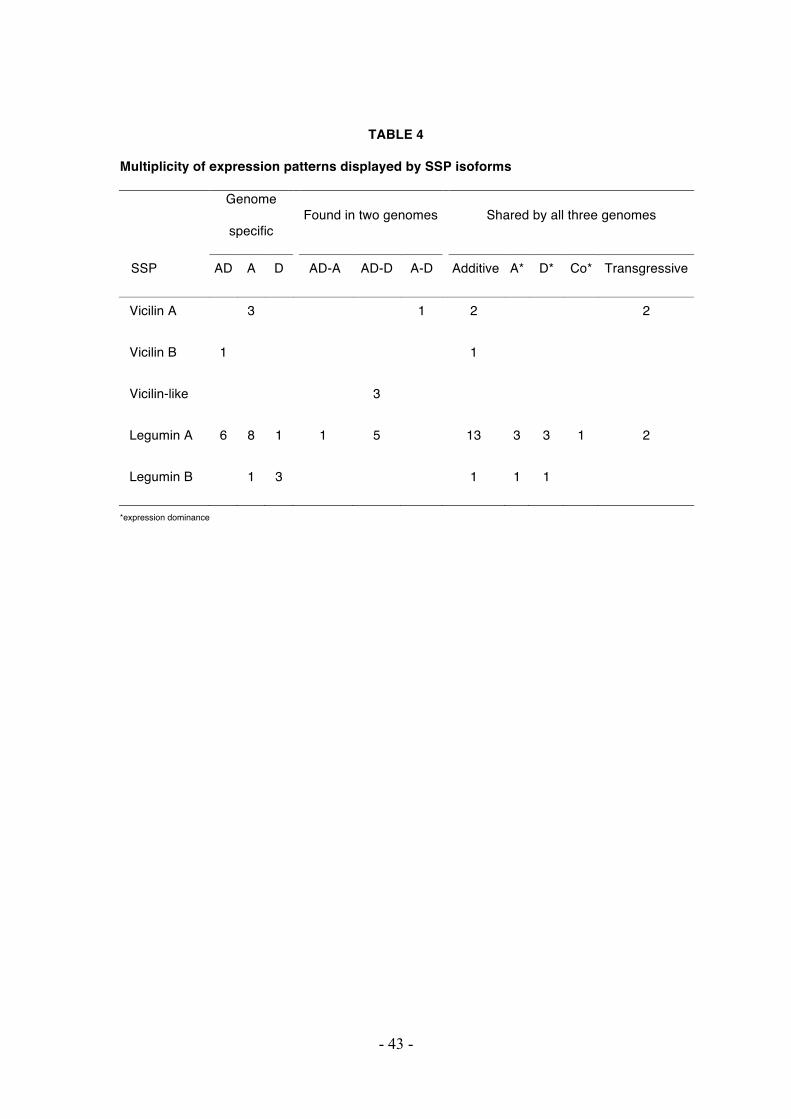
displays an overall dominance reflecting its D-genome component; however, by
parsing the qualitative and quantitative expressions for each individual SSP,
additional patterns of diversity in dominance become evident, including dominant
expression by both progenitor genomes, particularly with respect to multiple isoforms
- 25 -
corresponding to each SSP (Table 4). Similar patterns of differential and
uncoordinated expression of protein isoforms was also demonstrated in the synthetic
allopolyploid B. napus (Albertin et al. 2007).
Biased expression of D-genome derived homoeologs, another remarkable
transcriptional feature of allopolyploid Gossypium (Flagel et al. 2008; Hovav et al.
2008; Flagel et al. 2009; Flagel and Wendel 2010), was also observed in the biased
accumulation of cottonseed proteins expressed by D-genome derived homoeologs (e.
g., the vicilin-like protein as shown in Figure 5). Biased expression is generally more
difficult to uncover in complex protein data than in transcriptomic sequence data and
is most easily recognized by the absence of A- or D- genome derived homoeologous
copies (e. g., for legumins). Genetic changes at the protein level accumulate slowly
relative to the scale of diversification among cotton lineages, such that exons differ by
only about 1%, mostly at synonymous sites, among A- and D-genome orthologs
(Senchina et al. 2003), making it difficult to identify and distinguish homoeologous
protein isoforms. Thus, the biased expression reported here is likely a significant
underestimate of biased protein expression in the polyploid, as it relies on the limited
cases of homoeolog loss that are most readily detected.
Unexpectedly high variation among Gossypium seed proteomes: Comparative
proteomics, which permits the characterization of protein level variation among
related species, is in its infancy as an evolutionary approach, particularly with respect
to polyploid species. The few studies that have applied modern proteomic techniques
in a comparative fashion have found little variation among species (Albertin et al.
2005; Albertin et al. 2006; Albertin et al. 2007). In contrast to the expectations
- 26 -
implied by this work as well as the high level of coding sequence conservation among
the species studied, the cotton seed proteomes analyzed here display extraordinary
variation. This variation not only occurs between diploid species, but also between the
allopolyploid species and its model diploid progenitors; only one third of protein
features were common to the three Gossypium species profiled. Although amino acid
sequence variation of SSPs can in principle account for some of this variation, the fact
that there is only ~1% synonymous nucleotide differences among orthologous
Gossypium exons, both in previous studies (Senchina et al. 2003) and for the SSP
genes analyzed here, indicate that amino acid substitutions account for only a very
small part of the variation detected.
This exaggerated interspecific expression variation observed in the Gossypium seed
proteomes, when compared to similar research in Brassica, which revealed 15%
divergence between diploid species and only 1% between the synthesized
allotetraploid B. napus and its diploid progenitors (Albertin et al. 2006), may reflect a
gradual accumulation pattern of differential protein expressions in allopolyploid
cotton naturally formed 1-2 million years ago versus newly synthesized B. napus, as
well as, at least in part, differences in the tissues examined. That is, the stem and root
proteomes studied in Brassica are likely more complex with respect to their
proteomes than are the seed proteomes studied here, which tend to be composed of
fewer protein types that are extensively modified into many isoforms (Hajduch et al.
2005; Higashi et al. 2006; Bourgeois et al. 2009; Larre et al. 2010). Thus, relatively
few underlying differences in post-translational modification programs among cotton
species may propagate to affect multiple isoforms, in the process generating a
relatively large impact on inferences of similarity, at least in comparisons of seed

- 27 -
versus stem or root proteomes. In addition to this speculation, it may be that the
magnitude of proteomic variation is dependent not only on tissue type, but also on
ploidy level (Feldman et al. 1986). Classic isozyme analyses, which is able to detect
variable protein expression in the form of inferred gene losses or silencing, were
previously applied to analyze homoeologous expression patterns in polyploids
(Wendel 2000), and suggested higher variability in expression of seed storage proteins
versus other classes of genes in allopolyploid wheat (Galili and Feldman 1983;
Feldman et al. 1986). Furthermore, some of the differential expression patterns
observed between diploid and polyploid wheat were inferred to result from proteomic
interactions between the contributing genomes (Islam et al. 2003). As the very nature
of allopolyploid species involves the co-existence of homoeologous genomes, which
itself often involves conflict or competition between regulatory machineries that
independently evolved in progenitor species, one can readily envision that the merger
of diverged regulatory and post-translational machineries will lead to vastly enhanced
combinatorial complexity, which in turn is detected in studies such as ours as “novel”
spot presence/absences and transgressive expression levels.
Conclusions: This work presents the first high-quality proteomic map for mature
seeds in cotton, a vital oil and meal seed crop. In total, 155 SSP spots and 5 non-
storage protein spots were identified. In addition to this comprehensive
characterization of protein composition, proteomic profiles were generated, revealing
a pattern of interspecific complexity and non-additive protein accumulation in cotton
allopolyploids. The biased accumulation of seed proteins toward the D-genome
progenitor, combined with the genetic analyses presented here, provides a novel
perspective on the proteomic consequences of polyploidization. One caveat to our
- 28 -
study is that we included only one accession of allopolyploid Gossypium and its
diploid progenitors; therefore, some of the proteomic variation observed might reflect
choice of accession rather than between species. The accessions studied were selected
as the most widely used models for exploring the genomic and transcriptomic
consequences of polyploidy, thereby providing additional among-study perspective.
Further exploration into comparative proteomics, including the analysis of additional
accessions, will be necessary to identify and characterize the regulatory mechanisms
involved in generating the proteomic complexity and novelty observed in these and
other species. It also will be interesting to explore the relationships among tissue
choice, ploidy level, and multiple experimental variables in developing an enhanced
understanding of the effects of hybridization and genome doubling on the proteome of
higher plants.
ACKNOWLEDGEMENTS
We thank Kara Grupp and Anna Krush for their help in tissue collection and Corrinne
Grover for helpful discussions and comments on the manuscript. We also thank
Cotton Incorporated and the National Science Foundation Plant Genome Program for
financial support. Dharminder Pathak was supported by a training grant from Punjab
Agricultural University, Ludhiana, India.
- 29 -
REFERENCES
Adams, K. L., R. Cronn, R. Percifield and J. F. Wendel, 2003 Genes duplicated by
polyploidy show unequal contributions to the transcriptome and organ-specific
reciprocal silencing. Proc Natl Acad Sci USA 100: 4649-4654.
Albertin, W., K. Alix, T. Balliau, P. Brabant, M. Davanture et al., 2007 Differential
regulation of gene products in newly synthesized Brassica napus
allotetraploids is not related to protein function nor subcellular localization.
BMC Genomics 8: 56.
Albertin, W., T. Balliau, P. Brabant, A. M. Chevre, F. Eber et al., 2006 Numerous
and rapid nonstochastic modifications of gene products in newly synthesized
Brassica napus allotetraploids. Genetics 173: 1101-1113.
Albertin, W., P. Brabant, O. Catrice, F. Eber, E. Jenczewski et al., 2005
Autopolyploidy in cabbage (Brassica oleracea L.) does not alter significantly
the proteomes of green tissues. Proteomics 5: 2131-2139.
Anssour, S., T. Krugel, T. F. Sharbel, H. P. Saluz, G. Bonaventure et al., 2009
Phenotypic, genetic and genomic consequences of natural and synthetic
polyploidization of Nicotiana attenuata and Nicotiana obtusifolia. Ann Bot
103: 1207-1217.
Benjamini, Y., and Y. Hochberg, 1995 Controlling the false discovery rate: a
practical and powerful approach to multiple testing. Journal of the Royal
Statistical Society. Series B (Methodological) 57: 289-300.
Bottley, A., N. H. Chapman and R. M. Koebner, 2008 Homoeologous gene silencing
in tissue cultured wheat callus. BMC Genet 9: 65.
Bottley, A., and R. M. Koebner, 2008 Variation for homoeologous gene silencing in
hexaploid wheat. Plant J 56: 297-302.
- 30 -
Bottley, A., G. M. Xia and R. M. Koebner, 2006 Homoeologous gene silencing in
hexaploid wheat. Plant J 47: 897-906.
Bourgeois, M., F. Jacquin, V. Savois, N. Sommerer, V. Labas et al., 2009 Dissecting
the proteome of pea mature seeds reveals the phenotypic plasticity of seed
protein composition. Proteomics 9: 254-271.
Bressani, R., L. G. Elias and E. Baham, 1966 Cottonseed protein in human foods, pp.
75-100 in World Protein Resources, edited by A. M. Altschul.
Buggs, R. J., S. Chamala, W. Wu, L. Gao, G. D. May et al., 2010 Characterization of
duplicate gene evolution in the recent natural allopolyploid Tragopogon
miscellus by next-generation sequencing and Sequenom iPLEX MassARRAY
genotyping. Mol Ecol 19: 132-146.
Buggs, R. J., A. N. Doust, J. A. Tate, J. Koh, K. Soltis et al., 2009 Gene loss and
silencing in Tragopogon miscellus (Asteraceae): comparison of natural and
synthetic allotetraploids. Heredity 103: 73-81.
Chaudhary, B., L. Flagel, R. M. Stupar, J. A. Udall, N. Verma et al., 2009 Reciprocal
silencing, transcriptional bias and functional divergence of homeologs in
polyploid cotton (Gossypium). Genetics 182: 503-517.
Chen, Z. J., and C. S. Pikaard, 1997 Transcriptional analysis of nucleolar dominance
in polyploid plants: biased expression/silencing of progenitor rRNA genes is
developmentally regulated in Brassica. Proc Natl Acad Sci USA 94: 3442-
3447.
Chlan, C. A., K. Borroto, J. A. Kamalay and L. Dure, 1987 Developmental
biochemistry of cottonseed embryogenesis and germination. XIX. Sequences
and genomic organization of the α globulin (vicilin) genes of cottonseed. Plant
Molecular Biology 9: 533-546.
- 31 -
Chlan, C. A., J. B. Pyle, A. B. Legocki and L. Dure, 1986 Developmental
biochemistry of cottonseed embryogenesis and germination XVIII cDNA and
amino acid sequences of members of the storage protein families. Plant
Molecular Biology 7: 475-489.
Comai, L., 2005 The advantages and disadvantages of being polyploid. Nat Rev
Genet 6: 836-846.
Cronn, R. C., R. L. Small, T. Haselkorn and J. F. Wendel, 2002 Rapid diversification
of the cotton genus (Gossypium: Malvaceae) revealed by analysis of sixteen
nuclear and chloroplast genes. Am. J. Bot. 89: 707-725.
Cui, L., P. K. Wall, J. H. Leebens-Mack, B. G. Lindsay, D. E. Soltis et al., 2006
Widespread genome duplications throughout the history of flowering plants.
Genome Res 16: 738-749.
Dure, L., 1989 Characteristics of the storage proteins of cotton. Journal of the
American Oil Chemists' Society 66: 356-359.
Dure, L., 3rd, S. C. Greenway and G. A. Galau, 1981 Developmental biochemistry of
cottonseed embryogenesis and germination: changing messenger ribonucleic
acid populations as shown by in vitro and in vivo protein synthesis.
Biochemistry 20: 4162-4168.
Dure, L., and C. Chlan, 1981 Developmental biochemistry of cottonseed
embryogenesis and germination : XII. Purification and properties of principal
storage proteins. Plant Physiol 68: 180-186.
Dure, L., and G. A. Galau, 1981 Developmental biochemistry of cottonseed
embryogenesis and germination : XIII. Regulation of biosynthesis of principle
storage proteins. Plant Physiol 68: 187-194.
- 32 -
Edgar, R. C., 2004 MUSCLE: multiple sequence alignment with high accuracy and
high throughput. Nucleic Acids Res 32: 1792-1797.
Feldman, M., G. Galili and A. Levy, 1986 Genetic and evolutionary aspects of
allopolyploidy in wheat, pp. 88-100 in The origin and domestication of
cultivated plants, edited by C. Barigozzi. Elsevier, Amsterdam.
Flagel, L., J. Udall, D. Nettleton and J. Wendel, 2008 Duplicate gene expression in
allopolyploid Gossypium reveals two temporally distinct phases of expression
evolution. BMC Biol 6: 16.
Flagel, L. E., L. Chen, B. Chaudhary and J. F. Wendel, 2009 Coordinated and fine-
scale control of homoeologous gene expression in allotetraploid cotton. J
Hered 100: 487-490.
Flagel, L. E., and J. F. Wendel, 2010 Evolutionary rate variation, genomic dominance
and duplicate gene expression evolution during allotetraploid cotton
speciation. New Phytol 186: 184-193.
Frampton, V., W. Pons and T. Kerr, 1958 A comparison of chemical properties of
seeds of Gossypium species. Economic Botany 14: 197-199.
Gaeta, R. T., J. C. Pires, F. Iniguez-Luy, E. Leon and T. C. Osborn, 2007 Genomic
changes in resynthesized Brassica napus and their effect on gene expression
and phenotype. Plant Cell 19: 3403-3417.
Galau, G. A., C. A. Chlan and L. Dure, 1983 Developmental biochemistry of
cottonseed embryogenesis and germination. Plant Molecular Biology 2: 189-
198.
Galau, G. A., H. Y. Wang and D. W. Hughes, 1991 Sequence of the Gossypium
hirsutum D-genome alloallele of legumin A and its mRNA. Plant Physiol 97:
1268-1270.
- 33 -
Galau, G. A., H. Y. Wang and D. W. Hughes, 1992 Cotton Mat5-A (C164) gene and
Mat5-D cDNAs encoding methionine-rich 2S albumin storage proteins. Plant
Physiol 99: 779-782.
Galili, G., and M. Feldman, 1983 Diploidization of endosperm protein genes in
polyploid wheats, pp. 1119–1123 in 6th International Wheat Genetics
Symposium, Kyoto.
Grover, C. E., H. Kim, R. A. Wing, A. H. Paterson and J. F. Wendel, 2004
Incongruent patterns of local and global genome size evolution in cotton.
Genome Res 14: 1474-1482.
Grover, C. E., H. Kim, R. A. Wing, A. H. Paterson and J. F. Wendel, 2007
Microcolinearity and genome evolution in the AdhA region of diploid and
polyploid cotton (Gossypium). Plant J 50: 995-1006.
Ha, M., J. Lu, L. Tian, V. Ramachandran, K. D. Kasschau et al., 2009 Small RNAs
serve as a genetic buffer against genomic shock in Arabidopsis interspecific
hybrids and allopolyploids. Proc Natl Acad Sci USA 106: 17835-17840.
Hajduch, M., J. E. Casteel, K. E. Hurrelmeyer, Z. Song, G. K. Agrawal et al., 2006
Proteomic analysis of seed filling in Brassica napus. Developmental
characterization of metabolic isozymes using high-resolution two-dimensional
gel electrophoresis. Plant Physiol 141: 32-46.
Hajduch, M., J. E. Casteel, S. Tang, L. B. Hearne, S. Knapp et al., 2007 Proteomic
analysis of near-isogenic sunflower varieties differing in seed oil traits. J
Proteome Res 6: 3232-3241.
Hajduch, M., A. Ganapathy, J. W. Stein and J. J. Thelen, 2005 A systematic
proteomic study of seed filling in soybean. Establishment of high-resolution
- 34 -
two-dimensional reference maps, expression profiles, and an interactive
proteome database. Plant Physiol 137: 1397-1419.
Hajduch, M., L. B. Hearne, J. A. Miernyk, J. E. Casteel, T. Joshi et al., 2010 Systems
analysis of seed filling in Arabidopsis: using general linear modeling to assess
concordance of transcript and protein expression. Plant Physiol 152: 2078-
2087.
Higashi, Y., M. Y. Hirai, T. Fujiwara, S. Naito, M. Noji et al., 2006 Proteomic and
transcriptomic analysis of Arabidopsis seeds: molecular evidence for
successive processing of seed proteins and its implication in the stress
response to sulfur nutrition. Plant J 48: 557-571.
Houston, N. L., M. Hajduch and J. J. Thelen, 2009 Quantitative proteomics of seed
filling in castor: comparison with soybean and rapeseed reveals differences
between photosynthetic and nonphotosynthetic seed metabolism. Plant Physiol
151: 857-868.
Hovav, R., J. A. Udall, B. Chaudhary, R. Rapp, L. Flagel et al., 2008 Partitioned
expression of duplicated genes during development and evolution of a single
cell in a polyploid plant. Proc Natl Acad Sci USA 105: 6191-6195.
Hughes, D. W., and G. A. Galau, 1989 Temporally modular gene expression during
cotyledon development. Genes Dev 3: 358-369.
Islam, N., H. Tsujimoto and H. Hirano, 2003 Proteome analysis of diploid, tetraploid
and hexaploid wheat: Towards understanding genome interaction in protein
expression. Proteomics 3: 549-557.
Jiao, Y., N. J. Wickett, S. Ayyampalayam, A. S. Chanderbali, L. Landherr et al., 2011
Ancestral polyploidy in seed plants and angiosperms. Nature 473: 97-100.
- 35 -
Koh, J., P. S. Soltis and D. E. Soltis, 2010 Homeolog loss and expression changes in
natural populations of the recently and repeatedly formed allotetraploid
Tragopogon mirus (Asteraceae). BMC Genomics 11: 97.
Larre, C., S. Penninck, B. Bouchet, V. Lollier, O. Tranquet et al., 2010
Brachypodium distachyon grain: identification and subcellular localization of
storage proteins. J Exp Bot 61: 1771-1783.
Ni, Z., E. D. Kim, M. Ha, E. Lackey, J. Liu et al., 2009 Altered circadian rhythms
regulate growth vigour in hybrids and allopolyploids. Nature 457: 327-331.
Osborne, T. B., 1924 The vegetable proteins. Longmans, Creen and Co., London.
Pandey, S., and N. Thejappa, 1975 Study on relationship between oil, protein, and
gossypol in cottonseed kernels. Journal of the American Oil Chemists' Society
52: 312-315.
Pires, J. C., J. Zhao, M. E. Schranz, E. J. Leon, P. A. Quijada et al., 2004 Flowering
time divergence and genomic rearrangements in resynthesized Brassica
polyploids (Brassicaceae). Biological Journal of the Linnean Society 82: 675-
688.
Pumphrey, M., J. Bai, D. Laudencia-Chingcuanco, O. Anderson and B. S. Gill, 2009
Nonadditive expression of homoeologous genes is established upon
polyploidization in hexaploid wheat. Genetics 181: 1147-1157.
Ramsey, J., 2011 Polyploidy and ecological adaptation in wild yarrow. Proc Natl
Acad Sci USA 108: 7096-7101.
Rapp, R. A., J. A. Udall and J. F. Wendel, 2009 Genomic expression dominance in
allopolyploids. BMC Biol 7: 18.
Salmon, A., L. Flagel, B. Ying, J. A. Udall and J. F. Wendel, 2010 Homoeologous
nonreciprocal recombination in polyploid cotton. New Phytol 186: 123-134.

- 36 -
Schnable, J. C., N. M. Springer and M. Freeling, 2011 Differentiation of the maize
subgenomes by genome dominance and both ancient and ongoing gene loss.
Proceedings of the National Academy of Sciences of the United States of
America 108: 4069-4074.
Senchina, D. S., I. Alvarez, R. C. Cronn, B. Liu, J. Rong et al., 2003 Rate variation
among nuclear genes and the age of polyploidy in Gossypium. Mol Biol Evol
20: 633-643.
Shaked, H., K. Kashkush, H. Ozkan, M. Feldman and A. A. Levy, 2001 Sequence
elimination and cytosine methylation are rapid and reproducible responses of
the genome to wide hybridization and allopolyploidy in wheat. Plant Cell 13:
1749-1759.
Shewry, P. R., J. A. Napier and A. S. Tatham, 1995 Seed storage proteins: structures
and biosynthesis. Plant Cell 7: 945-956.
Sunilkumar, G., L. M. Campbell, L. Puckhaber, R. D. Stipanovic and K. S. Rathore,
2006 Engineering cottonseed for use in human nutrition by tissue-specific
reduction of toxic gossypol. Proc Natl Acad Sci USA 103: 18054-18059.
Swofford, D. L., 2001 PAUP* Phylogenetic analysis using parsimony and other
methods. Version 4., pp. Sinauer Associates, Sunderland, Massachusetts.
Udall, J. A., J. M. Swanson, K. Haller, R. A. Rapp, M. E. Sparks et al., 2006a A
global assembly of cotton ESTs. Genome Res 16: 441-450.
Udall, J. A., J. M. Swanson, D. Nettleton, R. J. Percifield and J. F. Wendel, 2006b A
novel approach for characterizing expression levels of genes duplicated by
polyploidy. Genetics 173: 1823-1827.
- 37 -
Wang, J., L. Tian, H. S. Lee, N. E. Wei, H. Jiang et al., 2006 Genomewide
nonadditive gene regulation in Arabidopsis allotetraploids. Genetics 172: 507-
517.
Wendel, J. F., 2000 Genome evolution in polyploids. Plant Mol Biol 42: 225-249.
Wendel, J. F., and R. C. Cronn, 2003 Polyploidy and the evolutionary history of
cotton, pp. 139-186 in Advances in Agronomy. Academic Press.
Wendel, J. F., A. Schnabel and T. Seelanan, 1995 Bidirectional interlocus concerted
evolution following allopolyploid speciation in cotton (Gossypium). Proc Natl
Acad Sci USA 92: 280-284.
Youle, R. J., and A. H. Huang, 1979 Albumin storage protein and allergens in
cottonseeds. J Agric Food Chem 27: 500-503.
Youle, R. J., and A. H. C. Huang, 1981 Occurrence of low molecular weight and high
cysteine containing albumin storage proteins in oilseeds of diverse species.
Amer J Bot 68: 5.
- 38 -
FIGURE 1 - Evolutionary history of Gossypium species
A. Phylogenetic framework of diploid and allopolyploid Gossypium, illustrating the divergence
of the A- and D-genome diploids and their polyploidization leading to the evolution of the AD-
genome allopolyploid cottons.
B. Morphology of mature cottonseeds. Key to species: AD = G. hirsutum var. Acala Maxxa; A
= G. herbaceum (A1-73); D = G. raimondii. Shown are seeds with (above) and without lint
(below).
FIGURE 2 - Proteomic profile of G. hirsutum seeds
A. Experimental design for two-dimensional gel electrophoresis using two pH ranges, 3 to 10
and 4 to 7.
B. Synthetic proteome map of G. hirsutum constructed with images from pH 4 to 7 (left) and
pH 3 to 10 (pH 7-10 region only; right). Identified protein spots are indicated as: vicilin A -
circle; vicilin B - rectangle; vicilin-like - parallelogram; legumin A – diamond; legumin B –
triangle; others - cross.
FIGURE 3 - Differential expression patterns of cotton seed proteomes
Partial 2-DE gels (pH 5 to 6, molecular weight 26 to 17 kD) of AD-genome, and diploid A- and
D-genome seed proteomes. Spots shared by all species and having consistent expression
levels are shown as black circles. Variation in either expression level or presence is indicated
by color, where red denotes expression in the allopolyploid and blue and gold represent
expression levels in the A- and D-genome diploids, respectively. Circle sizes corresponded to
spot volumes.
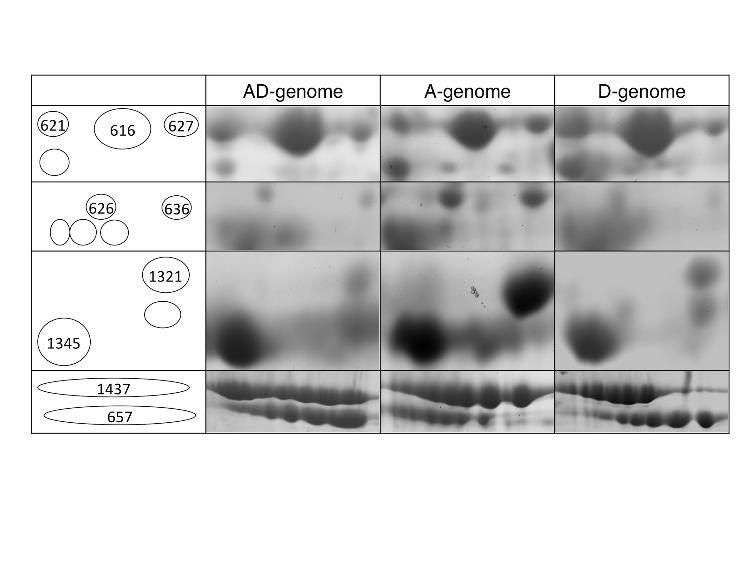
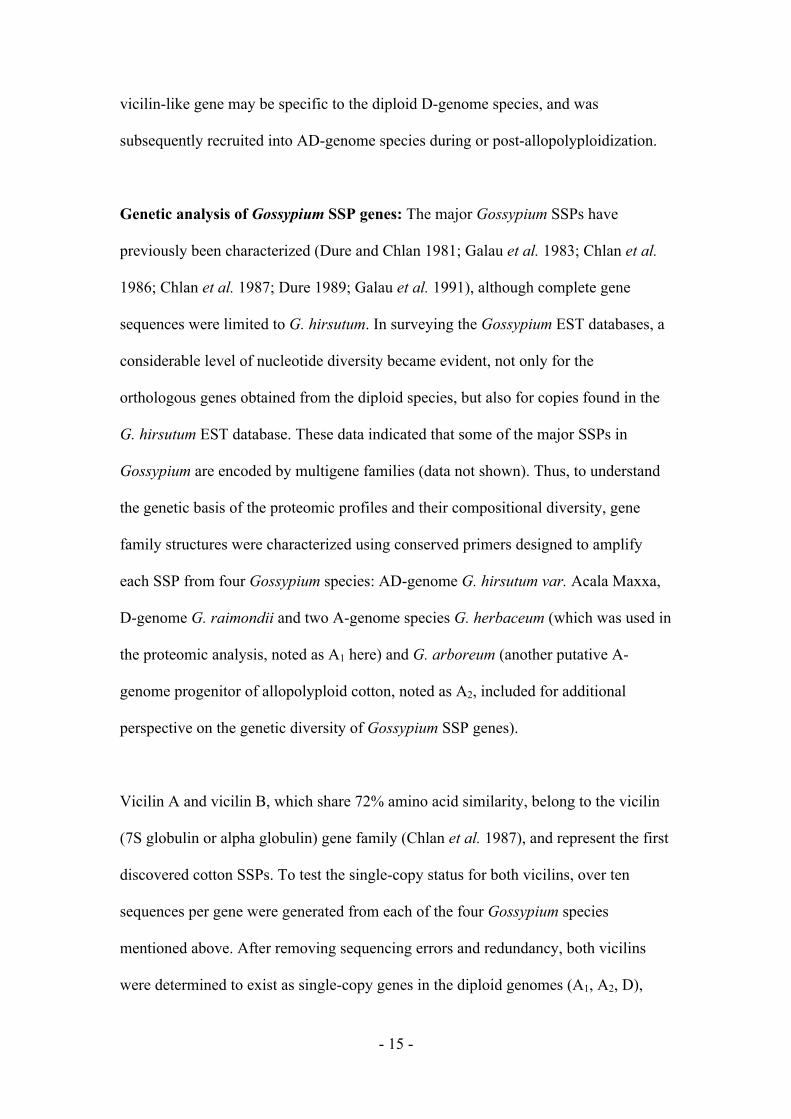
FIGURE 4 - Representative 2-DE gels illustrating additive and non-additive
quantitative expression patterns
Proteins 621, 616, 627 and 1437 display additive patterns. Proteins deviating from statistical
additivity (see text for details) were further categorized as follows: 626 & 636 – D-dominant;
1345 – A-dominant; 657 – transgressive expression above both diploids; 1321 - transgressive
expression lower than both diploids. These proteins were identified by mass spectrometry as
vicilin A (657, 1321), vicilin B (1437), and legumin A (621, 616, 627, 636, 1345).
FIGURE 5 - 2-DE gels of Vicilin-like isoforms

- 39 -
Vicilin-like isoforms are indicated by ovals.
FIGURE 6 - Neighbor-joining trees of SSP genes in Gossypium
Numbers of total and non-synonymous (in parenthesis) nucleotide substitutions are indicated
on branches. Those distinguishing the (A, AT) from (D, DT) clades are unpolarized and hence
are shown at the root of each tree. AT and DT refer to homoeologous copies in the
allopolyploid genome. The symbol * indicates a sequence with a stop codon.
FIGURE 7 - Distribution and polypeptides of vicilin isoforms in Gossypium
The symbol * indicates a glycosylation site.

- 40 -
TABLE 1
Qualitative comparison of seed proteomes of allopolyploid G. hirsutum (AD-genome)
and its parental diploid A- and D-genomes
Pattern of qualitative expression No. A-genome D-genome AD-genome
Shared spots in all three genomes 92 36.8% 32.2% 29.0%
A-specific 78 31.2%
D-specific 65 22.7%
Genome-specific spots
AD-specific 108 34.1%
A and D 46 18.4% 16.1%
A and AD 34 13.6% 10.7%
Spots found in two genomes
D and AD 83 29.0% 26.2%
Total no. of spots 250 286 317
- 41 -
TABLE 2
Quantitative analysis of protein additivity of shared spots in allopolyploid Gossypium
seed proteomes
Pattern of shared spots No. Percentage
Additive 59 64.1%
Non-additive 33 35.9%
Higher than both diploids 6 6.5%
A-genome dominant
Co-dominant
D-genome dominant
9
3
13
9.8%
3.3%
14.1%
Lower than both diploids 2 2.2%
Total no. of spots 92
- 42 -
TABLE 3
Composition of cotton seed proteomes (percent abundance ± standard error)
AD-genome
G. hirsutum
A-genome
G. herbaceum
D-genome
G. raimondii
Vicilin A 19.14 ± 1.53 13.06 ± 2.48 10.41 ± 1.95
Vicilin B 23.20 ± 3.89 24.66 ± 1.64 18.03 ± 2.04
Legumin A 18.20 ± 2.27 25.78 ± 4.90 32.94 ± 2.75
Legumin B 10.34 ± 1.14 5.95 ± 0.75 10.06 ± 0.87
Vicilin-like 0.20 ± 0.09 0 0.13 ± 0.04
Non-SSP 0.63 ± 0.19 0.36 ± 0.04 0.79 ± 0.21
Unknown* 7.26 ± 1.54 4.73 ± 1.13 6.48 ± 0.86
Total 78.96 ± 2.00 74.54 ± 2.43 78.85 ± 1.51
*Spots were selected for protein identification, but no matched peptides were retrieved from databases.
- 43 -
TABLE 4
Multiplicity of expression patterns displayed by SSP isoforms
Genome
specific Found in two genomes Shared by all three genomes
SSP AD A D AD-A AD-D A-D Additive A* D* Co* Transgressive
Vicilin A 3 1 2 2
Vicilin B 1 1
Vicilin-like 3
Legumin A 6 8 1 1 5 13 3 3 1 2
Legumin B 1 3 1 1 1
*expression dominance