genomic selection 101 - home | animalbiotech
TRANSCRIPT

Van Eenennaam BMM 2/15/2012
Genomic Selection 101 Basics and experiences in cattle
breeding systems
Alison Van Eenennaam, Ph.D. Cooperative Extension Specialist
Animal Biotechnology and Genomics Department of Animal Science University of California, Davis (530) 752-7942 [email protected]
http://animalscience.ucdavis.edu/animalbiotech/
Animal Biotechnology and Genomics Education
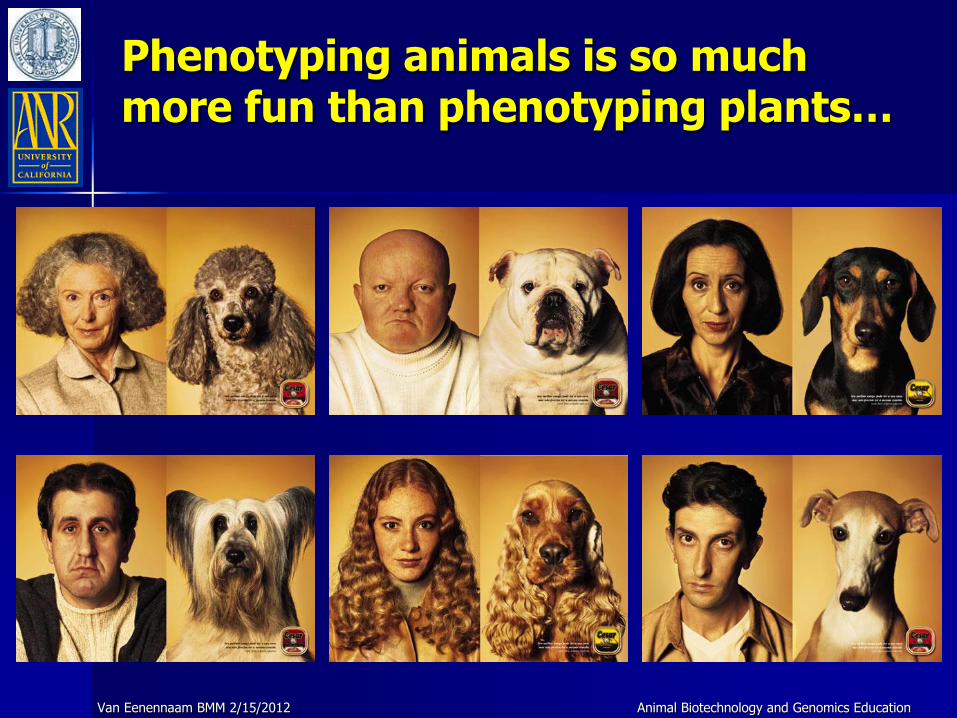
Phenotyping animals is so much more fun than phenotyping plants…
Van Eenennaam BMM 2/15/2012

Animal Biotechnology and Genomics Education
Relative to plants – animal breeders really have it hard
Long generation interval
Cannot self (at least domestic livestock can’t!)
Have limited family sizes (often one offspring/yr)
Cannot make RILs easily in domestic livestock
Certainly can’t make double haploids (except fish)
Expensive to phenotype
Can’t measure milk production on bulls
Can’t indiscriminately discard unwanted ones
Most traits seem to obey infinitesimal model
Van Eenennaam BMM 2/15/2012

Animal Biotechnology and Genomics Education
But the end product is so much more satisfying!
Van Eenennaam BMM 2/15/2012

Animal Biotechnology and Genomics Education
Overview
Introduction to cattle breeding
Genomic selection
Practical questions for breeders – Dairy Industry as a genomic selection success story
– Beef Industry as an “opportunity for improvement”
What does the future hold
Note: I have drawn a lot of my material from published literature and would highly recommend you read the references listed at the bottom of the slide to more fully understand this brief overview of complex concepts.
Van Eenennaam BMM 2/15/2012
Animal Biotechnology and Genomics Education
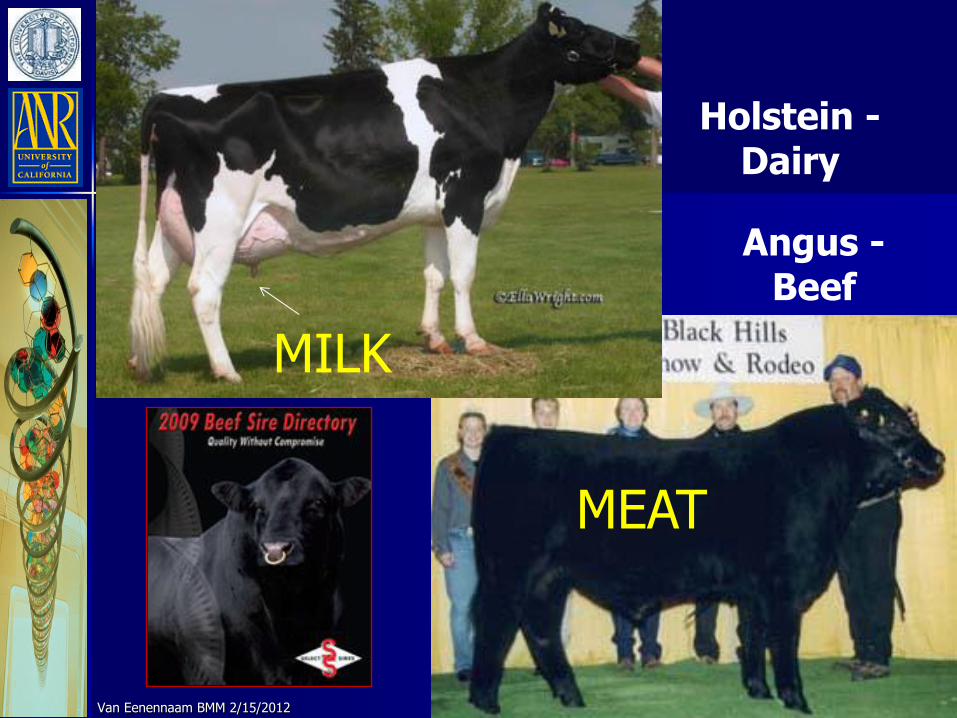
Holstein - Dairy
Angus - Beef
Van Eenennaam BMM 2/15/2012
MILK
MEAT

Animal Biotechnology and Genomics Education Van Eenennaam BMM 2/15/2012
EPD = expected progeny difference

Animal Biotechnology and Genomics Education
Meat Tenderness
Quality Grade (Marbling)
Beef Cattle Feed Efficiency
Meat Yield
Disease Resistance
Dairy Form
Milk and Milk Component Yield
Before 2010: Marker-assisted selection using 1-100 SNPs
Van Eenennaam BMM 2/15/2012

Animal Biotechnology and Genomics Education
One marbling SNP called GeneStar “*” refers to copy of desirable SNP Which would you rather have???
A bull that is ‘homozygous’ for a positive genetic variant with a low-accuracy EPD of +3, or
Or an unrelated bull carrying no copies of that genetic variant with a low-accuracy EPD of +3
**
Van Eenennaam BMM 2/15/2012
Animal Biotechnology and Genomics Education
Both are important!!
The ‘homozygous’ bull is a source of favorable form of one of the genetic variants. Can eventually be used to create homozygous calves
The other bull contributes other favorable “marbling” genes, which will improve the other genes affecting the trait.
Breeding the marker-associated form of the gene into the bull that has no copies should improve the trait by combining all of the good forms of the genes together in one animal
Van Eenennaam BMM 2/15/2012

Animal Biotechnology and Genomics Education
What was wrong with this MAS model?
Problem with traditional Marker-assisted selection (MAS) approaches is the effect of individual quantitative trait loci (QTL) on complex traits, such as yield, are likely to be small.
A large number of QTL are necessary to explain the genetic variation in these traits
The usefulness of information from a sparse marker map in outbreeding species is also limited because the linkage phase between the marker and the QTL must be established for every family
Van Eenennaam BMM 2/15/2012

Animal Biotechnology and Genomics Education
Genomic selection Alternative is to trace all segments of
the genome with markers
Divide genome into chromosome
segments based on marker intervals
Capture all QTL = all genetic variance
Marker density must be sufficiently high to ensure that all QTL are in linkage disequilibrium (LD) with a SNP marker
Van Eenennaam BMM 2/15/2012
Meuwissen, T. H. E., B. J. Hayes, and M. E. Goddard. 2001. Prediction of Total Genetic Value Using Genome-Wide Dense Marker Maps. Genetics, Vol. 157, 1819-1829

Van Eenennaam BMM 2/15/2012
I think there's a world market for about five computers.
Thomas J. Watson, chairman of the board of IBM. 1943
There is no reason anyone would want a computer in their home.
Ken Olson, president of Digital Equipment Corp. 1977
The cost for a genome scan (defined as 18 chromosomes* 7 markers (i.e. 126
markers!) * $4/marker) = $504 Ben Hayes and Mike Goddard, 2003. Evaluation of marker assisted selection in
pig enterprises. Livestock Production Science 81:197-211.
Wrong Expert Predictions
Animal Genomics and Biotechnology Education
Animal Biotechnology and Genomics Education
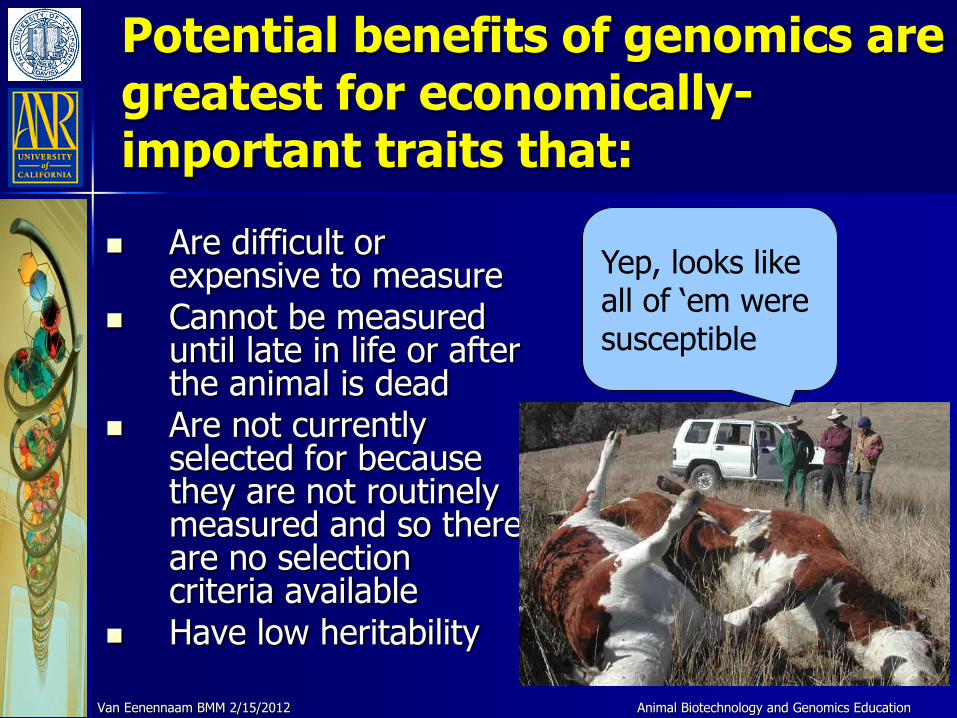
Potential benefits of genomics are greatest for economically-important traits that:
Are difficult or expensive to measure
Cannot be measured until late in life or after the animal is dead
Are not currently selected for because they are not routinely measured and so there are no selection criteria available
Have low heritability
Yep, looks like all of ‘em were susceptible
Van Eenennaam BMM 2/15/2012

Animal Biotechnology and Genomics Education
Genomic selection is enabled by high- throughput genotyping technology
The sequencing of the bovine genome allowed for the development of a 50,000 SNP chip
Can simultaneously test 50,000 markers – rather than one
Van Eenennaam BMM 2/15/2012

Animal Biotechnology and Genomics Education
Hayes and Goddard. 2009. Mapping genes for complex traits in domestic animals and their use in breeding programmes. Nature Reviews Genetics 10, 381-391
Illumina has a 50,000 (50K) and a 770,000 (700K) SNP chip for cattle
Van Eenennaam BMM 2/15/2012
Animal Biotechnology and Genomics Education
Practical questions for breeders
How many phenotypic records are required in the initial experiment (reference population) used to estimate the effect of chromosome segments?
Van Eenennaam BMM 2/15/2012

Animal Biotechnology and Genomics Education
T: total number of records in the training population
h2: heritability of the trait
L : length of chromosomes (in Morgans)
M: ~ 2Ne (effective population size)
Th2
ML
Accuracy of the prediction equation proportional to:
Van Eenennaam BMM 2/15/2012
Goddard, M. E. 2009. Genomic selection: prediction of accuracy and maximisation of long term response. Genetica 136:245-257.

Animal Biotechnology and Genomics Education
Effective population size estimates for cattle
Breed Ne Breed Ne
Angus 136 Brown Swiss 61
Charolais 110 Guernsey 76
Hereford 97 Holstein 99
Limousin 174 Jersey 73
Red Angus 85 Norwegian Red 106
Brahman 115 Gir 133
Nelore 86
Beef Master 106 Merino (sheep) ~ Big (> 100)
Santa Gertrudis 107 Ben Hayes (pers. comm.)
Genome-Wide Survey of SNP Variation Uncovers the Genetic Structure of Cattle Breeds. 2009 The Bovine HapMap Consortium. Science 3245: 528-532. Supporting Online Material. Table S1. http://www.sciencemag.org/content/suppl/2009/04/22/324.5926.528.DC1
Van Eenennaam BMM 2/15/2012

Animal Biotechnology and Genomics Education
Effect of number of animals on accuracy of prediction equation (for a Ne of 100)
Goddard, M. E., and B. J. Hayes. 2009. Mapping genes for complex traits in domestic animals and their use in breeding programmes. Nature Reviews Genetics 10: 381-391.
Van Eenennaam BMM 2/15/2012

Animal Biotechnology and Genomics Education
Effect of population size and heritability on the number of animals required in the training
population (for an accuracy of 0.7)
Goddard, M. E., and B. J. Hayes. 2009. Mapping genes for complex traits in domestic animals and their use in breeding programmes. Nature Reviews Genetics 10: 381-391.
Van Eenennaam BMM 2/15/2012
Animal Biotechnology and Genomics Education
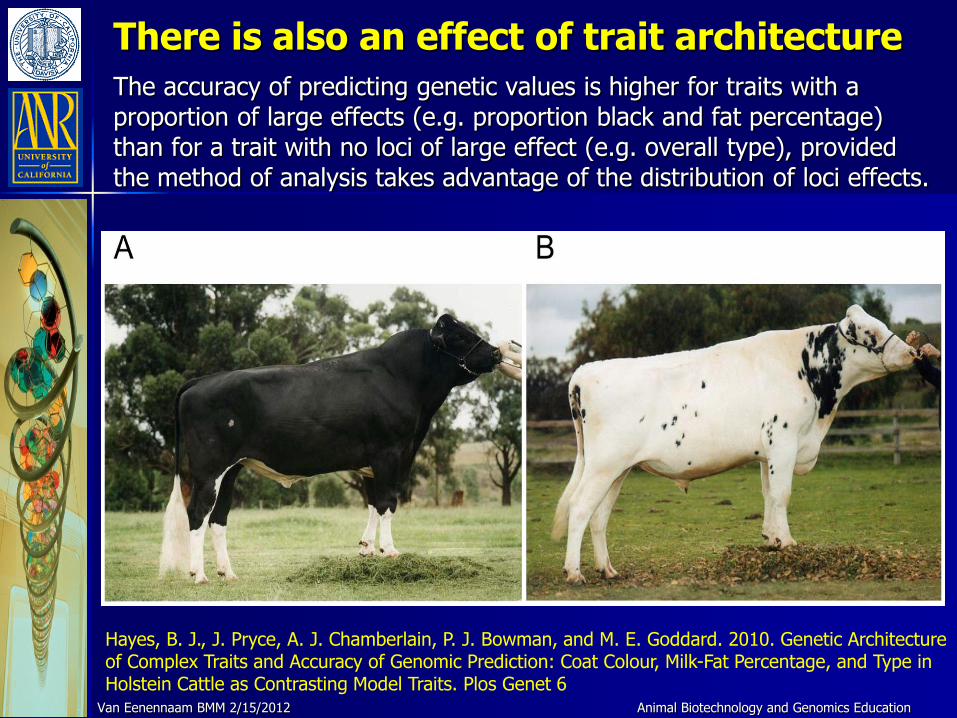
There is also an effect of trait architecture
The accuracy of predicting genetic values is higher for traits with a proportion of large effects (e.g. proportion black and fat percentage) than for a trait with no loci of large effect (e.g. overall type), provided the method of analysis takes advantage of the distribution of loci effects.
Hayes, B. J., J. Pryce, A. J. Chamberlain, P. J. Bowman, and M. E. Goddard. 2010. Genetic Architecture of Complex Traits and Accuracy of Genomic Prediction: Coat Colour, Milk-Fat Percentage, and Type in Holstein Cattle as Contrasting Model Traits. Plos Genet 6
Van Eenennaam BMM 2/15/2012

Animal Biotechnology and Genomics Education
If a nearly infinitesimal model is correct as seems to be the case for most quantitative traits; then large sample sizes will be needed to achieve high accuracy
Maybe R.A. Fisher was onto something?
Van Eenennaam BMM 2/15/2012
Animal Biotechnology and Genomics Education
Number of effects >>> number of records
When we come to estimate the allelic effects of all of these markers, we are faced with estimating many effects in a data set of limited size, and there are not enough degrees of freedom to fit all marker effects simultaneously
Need methods that can deal with that
Van Eenennaam BMM 2/15/2012

Animal Biotechnology and Genomics Education
Statistical methods for genomic selection
A number of approaches have been proposed for estimating the single marker or haplotype effects across chromosome segment effects for genomic selection. The key differences between these approaches is the assumption they make about the variances of haplotype or single marker effects across chromosome segments, and whether is some proportion of markers that have a zero effect.
Van Eenennaam BMM 2/15/2012

Animal Biotechnology and Genomics Education
Dairy industry has successfully implemented genomic selection
Training 1: Old Progeny Tested Bulls
Validation: New Progeny Tested Bulls
Application: New Sire Candidates
r0
r1
Training 2: Old & New Progeny Tested Bulls
Slide courtesy of Marc Thallman, US MARC Van Eenennaam BMM 2/15/2012
Validation: Purpose is to estimate the correlation between the prediction and the true genetic merit

Animal Biotechnology and Genomics Education
Dairy industry suited to WGS
• High use of AI
• Clear selection goal
• One breed used extensively
• Large number of high accuracy A.I. sires for training
• Extensive, uniform collection of data on traits
• Central evaluation (AIPL) receiving genotypes
• Obvious way to increase rate of genetic gain
• AI companies funding the genotyping because they
get a clear cost savings in terms of young sire
program
Van Eenennaam BMM 2/15/2012
Animal Biotechnology and Genomics Education
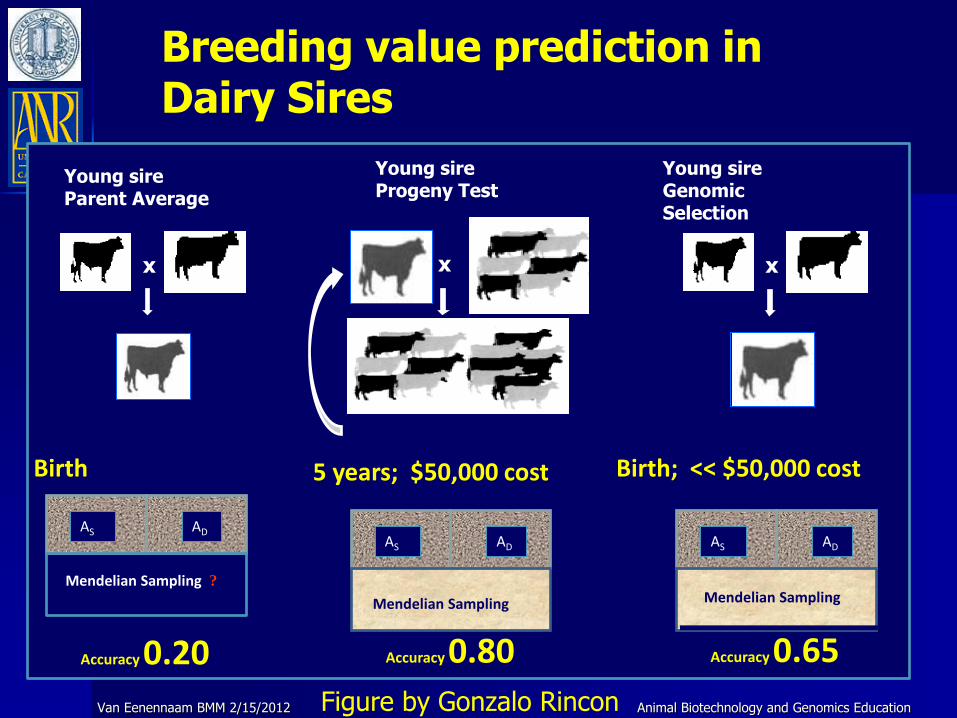
Young sire Parent Average
x
AS AD
Mendelian Sampling ?
Accuracy 0.20
Breeding value prediction in Dairy Sires
5 years; $50,000 cost
x
AS AD
Mendelian Sampling
Young sire Progeny Test
Accuracy 0.80
x
AS AD
Mendelian Sampling
Accuracy 0.65
Young sire Genomic Selection
Birth Birth; << $50,000 cost
Van Eenennaam BMM 2/15/2012 Figure by Gonzalo Rincon

Van Eenennaam BMM 2/15/2012
Genomic selection can help breeders identify individuals with superior breeding values at a young age
ΔG = intensity of selection X
accuracy of selection X
stand. dev. genetic variation
generation interval
Van Eenennaam BMM 2/15/2012
Animal Biotechnology and Genomics Education
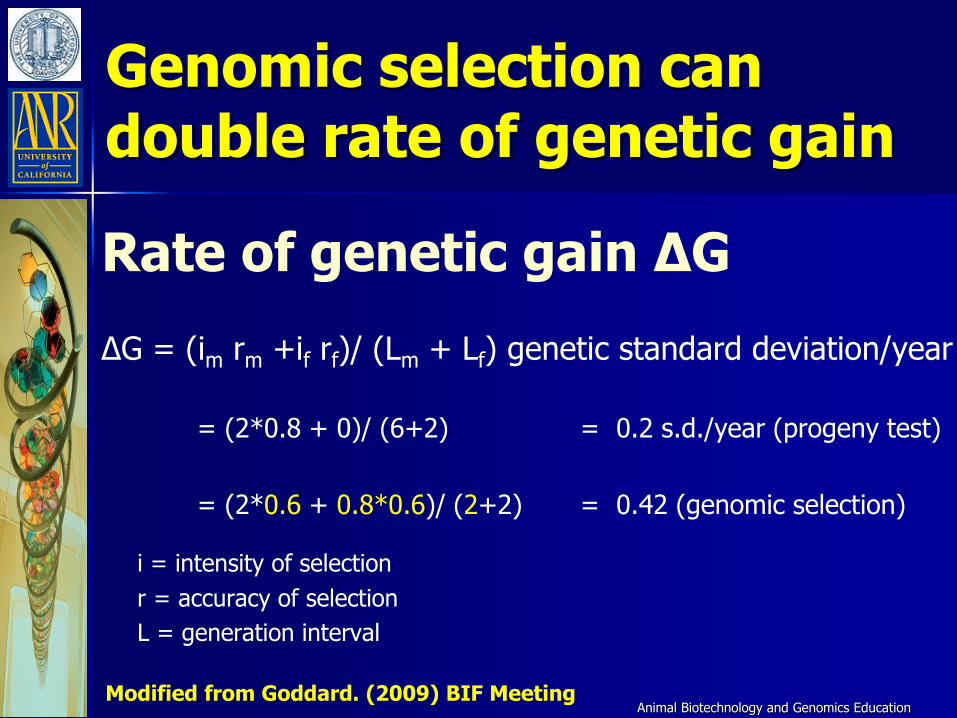
Genomic selection can double rate of genetic gain
Rate of genetic gain ΔG
ΔG = (im rm +if rf)/ (Lm + Lf) genetic standard deviation/year
= (2*0.8 + 0)/ (6+2) = 0.2 s.d./year (progeny test)
= (2*0.6 + 0.8*0.6)/ (2+2) = 0.42 (genomic selection)
i = intensity of selection
r = accuracy of selection
L = generation interval
Modified from Goddard. (2009) BIF Meeting

Animal Biotechnology and Genomics Education
Practical questions for breeders
How many phenotypic records are required in the initial experiment (reference population) used to estimate the effect of chromosome segments?
How often do we need to re-estimate the chromosome segment effects?
Van Eenennaam BMM 2/15/2012

Animal Biotechnology and Genomics Education
How often is it necessary to re-estimate the marker effects?
Van Eenennaam BMM 2/15/2012
Meuwissen, T. H. E., B. J. Hayes, and M. E. Goddard. 2001. Prediction of Total Genetic Value Using Genome-Wide Dense Marker Maps. Genetics, Vol. 157, 1819-1829
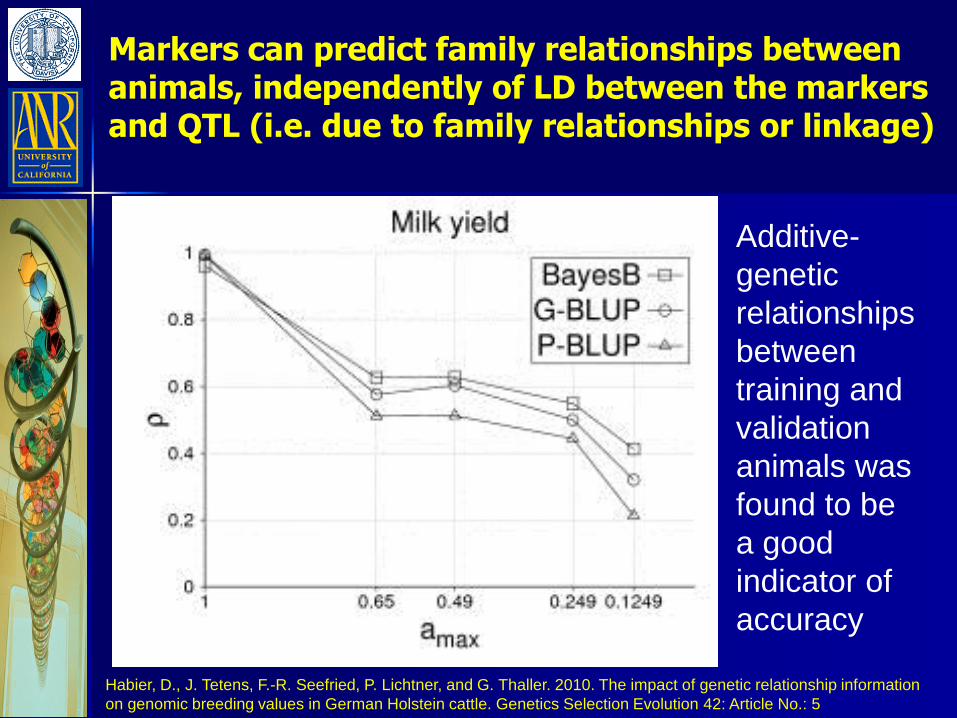
Markers can predict family relationships between animals, independently of LD between the markers and QTL (i.e. due to family relationships or linkage)
Additive-
genetic
relationships
between
training and
validation
animals was
found to be
a good
indicator of
accuracy
Habier, D., J. Tetens, F.-R. Seefried, P. Lichtner, and G. Thaller. 2010. The impact of genetic relationship information
on genomic breeding values in German Holstein cattle. Genetics Selection Evolution 42: Article No.: 5
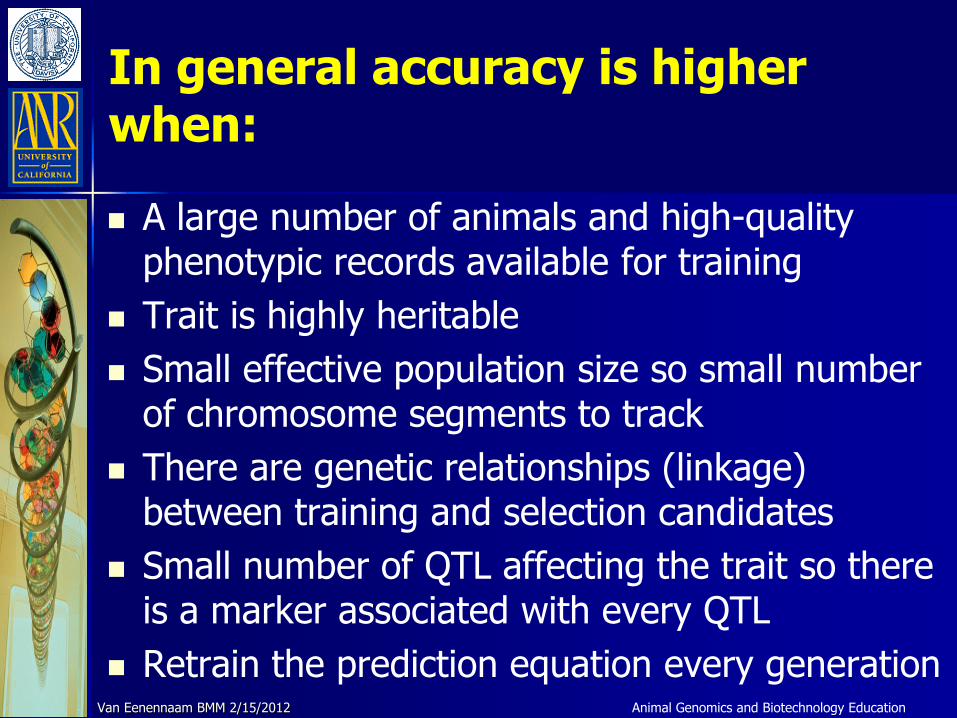
In general accuracy is higher when:
A large number of animals and high-quality phenotypic records available for training
Trait is highly heritable
Small effective population size so small number of chromosome segments to track
There are genetic relationships (linkage) between training and selection candidates
Small number of QTL affecting the trait so there is a marker associated with every QTL
Retrain the prediction equation every generation
Van Eenennaam BMM 2/15/2012 Animal Genomics and Biotechnology Education

Animal Biotechnology and Genomics Education

Animal Biotechnology and Genomics Education
The Beef Cattle Industry
Little use of AI
Relatively few high accuracy sires for training
Multiple competing selection goals – cow/calf, feedlot, processor – little data/value sharing between sectors
Few/no records on many economically-relevant traits
Many breeds, some small with limited resources
Crossbreeding is important
No one wants to pay as value is not recovered by breeder
Van Eenennaam BMM 2/15/2012
A perfect storm is a confluence of events that
drastically aggravates a situation

Practical questions for breeders
How many phenotypic records are required in the initial experiment (reference population) used to estimate the effect of chromosome segments?
How often do we need to re-estimate the chromosome segment effects?
Does it work across breeds/strain/cultivars?
Van Eenennaam BMM 2/15/2012
NO at least not with 50K in cattle
Animal Biotechnology and Genomics Education
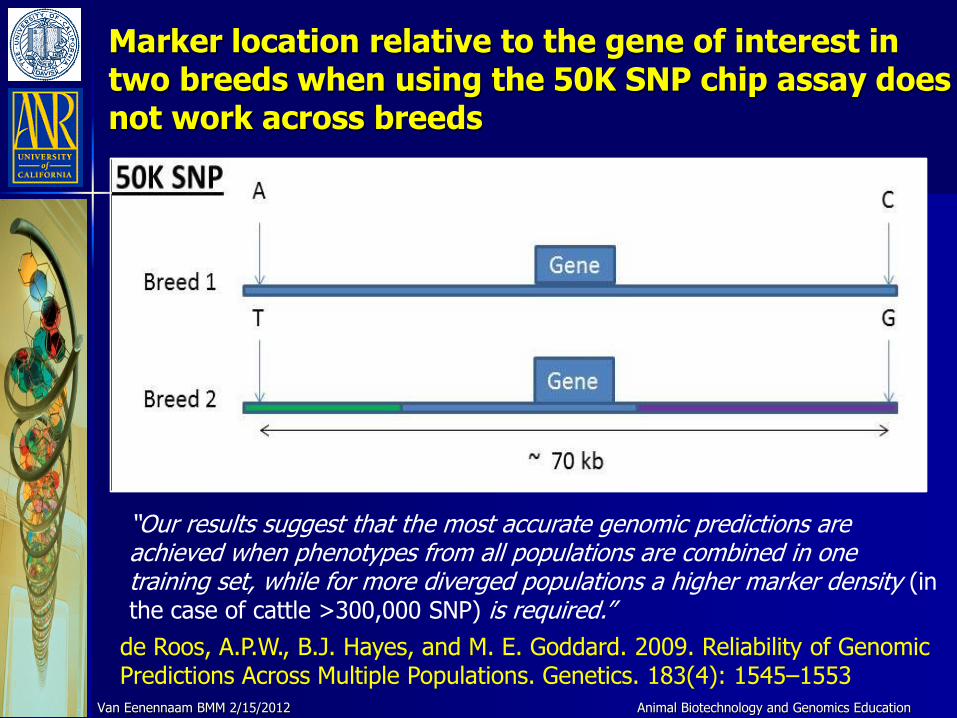
Marker location relative to the gene of interest in two breeds when using the 50K SNP chip assay does not work across breeds
Van Eenennaam BMM 2/15/2012
de Roos, A.P.W., B.J. Hayes, and M. E. Goddard. 2009. Reliability of Genomic Predictions Across Multiple Populations. Genetics. 183(4): 1545–1553
“Our results suggest that the most accurate genomic predictions are achieved when phenotypes from all populations are combined in one training set, while for more diverged populations a higher marker density (in the case of cattle >300,000 SNP) is required.”

Lead Today with 50K
1. Birth weight
2. Weaning weight
3. Weaning maternal (milk)
4. Calving ease direct
5. Calving ease maternal
6. Marbling
7. Backfat thickness
8. Ribeye area
9. Carcass weight
10. Tenderness
11. Postweaning average daily gain
12. Daily feed intake
13. Feed efficiency (net feed intake)
50K SNP chip assays
50,000 SNPs spread
throughout genome ($139)

Practical questions for breeders
How many phenotypic records are required in the initial experiment (reference population) used to estimate the effect of chromosome segments?
How often do we need to re-estimate the chromosome segment effects?
Does it work across breeds/strain/cultivars?
How many markers do you need – 50K, 770K, whole genome?
What about less expensive reduced panels – can they work?
Van Eenennaam BMM 2/15/2012

Animal Biotechnology and Genomics Education
1. Dry Matter Intake 2. Birth Weight 3. Mature Height 4. Mature Weight 5. Milk 6. Scrotal Circumference 7. Weaning Weight 8. Yearling Weight 9. Marbling 10.Ribeye Area 11.Fat Thickness 12.Carcass Weight 13.Tenderness 14.Percent Choice (quality grade) 15.Heifer Pregnancy 16.Maternal Calving Ease 17.Direct Calving Ease 18.Docility 19.Average Daily Gain 20.Feed Efficiency 21.Yearling Height 22. Scrotal Circumfrence
384 SNP ~$40
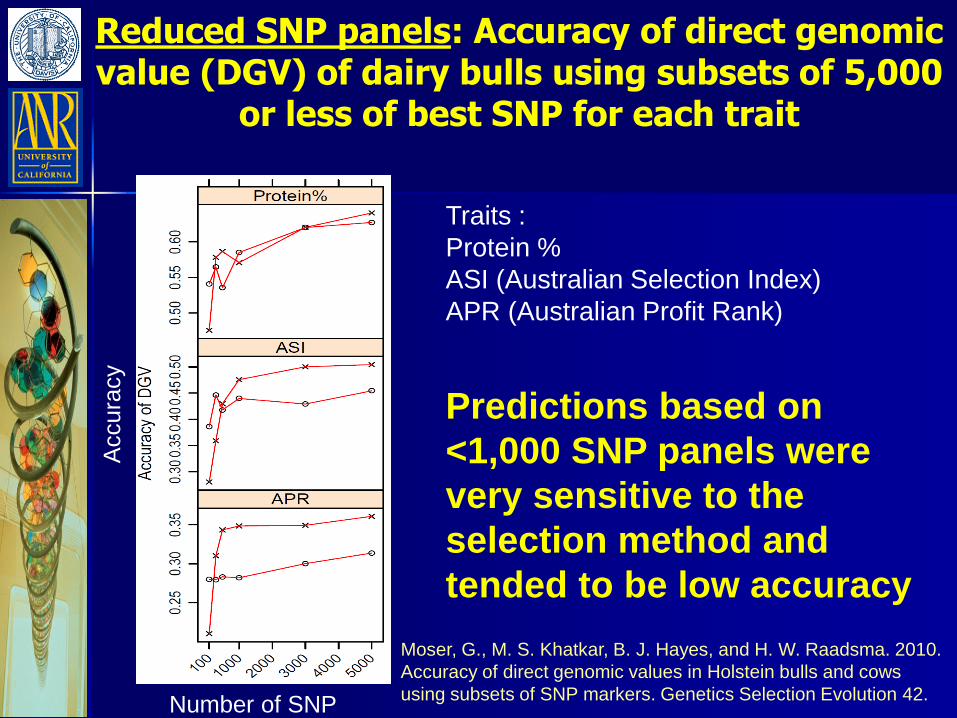
Reduced SNP panels: Accuracy of direct genomic value (DGV) of dairy bulls using subsets of 5,000
or less of best SNP for each trait
Moser, G., M. S. Khatkar, B. J. Hayes, and H. W. Raadsma. 2010.
Accuracy of direct genomic values in Holstein bulls and cows
using subsets of SNP markers. Genetics Selection Evolution 42.
Predictions based on
<1,000 SNP panels were
very sensitive to the
selection method and
tended to be low accuracy
Traits :
Protein %
ASI (Australian Selection Index)
APR (Australian Profit Rank)
Number of SNP
Accura
cy

Reduced SNP panels: Percentage of the highest
ranked SNP that are shared between sets of traits* for subsets including 500, 1,000, 5,000 or 10,000 SNP
Moser, G., M. S. Khatkar, B. J. Hayes, and H. W. Raadsma. 2010. Accuracy of direct genomic values in
Holstein bulls and cows using subsets of SNP markers. Genetics Selection Evolution 42.
* Dairy traits included:
1. Protein
2. Protein %
3. Survival
4. Fat %
5. Milk
6. Overall Type
7. APR (Australian Profit Rank)
8. ASI (Australian Selection Index)
9. Fat
Few SNPs were in
common between
the trait-specific
subsets

Summary of what the literature is telling us about genomic selection
Prediction equations derived in one breed do not predict accurate GEBVs when applied to other breeds
Combining breeds into one large multi-breed reference population may give reasonable accuracies in purebreds
To find markers that are in LD with QTL across diverged breeds, such as Holstein, Jersey, and Angus, will require high density SNPs (>300,000 informative markers in cattle)
If markers are picking up family relationships (linkage), then the accuracy of marker-based selection will decay over generations within a breed/line/cultivar
Few of the “best” markers for one trait are common to another so “reduced panels” will need to be designed for imputation not single trait selection
Van Eenennaam BMM 2/15/2012 Animal Genomics and Biotechnology Education


Animal Biotechnology and Genomics Education
Marker location relative to the gene of interest in two breeds when using the (A) 50K SNP chip assay (markers spaced at ~ 70 kb intervals), or (B) the high density 700 K SNP chip assay (markers spaced at ~ 5 kb intervals)
Van Eenennaam BMM 2/15/2012


It may be necessary to go to whole genome resequencing – select with the causative SNPs (rather than LD)?
Van Eenennaam BMM 2/15/2012 Animal Genomics and Biotechnology Education
Cost is likely to get to as low as $1000/animal
Whole genome data >40% more accurate than dense SNP chips
Need to use Bayesian approaches to estimate SNP effects
Predictions remained accurate in populations 10 generations removed from the reference population
Meuwissen, T. and M. Goddard. 2010. Accurate prediction of genetic values for complex traits by whole-genome resequencing. Genetics 183:623-631.
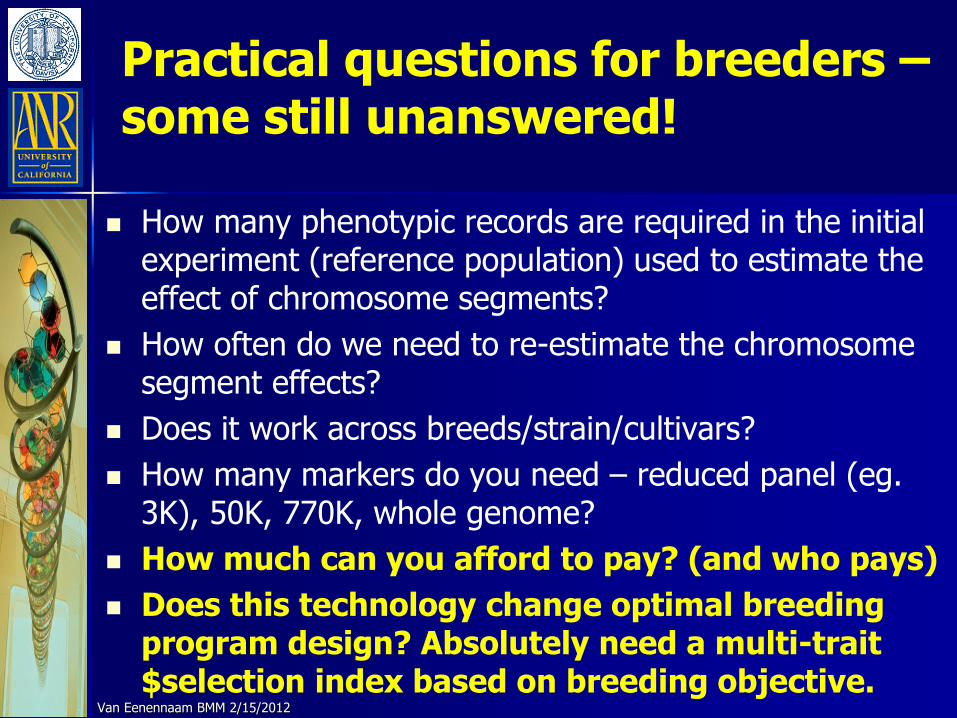
Practical questions for breeders – some still unanswered!
How many phenotypic records are required in the initial experiment (reference population) used to estimate the effect of chromosome segments?
How often do we need to re-estimate the chromosome segment effects?
Does it work across breeds/strain/cultivars?
How many markers do you need – reduced panel (eg. 3K), 50K, 770K, whole genome?
How much can you afford to pay? (and who pays)
Does this technology change optimal breeding program design? Absolutely need a multi-trait $selection index based on breeding objective.
Van Eenennaam BMM 2/15/2012

Questions? Van Eenennaam BMM 2/15/2012 Animal Genomics and Biotechnology Education