genomic data reveal ancient microendemism in forest ... data reveal ancient microendemism in forest...
TRANSCRIPT
Genomic data reveal ancient microendemism in forestscorpions across the California Floristic Province
ROBERT W. BRYSON JR. , * WARREN E. SAVARY,† AMANDA J. ZELLMER,‡ R. BRUCE BURY§ and
JOHN E. MCCORMACK‡ ¶*Department of Biology and Burke Museum of Natural History and Culture, University of Washington, Box 351800, Seattle,
WA 98195-1800, USA, †Department of Entomology, California Academy of Sciences, 55 Music Concourse Drive, Golden Gate
Park, San Francisco, CA 94118, USA, ‡Department of Biology, Occidental College, 1600 Campus Road, Los Angeles, CA 90041,
USA, §41410 NW 12th Street, Corvallis, OR 97330, USA, ¶Moore Laboratory of Zoology, Occidental College, 1600 Campus
Road, Los Angeles, CA 90041, USA
Abstract
The California Floristic Province (CFP) in western North America is a globally signifi-
cant biodiversity hotspot. Elucidating patterns of endemism and the historical drivers
of this diversity has been an important challenge of comparative phylogeography for
over two decades. We generated phylogenomic data using ddRADseq to examine
genetic structure in Uroctonus forest scorpions, an ecologically restricted and dispersal-
limited organism widely distributed across the CFP north to the Columbia River. We
coupled our genetic data with species distribution models (SDMs) to determine climat-
ically suitable areas for Uroctonus both now and during the Last Glacial Maximum.
Based on our analyses, Uroctonus is composed of two major genetic groups that likely
diverged over 2 million years ago. Each of these groups itself contains numerous
genetic groups that reveal a pattern of vicariance and microendemism across the CFP.
Migration rates among these populations are low. SDMs suggest forest scorpion habi-
tat has remained relatively stable over the last 21 000 years, consistent with the genetic
data. Our results suggest tectonic plate rafting, mountain uplift, river drainage forma-
tion and climate-induced habitat fragmentation have all likely played a role in the
diversification of Uroctonus. The intricate pattern of genetic fragmentation revealed
across a temporal continuum highlights the potential of low-dispersing species to shed
light on small-scale patterns of biodiversity and the underlying processes that have
generated this diversity in biodiversity hotspots.
Keywords: arachnid, California Floristic Province, dispersal, endemism, phylogeography
RADseq, species distribution model, Uroctonus
Received 14 December 2015; revision accepted 3 May 2016
Introduction
The California Floristic Province (CFP) in western North
America is a globally significant biodiversity hotspot
that extends across more than 70% of California and
parts of Oregon, Nevada and Baja California in Mexico
(Myers et al. 1999). It is one of only five regions in the
world with a Mediterranean-type climate and encom-
passes a variety of diverse habitats, from coastal
chaparral to montane conifer forests (Myers et al. 1999;
Baldwin 2014). Over 5000 species of plants and verte-
brates are found within the CFP, over 40% of which are
endemic (Myers et al. 1999). More than 30% of the
known insect species north of Mexico are found within
the CFP (Conservation International 2011).
Understanding the historical processes generating the
remarkable diversity of the CFP has been a frequent
study in phylogeography over the past two decades
(e.g. Rodr�ıguez-Robles et al. 1999; Calsbeek et al. 2003;
Lapointe & Rissler 2005; Polihronakis & Caterino 2010).
California’s complex geological history, dynamicCorrespondence: Robert W. Bryson, Jr., Fax: 206 616 2011;
E-mail: [email protected]
© 2016 John Wiley & Sons Ltd
Molecular Ecology (2016) 25, 3731–3751 doi: 10.1111/mec.13707
climatic fluctuations and varied habitats together cre-
ated numerous opportunities for species diversification
across the CFP. Uplift of the Coastal and Transverse
Ranges and parts of the Sierra Nevada during the Late
Miocene and Pliocene around 3–8 million years ago
(Huber 1981; Unruh 1991; Lock et al. 2006) had pro-
found impacts on regional climate and created sharp
elevation and environmental gradients (Raven & Axel-
rod 1978). This period of landscape change was fol-
lowed by dynamic climate shifts associated with the ice
ages and interglacial periods. Fluctuations in Pacific
Ocean currents beginning in the Pliocene, and amplified
during the Pleistocene, led to aridification across much
of California (Ravelo et al. 1997; Herbert et al. 2001).
Coincident with those changes were increases in the
amplitude of glacial cycles, which repeatedly frag-
mented, expanded and restructured species assem-
blages (Raven & Axelrod 1978; Keeley & Swift 1995;
Minnich 2007).
Although California biodiversity is relatively well
described at the regional level (Hickerson et al. 2010),
studies of dispersal-limited taxa continue to provide
new insight into the historical processes that generated
species diversity across the CFP (e.g. Mart�ınez-Solano
et al. 2007; Polihronakis & Caterino 2010; Polihronakis
et al. 2010; Hedin et al. 2013; Reilly & Wake 2015). As
argued by Hedin et al. (2013), the signature of genetic
structure at relatively small spatial scales (i.e. within
the CFP) is more likely to be found in sedentary species
with poor dispersal abilities. Because dispersal across
barriers is limited, divergences in low-dispersing spe-
cies can be remarkably fine-grained and extend across
both deep and shallow timescales (Hedin et al. 2013).
As a result, low-dispersing taxa have greater potential
to reveal biogeographical patterns at multiple scales of
space and time. Fine-scale endemism across the CFP
has been found in a variety of dispersal-limited ani-
mals, including spiders (Starrett & Hedin 2007; Hedin
et al. 2013; Satler et al. 2013), flightless beetles (Polihron-
akis & Caterino 2010), salamanders (Mart�ınez-Solano
et al. 2007; Kuchta et al. 2009a; Reilly & Wake 2015) and
lizards (Leavitt et al. 2007; Parham & Papenfuss 2009).
Forest scorpions of the genus Uroctonus are ecologi-
cally specialized and low-dispersing organisms that are
widely distributed across the CFP north to the Colum-
bia River (Fig. 1). The genus has been redefined over
the past four decades (Stahnke 1974; Williams & Savary
1991; Soleglad & Fet 2004) and currently includes three
species (Uroctonus mordax, Uroctonus franckei and Uroc-
tonus grahami). Uroctonus mordax, comprised of two sub-
species, is broadly distributed across the mountainous
regions of central California, Oregon and southern
Washington (Gertsch & Soleglad 1972; Hjelle 1972). It is
associated with humid microenvironments within a
variety of broader habitats, including coastal scrub, cha-
parral, oak grasslands, and pine-oak, redwood and
mixed-conifer forests (Gertsch & Soleglad 1972; Hjelle
1972). Populations of U. mordax from the Santa Cruz
Mountains along the southern Coastal Range of Califor-
nia are considered a distinct subspecies, U. m. pluridens,
primarily based on the differences in the number of
internal denticles on the fingers of the pedipalp (Hjelle
1972; Soleglad & Fet 2004). Uroctonus franckei inhabits
high-elevation (>2100 m) mixed-conifer forest along the
steep eastern slopes of the Sierra Nevada (Williams
1986). Uroctonus grahami is a rare cave-dwelling scor-
pion known only from Samwel Cave in northern Cali-
fornia (Gertsch & Soleglad 1972; Sissom & Reddell
2009). Although relatively little has been published
about the ecology of Uroctonus, their ecomorphotype
(heavy body, robust pedipalps and relatively short
metasoma) are typical of burrowing scorpions with lim-
ited dispersal abilities (Polis 1990). In one population of
U. mordax in the Coastal Range of California, individu-
als had very small home ranges (less than a few square
metres), marked burrow specificity and a low tolerance
to hot and dry microenvironments (Bacon 1972).
Phylogeographical patterns of species distributed
across the CFP have largely been based on one or a few
genetic loci, usually mitochondrial DNA (mtDNA).
New evidence suggests this reliance on a single gene
might have misled prior work that found congruent lin-
eage divergence across the CFP (Myers et al. 2013)
because of asymmetrical gene flow, introgression and
other stochastic processes that affect mtDNA dispropor-
tionately (Funk & Omland 2003; Edwards & Bensch
2009). Here, we used phylogenomic data to examine
genetic structure in Uroctonus scorpions and species dis-
tribution models (SDMs) to determine climatically suit-
able areas for Uroctonus both now and during the last
glacial maximum (LGM). Results allowed use to assess
several competing hypotheses. Because forest scorpions
are habitat specialists, one hypothesis is that they
would closely track the geographical distribution of
their habitat through time. In this scenario, change in
the location of their habitat from the LGM to present
would have led to dispersal over a landscape already
shaped by Earth history events, thus creating shallow
genetic divergences. Such postglacial habitat tracking
has been inferred for other scorpions (Yamashita &
Rhoads 2013), including several species in western
North America (Graham et al. 2013a,b). Another possi-
bility is that habitats have not shifted dramatically from
the LGM to present day, in which case forest scorpion
genetic divergences are predicted to be older and per-
haps even reflect the timing of Earth history events
causing vicariance. An alternate hypothesis is that forest
scorpion habitats have shifted dramatically from the
© 2016 John Wiley & Sons Ltd
3732 R. W. BRYSON ET AL.
STG
JNL
ROG
CCL
CTW
WKY
MAU
SONMDB
AVY
CAM
PAS
PLA
JAK
CRD
BGP
BRM
LAB
LAH
MGV
CAL
NEL
CATFRI
POW
TEJ
SHA
RED
BAL
SPV
WHP
SVE
WEE
COR
CAR
DET
GEY
PCY
MYC
SAM
0 100 200 300 40050km
124° W 122° W 120° W 118° W
124° W 122° W 120° W 118° W
46° N
34° N
36° N
38° N
40° N
42° N
44° N
46° N
34° N
36° N
38° N
40° N
Uroctonus mordaxUroctonus franckeiUroctonus grahami
Washington
Oregon
California
Eel River
Nevada
KlamathMtns
Cascades
Cascades
CoastalRange
CoastalRange
SierraNevada
TehachapiMtns
CALIFORNIA FLORISTICPROVINCE
CoastalRange
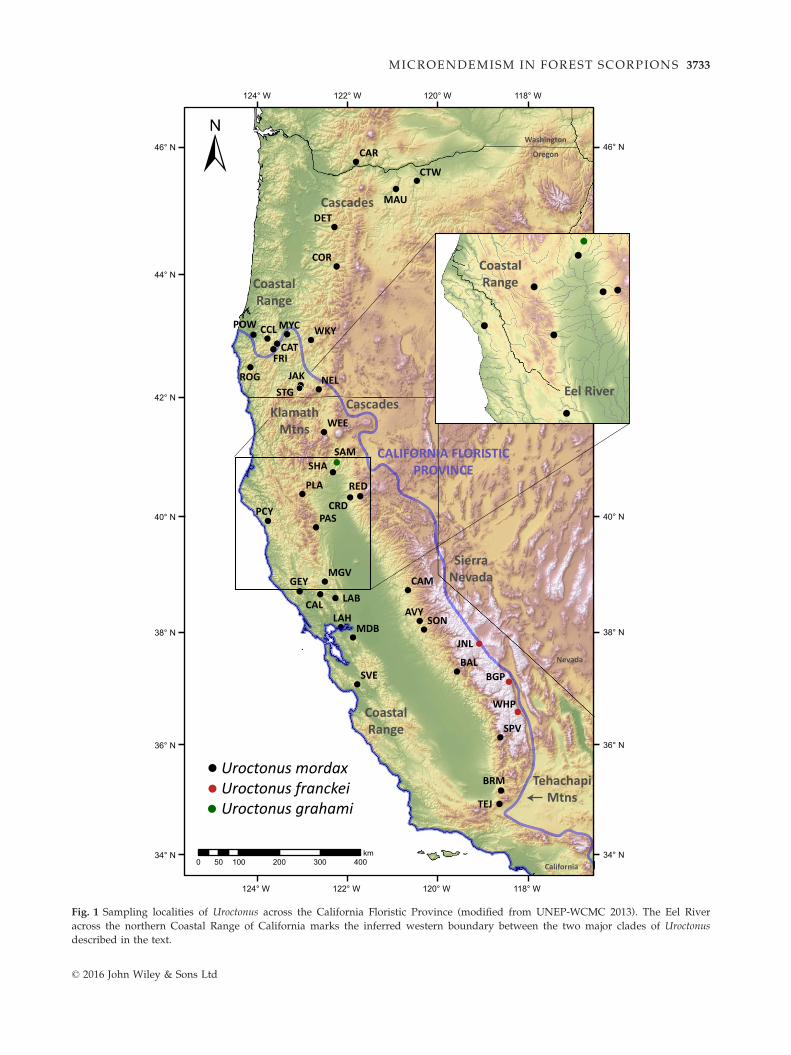
Fig. 1 Sampling localities of Uroctonus across the California Floristic Province (modified from UNEP-WCMC 2013). The Eel River
across the northern Coastal Range of California marks the inferred western boundary between the two major clades of Uroctonus
described in the text.
© 2016 John Wiley & Sons Ltd
MICROENDEMISM IN FOREST SCORPIONS 3733

LGM to present, but that the scorpions have not tracked
these broadscale changes and instead have persisted in
suitable microhabitats. This hypothesis would find sup-
port if the SDMs for the LGM and present day are dra-
matically different, but if the genetic data nonetheless
support deep divergences congruent with ancient
vicariance.
Materials and methods
Taxon sampling and DNA sequencing
We collected 193 samples of Uroctonus from 40 localities
throughout their distribution (Fig. 1, Table S1, Support-
ing information). We sampled all described taxa in the
genus, including the rare cave-adapted species Uroc-
tonus grahami. The regions between the southern Coastal
Range and the Tehachapi Mountains in western Califor-
nia and between the northern Sierra Nevada and south-
ern Cascades in eastern California correspond to
geographical gaps in the known distribution of Uroc-
tonus mordax (Gertsch & Soleglad 1972; Hjelle 1972).
Our attempts to find this scorpion in these areas were
unsuccessful, and none were present in the collection of
over 1200 Uroctonus in the California Academy of
Sciences invertebrate collection examined by one of us
(WES). The appearance of a similar burrow-dwelling
scorpion (Anuroctonus pococki) and shift to a drier cha-
parral-dominated community along the Salinian Block
of the southern Coastal Range and an abundance of
ultisol soils in the northern Sierra Nevada may be rea-
sons why U. mordax is seemingly absent from these
regions. The higher-level taxonomic placement of Uroc-
tonus has been debated in recent years, and this genus
has been placed in either Vaejovidae (e.g. Stockwell
1989; Sissom 2000; Prendini & Wheeler 2005) or Chacti-
dae (Soleglad & Fet 2003, 2004). Our own unpublished
data suggest that Uroctonus may be a vaejovid distantly
related to other putative ‘Uroctonini’ (sensu Stockwell
1989) but with no close phylogenetic relationship to any
extant species.
We generated genomewide single nucleotide poly-
morphism (SNP) data using the double-digest restric-
tion-digest-associated DNA marker (ddRADseq)
protocol of Peterson et al. (2012). We extracted high-
molecular weight genomic DNA from pedipalp tissue
using Qiagen DNeasy Blood & Tissue Kits (Qiagen
Inc.). Extractions were run out on 1.8% agarose gels to
visually inspect DNA quality. We digested 200–500 ng
of DNA (up to 43 lL total) for 2 h at 37 °C using 20
units each of the restriction enzymes SbfI-HF and MspI
(New England Biolabs) and 5 lL Cutsmart Buffer (New
England Biolabs) in a single 50 lL reaction. We cleaned
digestions with home-made Serapure beads (Rohland &
Reich 2012; Faircloth & Glenn 2014), quantified concen-
trations using a Qubit fluorometer and then ligated bar-
coded Illumina adaptors onto the fragments.
Afterwards, we combined eight uniquely barcoded
samples into individual pools, cleaned these pools with
Serapure beads and then used a Pippin Prep (Sage
Science) to size-select fragments of 415–515 base pairs.
We then used limited-cycle PCR amplification to add
Illumina-indexed primers and increase concentrations
of sequencing libraries. We used a combination of eight
unique barcodes and 12 Illumina indexes to multiplex
96 samples for a single sequencing lane. PCRs consisted
of a 40 lL reaction volume containing 1 lL dNTPs
(10 mM), 2.0 lL each primer (10 lM), 10 lL Phusion HF
Buffer (59), 0.5 lL Phusion DNA polymerase (Phusion)
and 5–10 ng template DNA (up to 34.5 lL). We ran 11
cycles of PCR using the recommended Phusion condi-
tions. Finally, we cleaned the completed reactions with
Serapure beads and ran samples on an Agilent 2200
TapeStation to quantify the concentration and fragment
size distribution of each pool. We sent pooled ddRAD
libraries to the Vincent J. Coates Genomics Sequencing
Laboratory at UC Berkeley for 100-base single-end
sequencing on an Illumina HiSeq 2000 (12 pooled
libraries per lane).
We also sequenced a fragment of the mitochondrial
gene cytochrome c oxidase subunit I (CO1) from a sub-
set of samples (1–6 per locality, n = 80). This allowed us
to compare phylogeographical structure and estimated
divergence dates between SNPs and mtDNA. The single
sample of U. grahami included in our study was col-
lected after ddRADseq data were generated; however,
we were able to sequence CO1. PCRs contained 6.25 lLTakara ExTaq Polymerase Premix (Takara Mirus Bio
Inc.), 4.25 lL double-distilled water, 0.5 lL each primer
(10 lM) and 1.0 lL of template DNA. We used the pri-
mers CO1modF and LE1r (Bryson et al. 2013). Cycling
conditions included an initial denaturation at 94 °C for
2.5 min, followed by 35 cycles of denaturation at 94°Cfor 30 s, annealing at 54°C for 30 s and extension at
72°C for 1 min, with a final 10-min extension at 72°C.PCR products were checked by electrophoresis on 1.8%
agarose gels and then sent to High-Throughput Geno-
mics Center (University of Washington, Seattle) for
sequencing. We edited and manually aligned the for-
ward and reverse sequences for each individual using
SEQUENCHER v.5.0 (Gene Codes Corporation).
Single nucleotide polymorphism data assembly
We demultiplexed and processed Illumina reads using
the software pipeline PYRAD v.2.16.1 (Eaton & Ree 2013;
Eaton 2014). Nucleotide base calls with a Phred quality
score below 20 were replaced with ‘N’s, and reads with
© 2016 John Wiley & Sons Ltd
3734 R. W. BRYSON ET AL.
more than 10% ‘N’s were discarded. Sequences were
clustered at 90% similarity within samples using USE-
ARCH v.7.0.1090 (Edgar 2010) and aligned with MUSCLE
v.3.8.31 (Edgar 2004). Error rate and heterozygosity
were jointly estimated from the base counts in each site
across all clusters. Consensus sequences with less than
five reads, more than five undetermined sites, more
than five heterozygous sites or more than two haplo-
types were discarded. Consensus sequences were then
clustered across samples using the same 90% similarity
threshold and aligned. Any locus with a site appearing
heterozygous across more than 50% of samples was dis-
carded as likely representing a clustering of paralogs.
We set the minimum number of samples in a final locus
to 96, allowing up to 50% missing data per locus.
Although the full impact of missing data on phyloge-
netic analyses of SNP data remains unknown (Huang &
Knowles 2016), several studies suggest relatively high
levels of missing data (up to 80% per locus) do not
appear to negatively affect topology or population clus-
tering and may increase phylogenetic resolution (Rubin
et al. 2012; Wagner et al. 2013; Streicher et al. 2014;
Leach�e et al. 2014; but see Streicher et al. 2016). After
data filtering in PYRAD, we output two main types of
data for downstream analyses: (i) all RAD loci, includ-
ing variant and invariant sites, and (ii) unlinked SNPs
(one SNP per locus). We visualized missing data across
the complete data matrix using the ‘mdPlot’ function in
R (R Development Core Team 2014) and discarded sam-
ples with >75% missing data.
RADseq data are prone to allele dropout as diver-
gence depth increases due to mutations at restriction
sites (Arnold et al. 2013). This dropout decreases the
number of orthologous sequences obtained across sam-
ples and results in large amounts of nonrandom miss-
ing data shared by individuals that have mutations at
the same loci. After inferring major phylogenetic clades
using all RAD loci (see below), we reassembled the data
in PYRAD, including only demultiplexed Illumina reads
for samples within the same clade to reduce allelic
dropout. We used the same paralog filters as above,
allowed up to 50% missing data per locus and output
several types of data files derived from unlinked SNPs
(e.g. .str and .migrate) for downstream analyses.
Phylogenetic inference
We estimated time-calibrated Bayesian phylogenies for
the RAD loci and mtDNA using BEAST v.1.8.1 (Drum-
mond et al. 2012) on the CIPRES v.3.3 computing cluster
(Miller et al. 2010). We used JMODELTEST v.2.1.7 (Guindon
& Gascuel 2003; Darriba et al. 2012) to select the best-fit
model of evolution, based on the Bayesian information
criterion (BIC), for the concatenated RAD loci
(HKY + I + G) and 1st + 2nd (HKY + I) and 3rd
(HKY + G) codon positions of the CO1 gene. To cali-
brate each phylogeny, we utilized previously published
substitution rates estimated from buthid scorpions pre-
sumably sundered by the same biogeographical events
(Gantenbein & Keightley 2004; Gantenbein et al. 2005).
Although these rates were calculated from buthid scor-
pions distantly related to Uroctonus, no other DNA sub-
stitution rates have been estimated for scorpions. For
the RAD phylogeny, we gave the ucld.mean parameter
a lognormal distribution with a mean of 0.0024 substitu-
tions/site/million years and standard deviation of 0.43,
resulting in a 95% highest probability density (HPD)
ranging from 0.0011 to 0.0044 and spanning mean sub-
stitution rates previously calculated for nine nuclear
genes (concatenated introns, 0.0044; synonymous sites
of concatenated protein-coding genes, 0.0023; nonsyn-
onymous sites of concatenated protein-coding genes,
0.0012; Gantenbein & Keightley 2004). We gave the
ucld.stdev parameter a gamma distribution with a
mean of 0.45 after examining trace plots of the posterior
distributions of preliminary runs. For the mtDNA phy-
logeny, we gave the ucld.mean parameter a lognormal
distribution with a mean of 0.007 and standard devia-
tion of 0.3 (95% HPD = 0.0040–0.0109), centred around
the mean substitution rate of 0.007 previously calcu-
lated for CO1 (Gantenbein et al. 2005). We used a log-
normal relaxed clock model and a constant-size
coalescent (RAD loci) or Yule process (mtDNA) tree
prior and ran analyses for 80 million generations,
retaining trees and parameters every 10 000 steps.
Results were displayed in TRACER v.1.6 (Rambaut &
Drummond 2007) to assess convergence and effective
sample sizes for all estimated parameters. We discarded
the first 25% of trees as burn-in and summarized the
maximum clade credibility tree with median heights
using TREEANNOTATOR v.1.8.1 (Drummond et al. 2012).
Each analysis was repeated with random starting seeds
to confirm adequate mixing and consistent results.
Recent studies have found concatenation of phyloge-
nomic data can lead to overestimated credibility values
in phylogenetic trees (e.g. Song et al. 2012; Xi et al.
2014). We therefore reconstructed a species tree using
the multispecies coalescent model implemented in the
SNAPP v.1.1.6 (Bryant et al. 2012) plugin in BEAST v.2.1.3
(Bouckaert et al. 2014). To reduce computational bur-
den, we grouped 54 samples into nine geographical
groups (six samples each) based on the BEAST analyses
of RAD loci (see below). We used a gamma prior for h(a = 10, b = 1000) and default settings for all other
parameters and ran analyses for 4 million generations,
sampling every 1000 steps, using BEAST v.2.2.1 (Bouck-
aert et al. 2014). We verified MCMC convergence and
acceptable ESS values for parameters in TRACER; ESS
© 2016 John Wiley & Sons Ltd
MICROENDEMISM IN FOREST SCORPIONS 3735
values in the final run exceeded 2000 for all parameters.
We summarized the maximum clade credibility tree
using TREEANNOTATOR and visualized the posterior distri-
bution of species trees after a 25% burn-in using DEN-
SITREE v.2.1.11 (Bouckaert 2010). We ran the analysis
multiple times using different starting seeds, different
priors for h and different priors for the forward and
reverse mutation rates to confirm consistent tree struc-
ture.
To explore the possible impacts of sample size and
allelic dropout on our species-tree reconstruction, we ran
two additional sets of analyses with SNAPP. In the first,
we included all 191 samples, each assigned to one of the
nine geographical groups. In the second, we included all
individuals but used the clade-specific data assemblies,
which increased the number of unlinked SNPs analysed.
We used a gamma prior for h (a = 10, b = 1000), default
settings for all other parameters, and, because of compu-
tational limitations, stopped analyses (sampling every
1000 steps) once ESS values for all parameters were
above 200. For the full data set, this took 430 000 genera-
tions and over 3 months of run-time using 16 processors
on a Titan X250 with two Intel Xeon E5-2440 processors;
it took 400 000 generations and approximately 3 weeks
of run-time for the clade-specific data sets.
Population structure
We used a hierarchical approach to estimate population
structuring within each of the two major clades (north-
ern and southern clades, detailed below) using unlinked
SNPs. Although somewhat laborious, hierarchical
approaches have been shown to detect fine-scale genetic
structuring in taxa with complex evolutionary histories
(e.g. Coulon et al. 2008; Levy et al. 2012; Lambert et al.
2013). Further, hierarchical approaches should mitigate
the spurious effects of isolation by distance on cluster-
ing (Blair et al. 2012). We used STRUCTURE v.2.3.4 (Pritch-
ard et al. 2000; Falush et al. 2003, 2007) to first estimate
range-wide population structuring within each clade.
We ran initial analyses of K = 1–20 using an admixture
model with uncorrelated allele frequencies for 100 000
MCMC generations. However, global analysis in STRUC-
TURE may only identify top-level geographical structure
when hierarchical population structure exists (Waples
& Gaggiotti 2006; Coulon et al. 2008; Papadopoulou &
Knowles 2015). Following Gowen et al. (2014), we sub-
sequently conducted runs of K = 2 on successively
smaller clusters of individuals within each clade until
no geographical clustering was discernable or only one
locality remained. We used an admixture model with
uncorrelated allele frequencies and ran analyses for
1 million generations after a 10% burn-in. Each analysis
was run four times, and clusters of individuals in the
iteration with the highest likelihood were used for
sequential runs.
As an alternative method to infer clusters of geneti-
cally related individuals within each clade, we used k-
means clustering of principal components implemented
in the R package ADEGENET v.1.4.2 (Jombart & Ahmed
2011). The number of clusters was estimated using the
‘find.clusters’ function with the maximum number of
clusters set to 20. We used all principal components of
PCA and ran 20 iterations, logging the K with the low-
est BIC score for each run. To decrease the complexity
of the data set, we repeated analyses using samples
from each of the nine geographical groups comprised
of more than one population inferred from BEAST analy-
ses of RAD loci. We then used discriminant analysis of
principal components (DAPC) to describe the diversity
between inferred clusters. We used one-fourth of the
principal components of PCA from the preliminary
variable transformation as input to DAPC.
Population migration
We used the coalescence-based program MIGRATE-N
v.3.6.6 (Beerli & Felsenstein 2001; Beerli 2006) to esti-
mate migration rates between populations within each
of the major geographical groups inferred from BEAST
analyses of RAD loci. We limited analyses to popula-
tions with three or more individuals and groups com-
prised of more than one population. We used PYRAD to
create the MIGRATE-N in files, and set the minimum clus-
ter size option to one for all populations (meaning that
only loci with data for at least one individual across all
populations were included in each data set). Appropri-
ate prior boundaries were determined from preliminary
exploratory analyses. We evaluated a full migration
model with unrestricted migration among all popula-
tions. Initial start values of h and M were set to 0.001
and 1000, and mutation rates were estimated from the
data. We used diffuse uniform prior distributions for h(0.00001–0.01, d = 0.001) and M (0–1000, d = 100). We
conducted analyses using four heated chains (1.0, 1.2,
3.0, and 10000.0) ran for 20 000 steps, sampling every
100 generations, after 20 000 steps were discarded as
burn-in. We confirmed stationarity of the Markov
chains by verifying ESS values were >100 000 and that
posterior distribution plots for each parameter were
smooth and unimodal. Each analysis was repeated with
random starting seeds to validate convergence and con-
sistency of parameter estimates. We translated estimates
of mutation-scaled immigration rate M output by MI-
GRATE-N into the effective number of migrants per gener-
ation (Nm) by multiplying M with theta (Θ) of the
receiving population and dividing by four (the inheri-
tance scalar for diploid SNP data).
© 2016 John Wiley & Sons Ltd
3736 R. W. BRYSON ET AL.

Species distribution modelling
To investigate the role of climatic changes in the diver-
sification of Uroctonus, we compared SDMs of each
clade for both contemporary climatic conditions and
historical climatic conditions at the LGM (21 kya). The
SDMs allowed us to predict suitable habitat at the LGM
and test for both environmental and spatial overlap
between the clades. We generated SDMs using MAXENT
v.3.3.3 (Phillips et al. 2006). This method uses georefer-
enced specimen locations along with environmental
data layers to create a model of current probability of
occurrence for a species based on environmental condi-
tions. We then used the model for the current distribu-
tion to predict the historical probability of occurrence
based on historical environmental conditions.
For our locality data, we used 360 occurrences for
Uroctonus obtained from three sources, including litera-
ture records (Gertsch & Soleglad 1972; Hjelle 1972;
Crawford 1990), specimens in the California Academy
of Sciences Entomology Collection and samples col-
lected during the study in developing distribution mod-
els (Table S2, Supporting information). Each point was
georeferenced to within 1 km, and no two points occu-
pied the same pixel of the 1 km resolution climate data.
The precise boundary between the northern and south-
ern clades along the northern Coastal Range is
unknown based on our sampling (see results). Several
codistributed, dispersal-limited taxa display distinct
genetic breaks in this region (Shaffer et al. 2004; Starrett
& Hedin 2007; Kuchta et al. 2009b; Reilly & Wake 2015),
often attributed to the Eel River drainage (Fig. 1). We
therefore assigned georeferenced samples north of the
Eel River to the northern clade, and samples south of
the drainage to the southern clade. We created SDMs
using a random subset of 80% of the localities and used
the remaining 20% of localities to test the validity of the
models.
The environmental data included a total of 19 biocli-
matic variables and five landscape variables describing
current conditions at a 30-arcsec resolution (Table S3,
Supporting information). For the historical SDMs, we
used only the 19 bioclimatic variables reconstructed for
21 kya at a 2.5-min resolution (Hijmans et al. 2005;
Table S3, Supporting information). Since past climate
reconstructions are sensitive to the general circulation
models (GCMs) used (Varela et al. 2015), we used three
separate GCMs to validate our historical distribution
reconstructions. The three GCMs used include CCSM4,
MIROC-ESM and MPI-ESM-P (described in Varela et al.
2015) and were downloaded from worldclim.org (Hij-
mans et al. 2005). We elected to include all variables in
the Maxent analyses when possible, as recent research
suggests that overparamaterized models consistently
perform better than underparamaterized models (War-
ren & Seifert 2011). We used R v.3.0.1 (R Development
Core Team 2013) for all manipulation and visualization
of spatial environmental data and niche models. Scripts
are available upon request.
Results
Genetic data
The number of raw reads per individual after demulti-
plexing ranged from 232 863 to 4 196 982
(mean = 1 319 919), and mean cluster depth ranged
from 2.7 to 38.6 (mean = 14.5). One sample (sky436
CAR) had more than 75% missing data (Fig. S1, Sup-
porting information) and was discarded. The final
aligned data set with all RAD loci contained 191 indi-
viduals, 45 785 nucleotides, 497 loci, 6762 SNPs and 493
unlinked SNPs (Table S4, Supporting information). The
Bayesian phylogenetic analysis revealed two major
clades (detailed below). When analysed alone, the
‘northern’ clade contained 95 taxa, 1002 loci, 6659 SNPs
and 974 unlinked SNPs. The ‘southern’ clade, mean-
while, contained 96 taxa, 1344 loci, 14 706 SNPs and
1332 unlinked SNPs. Assembling the data set by clade
produced 1.68–3.01 (mean = 2.46) times more loci per
individual (Table S4, Supporting information), suggest-
ing that RAD loci were being lost due to accumulation
of mutations to the restriction sites leading to dropped
loci. The mtDNA data set contained 806 bp of CO1
data. The uncorrected p-distance between the two main
clades was 5.3%. Aligned data sets were deposited in
Dryad (doi:10.5061/dryad.58sn8), and CO1 sequences
were deposited in GenBank (Accession nos. KX171074–KX171153).
Phylogenetic inference
Bayesian phylogenetic analysis of the RAD loci data set
(191 taxa, 45 785 bp) revealed two major clades with
strong geographical structure within each clade
(Fig. 2a). A ‘northern’ clade consisted of 95 individuals
from 21 localities in southern Washington, Oregon and
northern California. A ‘southern’ clade consisted of 96
individuals from 18 localities in northern and central
California.
We found a strong correspondence between geogra-
phy and genetic lineages within both clades. Four
strongly supported, geographically structured groups
were present within the northern clade (Fig. 3). Samples
of U. mordax from two localities in the northeastern
Cascades of Oregon near the edge of the Columbia
Basin formed a strongly supported group (‘northeastern
Cascades’). Samples from the northwestern Cascades in
© 2016 John Wiley & Sons Ltd
MICROENDEMISM IN FOREST SCORPIONS 3737

U. franckei
(a) RAD loci, BEAST
(b) mtDNA, BEAST
(c) unlinked SNPs, SNAPP
No
rthe
rn C
lad
e
Southern Cascades +northeastern Coastal Range
Klamath Mtns
Northeastern Cascades
Northeastern Sierra Nevada
Northwestern Cascades +Oregon Coastal Range
Southern Sierra Nevada
Southern Coastal Range
Northern Coastal Range
Northwestern Sierra Nevada
0 Mya123456
sky383 PLA
sky194 GEY
sky463 BGP
sky340 BAL
sky417 COR
sky445 WHP
sky380 MDB
sky320 DET
sky338 RED
sky214 RED
sky474 CTW
sky312 WEE
sky484 SON
sky457 JNL
sky310 WEE
sky447 WKY
sky399 CRD
sky477 CTW
sky220 MYC
sky348 WEE
sky381 PLA
sky315 WEE
sky345 BAL
sky378 MDBsky289 MDB
sky450 ROG
sky341 BAL
sky385 PAS
sky365 SPV
sky253 LAH
sky336 RED
sky210 TEJ
sky372 CAM
sky316 WEE
sky356 SVE
sky347 BAL
sky448 WKY
sky379 MDB
sky458 JNL
sky58 BGP
sky452 JNL
sky387 PAS
sky490 SON
sky354 SVE
sky281 PAS
sky335 RED
sky480 STG
sky212 SVE
sky406 CAL
sky294 CAR
sky213 CAR
sky403 MYC
sky411 GEY
sky355 SVE
sky245 MGV
sky404 CAL
sky360 SPV
sky221 SHA
sky219 SPV
sky292 CAR
sky346 BAL
sky400 LAH
sky373 CAM
sky224 CRD
sky278 CAM
sky324 DET
sky330 RED
sky222 CAT
sky367 PCY
sky377 AVY
sky444 WHP
sky295 CAR
sky473 CTW
sky209 WEE
sky478 STG
sky361 SPV
sky486 SON
sky298 MYC
sky262 SHA
sky321 DET
sky461 BGP
sky460 JNL
sky323 DET
sky401 LAH
sky344 BAL
sky413 GEY
sky375 AVY
sky242 CAL
sky223 POW
sky260 NEL
sky303 FRI
sky370 CAM
sky362 SPV
sky343 BAL
sky488 SON
sky357 SVE
sky369 PCY
sky459 JNL
sky475 CTW
sky325 DET
sky416 COR
sky442 WHP
sky327 SHA
sky309 DET
sky271 GEY
sky317 WEE
sky443 WHP
sky384 PAS
sky306 DET
sky358 SVE
sky476 CTW
sky405 CAL
sky485 SON
sky382 PLA
sky300 MYC
sky217 DET
sky424 PCY
sky456 JNL
sky440 WHP
sky328 SHA
sky280 PLA
sky332 RED
sky304 FRI
sky218 WEE
sky279 AVY
sky318 WEE
sky258 MYC
sky453 JNL
sky337 REDsky59 JAK
sky371 CAM
sky265 BRM
sky376 AVY
sky364 SPV
sky297 CARsky293 CAR
sky435 NEL
sky282 POW
sky491 SON
sky441 WHP
sky462 BGP
sky195 PCY
sky439 WHP
sky408 TEJ
sky301 COR
sky257 LAB
sky299 MYC
sky308 DET
sky415 MAU
sky296 CAR
sky363 SPV
sky215 BAL
sky352 SVE
sky269 MGV
sky479 STG
sky449 CCL
sky302 COR
sky374 CAM
sky305 FRI
sky331 RED
sky409 GEY
sky414 MAU
sky334 RED
sky322 DET
sky353 SVE
sky412 GEY
sky451 JNL
sky291 CAR
sky386 PAS
sky455 JNL
sky446 WHP
sky339 BAL
sky230 NEL
sky261 PCY
sky216 COR
sky350 SVE
sky267 WHP
sky290 CAR
sky326 SHA
sky311 WEE
sky319 DET
sky423 MGV
sky307 CAT
sky351 SVE
sky418 COR
sky407 TEJ
sky359 SPV
sky329 SHA
sky333 RED
sky402 MYC
sky454 JNL
3.68 [1.13, 7.56]
6.38 [2.20, 13.60]
4.56 [1.40, 9.54]
northeastern Cascades
Southern Cascades + northeasternCoastal Range
Northwestern Cascades + Oregon Coastal Range
Southern Coastal Range
Northern CoastalRange
Southern SierraNevada
sky463 BGP
sky445 WHP
sky457 JNL
sky458 JNL
sky58 BGPy
sky452 JNLk
sky444 WHP
y
sky461 BGPy
sky460 JNLy
sky459 JNLy
k
sky442 WHPsky443 WHP
y
k
sky456 JNL
sky440 WHP
sky453 JNLy
sky441 WHPk
sky462 BGPk
y
sky439 WHPy
k
sky451 JNLk
y
sky455 JNLy
sky446 WHPy
k
sky267 WHPk
y
sky454 JNLk
y
7.95 [3.39, 14.66]
10.41 [4.52, 18.67]
7.59 [3.30, 13.70]
No
rthe
rn C
lad
eSo
uth
ern
Cla
de
0 Mya12345678910
sky269 MGV
sky474 CTW
sky258 MYC
sky463 BGP
sky341 BAL
sky407 TEJ
sky242 CAL
sky453 JNL
sky280 PLA
sky253 LAH
sky210 TEJsky265 BRM
sky454 JNL
sky442 WHPsky267 WHP
sky260 NEL
sky448 WKY
sky194 GEY
sky195 PCY
sky220 MYC
sky223 POW
sky221 SHA
sky59 JAK
sky209 WEE
sky58 BGP
sky452 JNL
sky480 STG
sky479 STG
sky217 DET
sky214 RED
sky376 AVY
sky257 LAB
sky224 CRD
sky473 CTW
sky455 JNL
sky359 SPV
sky375 AVY
sky213 CAR
sky278 CAM
sky370 CAM
sky441 WHP
sky449 CCL
sky450 ROG
sky451 JNL
sky415 MAU
sky351 SVE
sky289 MDB
sky218 WEE
sky447 WKY
sky212 SVE
sky371 CAM
sky521 SAM
sky279 AVY
sky475 CTW
sky271 GEY
sky462 BGP
sky282 POW
sky440 WHP
sky281 PAS
sky262 SHA
sky443 WHP
sky303 FRI
sky461 BGP
sky215 BAL
sky304 FRI
sky219 SPV
sky485 SON
sky340 BAL
sky222 CAT
sky350 SVE
sky490 SON
sky245 MGV
sky414 MAU
sky408 TEJ
sky439 WHP
sky230 NEL
sky360 SPV
sky478 STG
sky216 COR
sky261 PCY
Northeastern Cascades
Klamath Mtns
Northwestern Cascades +Oregon Coastal Range
Southern Coastal Range
NorthernCoastal Range
* Northeastern Sierra Nevada
Southern Sierra Nevada**
*
*
**
**
U. grahami
sky453 JNL
sky454 JNLsky452 JNL
sky455 JNL
y
sky451 JNL
sky442 WHPsky267 WHP
sky441 WHP
sky440 WHPsky443 WHP
sky439 WHP
sky463 BGPsky58 BGP
y
sky462 BGPsky461 BGP
U. franckei
Klamath Mtns
NorthwesternSierra Nevada
Northeastern Sierra Nevada
NorthwesternSierra Nevada
Southern Cascades + northeasternCoastal Range
No
rthe
rn C
lad
eSo
uth
ern
Cla
de
NortheasternCascades
Southern Cascades +northeastern CoastalRange
Klamath Mtns
Northeastern SierraNevada
Southern SierraNevada
Southern CoastalRange
Northern CoastalRange
Northwestern SierraNevada
Northern Clade Southern Clade
Sou
the
rn C
lad
e
Northwestern Cascades +Oregon Coastal Range
Fig. 2 Phylogenetic relationships in Uroctonus. (a) Time-calibrated BEAST tree inferred from concatenated RAD loci. (b) Time-calibrated
BEAST tree inferred from mitochondrial DNA. Mean estimated divergence dates and 95% posterior credibility intervals (in brackets)
shown for the basal divergence and two major clades of Uroctonus. Samples of Uroctonus franckei delineated with grey boxes to high-
light paraphyly. (c) Cloudograms of posterior estimates of species trees reconstructed from unlinked single nucleotide polymor-
phisms using SNAPP (top estimated from the reduced data set; bottom from clade-specific data sets). In all trees, nodes with black
dots received ≥0.95 posterior probability support, and major geographical groups match those in Fig. 3. See Fig. S2 (Supporting
information) for larger versions of (a) and (b).
© 2016 John Wiley & Sons Ltd
3738 R. W. BRYSON ET AL.
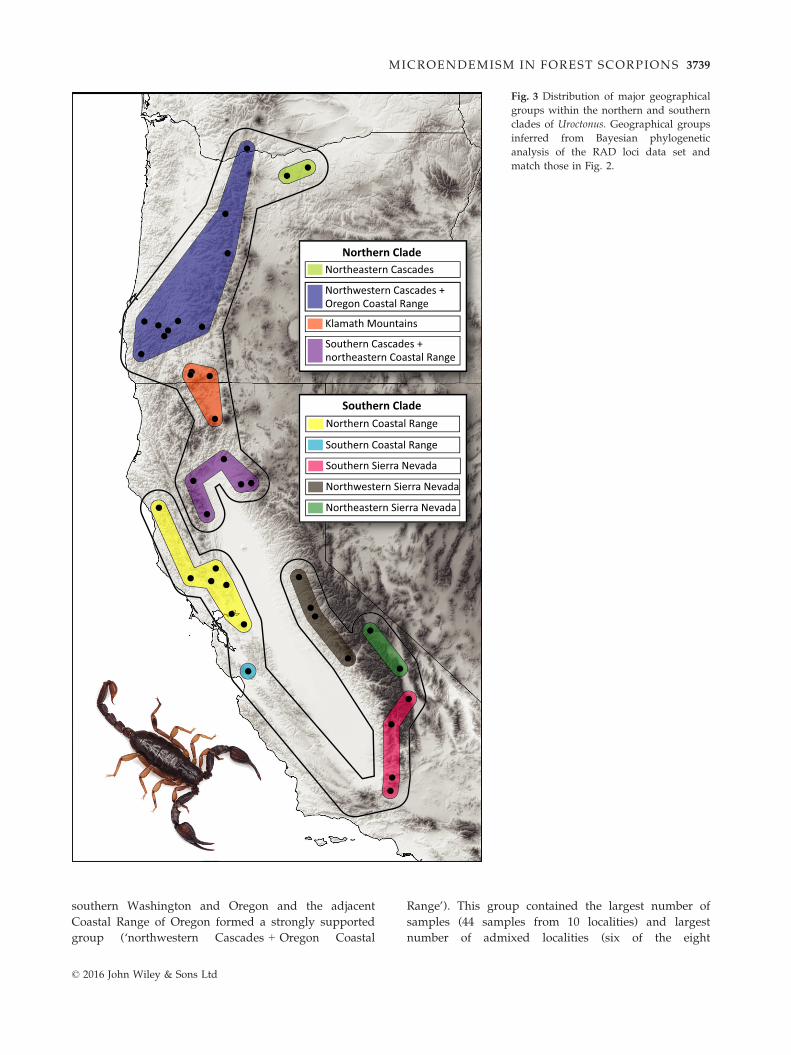
southern Washington and Oregon and the adjacent
Coastal Range of Oregon formed a strongly supported
group (‘northwestern Cascades + Oregon Coastal
Range’). This group contained the largest number of
samples (44 samples from 10 localities) and largest
number of admixed localities (six of the eight
Northern CladeNortheastern Cascades
Northwestern Cascades +Oregon Coastal Range
Klamath Mountains
Southern Cascades + northeastern Coastal Range
Southern Clade
Southern Sierra Nevada
Northeastern Sierra Nevada
Northwestern Sierra Nevada
Southern Coastal Range
Northern Coastal Range
Fig. 3 Distribution of major geographical
groups within the northern and southern
clades of Uroctonus. Geographical groups
inferred from Bayesian phylogenetic
analysis of the RAD loci data set and
match those in Fig. 2.
© 2016 John Wiley & Sons Ltd
MICROENDEMISM IN FOREST SCORPIONS 3739

represented by >1 individual). Uroctonus mordax from
four localities in the Klamath Mountains in southern
Oregon and northern California comprised a strongly
supported group (‘Klamath Mountains’). The remaining
samples from the southern Cascades and northeastern
Coastal Range in northern California formed the fourth
strongly supported geographical group (‘southern Cas-
cades + northeastern Coastal Range’). Within the south-
ern clade, we inferred five strongly supported
geographically structured groups (Fig. 3). Samples of
U. mordax from the Coastal Range of northern Califor-
nia formed two strongly supported groups: a ‘northern
Coastal Range’ group comprised of samples from seven
localities, and a ‘southern Coastal Range’ group com-
prised of samples from a single locality in the Santa
Cruz Mountains. Uroctonus franckei from the eastern
slopes of the Sierra Nevada did not form a mono-
phyletic group. Samples from the two northernmost
localities (June Lake and Big Pine, the type locality for
the species) formed a strongly supported geographical
group (‘northeastern Sierra Nevada’). Samples from the
southernmost locality (Whitney Portal) grouped with
samples of U. mordax from three localities on the oppo-
site slopes of the southern Sierra Nevada and adjacent
Tehachapi Mountains (‘southern Sierra Nevada’). The
remaining samples from the northwestern slopes of the
Sierra Nevada formed a strongly supported clade
(‘northwestern Sierra Nevada’).
Phylogeographical structure inferred from the
mtDNA data set (80 individuals, 805 bp of CO1) was
generally consistent with results from RAD loci. The
same northern and southern clades were recovered with
moderate support (0.87 and 0.92 posterior probability,
respectively) along with substantial geographical struc-
ture within each clade (Fig. 2b). However, nodal sup-
port across the mtDNA tree was low, especially
towards the base of the tree. Seven of the nine geo-
graphical groups inferred from analysis of the RAD loci
were recovered, although three received <0.95 probabil-
ity support. The southern Sierra Nevada geographical
group was rendered paraphyletic by the inclusion of
samples of U. franckei from June Lake. Phylogenetic
analyses of RAD loci placed U. franckei from June Lake
with U. franckei from Big Pine in a well-supported
northeastern Sierra Nevada geographical group
(Fig. 2a). Relationships among geographical groups
were poorly supported across the mtDNA tree except
for the sister relationship between the northeastern Cas-
cades group and northwestern Cascades + Oregon
Coastal Range group. This result strongly conflicted
with the placement of these two groups in the RAD loci
tree (Fig. 2a). Uroctonus grahami was weakly supported
(0.57 posterior probability) as sister to the clade com-
prised of nearby localities in southern Oregon and
northern California (Klamath Mountains and southern
Cascades + northeastern Coastal Range groups).
Estimated dates of divergences differed between the
RAD loci and mtDNA data sets. Whereas estimated
mean divergences among geographical groups based on
analyses of the RAD loci occurred around 2.8–4.5 Mya
during the Pliocene (Fig. 2a), mean estimates based on
mtDNA pre-dated the Pliocene, occurring around 5.0–7.9 (Fig. 2b). However, 95% posterior credibility inter-
vals for divergence date estimates from both data sets
were large and overlapping. We cautiously interpret
these results to suggest that divergences among geo-
graphical groups within Uroctonus probably pre-dated
the Pleistocene, but acknowledge the large uncertainty
surrounding this inference.
Phylogenetic relationships estimated using the multi-
species coalescent model in SNAPP varied depending on
the number of unlinked SNPs analysed. The reduced
data set with 54 individuals contained 312 unlinked SNPs
after sites with missing data were removed by SNAPP.
Although support for the northern and southern clades
was high, support for relationships among the nine geo-
graphical groups within these clades was low (Fig. 2c), in
strong contrast to the tree estimated from the concate-
nated RAD loci (Fig. 2a). Species-tree analyses using the
full data set (all 191 individuals) contained 300 unlinked
SNPs after sites with missing data were removed by
SNAPP. Relationships within the southern clade were iden-
tical to the species tree estimated from the reduced data
set both in terms of topology and low nodal support (tree
not shown). Relationships within the northern clade,
however, matched those in the concatenated RAD loci
tree (Fig. 2a) and were moderately supported (0.92 poste-
rior probability). The species tree estimated for each indi-
vidual clade (Fig. 2c) matched the tree inferred from
concatenated RAD loci (Fig. 2a). The northern clade data
set contained 688 unlinked SNPs, and the southern clade
contained 1088 unlinked SNPs – over two and three times
the number in the full data set. Based on the topological
congruence between these clade-specific species trees
and the concatenated phylogeny, we interpret the con-
catenated phylogeny (Fig. 2a) as our best estimate of
phylogenetic relationships in Uroctonus.
Population structure
STRUCTURE analyses. Analyses in STRUCTURE on each clade
found the optimal K to be 2 based on the DK statistic
(Evanno et al. 2005) as implemented in STRUCTURE HAR-
VESTER v.0.6.94 (Earl & vonHoldt 2012). However, exami-
nation of higher numbers of K indicated additional
geographical clusters were present within both clades.
At K = 4 for the northern clade and K = 5 for the south-
ern clade, clusters matched the major geographical
© 2016 John Wiley & Sons Ltd
3740 R. W. BRYSON ET AL.

groups inferred from BEAST analyses of RAD loci. The
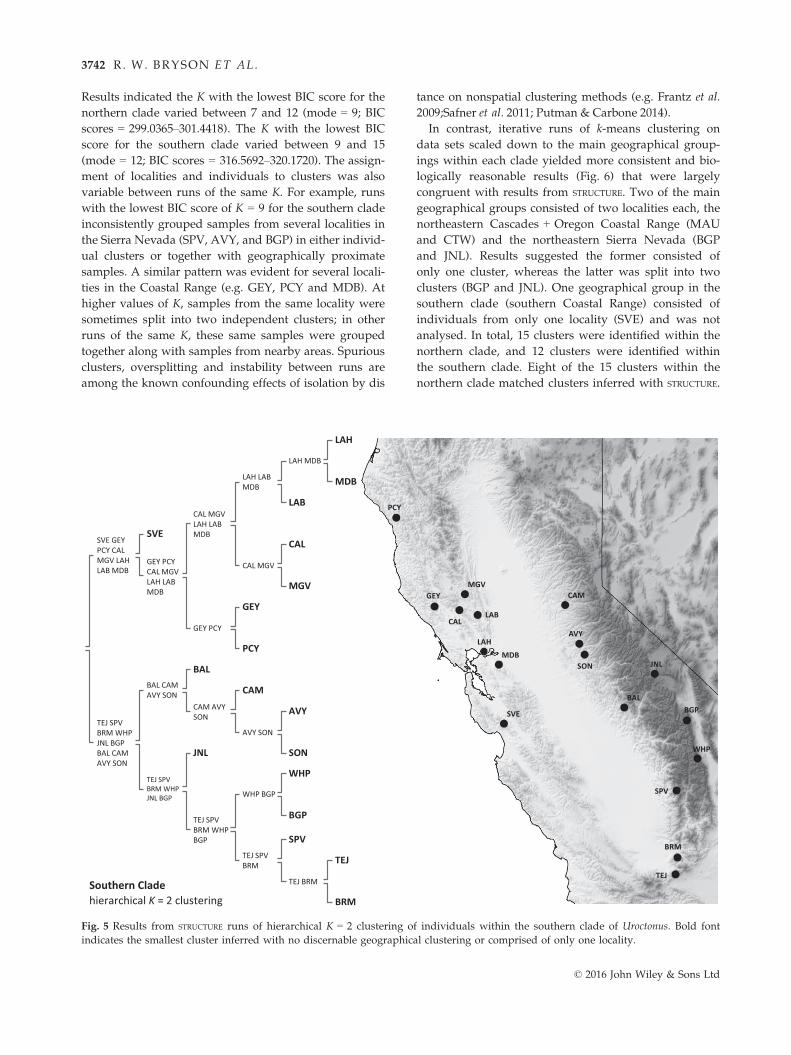
K = 2 hierarchical clustering revealed additional fine-
scale genetic structure (Figs. 4 and 5). In both clades,
nearly every sampling locality was identified as a dis-
tinct cluster with little or no admixture found among
localities. In total, 15 clusters were identified within the
northern clade and 18 clusters were identified within
the southern clade. Only the northern clade contained
single clusters comprised of individuals from multiple
localities.
The amount of missing data in successive iterations
increased as samples were removed. If the distribution
of missing data was nonrandom among samples (e.g.
shared among individuals in a population), STRUCTURE
may have been biased towards grouping samples with
similar patterns of missing data (Pritchard et al. 2010).
To test this possibility, we ran samples from three pairs
of nonadmixed geographically proximate localities
(WEE-NEL, PLA-PAS and AVY-SON) through PYRAD
and removed missing data by setting the minimum
number of samples in a final locus to equal the total
number of samples. If STRUCTURE was clustering individ-
uals from each locality based on nonrandom missing
data, then we expected to find more admixture between
localities after missing data were removed. In all three
examples, results with no missing data showed no
admixture between locality pairs, consistent with
previous results.
ADEGENET analyses. Iterative runs of k-means clustering in
ADEGENET failed to converge on similar numbers or compo-
sitions of clusters of individuals within each clade.
Northern Cladehierarchical K = 2 clustering
CAR CORDET CATFRI WKYCCL MYCROG POW
MYC ROGPOW
ROG POW
ROG POW (1)
POW (1)
MYCCAR CORDET CATFRI WKYCCL
WEE NELSTG JAKMAU CTWRED SHACRD PLAPAS
WEE NELSTG JAKMAU CTW
WEE NELSTG JAK
WEE NEL
WEE
NEL
STG JAK
STG
JAK
MAU CTW
MAU
CTW
RED SHACRD PLAPAS
PAS
RED SHACRD PLA
SHA
RED CRDPLA
PLA
RED CRD
RED
CRD
STG
ROG
CCL
CTW
WKY
MAU
PAS
PLA
JAK
CRD
NEL
CATFRI
POW
SHA
RED
WEE
COR
CAR
DET
MYCPOW
Fig. 4 Results from STRUCTURE runs of hierarchical K = 2 clustering of individuals within the northern clade of Uroctonus. Bold font
indicates the smallest cluster inferred with no discernable geographical clustering or comprised of only one locality.
© 2016 John Wiley & Sons Ltd
MICROENDEMISM IN FOREST SCORPIONS 3741
Results indicated the K with the lowest BIC score for the
northern clade varied between 7 and 12 (mode = 9; BIC
scores = 299.0365–301.4418). The K with the lowest BIC
score for the southern clade varied between 9 and 15
(mode = 12; BIC scores = 316.5692–320.1720). The assign-
ment of localities and individuals to clusters was also
variable between runs of the same K. For example, runs
with the lowest BIC score of K = 9 for the southern clade
inconsistently grouped samples from several localities in
the Sierra Nevada (SPV, AVY, and BGP) in either individ-
ual clusters or together with geographically proximate
samples. A similar pattern was evident for several locali-
ties in the Coastal Range (e.g. GEY, PCY and MDB). At
higher values of K, samples from the same locality were
sometimes split into two independent clusters; in other
runs of the same K, these same samples were grouped
together along with samples from nearby areas. Spurious
clusters, oversplitting and instability between runs are
among the known confounding effects of isolation by dis
tance on nonspatial clustering methods (e.g. Frantz et al.
2009;Safner et al. 2011; Putman & Carbone 2014).
In contrast, iterative runs of k-means clustering on
data sets scaled down to the main geographical group-
ings within each clade yielded more consistent and bio-
logically reasonable results (Fig. 6) that were largely
congruent with results from STRUCTURE. Two of the main
geographical groups consisted of two localities each, the
northeastern Cascades + Oregon Coastal Range (MAU
and CTW) and the northeastern Sierra Nevada (BGP
and JNL). Results suggested the former consisted of
only one cluster, whereas the latter was split into two
clusters (BGP and JNL). One geographical group in the
southern clade (southern Coastal Range) consisted of
individuals from only one locality (SVE) and was not
analysed. In total, 15 clusters were identified within the
northern clade, and 12 clusters were identified within
the southern clade. Eight of the 15 clusters within the
northern clade matched clusters inferred with STRUCTURE.
JNLSONMDB
AVY
CAM
BGP
BRM
LAB
LAH
MGV
CAL
TEJ
BAL
SPV
WHP
SVE
GEY
PCY
SVE GEYPCY CALMGV LAHLAB MDB
SVE
GEY PCYCAL MGVLAH LABMDB
CAL MGVLAH LABMDB
LAH LABMDB
LAH MDB
LAH
MDB
LAB
CAL MGV
CAL
MGV
GEY PCY
GEY
PCY
TEJ SPVBRM WHPJNL BGPBAL CAMAVY SON
BAL CAMAVY SON
BAL
CAM AVYSON
CAM
AVY SON
AVY
SON
TEJ SPVBRM WHPJNL BGP
JNL
TEJ SPVBRM WHPBGP
WHP BGP
TEJ SPVBRM
SPV
TEJ BRM
TEJ
BRMSouthern Cladehierarchical K = 2 clustering
WHP
BGP
Fig. 5 Results from STRUCTURE runs of hierarchical K = 2 clustering of individuals within the southern clade of Uroctonus. Bold font
indicates the smallest cluster inferred with no discernable geographical clustering or comprised of only one locality.
© 2016 John Wiley & Sons Ltd
3742 R. W. BRYSON ET AL.

Ten of the 12 clusters within the southern clade
matched clusters inferred with STRUCTURE. Differences
were attributable to ADEGENET splitting up the single
large cluster of admixed samples from the northwestern
Cascades and Oregon Coastal Range and lumping sev-
eral adjacent localities into single clusters.
Population migration
Results from MIGRATE-N revealed very little migration
among populations with three or more individuals, con-
sistent with findings of little to no admixture between
clusters inferred during hierarchical clustering in STRUC-
TURE. The estimated effective number of migrants per
generation (Nm) was <0.4 between all populations
except for two (Table S5, Supporting information). Both
of these populations were in the northwestern Cascades
and Oregon Coastal Range group and consisted of sam-
ples from seven localities across a large region of the
northwestern Cascades in southern Washington and
western Oregon and adjacent Coastal Range in one pop-
ulation, and samples from Myrtle Creek at the intersec-
tion of the Cascades and Oregon Coastal Range in the
second. In contrast, migration was lowest (Nm ≤ 0.15)
between the two populations of U. franckei in the north-
eastern Sierra Nevada group.
Species distribution modelling
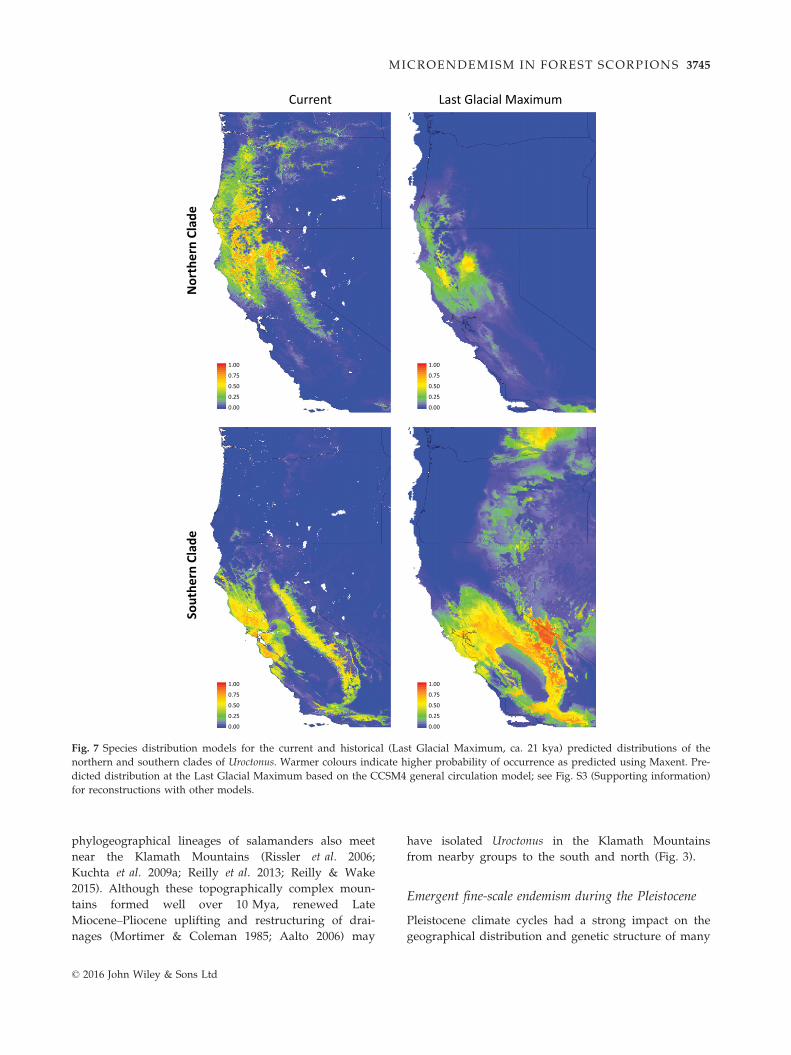
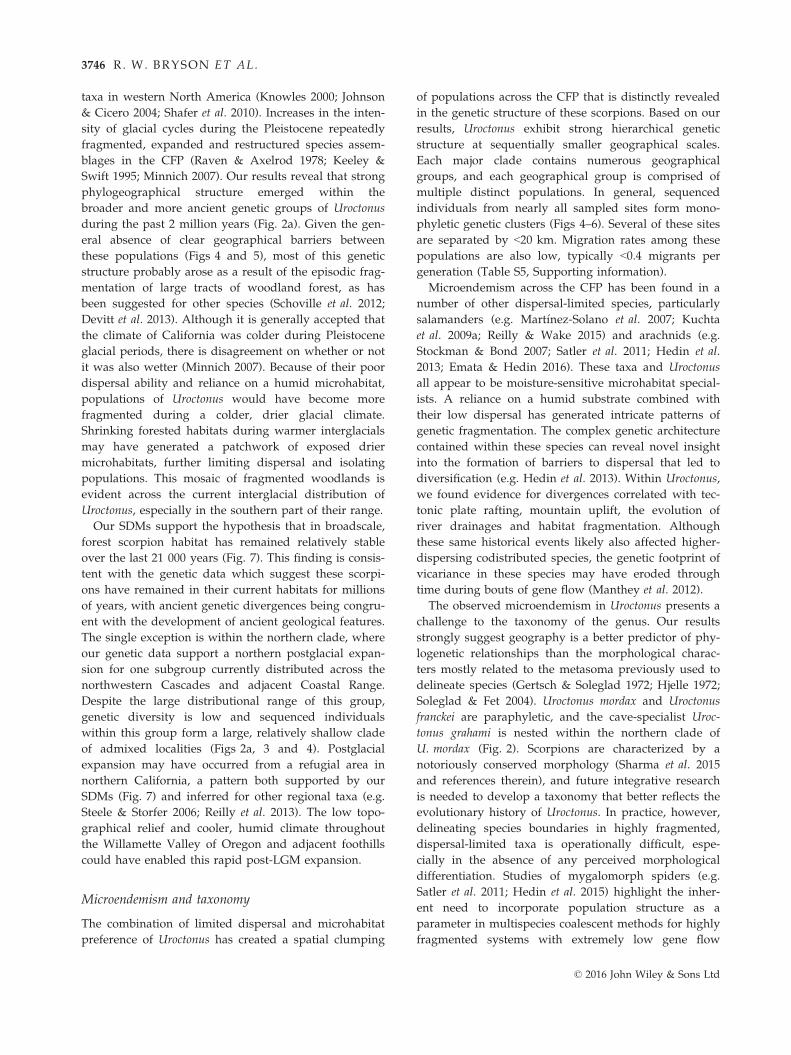
The predicted current distributions for the northern
and southern clades of Uroctonus (Fig. 7) generally
matched their expected distributions (Fig. 3). How-
ever, predicted suitable habitat for the southern clade
included the distributional gap along the northern
Sierra Nevada between Red Bluff (RED) and Camino
(CAM; Fig. 1), and the Transverse Ranges in southern
California where the species is not known to occur.
There was little overlap between the predicted distri-
butions of the two clades, except for small regions of
northern California along the Coastal Range near the
Eel River drainage and along the northern Sierra
Nevada distributional gap. No evidence of genetic
mixing was detected between the northern and south-
ern clades in this area (Fig. 2). The contributions of
each variable to the predicted distributions for both
the northern and southern clades are listed in
Table S6 (Supporting information).
For both the northern and southern clades, the three
alternative historical reconstructed distributions based
on different GCMs were each in agreement (Fig. S3,
Supporting information), suggesting that the historical
reconstructions were robust to variations in the GCMs.
The predicted distribution of the northern clade at the
Nor
ther
n Cl
ade
Sout
hern
Cla
de
Northwestern Sierra NevadaSouthern Sierra NevadaNorthern Coastal Range
Southern Cascades + northeastern Coastal RangeKlamath MountainsNorthwestern Cascades + Oregon Coastal Range
ROG
CAR DET (1)CAT FRI
POW
MYC
CCL
COR DET WKY
STG
NEL WEE
JAK PAS
SHA
RED CRD
PLA
SON
AVY
CAM
BALTEJ BRM
SPV
WHP
PCY
GEY
CAL MGV LAH LAB MDB
Fig. 6 Discriminant analysis of principal components (DAPC) scatter plots showing genetic variation between clusters of Uroctonus
estimated using k-means clustering in ADEGENET. Each scatter plot shows the two first principal components of the DAPC and the
number of genetic clusters with the lowest Bayesian information criterion score within each geographical group. Not shown are the
geographical groups with only two localities, for which only a single discriminant function was retained (northeastern Sierra Nevada
and northeastern Cascades), and for the group comprised of only one locality (southern Coastal Range). Population locations are
shown in Fig. 1.
© 2016 John Wiley & Sons Ltd
MICROENDEMISM IN FOREST SCORPIONS 3743
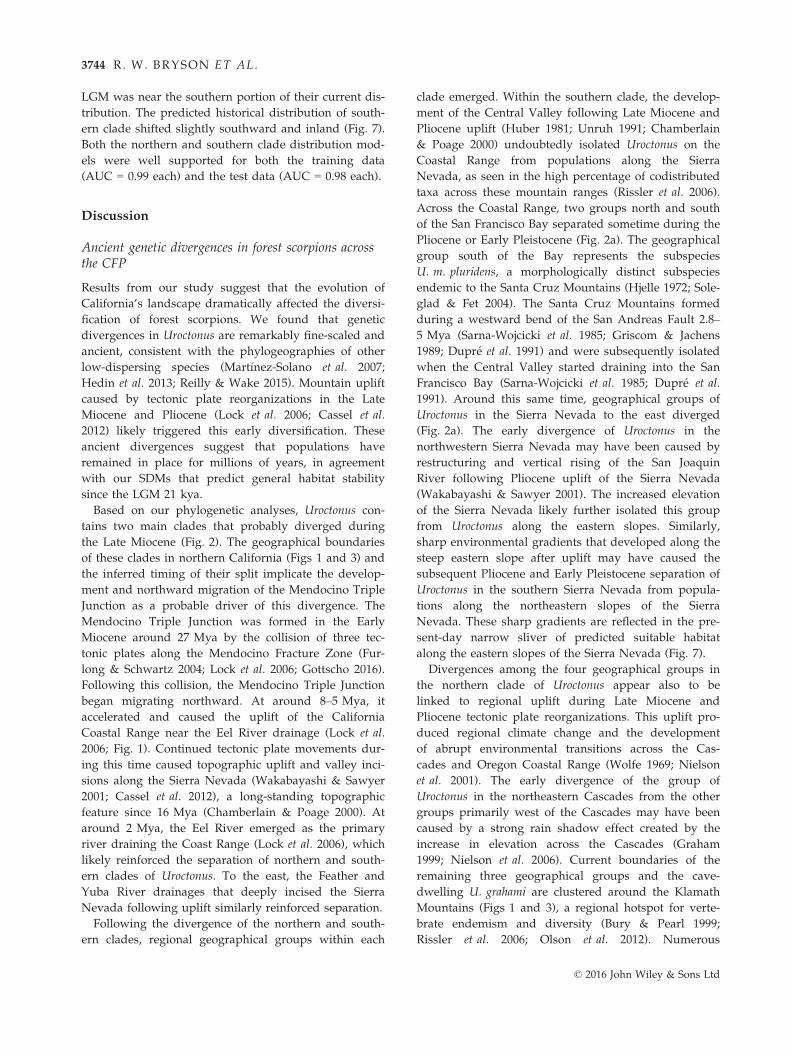
LGM was near the southern portion of their current dis-
tribution. The predicted historical distribution of south-
ern clade shifted slightly southward and inland (Fig. 7).
Both the northern and southern clade distribution mod-
els were well supported for both the training data
(AUC = 0.99 each) and the test data (AUC = 0.98 each).
Discussion
Ancient genetic divergences in forest scorpions acrossthe CFP
Results from our study suggest that the evolution of
California’s landscape dramatically affected the diversi-
fication of forest scorpions. We found that genetic
divergences in Uroctonus are remarkably fine-scaled and
ancient, consistent with the phylogeographies of other
low-dispersing species (Mart�ınez-Solano et al. 2007;
Hedin et al. 2013; Reilly & Wake 2015). Mountain uplift
caused by tectonic plate reorganizations in the Late
Miocene and Pliocene (Lock et al. 2006; Cassel et al.
2012) likely triggered this early diversification. These
ancient divergences suggest that populations have
remained in place for millions of years, in agreement
with our SDMs that predict general habitat stability
since the LGM 21 kya.
Based on our phylogenetic analyses, Uroctonus con-
tains two main clades that probably diverged during
the Late Miocene (Fig. 2). The geographical boundaries
of these clades in northern California (Figs 1 and 3) and
the inferred timing of their split implicate the develop-
ment and northward migration of the Mendocino Triple
Junction as a probable driver of this divergence. The
Mendocino Triple Junction was formed in the Early
Miocene around 27 Mya by the collision of three tec-
tonic plates along the Mendocino Fracture Zone (Fur-
long & Schwartz 2004; Lock et al. 2006; Gottscho 2016).
Following this collision, the Mendocino Triple Junction
began migrating northward. At around 8–5 Mya, it
accelerated and caused the uplift of the California
Coastal Range near the Eel River drainage (Lock et al.
2006; Fig. 1). Continued tectonic plate movements dur-
ing this time caused topographic uplift and valley inci-
sions along the Sierra Nevada (Wakabayashi & Sawyer
2001; Cassel et al. 2012), a long-standing topographic
feature since 16 Mya (Chamberlain & Poage 2000). At
around 2 Mya, the Eel River emerged as the primary
river draining the Coast Range (Lock et al. 2006), which
likely reinforced the separation of northern and south-
ern clades of Uroctonus. To the east, the Feather and
Yuba River drainages that deeply incised the Sierra
Nevada following uplift similarly reinforced separation.
Following the divergence of the northern and south-
ern clades, regional geographical groups within each
clade emerged. Within the southern clade, the develop-
ment of the Central Valley following Late Miocene and
Pliocene uplift (Huber 1981; Unruh 1991; Chamberlain
& Poage 2000) undoubtedly isolated Uroctonus on the
Coastal Range from populations along the Sierra
Nevada, as seen in the high percentage of codistributed
taxa across these mountain ranges (Rissler et al. 2006).
Across the Coastal Range, two groups north and south
of the San Francisco Bay separated sometime during the
Pliocene or Early Pleistocene (Fig. 2a). The geographical
group south of the Bay represents the subspecies
U. m. pluridens, a morphologically distinct subspecies
endemic to the Santa Cruz Mountains (Hjelle 1972; Sole-
glad & Fet 2004). The Santa Cruz Mountains formed
during a westward bend of the San Andreas Fault 2.8–5 Mya (Sarna-Wojcicki et al. 1985; Griscom & Jachens
1989; Dupr�e et al. 1991) and were subsequently isolated
when the Central Valley started draining into the San
Francisco Bay (Sarna-Wojcicki et al. 1985; Dupr�e et al.
1991). Around this same time, geographical groups of
Uroctonus in the Sierra Nevada to the east diverged
(Fig. 2a). The early divergence of Uroctonus in the
northwestern Sierra Nevada may have been caused by
restructuring and vertical rising of the San Joaquin
River following Pliocene uplift of the Sierra Nevada
(Wakabayashi & Sawyer 2001). The increased elevation
of the Sierra Nevada likely further isolated this group
from Uroctonus along the eastern slopes. Similarly,
sharp environmental gradients that developed along the
steep eastern slope after uplift may have caused the
subsequent Pliocene and Early Pleistocene separation of
Uroctonus in the southern Sierra Nevada from popula-
tions along the northeastern slopes of the Sierra
Nevada. These sharp gradients are reflected in the pre-
sent-day narrow sliver of predicted suitable habitat
along the eastern slopes of the Sierra Nevada (Fig. 7).
Divergences among the four geographical groups in
the northern clade of Uroctonus appear also to be
linked to regional uplift during Late Miocene and
Pliocene tectonic plate reorganizations. This uplift pro-
duced regional climate change and the development
of abrupt environmental transitions across the Cas-
cades and Oregon Coastal Range (Wolfe 1969; Nielson
et al. 2001). The early divergence of the group of
Uroctonus in the northeastern Cascades from the other
groups primarily west of the Cascades may have been
caused by a strong rain shadow effect created by the
increase in elevation across the Cascades (Graham
1999; Nielson et al. 2006). Current boundaries of the
remaining three geographical groups and the cave-
dwelling U. grahami are clustered around the Klamath
Mountains (Figs 1 and 3), a regional hotspot for verte-
brate endemism and diversity (Bury & Pearl 1999;
Rissler et al. 2006; Olson et al. 2012). Numerous
© 2016 John Wiley & Sons Ltd
3744 R. W. BRYSON ET AL.
phylogeographical lineages of salamanders also meet
near the Klamath Mountains (Rissler et al. 2006;
Kuchta et al. 2009a; Reilly et al. 2013; Reilly & Wake
2015). Although these topographically complex moun-
tains formed well over 10 Mya, renewed Late
Miocene–Pliocene uplifting and restructuring of drai-
nages (Mortimer & Coleman 1985; Aalto 2006) may
have isolated Uroctonus in the Klamath Mountains
from nearby groups to the south and north (Fig. 3).
Emergent fine-scale endemism during the Pleistocene
Pleistocene climate cycles had a strong impact on the
geographical distribution and genetic structure of many
Nor
ther
n Cl
ade
Sout
hern
Cla
de
Current Last Glacial Maximum
1.00
0.75
0.50
0.25
0.00
1.00
0.75
0.50
0.25
0.00
1.00
0.75
0.50
0.25
0.00
1.00
0.75
0.50
0.25
0.00
Fig. 7 Species distribution models for the current and historical (Last Glacial Maximum, ca. 21 kya) predicted distributions of the
northern and southern clades of Uroctonus. Warmer colours indicate higher probability of occurrence as predicted using Maxent. Pre-
dicted distribution at the Last Glacial Maximum based on the CCSM4 general circulation model; see Fig. S3 (Supporting information)
for reconstructions with other models.
© 2016 John Wiley & Sons Ltd
MICROENDEMISM IN FOREST SCORPIONS 3745
taxa in western North America (Knowles 2000; Johnson
& Cicero 2004; Shafer et al. 2010). Increases in the inten-
sity of glacial cycles during the Pleistocene repeatedly
fragmented, expanded and restructured species assem-
blages in the CFP (Raven & Axelrod 1978; Keeley &
Swift 1995; Minnich 2007). Our results reveal that strong
phylogeographical structure emerged within the
broader and more ancient genetic groups of Uroctonus
during the past 2 million years (Fig. 2a). Given the gen-
eral absence of clear geographical barriers between
these populations (Figs 4 and 5), most of this genetic
structure probably arose as a result of the episodic frag-
mentation of large tracts of woodland forest, as has
been suggested for other species (Schoville et al. 2012;
Devitt et al. 2013). Although it is generally accepted that
the climate of California was colder during Pleistocene
glacial periods, there is disagreement on whether or not
it was also wetter (Minnich 2007). Because of their poor
dispersal ability and reliance on a humid microhabitat,
populations of Uroctonus would have become more
fragmented during a colder, drier glacial climate.
Shrinking forested habitats during warmer interglacials
may have generated a patchwork of exposed drier
microhabitats, further limiting dispersal and isolating
populations. This mosaic of fragmented woodlands is
evident across the current interglacial distribution of
Uroctonus, especially in the southern part of their range.
Our SDMs support the hypothesis that in broadscale,
forest scorpion habitat has remained relatively stable
over the last 21 000 years (Fig. 7). This finding is consis-
tent with the genetic data which suggest these scorpi-
ons have remained in their current habitats for millions
of years, with ancient genetic divergences being congru-
ent with the development of ancient geological features.
The single exception is within the northern clade, where
our genetic data support a northern postglacial expan-
sion for one subgroup currently distributed across the
northwestern Cascades and adjacent Coastal Range.
Despite the large distributional range of this group,
genetic diversity is low and sequenced individuals
within this group form a large, relatively shallow clade
of admixed localities (Figs 2a, 3 and 4). Postglacial
expansion may have occurred from a refugial area in
northern California, a pattern both supported by our
SDMs (Fig. 7) and inferred for other regional taxa (e.g.
Steele & Storfer 2006; Reilly et al. 2013). The low topo-
graphical relief and cooler, humid climate throughout
the Willamette Valley of Oregon and adjacent foothills
could have enabled this rapid post-LGM expansion.
Microendemism and taxonomy
The combination of limited dispersal and microhabitat
preference of Uroctonus has created a spatial clumping
of populations across the CFP that is distinctly revealed
in the genetic structure of these scorpions. Based on our
results, Uroctonus exhibit strong hierarchical genetic
structure at sequentially smaller geographical scales.
Each major clade contains numerous geographical
groups, and each geographical group is comprised of
multiple distinct populations. In general, sequenced
individuals from nearly all sampled sites form mono-
phyletic genetic clusters (Figs 4–6). Several of these sites
are separated by <20 km. Migration rates among these
populations are also low, typically <0.4 migrants per
generation (Table S5, Supporting information).
Microendemism across the CFP has been found in a
number of other dispersal-limited species, particularly
salamanders (e.g. Mart�ınez-Solano et al. 2007; Kuchta
et al. 2009a; Reilly & Wake 2015) and arachnids (e.g.
Stockman & Bond 2007; Satler et al. 2011; Hedin et al.
2013; Emata & Hedin 2016). These taxa and Uroctonus
all appear to be moisture-sensitive microhabitat special-
ists. A reliance on a humid substrate combined with
their low dispersal has generated intricate patterns of
genetic fragmentation. The complex genetic architecture
contained within these species can reveal novel insight
into the formation of barriers to dispersal that led to
diversification (e.g. Hedin et al. 2013). Within Uroctonus,
we found evidence for divergences correlated with tec-
tonic plate rafting, mountain uplift, the evolution of
river drainages and habitat fragmentation. Although
these same historical events likely also affected higher-
dispersing codistributed species, the genetic footprint of
vicariance in these species may have eroded through
time during bouts of gene flow (Manthey et al. 2012).
The observed microendemism in Uroctonus presents a
challenge to the taxonomy of the genus. Our results
strongly suggest geography is a better predictor of phy-
logenetic relationships than the morphological charac-
ters mostly related to the metasoma previously used to
delineate species (Gertsch & Soleglad 1972; Hjelle 1972;
Soleglad & Fet 2004). Uroctonus mordax and Uroctonus
franckei are paraphyletic, and the cave-specialist Uroc-
tonus grahami is nested within the northern clade of
U. mordax (Fig. 2). Scorpions are characterized by a
notoriously conserved morphology (Sharma et al. 2015
and references therein), and future integrative research
is needed to develop a taxonomy that better reflects the
evolutionary history of Uroctonus. In practice, however,
delineating species boundaries in highly fragmented,
dispersal-limited taxa is operationally difficult, espe-
cially in the absence of any perceived morphological
differentiation. Studies of mygalomorph spiders (e.g.
Satler et al. 2011; Hedin et al. 2015) highlight the inher-
ent need to incorporate population structure as a
parameter in multispecies coalescent methods for highly
fragmented systems with extremely low gene flow
© 2016 John Wiley & Sons Ltd
3746 R. W. BRYSON ET AL.
among allopatric populations. Such a methodology may
become a powerful tool for species delimitation in Uroc-
tonus and other microendemic species. Iterative sam-
pling across sampling gaps will also be important to
assess potential contact zones and refine gene flow esti-
mates (Hedin et al. 2013).
Our results also highlight the need to cautiously inter-
pret phylogenetic relationships in scorpions recon-
structed from mtDNA. Although mtDNA has been the
workhorse for phylogeographical and phylogenetic anal-
yses of scorpions for over two decades, mtDNA recombi-
nation and selective sweeps caused by maternally
inherited bacterial endosymbionts can result in anoma-
lous mtDNA gene trees for scorpions (Bryson 2014). Phy-
logenetic relationships inUroctonus inferred from the CO1
gene differ from those based on 497 RAD loci and over
900 unlinked SNPs (Fig. 2). This suggests that mtDNA
may be tracking a different and anomalous evolutionary
history inconsistent with population- / species-level
divergences in these scorpions. Future phylogeographic
studies of scorpions should be aware of the varied
stochastic processes affecting the mitochondrial genome
and employ a multilocus approach to estimate phyloge-
nies.
Acknowledgements
For assistance in the field and for providing specimens, we thank
D. Clayton, A. Silva, R. Demmer, B. L. Rust, T. E. Johnson, D.
Young, L. Henderson, M. A. Bryson, S. E. Bryson, M. R. Graham,
R. W. Hansen, M. Olenchalk, J. Shedd, R. Schneider, E. Connors
and S. Walker. For other help with the project, we thank C. J. Bat-
tey, P. Beerli, R. Crawford, M. Harvey, J. Klicka, and the Klicka
and Leach�e Labs at UW. Three anonymous reviewers provided
helpful comments that greatly improved the final manuscript.
This work used the Vincent J. Coates Genomics Sequencing Lab-
oratory at UC Berkeley, supported by NIH S10 Instrumentation
Grants S10RR029668 and S10RR027303.
References
Aalto KR (2006) The Klamath peneplain: a review of J.S. Dil-
ler’s classic erosion surface. Geological Society of America Spe-
cial Papers, 410, 451–463.Arnold B, Corbett-Detig RB, Hartl D, Bomblies K (2013) RAD-
seq underestimates diversity and introduces genealogical
biases due to nonrandom haplotype sampling. Molecular
Ecology, 22, 3179–3190.Bacon AD (1972) Ecological studies on a population of Uroctonus
mordax Thorell. M.A. thesis, San Francisco State University,
California.
Baldwin BG (2014) Origins of plant diversity in the California
Floristic Province. Annual Review of Ecology, Evolution, and
Systematics, 45, 347–369.Beerli P (2006) Comparison of Bayesian and maximum likeli-
hood inference of population genetic parameters. Bioinformat-
ics, 22, 341–345.
Beerli P, Felsenstein J (2001) Maximum likelihood estimation of
a migration matrix and effective population sizes in n sub-
populations by using a coalescent approach. Proceedings of
the National Academy of Sciences of the United States of America,
98, 4563–4568.Blair C, Weigel D, Balazik M et al. (2012) A simulation-based
evaluation of methods for inferring linear barriers to gene
flow. Molecular Ecology Resources, 12, 822–833.Bouckaert RR (2010) DensiTree: making sense of sets of phylo-
genetic trees. Bioinformatics, 26, 1372–1373.Bouckaert R, Heled J, K€uhnert D et al. (2014) BEAST 2: a soft-
ware platform for Bayesian evolutionary analysis. PLOS
Computational Biology, 10, e1003537.
Bryant D, Bouckaert R, Felsenstein J, Rosenberg NA,
RoyChoudhury A (2012) Inferring species trees directly from
biallelic genetic markers: bypassing gene trees in a full coa-
lescent analysis. Molecular Biology & Evolution, 29, 1917–1932.Bryson RW (2014) Bacterial endosymbiont infections in ‘living
fossils’: a case study of North American vaejovid scorpions.
Molecular Ecology Resources, 14, 789–793.Bryson RW, Riddle BR, Graham MR, Smith BT, Prendini L
(2013) As old as the hills: montane scorpions in southwest-
ern North America reveal ancient associations between biotic
diversification and landscape history. PLoS ONE, 8, e52822.
Bury RB, Pearl CA (1999) The Klamath-Siskiyou herpetofauna:
biogeographic patterns and conservation strategies. Natural
Areas Journal, 19, 341–348.Calsbeek R, Thompson JN, Richardson JE (2003) Patterns of
molecular evolution and diversification in a biodiversity hot-
spot: the California Floristic Province. Molecular Ecology, 12,
1021–1029.Cassel EJ, Graham SA, Chamberlain CP, Henry CD (2012)
Early Cenozoic topography, morphology, and tectonics of
the northern Sierra Nevada and western Basin and Range.
Geosphere, 8, 229–249.Chamberlain CP, Poage MA (2000) Reconstructing the paleoto-
pography of mountain belts from the isotopic composition of
authigenic minerals. Geology, 28, 115–118.Conservation International (2011). Biological diversity in the Cali-
fornia Floristic Province. Retrieved from http://
www.eoearth.org/view/article/150634 (Accessed 5 August
2015).
Coulon A, Fitzpatrick JW, Bowman R et al. (2008) Congruent
population structure inferred from dispersal behaviour and
intensive genetic surveys of the threatened Florida scrub-jay
(Aphelocoma coerulescens). Molecular Ecology, 17, 1685–1701.Crawford RL (1990) Discovery of Uroctonus mordax Thorell in
Washington, with notes on habitat and distribution (Scorpi-
onida, Vaejovidae). Pan-Pacific Entomologist, 66, 254–255.Darriba D, Taboada GL, Doallo R, Posada D (2012) jModelTest
2: more models, new heuristics and parallel computing. Nat-
ure Methods, 9, 772.
Devitt T, Cameron Devitt S, Hollingsworth B, McGuire J, Mor-
itz C (2013) Montane refugia predict population genetic
structure in the Large-blotched Ensatina Salamander. Molecu-
lar Ecology, 22, 1650–1665.Drummond AJ, Suchard MA, Xie D, Rambaut A (2012) Baye-
sian phylogenetics with BEAUti and the BEAST 1.7. Molecu-
lar Biology & Evolution, 29, 1969–1973.Dupr�e WR, Morrison RB, Clifton HE et al. (1991) Quaternary
geology of the Pacific margin. In: The Geology of North
© 2016 John Wiley & Sons Ltd
MICROENDEMISM IN FOREST SCORPIONS 3747
America, Vol. K-2, Quaternary Nonglacial Geology: Conterminous
U.S (ed. Morrison RB), pp. 141–214. Geological Society of
America, Boulder, Colorado.
Earl DA, vonHoldt BM (2012) STRUCTURE HARVESTER: a
website and program for visualizing STRUCTURE output
and implementing the Evanno method. Conservation Genetics
Resources, 4, 359–361.Eaton DAR (2014) PyRAD: assembly of de novo RADseq loci
for phylogenetic analyses. Bioinformatics, 30, 1844–1849.Eaton DAR, Ree RH (2013) Inferring phylogeny and introgres-
sion using RADseq data: an example from flowering plants
(Pedicularis: Orobanchaceae). Systematic Biology, 62, 689–706.Edgar RC (2004) MUSCLE: multiple sequence alignment with
high accuracy and high throughput. Nucleic Acids Research,
32, 1792–1797.Edgar RC (2010) Search and clustering orders of magnitude
faster than BLAST. Bioinformatics, 26, 2460–2461.Edwards S, Bensch S (2009) Looking forwards or looking back-
wards in avian phylogeography? A comment on Zink and
Barrowclough 2008. Molecular Ecology, 18, 2930–2933.Emata KN, Hedin M (2016) From the mountains to the coast
and back again: ancient biogeography in a radiation of short-
range endemic harvestmen from California. Molecular Phylo-
genetics and Evolution, 98, 233–243.Evanno G, Regnaut S, Goudet J (2005) Detecting the number of
clusters of individuals using the software STRUCTURE: a
simulation study. Molecular Ecology, 14, 2611–2620.Faircloth BC, Glenn TC (2014) Protocol: Preparation of an AMPure
XP substitute (AKA Serapure). doi: 10.6079/J9MW2F26.
Falush D, Stephens M, Pritchard JK (2003) Inference of popula-
tion structure using multilocus genotype data: linked loci
and correlated allele frequencies. Genetics, 164, 1567–1587.Falush D, Stephens M, Pritchard JK (2007) Inference of popula-
tion structure using multilocus genotype data: dominant
markers and null alleles. Molecular Ecology Notes, 7, 574–578.Frantz AC, Cellina S, Krier A, Schley L, Burke T (2009) Using
spatial Bayesian methods to determine the genetic structure
of a continuously distributed population: clusters or isolation
by distance? Journal of Applied Ecology, 46, 493–505.Funk D, Omland K (2003) Species-level paraphyly and poly-
phyly: frequency, causes, and consequences, with insights
from animal mitochondrial DNA. Annual Review of Ecology
and Evolutionary Systematics, 34, 397–423.Furlong KP, Schwartz SY (2004) Influence of the Mendocino
triple junction on the tectonics of coastal California. Annual
Review of Earth and Planetary Sciences, 32, 403–433.Gantenbein B, Keightley PD (2004) Rates of molecular evolu-
tion in nuclear genes of East Mediterranean scorpions. Evolu-
tion, 58, 2486–2497.Gantenbein B, Fet V, Gantenbein-Ritter IA, Balloux F (2005)
Evidence for recombination in scorpion mitochondrial DNA
(Scorpiones: Buthidae). Proceedings of the Royal Society B, Bio-
logical Sciences, 272, 697–704.Gertsch WJ, Soleglad ME (1972) Studies of North American
scorpions of the genera Uroctonus and Vejovis (Scorpionida,
Vejovidae). Bulletin American Museum of Natural History, 148,
549–608.Gottscho AD (2016) Zoogeography of the San Andreas Fault
system: Great Pacific Fracture Zones correspond with spa-
tially concordant phylogeographic boundaries in western
North America. Biological Reviews, 91, 235–254.
Gowen FC, Maley JM, Cicero C et al. (2014) Speciation in Wes-
tern Scrub-Jays, Haldane’s rule, and genetic clines in sec-
ondary contact. BMC Evolutionary Biology, 14, 135.
Graham A (1999) Late Cretaceous and Cenozoic History of North
American Vegetation. Oxford University Press, New York.
Graham MR, Jaeger JR, Prendini L, Riddle BR (2013a) Phylo-
geography of Beck’s Desert Scorpion, Paruroctonus becki,
reveals Pliocene diversification in the Eastern California
Shear Zone and postglacial expansion in the Great Basin
Desert. Molecular Phylogenetics and Evolution, 69, 502–513.Graham MR, Jaeger JR, Prendini L, Riddle BR (2013b) Phylo-
geography of the Arizona hairy scorpion (Hadrurus arizonen-
sis) supports a model of biotic assembly in the Mojave
Desert and adds a new Pleistocene refugium. Journal of Bio-
geography, 40, 1298–1312.Griscom A, Jachens RC (1989) Tectonic history of the north
portion of the San Andreas fault system, California, inferred
from gravity and magnetic anomalies. Journal of Geophysical
Research, 94, 3089–3099.Guindon S, Gascuel O (2003) A simple, fast and accurate
method to estimate large phylogenies by maximum-likeli-
hood. Systematic Biology, 52, 696–704.Hedin M, Starrett J, Hayashi C (2013) Crossing the uncrossable:
novel trans-valley biogeographic patterns revealed in the
genetic history of low dispersal mygalomorph spiders
(Antrodiaetidae, Antrodiaetus) from California. Molecular Ecol-
ogy, 22, 508–526.Hedin M, Carlson D, Coyle F (2015) Sky island diversification
meets the multispecies coalescent – divergence in the spruce-
fir moss spider (Microhexura montivaga, Araneae, Mygalomor-
phae) on the highest peaks of southern Appalachia. Molecular
Ecology, 24, 3467–3484.Herbert TD, Schuffert JD, Andreasen D et al. (2001) Collapse of
the California current during glacial maxima linked to cli-
mate change on land. Science, 293, 71–76.Hickerson MJ, Carstens BC, Cavender-Bares J et al. (2010) Phy-
logeography’s past, present, and future: 10 years after Avise
2000. Molecular Phylogenetics and Evolution, 54, 291–301.Hijmans RJ, Cameron SE, Parra JL, Jones PG, Jarvis A (2005)
Very high resolution interpolated climate surfaces for global
land areas. International Journal of Climatology, 25, 1965–1978.
Hjelle JT (1972) Scorpions of the Northern Californian coast
ranges. Occasional Papers of the California Academy of Sciences,
92, 1–59.Huang H, Knowles LL (2016) Unforeseen consequences of
excluding missing data from next-generation sequences: sim-
ulation study of RAD sequences. Systematic Biology, 65, 357–365.
Huber NK (1981) Amount and timing of late Cenozoic uplift and
tilt of the central Sierra Nevada, California—evidence from the
upper San Joaquin River basin. U.S. Geological Survey Profes-
sional Paper, 1197, 1–28.Johnson NK, Cicero C (2004) New mitochondrial DNA data
affirm the importance of Pleistocene speciation in North
American birds. Evolution, 58, 1122–1130.Jombart T, Ahmed I (2011) Adegenet 1.3-1: new tools for the
analysis of genome-wide SNP data. Bioinformatics, 27, 3070–3071.
Keeley JE, Swift CC (1995) Biodiversity and ecosystem func-
tioning in Mediterranean climate California. In: Biodiversity
and Function in Mediterranean-Type Ecosystems (eds Davis
© 2016 John Wiley & Sons Ltd
3748 R. W. BRYSON ET AL.

GW, Richardson DM), pp. 121–183. Springer, New York,
New York.
Knowles LL (2000) Tests of Pleistocene speciation in montane
grasshoppers (genus Melanoplus) from the sky islands of
Western North America. Evolution, 54, 1337–1348.Kuchta SR, Parks DS, Wake DB (2009a) Pronounced phylogeo-
graphic structure on a small spatial scale: geomorphological
evolution and lineage history in the salamander ring species
Ensatina eschscholtzii in central coastal California. Molecular
Phylogenetics and Evolution, 50, 240–255.Kuchta SR, Parks DS, Mueller RL, Wake DB (2009b) Closing
the ring: historical biogeography of the salamander ring spe-
cies Ensatina eschscholtzii. Journal of Biogeography, 36, 982–995.Lambert SM, Geneva AJ, Mahler DL, Glor RE (2013) Using
genomic data to revisit an early example of reproductive
character displacement in Haitian Anolis lizards. Molecular
Ecology, 22, 15.
Lapointe FJ, Rissler LJ (2005) Congruence, consensus, and the
comparative phylogeography of codistributed species in Cal-
ifornia. American Naturalist, 166, 290–299.Leach�e AD, Fujita MK, Minin VN, Bouckaert R (2014) Species
delimitation using genome-wide SNP data. Systematic Biol-
ogy, 63, 534542.
Leavitt DH, Bezy RL, Crandal KA, Sites JW Jr (2007) Multi-
locus DNA sequence data reveal a history of deep cryptic
vicariance and habitat-driven convergence in the desert night
lizard Xantusia vigilis species complex (Squamata: Xantusi-
idae). Molecular Ecology, 16, 4455–4481.Levy E, Kennington WJ, Tomkins JL, LeBas NR (2012) Phylo-
geography and population genetic structure of the ornate
dragon lizard, Ctenophorus ornatus. PLoS ONE, 7, e46351.
Lock J, Kelsey H, Furlong K, Woolace A (2006) Late Neogene
and quaternary landscape evolution of the northern California
Coast Ranges: evidence for Mendocino triple junction tecton-
ics. Geological Society of America Bulletin, 118, 1232–1246.Manthey JD, Klicka J, Spellman GM (2012) Is gene flow pro-
moting the reversal of Pleistocene divergence in the Moun-
tain Chickadee (Poecile gambeli)? PLoS ONE, 7, e49218.
Mart�ınez-Solano I, Jockusch EL, Wake DB (2007) Extreme pop-
ulation subdivision throughout a continuous range: phylo-
geography of Batrachoseps attenuatus (Caudata:
Plethodontidae) in western North America. Molecular Ecol-
ogy, 16, 4335–4355.Miller MA, Pfeiffer W, Schwartz T (2010) Creating the CIPRES
Science Gateway for inference of large phylogenetic trees. In:
Proceedings of the Gateway Computing Environments Workshop
(GCE), pp. 1–8. New Orleans, Louisiana.
Minnich RA (2007) California climate, paleoclimate and pale-
ovegetation. In: Terrestrial Vegetation of California (eds Bar-
bour MG, Keeler-Wolf T, Schoenherr AA), pp. 43–70.University of California Press, Berkeley, California.
Mortimer N, Coleman RG (1985) A Neogene structural dome
in the Klamath Mountains, California. Geology, 13, 253–256.Myers N, Mittermeier RA, Mittermeier CG, Da Fonseca GAB,
Kent J (1999) Biodiversity hotspots for conservation priori-
ties. Nature, 403, 853–858.Myers EA, Rodriguez-Robles JA, Denardo DF et al. (2013) Mul-
tilocus phylogeographic assessment of the California Moun-
tain Kingsnake (Lampropeltis zonata) suggests alternative
patterns of diversification for the California Floristic Pro-
vince. Molecular Ecology, 22, 5418–5429.
Nielson M, Lohman K, Sullivan J (2001) Phylogeography of the
tailed frog (Ascaphus truei): implications for the biogeography
of the Pacific Northwest. Evolution, 55, 147–160.Olson D, DellaSala DA, Noss RF et al. (2012) Climate change
refugia for biodiversity in the Klamath-Siskiyou ecoregion.
Natural Areas Journal, 32, 65–74.Papadopoulou A, Knowles LL (2015) Genomic tests of the spe-
cies-pump hypothesis: recent island connectivity cycles drive
divergence in Caribbean crickets across the Virgin Islands.
Evolution, 69, 1501–1517.Parham JF, Papenfuss TJ (2009) High genetic diversity among
fossorial lizard populations (Anniella pulchra) in a rapidly
developing landscape (Central California). Conservation
Genetics, 10, 169–176.Peterson BK, Weber JN, Kay EH, Fisher HS, Hoekstra HE
(2012) Double digest RADseq: an inexpensive method for de
novo SNP discovery and genotyping in model and non-
model species. PLoS ONE, 7, e37135.
Phillips SJ, Anderson RP, Schapire RE (2006) Maximum
entropy modeling of species geographic distributions. Ecolog-
ical Modelling, 190, 231–259.Polihronakis M, Caterino MS (2010) Multilocus phylogeogra-
phy of the flightless darkling beetle Nyctoporis carinata
(Coleoptera: Tenebrionidae) in the California Floristic Pro-
vince: deciphering an evolutionary mosaic. Biological Journal
of the Linnaean Society, 99, 424–444.Polihronakis M, Caterino MS, Chatzimanolis S (2010) Elucidat-
ing the phylogeographic structure among a mosaic of unisex-
ual and bisexual populations of the weevil Geodercodes
latipennis (Coleoptera: Curculionidae) in the Transverse
Ranges of southern California. Biological Journal of the Lin-
naean Society, 101, 935–948.Polis GA (1990) Ecology. In: The Biology of Scorpions (ed. Polis GA),
pp. 247–293. Stanford University Press, Stanford, California.
Prendini L, Wheeler WC (2005) Scorpion higher phylogeny
and classification, taxonomic anarchy, and standards for peer
review in online publishing. Cladistics, 21, 446–494.Pritchard JK, Stephens M, Donnelly P (2000) Inference of population
structure usingmultilocus genotype data.Genetics, 155, 945–959.Pritchard JK, Wen W, Falush D (2010) Documentation for
STRUCTURE software: Version 2.3. Available from http://
pritch.bsd.uchicago.edu.
Putman AI, Carbone I (2014) Challenges in analysis and inter-
pretation of microsatellite data for population genetic stud-
ies. Ecology & Evolution, 4, 4399e4428.
R Development Core Team (2013) R: A Language and Environ-
ment for Statistical Computing. R Foundation for Statistical
Computing, Vienna, Austria.
R Development Core Team (2014) R: A Language and Environ-
ment for Statistical Computing. R Foundation for Statistical
Computing, Vienna, Austria.
Rambaut A, Drummond AJ (2007) Tracer v1.4. Available from
http://beast.bio.ed.ac.uk/Tracer
Ravelo AC, Lyle M, Koizumi I et al. (1997) Pliocene carbonate
accumulation along the California margin. Paleoceanography,
12, 729–741.Raven PH, AxelrodDI (1978) Origin and relationships of the Califor-
nia flora.University of California Publications in Botany, 72, 1–134.Reilly SB, Wake DB (2015) Cryptic diversity and biogeographic
patterns within the black salamander (Aneides flavipunctatus)
complex. Journal of Biogeography, 42, 280–291.
© 2016 John Wiley & Sons Ltd
MICROENDEMISM IN FOREST SCORPIONS 3749
Reilly SB, Mulks MF, Reilly JM, Jennings WB, Wake DB (2013)
Genetic diversity of Black Salamanders (Aneides flavipuncta-
tus) across watersheds in the Klamath Mountains. Diversity,
5, 657–679.Rissler LJ, Hijmans RJ, Graham CH, Moritz C, Wake DB (2006)
Phylogeographic lineages and species comparisons in conser-
vation analyses: a case study of California herpetofauna. The
American Naturalist, 167, 655–666.Rodr�ıguez-Robles JA, Denardo DF, Staub RE (1999) Phylogeog-
raphy of the California mountain king snake, Lampropeltis
zonata (Colubridae). Molecular Ecology, 8, 1923–1934.Rohland N, Reich D (2012) Cost-effective, high-throughput
DNA sequencing libraries for multiplexed target capture.
Genome Research, 22, 939–946.Rubin BER, Ree RH, Moreau CS (2012) Inferring phylogenies
from RAD sequence data. PLoS ONE, 7, e33394.
Safner T, Miller MP, McRae BH, Fortin MJ, Manel S (2011)
Comparison of Bayesian clustering and edge detection meth-
ods for inferring boundaries in landscape genetics. Interna-
tional Journal Molecular Science, 12, 865–889.Sarna-Wojcicki AM, Meyer CE, Bowman HR et al. (1985) Corre-
lation of the Rockland ash bed, a 400,000-year-old strati-
graphic marker in northern California and western Nevada
and implications for middle Pleistocene paleogeography of
central California. Quaternary Research, 23, 236–257.Satler J, Starrett J, Hayashi C, Hedin M (2011) Inferring species trees
from gene trees in a radiation of California trapdoor spiders (Ara-
neae, Antrodiaetidae,Aliatypus).PLoSONE, 6, e25355.
Satler JD, Carstens BC, Hedin M (2013) Multilocus species
delimitation in a complex of morphologically conserved trap-
door spiders (Mygalomorphae, Antrodiaetidae, Aliatypus).
Systematic Biology, 62, 805–823.Schoville SD, Roderick GK, Kavanaugh DH (2012) Testing the
‘Pleistocene species pump’ in alpine habitats: lineage diversi-
fication of flightless ground beetles (Coleoptera: Carabidae:
Nebria) in relation to altitudinal zonation. Biological Journal of
the Linnean Society, 107, 95–111.Shafer ABA, Cullingham CI, Cot�e SD, Coltman DW (2010) Of
glaciers and refugia: a decade of study sheds new light on
the phylogeography of northwestern North America. Molecu-
lar Ecology, 19, 4589–4621.Shaffer HB, Fellers GM, Voss SR, Oliver JC, Pauly GB (2004)
Species boundaries, phylogeography and conservation genet-
ics of the red-legged frog (Rana aurora/draytonii) complex.
Molecular Ecology, 13, 2667–2677.Sharma PP, Fern�andez R, Esposito L, Gonz�alez-Santill�an E,
Monod L (2015) Phylogenomic resolution of scorpions
reveals multilevel discordance with morphological phyloge-
netic signal. Proceedings of the Royal Society of London B, Bio-
logical Sciences, 282, 2014–2953.Sissom WD (2000) Family Vaejovidae. In: Catalog of the Scorpi-
ons of the World (1758-1997) (eds Fet V, Sissom WD, Lowe G,
Braunwalder M), pp. 503–553. New York Entomological Soci-
ety, New York.
Sissom WD, Reddell JR (2009) Cave scorpions of Mexico and
the United States [Escorpiones de cuevas de M�exico y Esta-
dos Unidos]. Texas Memorial Museum, Speleological Monograph,
7, 19–32.Soleglad ME, Fet V (2003) High-level systematics and phy-
logeny of the extant scorpions (Scorpiones: Orthosterni). Eus-
corpius, 11, 1–175.
Soleglad ME, Fet V (2004) The systematics of the scorpion sub-
family Uroctoninae (Scorpiones: Chactidae). Revista Ib�erica de
Aracnolog�ıa, 10, 81–128.Song S, Liu L, Edwards SV, Wu S (2012) Resolving conflict in
eutherian mammal phylogeny using phylogenomics and the
multispecies coalescent model. Proceedings of the National Acad-
emy of Sciences of the United States of America, 109, 14942–14947.Stahnke HL (1974) Revision and keys to the higher categories
of Vejovidae. Journal of Arachnology, 1, 107–141.Starrett J, Hedin M (2007) Multilocus geneologies reveal multi-
ple cryptic species and biogeographical complexity in the
California turret spider Antrodiaetus riversi (Mygalomorphae,
Antrodiaetidae). Molecular Ecology, 16, 583–604.Steele CA, Storfer A (2006) Coalescent-based hypothesis testing
supports multiple Pleistocene refugia in the Pacific North-
west for the Pacific giant salamander (Dicamptodon tenebro-
sus). Molecular Ecology, 15, 2477–2487.Stockman AK, Bond JE (2007) Delimiting cohesion species:
extreme population structure and the role of ecological inter-
changeability. Molecular Ecology, 16, 3374–3392.Stockwell SA (1989) Revision of the phylogeny and higher classifi-
cation of Scorpions (Chelicerata). Ph.D. dissertation, University
of California, Berkeley.
Streicher JW, Devitt TJ, Goldberg CS, Malone JH, Blackmon H,
Fujita MK (2014) Diversification and asymmetrical gene flow
across time and space: lineage sorting and hybridization in
polytypic barking frogs. Molecular Ecology, 2, 3273–3291.Streicher JW, Schulte JA II, Wiens JJ (2016) How should genes
and taxa be sampled for phylogenomic analyses with miss-
ing data? An empirical study in iguanian lizards. Systematic
Biology, 65, 128–145.UNEP-WCMC (United Nations Environment Programme-
World Conservation Monitoring Centre) (2013) Centres of
plant diversity. In: Version 1.0 (Digital Reproduction of Centres
of Plant Diversity. 1994–1997) (eds Davis SD, Heywood VH,
Hamilton AC), World Wildlife Fund and IUCN, Gland,
Switzerland.
Unruh J (1991) The uplift of the Sierra Nevada and implica-
tions for late Cenozoic epeirogeny in the western Cordillera.
Geological Society of America Bulletin, 103, 1395–1404.Varela S, Lima-Ribeiro MS, Terribile LC (2015) A short guide
to the climatic variables of the Last Glacial Maximum for
biogeographers. PLoS ONE, 10, e0129037.
Wagner CE, Keller I, Wittwer S et al. (2013) Genome-wide
RAD sequence data provide unprecedented resolution of
species boundaries and relationships in the Lake Victoria
cichlid adaptive radiation. Molecular Ecology, 22, 787–798.Wakabayashi J, Sawyer TL (2001) Stream incision, tectonics,
uplift, and evolution of topography of the Sierra Nevada,
California. Journal of Geology, 109, 539–562.Waples RS, Gaggiotti O (2006) What is a population? An
empirical evaluation of some genetic methods for identifying
the number of gene pools and their degree of connectivity.
Molecular Ecology, 15, 1419–1439.Warren DL, Seifert SN (2011) Ecological niche modeling in
Maxent: the importance of model complexity and the perfor-
mance of model selection criteria. Ecological Applications, 21,
335–342.Williams SC (1986) A new species of Uroctonus from the Sierra
Nevada of California (Scorpiones: Vaejovidae). Pan-Pacific
Entomologist, 62, 359–362.
© 2016 John Wiley & Sons Ltd
3750 R. W. BRYSON ET AL.
Williams SC, Savary WE (1991) Uroctonites, a new genus of
scorpion from Western North America (Scorpiones: Vaejovi-
dae). Pan-Pacific Entomologist, 67, 272–287.Wolfe JA (1969) Neogene floristic and vegetational history of
the Pacific Northwest. Madro~no, 20, 83–110.Xi Z, Liu L, Rest JS, Davis CC (2014) Coalescent versus con-
catenation methods and the placement of Amborella as sister
to water lilies. Systematic Biology, 63, 919–932.Yamashita T, Rhoads DD (2013) Species delimitation and mor-
phological divergence in the scorpion Centruroides vittatus
(Say, 1821): insights from phylogeography. PLoS ONE, 8,
e68282.
R.W.B., W.E.S. and J.E.M. designed the research; R.W.B.
and R.B.B. acquired the samples; R.W.B. generated the
genetic data; R.W.B. and A.J.Z. analysed the data;
R.W.B. led the writing. All authors contributed to the
text and approved the final manuscript.
Data accessibility
DNA sequences: Aligned data sets deposited in Dryad
(doi:10.5061/dryad.58sn8) and CO1 sequences depos-
ited in GenBank (Accession nos. KX171074–KX171153).Sampling locations and additional individuals included
in SDMs are uploaded as online Supporting
Information.
Supporting information
Additional supporting information may be found in the online ver-
sion of this article.
Fig. S1 Plot showing missing data across the complete data
matrix of 192 samples of Uroctonus.
Fig. S2 Larger versions of Bayesian phylogenetic trees shown
in Fig. 2.
Fig. S3 Historical reconstructed distributions with alternative
GCMs for the Last Glacial Maximum.
Table S1 Collection locality data for genetic samples of Uroc-
tonus used in this study and deposited in the California Acad-
emy of Sciences Entomological Collection.
Table S2 GPS points used for building species distribution
models for each clade of Uroctonus.
Table S3 Summary of climatic and landscape variables utilized
in the construction of species distribution models.
Table S4 Summary of ddRADseq data in the final assembly of
191 samples of Uroctonus.
Table S5 Estimated effective number of migrants per genera-
tion (Nm) between populations within each of the major geo-
graphical groups of Uroctonus (see Fig. 2).
Table S6 Percent contribution and permutation importance for
each variable used to construct the species distribution models
for the northern and southern clades of Uroctonus.
© 2016 John Wiley & Sons Ltd
MICROENDEMISM IN FOREST SCORPIONS 3751