genome-wide analysis of aberrant methylation in human breast
TRANSCRIPT

RESEARCH ARTICLE Open Access
Genome-wide analysis of aberrant methylation inhuman breast cancer cells using methyl-DNAimmunoprecipitation combined withhigh-throughput sequencingYoshinao Ruike1, Yukako Imanaka1, Fumiaki Sato2, Kazuharu Shimizu2, Gozoh Tsujimoto1*
Abstract
Background: Cancer cells undergo massive alterations to their DNA methylation patterns that result in aberrantgene expression and malignant phenotypes. However, the mechanisms that underlie methylome changes are notwell understood nor is the genomic distribution of DNA methylation changes well characterized.
Results: Here, we performed methylated DNA immunoprecipitation combined with high-throughput sequencing(MeDIP-seq) to obtain whole-genome DNA methylation profiles for eight human breast cancer cell (BCC) lines andfor normal human mammary epithelial cells (HMEC). The MeDIP-seq analysis generated non-biased DNAmethylation maps by covering almost the entire genome with sufficient depth and resolution. The mostprominent feature of the BCC lines compared to HMEC was a massively reduced methylation level particularly inCpG-poor regions. While hypomethylation did not appear to be associated with particular genomic features,hypermethylation preferentially occurred at CpG-rich gene-related regions independently of the distance fromtranscription start sites. We also investigated methylome alterations during epithelial-to-mesenchymal transition(EMT) in MCF7 cells. EMT induction was associated with specific alterations to the methylation patterns of gene-related CpG-rich regions, although overall methylation levels were not significantly altered. Moreover,approximately 40% of the epithelial cell-specific methylation patterns in gene-related regions were altered to thosetypical of mesenchymal cells, suggesting a cell-type specific regulation of DNA methylation.
Conclusions: This study provides the most comprehensive analysis to date of the methylome of human mammarycell lines and has produced novel insights into the mechanisms of methylome alteration during tumorigenesis andthe interdependence between DNA methylome alterations and morphological changes.
BackgroundDNA methylation is an indispensable epigenetic modifi-cation of mammalian genomes. In mammals, it occurspredominantly at CpG dinucleotides which are sparselydistributed through the genome except at short genomicregions called CpG islands (CGIs) [1]. The state of CpGmethylation regulates and stabilizes chromatin structure,and possibly regulates accessibility of these DNA regionsto the transcription machinery [2]. DNA methylation isessential to diverse processes such as development,
X-inactivation, and imprinting [3-5]. Alterations to thenormal patterns of DNA methylation are linked tomany human diseases, such as cancer [6]. Many studieshave explored the aberrant patterns of DNA methylationin cancers, as they might possibly be of value as cancercell markers, markers of tumor prognosis, predictors ofresponse to chemotherapy, and therapeutic targets[7-10]. Human tumors have been shown to undergo amassive loss of DNA methylation, but also to becomehypermethylated at certain gene promoters [11]. How-ever, the entire genomic distribution of aberrant methy-lations and the molecular mechanisms underlyingthe methylome alterations in cancers remain unclear,mainly due to the limitations of existing techniques for
* Correspondence: [email protected] of Genomic Drug Discovery Science, Graduate School ofPharmaceutical Sciences, Kyoto University, 46-20 Yoshida Shimoadachi-choSakyo-ku, Kyoto 606-8501, Japan
Ruike et al. BMC Genomics 2010, 11:137http://www.biomedcentral.com/1471-2164/11/137
© 2010 Ruike et al; licensee BioMed Central Ltd. This is an Open Access article distributed under the terms of the Creative CommonsAttribution License (http://creativecommons.org/licenses/by/2.0), which permits unrestricted use, distribution, and reproduction inany medium, provided the original work is properly cited.
analyzing DNA methylation at specific sequences [12].For example, the conventional strategies using methyla-tion-sensitive restriction enzymes require high-molecu-lar-weight DNA and are limited by the sequencecontext of the chosen enzyme.Recently an important technical advance for analyzing
DNA methylation was made by using immunoprecipita-tion with an antibody against 5-methylcytosine to enrichmethylated DNA fragments [8]. This methyl-DNAimmunoprecipitation (MeDIP)-based approach enablesthe rapid identification of multiple CpG sites universally,and it can be combined with gene-by-gene PCR detec-tion and with several promoter, CGI and tiling microar-rays [13-16]. However, predefined CGIs cover only 7.4%of all CpGs in the human genome and the entire humangenome is not yet represented in any microarray. Analy-sis of DNA methylation has also been advanced recentlyby the application of high-throughput DNA sequencingtechnology that allows robust, quantitative, and cost-effective functional genomic strategies. MeDIP in con-junction with high-throughput sequence (MeDIP-seq)provides a genome-wide mapping technique that hassuccessfully been used to profile the global DNA methy-lation patterns of mature human spermatozoa genome[17]. Bisulphite sequencing has also been combined withhigh-throughput sequence (BS-seq) to describe the 120Mb Arabidopsis DNA methylome [18,19]. In addition,BS-seq was recently applied to the human DNA methy-lome [20]. Unfortunately, it still remains too hard workto apply BS-seq on a multiple comparative analysis ofmethylomes in mammalian genomes.In this study, we used MeDIP-seq to investigate the
whole-genome distribution of aberrant DNA methyla-tion in eight breast cancer cells (BCC) lines and com-pared these with the methylation patterns of normalhuman mammary epithelial cells (HMEC). Furthermore,to investigate the mechanisms of methylome alterationand determine the effects of such changes on the mor-phology of BCC lines, we identified alterations to themethylation profile that occurred during the epithelial-to-mesenchymal transition (EMT) in MCF7 cells treatedwith TGFb and TNFa. Using this experimentalapproach, we obtained novel insights in to the molecularand genetic mechanisms of methylome alterations inBCC lines and their functional association with cancerphenotype.
ResultsHigh-throughput sequencing analysis of MeDIP DNAWe profiled the genome-wide DNA methylation statusof normal and cancerous mammary cells by first gener-ating MeDIP-enriched DNA libraries. Real-time quanti-tative PCR was used for several genomic regions thatincluded known methylated or unmethylated promoters
to confirm that MeDIP specifically enriched methylatedDNA and efficiently removed unmethylated DNA (Addi-tional file 1a). Immunoprecipitated fractions were sub-jected to high-throughput sequencing using an IlluminaGenome Analyzer to obtain comprehensive methylationmaps. The influence of genomic amplifications and dele-tions in the BCC lines was investigated by high-through-put sequencing of input DNA fragments from eachsamples, with the exception of MDAMB453 andMRKnu1 which yielded an insufficient number of reads.We obtained 97 million uniquely mapped singletonreads and 11 million paired-end reads for the MeDIPsamples and 26 million singleton reads for the inputsamples with high quality read placements against thehuman genome (Maq quality > 10). The mapping ofinput reads allowed the efficient detection of genomicamplifications, including known regions of amplification(for example, 17q23 and 20q13 in MCF7) [21,22]. Weexcluded these regions from the following analyses asthey might result in failure to identify regions withhypermethylation. Overall, 87% of genomic CpGs allover the genome were covered by any sample with 12times depth, the average of each sample’s maximumdepth (Additional file 1b). Thus, our data sets success-fully provided non-biased genome-wide information. Weobserved that some pairs in the paired-end reads hadidentical outer coordinates. As this should happenrarely, we assumed this to be due to PCR biases intro-duced by the whole-genome amplification after immu-noprecipitation. We therefore removed any duplicatesfrom each data set to improve the overall reproducibilityin the following analyses.To confirm the reproducibility of the analyses, we
performed two replicates of the MeDIP-seq experi-ments with HMEC. The numbers of reads overlappingeach CGI and 100 kb genomic segment were highlycorrelated between the replicates (r = 0.92 and 0.99,respectively) (Additional file 1c). To assess whether theMeDIP-seq analyses correctly identified methylatedregions, we compared MCF7 MeDIP-seq results withpreviously reported MCF7 promoter methylome datagenerated by the MeDIP-chip technique (deposited inthe public Gene Expression Omnibus database:GSM263125 [13]). For each probe region, we countedthe number of MeDIP-enriched reads and subtractedthe number of input reads. Overall, regions detectedby MeDIP-seq were found to have higher methylationlevels in MeDIP-chip results., indicating accuratedetection of methylated regions by MeDIP-seq (Addi-tional file 1d). We also observed considerable hypo-methylation at some repeat sequences, such as humansatellite II (HSATII, Additional file 1e), known to beprimary targets of hypomethylation in many cancers[23].
Ruike et al. BMC Genomics 2010, 11:137http://www.biomedcentral.com/1471-2164/11/137
Page 2 of 11
A number of studies have reported that CGIs arehypermethylated in many cancers [2,12,24]; we thereforeinvestigated the differential methylation status of CGIs.Compared to HMEC, we found a more than four-foldincrease in methylation levels in CGIs in many BCClines (Additional file 2a). The known hypermethylationstatus of many CGIs, for example WT1 [25] andHOXA5 [26], was confirmed by the MeDIP-seq datasets (Additional file 2b). We also identified other CGIshighly methylated in BCC lines and confirmed theirmethylation levels using bisulfite sequencing (Additionalfile 2c, d). Additionally, we perfomed bisulfite sequen-cing on randomly chosen regionsto confirm ourMeDIP-seq results (data not shown). We observed astrong correlation between the MeDIP-seq data andbisulfite sequencing data, confirming the reliablity of theMeDIP-seq data (Additional file 2e).
Genomic distribution of aberrant DNA methylation inBCC linesWe thought it would be useful to obtain overviewmethylation maps, albeit at reduced resolution, tounderstand the pattern of methylation at the genome-wide level. We divided the entire genome into 100 kbsegments and counted the number of reads mappedwithin each segment. To compare methylation levelswithin each sample, the number of reads were normal-ized against the total number of reads; and the inferrednumber of reads per 10 million total reads was calcu-lated for each sample. The normalized number of readsin 100 kb regions was clearly correlated to the numberof CpGs in the HMEC MeDIP sample (Additional file3a), whereas the input sample showed nearly constantvalues irrespective of the number of CpGs. Compared toHMEC, BCC lines showed a lower correlation betweenthe number of reads and CpGs, suggesting broadlyaltered methylation levels in BCC lines.The number of MeDIP-reads were divided by the
input and used for pairwise comparisons among thesamples, in order to classify each segment as hyper-,hypo-, and not-differentially methylated groups. Wedefined hypermethylation and hypomethylation in BCClines as a two-fold increase and decrease, respectively,in the normalized tag frequency compared to HMEC.In all BCC lines, hypomethylation occurred 3 to 5times more frequently than hypermethylation (Figure1a). Hierarchical clustering showed distinct methyla-tion patterns of HMEC, compared to BCC lines (Addi-tional file 3b and 3c). Compared to HMEC, 8.2% ofthe segments in BCC lines showed on average a two-fold decrease in methylation levels (Figure 1b). Next,we investigated the distribution of hypomethylated andhypermethylated positions across the entire genome.Hypomethylated regions in BCC lines were distributed
throughout entire genome, while hypermethylatedregions were clustered at specific loci (1.3% of all seg-ments), including 16p13.3, 19p13.3, and 9q34.3 (Figure1c). The number of CpGs within the hypermethylatedand hypomethylated segments was highly biasedtoward a lower or higher frequency of CpGs, respec-tively (Figure 1d). Hypermethylation was also positivelycorrelated with the number of genes within the seg-ment region (Figure 1e). All BCC lines showed signifi-cantly higher methylation levels in gene-rich regions.In contrast, HMEC showed a lower associationbetween methylation levels and gene frequency (Addi-tional file 3d), suggesting that aberrant methylationpreferentially targets genes. We also performed theseanalyses using smaller window sizes (~10 kb) andobtained consistent results (data not shown).
Target position of aberrant methylation in BCC linesWe sought to determine whether the positions of aber-rantly methylated CpGs were related to genomic fea-tures. We defined promoter regions as the 10 kbupstream region of all transcription start sites depositedin the RefSeq database. Exons and introns were alsodefined by this database. The repetitive sequences wereexcluded. As ratios could not be determined whenmethylated DNA fragments were not detected byMeDIP-seq in one sample, we evaluated methylationstatus by a qualitative criterion in this analysis; wedefined hypermethylation as the region covered by allBCCs but not by HMEC, and hypomethylation as theregion covered by HMEC but not by any BCCs. Wefound that the majority of hypermethylated CpGs wererelated to gene promoters, exons and introns (Figure2a). By contrast, hypomethylated CpGs did not showsignificant enrichment of any defined genomic feature.Hypermethylated CpGs were also found within thehypomethylated 100 kb segments described above andwere preferentially found at gene-related features (Addi-tional file 3e). We then investigated the distancebetween aberrantly methylated gene-related positionsand transcription start sites (TSS). The CpGs aroundTSS were classified into promoters, exons and introns,and then we calculated their distances to TSS. Hyper-and hypomethylated CpGs tended to be concentrated inregions proximal to TSS, suggesting that these regionsare important for the regulation of gene expression (Fig-ure 2b). Since the density of CpGs was highest atregions proximal to TSS, the relative frequencies ofhyper- and hypomethylations at distal regions werehigher than proximal regions, when considering theratio with the CpG content. We also analyzed the distri-bution of the distance from transcription start sites tohyper- and hypomethylated CpGs in CpG islands (Addi-tional file 4a) and found that relative frequencies of
Ruike et al. BMC Genomics 2010, 11:137http://www.biomedcentral.com/1471-2164/11/137
Page 3 of 11
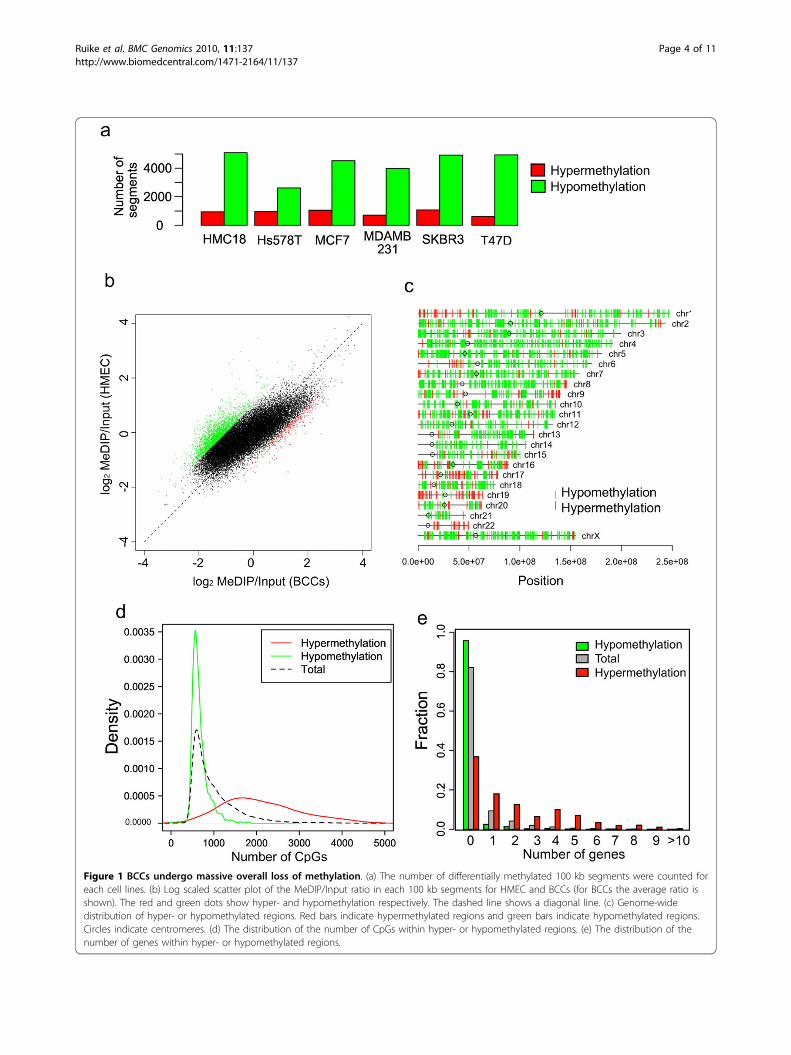
Figure 1 BCCs undergo massive overall loss of methylation. (a) The number of differentially methylated 100 kb segments were counted foreach cell lines. (b) Log scaled scatter plot of the MeDIP/Input ratio in each 100 kb segments for HMEC and BCCs (for BCCs the average ratio isshown). The red and green dots show hyper- and hypomethylation respectively. The dashed line shows a diagonal line. (c) Genome-widedistribution of hyper- or hypomethylated regions. Red bars indicate hypermethylated regions and green bars indicate hypomethylated regions.Circles indicate centromeres. (d) The distribution of the number of CpGs within hyper- or hypomethylated regions. (e) The distribution of thenumber of genes within hyper- or hypomethylated regions.
Ruike et al. BMC Genomics 2010, 11:137http://www.biomedcentral.com/1471-2164/11/137
Page 4 of 11
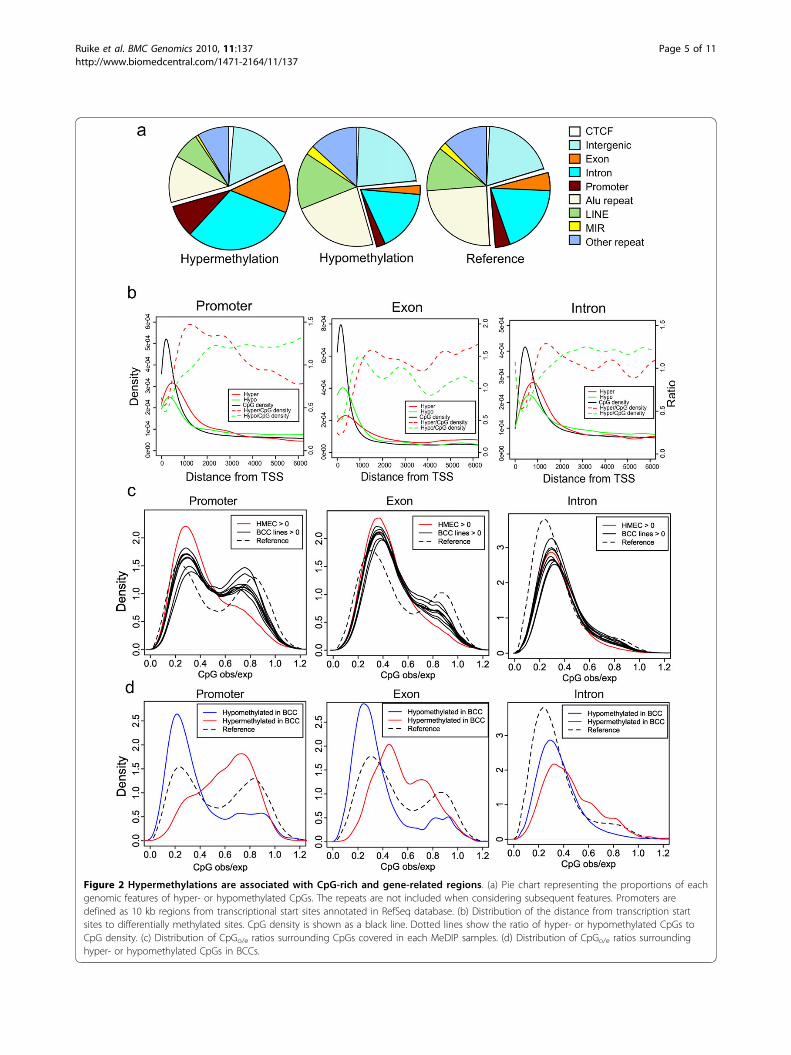
Figure 2 Hypermethylations are associated with CpG-rich and gene-related regions. (a) Pie chart representing the proportions of eachgenomic features of hyper- or hypomethylated CpGs. The repeats are not included when considering subsequent features. Promoters aredefined as 10 kb regions from transcriptional start sites annotated in RefSeq database. (b) Distribution of the distance from transcription startsites to differentially methylated sites. CpG density is shown as a black line. Dotted lines show the ratio of hyper- or hypomethylated CpGs toCpG density. (c) Distribution of CpGo/e ratios surrounding CpGs covered in each MeDIP samples. (d) Distribution of CpGo/e ratios surroundinghyper- or hypomethylated CpGs in BCCs.
Ruike et al. BMC Genomics 2010, 11:137http://www.biomedcentral.com/1471-2164/11/137
Page 5 of 11
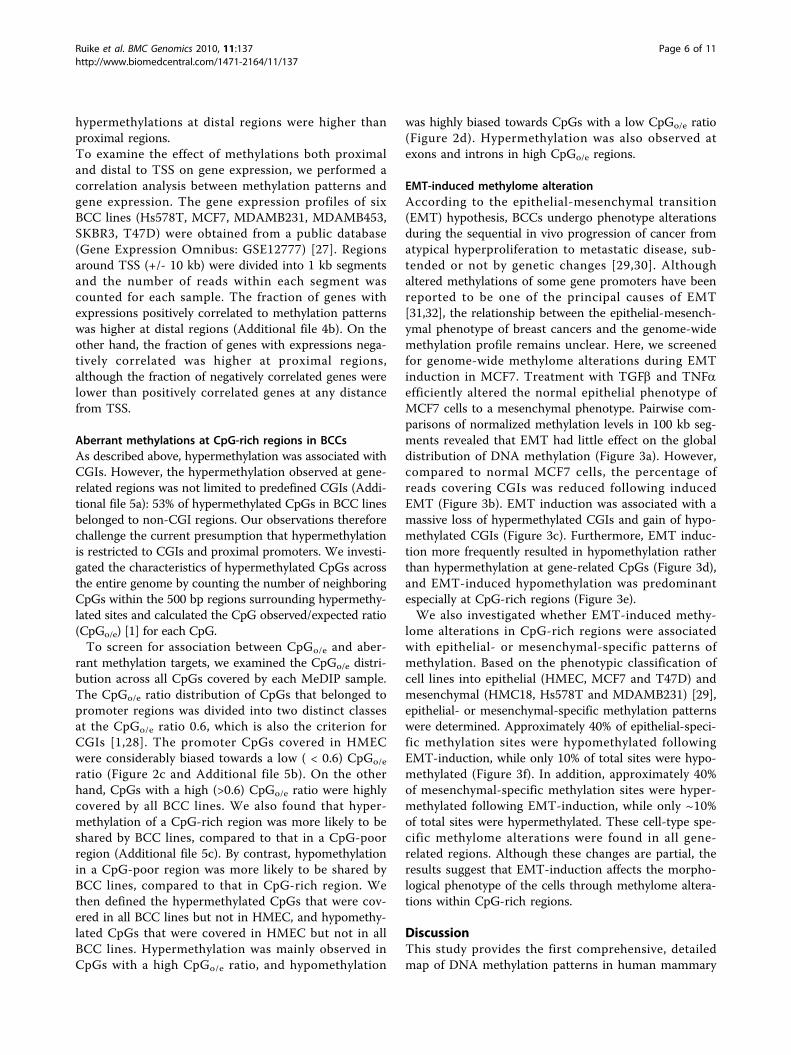
hypermethylations at distal regions were higher thanproximal regions.To examine the effect of methylations both proximaland distal to TSS on gene expression, we performed acorrelation analysis between methylation patterns andgene expression. The gene expression profiles of sixBCC lines (Hs578T, MCF7, MDAMB231, MDAMB453,SKBR3, T47D) were obtained from a public database(Gene Expression Omnibus: GSE12777) [27]. Regionsaround TSS (+/- 10 kb) were divided into 1 kb segmentsand the number of reads within each segment wascounted for each sample. The fraction of genes withexpressions positively correlated to methylation patternswas higher at distal regions (Additional file 4b). On theother hand, the fraction of genes with expressions nega-tively correlated was higher at proximal regions,although the fraction of negatively correlated genes werelower than positively correlated genes at any distancefrom TSS.
Aberrant methylations at CpG-rich regions in BCCsAs described above, hypermethylation was associated withCGIs. However, the hypermethylation observed at gene-related regions was not limited to predefined CGIs (Addi-tional file 5a): 53% of hypermethylated CpGs in BCC linesbelonged to non-CGI regions. Our observations thereforechallenge the current presumption that hypermethylationis restricted to CGIs and proximal promoters. We investi-gated the characteristics of hypermethylated CpGs acrossthe entire genome by counting the number of neighboringCpGs within the 500 bp regions surrounding hypermethy-lated sites and calculated the CpG observed/expected ratio(CpGo/e) [1] for each CpG.To screen for association between CpGo/e and aber-
rant methylation targets, we examined the CpGo/e distri-bution across all CpGs covered by each MeDIP sample.The CpGo/e ratio distribution of CpGs that belonged topromoter regions was divided into two distinct classesat the CpGo/e ratio 0.6, which is also the criterion forCGIs [1,28]. The promoter CpGs covered in HMECwere considerably biased towards a low ( < 0.6) CpGo/e
ratio (Figure 2c and Additional file 5b). On the otherhand, CpGs with a high (>0.6) CpGo/e ratio were highlycovered by all BCC lines. We also found that hyper-methylation of a CpG-rich region was more likely to beshared by BCC lines, compared to that in a CpG-poorregion (Additional file 5c). By contrast, hypomethylationin a CpG-poor region was more likely to be shared byBCC lines, compared to that in CpG-rich region. Wethen defined the hypermethylated CpGs that were cov-ered in all BCC lines but not in HMEC, and hypomethy-lated CpGs that were covered in HMEC but not in allBCC lines. Hypermethylation was mainly observed inCpGs with a high CpGo/e ratio, and hypomethylation
was highly biased towards CpGs with a low CpGo/e ratio(Figure 2d). Hypermethylation was also observed atexons and introns in high CpGo/e regions.
EMT-induced methylome alterationAccording to the epithelial-mesenchymal transition(EMT) hypothesis, BCCs undergo phenotype alterationsduring the sequential in vivo progression of cancer fromatypical hyperproliferation to metastatic disease, sub-tended or not by genetic changes [29,30]. Althoughaltered methylations of some gene promoters have beenreported to be one of the principal causes of EMT[31,32], the relationship between the epithelial-mesench-ymal phenotype of breast cancers and the genome-widemethylation profile remains unclear. Here, we screenedfor genome-wide methylome alterations during EMTinduction in MCF7. Treatment with TGFb and TNFaefficiently altered the normal epithelial phenotype ofMCF7 cells to a mesenchymal phenotype. Pairwise com-parisons of normalized methylation levels in 100 kb seg-ments revealed that EMT had little effect on the globaldistribution of DNA methylation (Figure 3a). However,compared to normal MCF7 cells, the percentage ofreads covering CGIs was reduced following inducedEMT (Figure 3b). EMT induction was associated with amassive loss of hypermethylated CGIs and gain of hypo-methylated CGIs (Figure 3c). Furthermore, EMT induc-tion more frequently resulted in hypomethylation ratherthan hypermethylation at gene-related CpGs (Figure 3d),and EMT-induced hypomethylation was predominantespecially at CpG-rich regions (Figure 3e).We also investigated whether EMT-induced methy-
lome alterations in CpG-rich regions were associatedwith epithelial- or mesenchymal-specific patterns ofmethylation. Based on the phenotypic classification ofcell lines into epithelial (HMEC, MCF7 and T47D) andmesenchymal (HMC18, Hs578T and MDAMB231) [29],epithelial- or mesenchymal-specific methylation patternswere determined. Approximately 40% of epithelial-speci-fic methylation sites were hypomethylated followingEMT-induction, while only 10% of total sites were hypo-methylated (Figure 3f). In addition, approximately 40%of mesenchymal-specific methylation sites were hyper-methylated following EMT-induction, while only ~10%of total sites were hypermethylated. These cell-type spe-cific methylome alterations were found in all gene-related regions. Although these changes are partial, theresults suggest that EMT-induction affects the morpho-logical phenotype of the cells through methylome altera-tions within CpG-rich regions.
DiscussionThis study provides the first comprehensive, detailedmap of DNA methylation patterns in human mammary
Ruike et al. BMC Genomics 2010, 11:137http://www.biomedcentral.com/1471-2164/11/137
Page 6 of 11
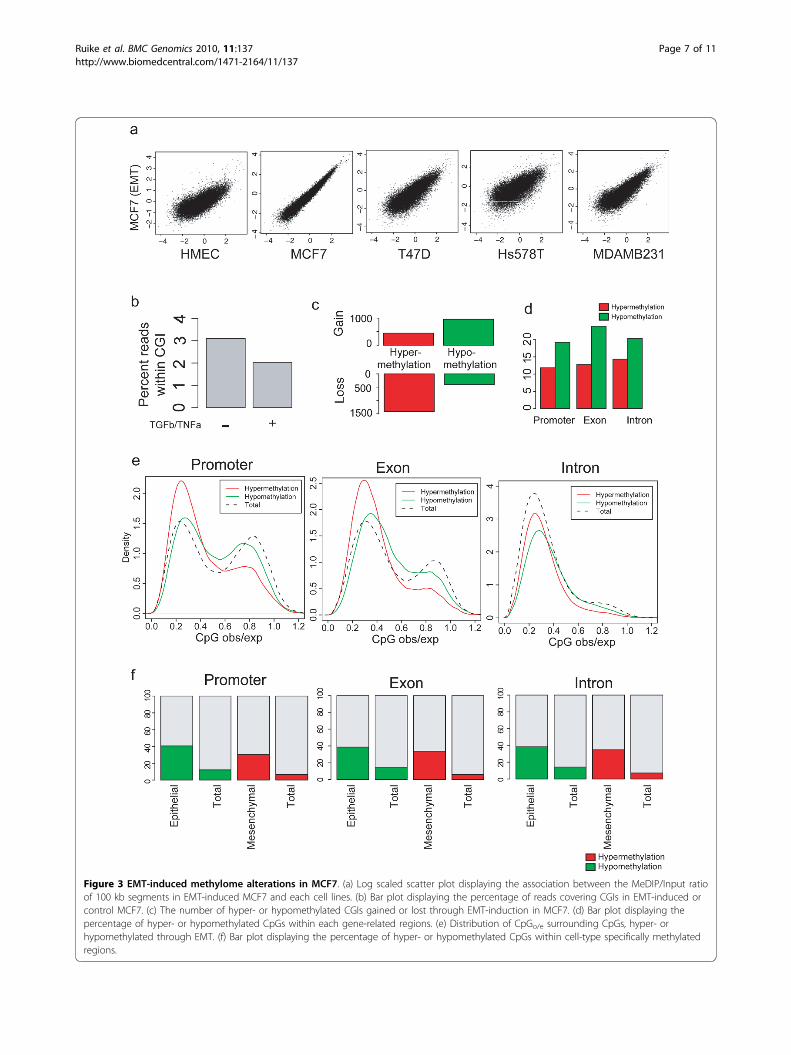
Figure 3 EMT-induced methylome alterations in MCF7. (a) Log scaled scatter plot displaying the association between the MeDIP/Input ratioof 100 kb segments in EMT-induced MCF7 and each cell lines. (b) Bar plot displaying the percentage of reads covering CGIs in EMT-induced orcontrol MCF7. (c) The number of hyper- or hypomethylated CGIs gained or lost through EMT-induction in MCF7. (d) Bar plot displaying thepercentage of hyper- or hypomethylated CpGs within each gene-related regions. (e) Distribution of CpGo/e surrounding CpGs, hyper- orhypomethylated through EMT. (f) Bar plot displaying the percentage of hyper- or hypomethylated CpGs within cell-type specifically methylatedregions.
Ruike et al. BMC Genomics 2010, 11:137http://www.biomedcentral.com/1471-2164/11/137
Page 7 of 11
cell lines. Methylated DNA fragments were detectedusing a highly sensitive method involving enrichment byMeDIP, and high-throughput sequencing enabled thenon-biased mapping of aberrant methylation sites acrossthe genomes of BCC lines. We examined 10 differentcell populations in total, including EMT-induced MCF7cells, to investigate the association between DNAmethylome alterations and changes in cellular morpho-logical phenotypes. Our data sets covered almost theentire genome with sufficient depth to identify differen-tially methylated regions, thereby providing high resolu-tion and reproducibility, and proved that MeDIP-seq isa cost-effective approach for comparative analyses of themammalian DNA methylome. Although many research-ers have sought to describe DNA methylome alterationsin cancers, to our knowledge this is the first methylomestudy that effectively encompasses the entire genomeand is not limited to specific sequences. This study hasthus provided important new insights into the biologicalimplications of DNA methylation.Firstly, the global methylation map provides an indica-
tion of the intricate relationship between the methylomeand transcriptome. Most cancer methylome studies haveassumed that functionally important DNA methylationis restricted to promoters and that most DNA methyla-tion changes in cancer occur in CGIs, and they ignoreall other regions. In our analysis, although hypermethy-lation at predefined CGIs was a remarkable feature ofthe BCC lines, we also found that many non-CGIregions were broadly hypermethylated. Hypermethyla-tion occurred not only at proximal promoters but alsoat exons and introns, including regions distal from theTSS. Since DNA methylation interrupts the binding oftranscription factors to their response elements [2,11],changes in methylation at distal regions may affect theexpression of a gene. Since proximal promoters or CGImethylation are not always correlated with gene expres-sion [13,33], our comprehensive methylation maps willhelp us to better understand methylation-dependenttranscriptional regulation.Secondly, the comprehensive methylation maps help
us to understand how methylation is maintained andhow it is disrupted in BCC lines. We found that thenumber of reads was positively correlated with the num-ber of CpGs within 100 kb segments and this relation-ship was especially clear in HMEC. Although HMECshowed relatively low methylation levels in gene-relatedCpG-rich regions (corresponding to less than 8% ofwhole-genome CpGs), overall, methylation of each CpGseemed to be maintained at a nearly constant level. Themost prominent feature of aberrant methylation was themassive overall hypomethylation and simultaneoushypermethylation at CpG-rich regions. While theseobservations are consistent with previous reports [11],
our results provide the most detailed map of aberrantmethylation in BCC lines. We found that hypomethyla-tion in BCC lines was biased towards CpG-poor regions,and analysis of genomic features indicated there was nopreference for repeat sequences but included all gene-related regions equally. Furthermore, hypermethylationsof CpG-rich gene-related regions was present in BCClines although within extremely hypomethylated 100 kbsegments. These results support the idea that there areat least two distinct maintenance mechanisms that pro-duce the aberrant methylation patterns in CpG-poorregions and CpG-rich regions. One mechanism main-tains CpGs at a constant methylation level, which isdownregulated in BCC lines. Another mechanism main-tains gene-related CpG-rich regions at a specific methy-lation level, which is generally upregulated in BCC lines.Finally, the comparative analysis of methylation maps
of MCF7 cells with or without EMT induction providedan increased understanding of how cells undergo DNAmethylome alterations. Analysis of 100 kb segmentsrevealed almost unchanged overall methylation levelsthroughout EMT, while hypomethylation was observedat many CGI sites. With respect to the two distinctmechanisms of methylome alteration described above,EMT had little effect on the maintenance of the overallmethylation level, but had a considerable effect on cell-type specific methylation. On the other hand, EMTinduction altered cell-type specific gene-related methyla-tion such that hypomethylation was predominantlyobserved at CpG-rich regions. The idea that there arecell-type and gene specific mechanisms for regulation ofmethylation patterns within CpG-rich gene-relatedregions received further support from the followingobservations. The methylation status within CpG-richregions were likely to be shared by BCC lines, and CpGswithin CpG-rich repetitive sequences such as HSATIIwere extensively hypomethylated in BCC lines. Consid-ering that the methylation status participates in deter-mining the morphological phenotypes of the cells[7,28,29], our results suggested an interdependencebetween cell-type and gene specific regulation of DNAmethylations and morphological changes during EMT.
ConclusionsWe performed a comprehensive methylation profiling ofhuman mammary cell lines using the MeDIP-seq analy-sis, revealing aberrant methylation patterns in BCC linesand EMT-induced alteration of the methylome. Methy-lome alteration in BCC lines had two principal charac-teristics: a downregulated overall level of CpGmethylation; and cell-type specific regulation of DNAmethylation at gene-related CpG-rich regions. Ourresults provide important insights into the mechanismsof methylome alterations during tumor development.
Ruike et al. BMC Genomics 2010, 11:137http://www.biomedcentral.com/1471-2164/11/137
Page 8 of 11

MethodsCell linesHMEC (CC-2551, Lonza) was cultured using the med-ium supplied by MEGM Bullet Kit (CC-3150, Lonza) at37°C and 5% CO2. MCF7, MDAMB231, SKBR3, andT47D were kindly gifted by Dr. Masakazu Toi (professorof Kyoto University Hospital Breast Surgery Depart-ment) and cultured in RPMI 1640 medium (Invitrogen)containing 10% FBS. Hs578T (86082104, European Col-lection of Cell Culture) and MDAMB453 (RCB1192,RIKEN BioResource Center) were cultured in DMEMcontaining 10% FBS. HMC-1-8 and MRK-nu-1(JCRB0166 and JCRB0628 respectively, Health ScienceResearch Resources Bank) were cultured in RPMI 1640medium (Invitrogen) containing 10% FBS.
Bisulfite-modified DNA sequencingWe prepared genomic DNA from cultured cells using theGentra Puregene Cell kit (Qiagen). Approximately 2 μg ofDNA was bisulfite-treated with the EpiTect Bisufite kitaccording to the manufacturer’s protocol (Qiagen). Ampli-fication across the entire bisulfite converted genome wasperformed by the EpiTect Whole Bisufitome kit accordingto the manufacturer’s protocol (Qiagen). Nested PCR wasperformed on bisulfite-modified DNA using the followingprimers; IRX1firstF: GTTTTTGTATATTTGGTGGA,IRX1firstR: CAACTATCTAACAACCTATC, IRX1nes-tedF: TTTTTGGGTGAAGAGAAAGT, IRX1nestedR:CCCTTTTTAACAAAAACAAC, PAX7firstF: GGG-AGTTTTATTGGAGGAAT, PAX7firstR: ACTCCC-TCCCTCTTCTCCAC, PAX7nestedF: GAGAAGAT-GAGAAATAGGGT, PAX7nestedR: TCCACACCAAC-TTTCACAAC.
Methyl-DNA immunoprecipitationBefore carrying out MeDIP, we sonicated genomicDNA to produce random fragments ranging in sizefrom 200 to 600 bp. We used 4 mg of fragmentedDNA for a standard MeDIP assay as described [14].Briefly, following denaturation at 95°C for 10 min,immunoprecipitation was carried at 4°C for 2 hr using10 μg of monoclonal antibody against 5-methylcytidine(315-80541, Diagenode) in a final volume of 500 μl IPbuffer (10 mM sodium phosphate (pH 7.0), 140 mMNaCl, 0.05% Triton X-100). We incubated the mixturewith 40 μl of Dynabeads and M-280 sheep antibody tomouse IgG (Dynal Biotech) for 12 hr at 4°C andwashed it seven times with 700 μl of IP buffer. Wethen treated the beads with proteinase K for 4 hrat 50°C and recovered the methylated DNA byphenol-chloroform extraction followed by ethanolprecipitation.
Illumina Genome Analyzer sequencingWe performed second strand synthesis of MeDIP-enriched single-strand DNA fragments. Samples contain-ing ~200 ng of DNA and 500 ng of random primer at afinal volume of 57.9 μl were incubated at 70°C for 10 min,followed by gradual cooling for 40 min. Two ml of 2.5mM each dNTPs, 20 μl of 5× second strand buffer (100mM Tris-HCl (pH 7.5), 500 mM potasium chloride, 25mM magnesium chloride, 50 mM ammonium sulphate,and 250 mg/ml bovine serum albumin), 10 μl of 100 mMdithiothreitol, 3 μl of 5 mM beta-NAD+, 0.5 μl (5 U) of E.coli DNA ligase (TaKaRa Bio), and 6.6 μl (25 U) of E. coliDNA polymerase I (TaKaRa Bio) were then added to thesample (100 μl final volume). The reaction was performedat 14°C for 12 hr. Next, we purified double-stranded DNAfragments using the PCR purification kit (Qiagen). Theend-repair of DNA fragments, addition of an adenine tothe 3’ ends of DNA fragments, adaptor ligation, and PCRamplification by Illumina paired-end PCR primers wereperformed as described previously [14]. We performed gelelectrophoresis and excised bands from the gel to producelibraries with insert sizes of 250~350 bp, and quantifiedthese libraries using the Quant-iT PicoGreen dsDNAReagent and Kits (Invitrogen). We then prepared flowcellswith 8 pM DNA using the manufacture’s recommendedprotocol and sequenced for 36 cycles on an Illumina Gen-ome Analyzer II. Obtained images were analyzed andbase-called using GA pipeline software version 1.3 withdefault settings provided by Illumina. MeDIP-seq datafrom this study have been submitted to DDBJ ReadArchive database http://trace.ddbj.nig.ac.jp/dra/index_e.shtml under accession number “DRA000030”.
Mapping readsWe downloaded the human genome sequence and map-ping information (Mar. 2006, hg18) from the Universityof California Santa Cruz Genome Bioinformatics Sitehttp://genome.ucsc.edu. The reads were mapped ontothe human genome reference sequence using the high-performance alignment software ‘maq’ version 0.7.1http://maq.sf.net[17]. The reads with maq quality lessthan 10 were removed from further analysis. We consid-ered each singleton read as a 250 bp block extended fromthe single read’s mapping position on its strand, repre-senting an entry for MeDIP-enriched DNA fragments.
EMT-inductionMCF7 cells were plated at 3 × 10⁴ cells/ml in 12 wellplates and incubated for 24 hr. Cells were then treatedwith 2 ng/ml of TGFb and 10 ng/ml of TNFa for fivedays [34]. EMT-induction was confirmed by morpholo-gical alterations and the detection of downregulated
Ruike et al. BMC Genomics 2010, 11:137http://www.biomedcentral.com/1471-2164/11/137
Page 9 of 11

epithelial marker expression and upregulated mesench-ymal marker expression using reverse transcriptionPCR.
Additional file 1: Supplemental Figure 1. A figure showing effieientdetection of methylation by MeDIP-seq.
Additional file 2: Supplemental Figure 2. A figure showing aberrantmethylation patterns of CGIs in BCCs.
Additional file 3: Supplemental Figure 3. A figure showing thecorrelation between the normalized number of reads and the number ofCpGs and genes within 100 kb genomic segments.
Additional file 4: Supplemental Figure 4. A figure showing aberrantmethylation at the region distal from TSS.
Additional file 5: Supplemental Figure 5. A figure showing differentlyregulated methylation of CpG-poor and CpG-rich regions.
AbbreviationsDNA: deoxyribonucleic acid; MeDIP: methyl-DNA immunoprecipitation;MeDIP-seq: MeDIP combined with high-throughput sequencing; BCC: breastcancer cell; HMEC: human mammary epitherial cell; EMT: epithelial-mesenchymal transition; CGI: CpG island; BS-seq: bisulfite sequencing; HSATII:human satelite II; CpGo/e: CpG observed/expected ratio; TGFb: tumor growthfactor beta 1; TNFa: tumor necrosis factor (TNF superfamily, member 2);WT1: Wilms tumor 1; HOXA5: homeobox A5; IRX1: iroquois homeobox 1;PAX7: paired box 7.
AcknowledgementsThis work was supported in part by research grants from the Scientific Fundof the Ministry of Education, Science, and Culture of Japan (to GT); NationalInstitute of Biomedical Innovation (to GT); and the Japan Health ScienceFoundation and the Ministry of Human Health and Welfare (to GT).
Author details1Department of Genomic Drug Discovery Science, Graduate School ofPharmaceutical Sciences, Kyoto University, 46-20 Yoshida Shimoadachi-choSakyo-ku, Kyoto 606-8501, Japan. 2Department of Nanobio Drug Discovery,Graduate School of Pharmaceutical Sciences, Kyoto University, 46-20 YoshidaShimoadachi-cho Sakyo-ku, Kyoto 606-8501, Japan.
Authors’ contributionsAll authors conceived the experiments. YR and YI performed theexperiments and YR analyzed data. YR and GT co-wrote the paper. Allauthors discussed the results and commented on the manuscript. Allauthors read and approved the final manusucript.
Received: 12 November 2009Accepted: 25 February 2010 Published: 25 February 2010
References1. Gardiner-Garden M, Frommer M: CpG islands in vertebrate genomes. J
Mol Biol 1987, 196:261-282.2. Clark SJ, Melki J: DNA methylation and gene silencing in cancer: which is
the guilty party?. Oncogene 2002, 21:5380-5387.3. Li E, Bestor TH, Jaenisch R: Targeted mutation of the DNA
methyltransferase gene results in embryonic lethality. Cell 1992,69:915-926.
4. Li E, Beard C, Jaenisch R: Role for DNA methylation in genomicimprinting. Nature 1993, 366:362-365.
5. Migeon BR: Concerning the role of X-inactivation and DNA methylationin fragile X syndrome. Am J Med Genet 1992, 43:182-187.
6. Feinberg AP, Tycko B: The history of cancer epigenetics. Nat Rev Cancer2004, 4:143-153.
7. Hu M, Yao J, Cai L, Bachman KE, Brûle van den F, Velculescu V, Polyak K:Distinct epigenetic changes in the stromal cells of breast cancers. NatGenet 2005, 37:899-905.
8. Weber M, Davies JJ, Wittig D, Oakeley EJ, Haase M, Lam WL, Schübeler D:Chromosome-wide and promoter-specific analyses identify sites ofdifferential DNA methylation in normal and transformed human cells.Nat Genet 2005, 37:853-862.
9. Irizarry RA, Ladd-Acosta C, Wen B, Wu Z, Montano C, Onyango P, Cui H,Gabo K, Rongione M, Webster M, Ji H, Potash JB, Sabunciyan S,Feinberg AP: The human colon cancer methylome shows similar hypo-and hypermethylation at conserved tissue-specific CpG island shores.Nat Genet 2009, 41:178-186.
10. Weber M, Hellmann I, Stadler MB, Ramos L, Pääbo S, Rebhan M,Schübeler D: Distribution, silencing potential and evolutionary impact ofpromoter DNA methylation in the human genome. Nat Genet 2007,39:457-466.
11. Herman JG, Baylin SB: Gene silencing in cancer in association withpromoter hypermethylation. N Engl J Med 2003, 349:2042-2054.
12. Esteller M: Cancer epigenomics: DNA methylomes and histone-modification maps. Nat Rev Genet 2007, 8:286-298.
13. Komashko VM, Acevedo LG, Squazzo SL, Iyengar SS, Rabinovich A,O’Geen H, Green R, Farnham PJ: Using ChIP-chip technology to revealcommon principles of transcriptional repression in normal and cancercells. Genome Res 2008, 18:521-532.
14. Pomraning KR, Smith KM, Freitag M: Genome-wide high throughputanalysis of DNA methylation in eukaryotes. Methods 2009, 47:142-150.
15. Pelizzola M, Koga Y, Urban AE, Krauthammer M, Weissman S, Halaban R,Molinaro AM: MEDME: an experimental and analytical methodology forthe estimation of DNA methylation levels based on microarray derivedMeDIP-enrichment. Genome Res 2008, 18:1652-1659.
16. Irizarry RA, Ladd-Acosta C, Carvalho B, Wu H, Brandenburg SA, Jeddeloh JA,Wen B, Feinberg AP: Comprehensive high-throughput arrays for relativemethylation (CHARM). Genome Res 2008, 18:780-790.
17. Down TA, Rakyan VK, Turner DJ, Flicek P, Li H, Kulesha E, Gräf S, Johnson N,Herrero J, Tomazou EM, Thorne NP, Bäckdahl L, Herberth M, Howe KL,Jackson DK, Miretti MM, Marioni JC, Briney E, Hubbard TJ, Drubin R,Tavaré S, Beck S: A Bayesian deconvolution strategy forimmunoprecipitation-based DNA methylome analysis. Nat Biotechnol2008, 26:779-785.
18. Lister R, O’Malley RC, Tonti-Filippini J, Gregory BD, Berry CC, Millar AH,Ecker JR: Highly integrated single-base resolution maps of theepigenome in Arabidopsis. Cell 2008, 133:523-536.
19. Cokus SJ, Feng S, Zhang X, Chen Z, Merriman B, Haudenschild CD,Pradhan S, Nelson SF, Pellegrini M, Jacobsen SE: Shotgun bisulphitesequencing of the Arabidopsis genome reveals DNA methylationpatterning. Nature 2008, 452:215-219.
20. Lister R, Pelizzola M, Dowen RH, Hawkins RD, Hon G, Tonti-Filippini J,Nery JR, Lee L, Ye Z, Ngo QM, Edsall L, Antosiewicz-Bourget J, Stewart R,Ruotti V, Millar AH, Thomson JA, Ren B, Ecker JR: Human DNA methylomesat base resolution show widewpread epigenomic differences. Nature2009, 462:315-322.
21. Wu GJ, Sinclair CS, Paape J, Ingle JN, Roche PC, James CD, Couch FJ: 17q23amplifications in breast cancer involve the PAT1, RAD51C, PS6K, andSIGma1B genes. Cancer Res 2000, 60:5371-5375.
22. Bärlund M, Monni O, Weaver JD, Kauraniemi P, Sauter G, Heiskanen M,Kallioniemi OP, Kallioniemi A: Cloning of BCAS3 (17q23) and BCAS4(20q13) genes that undergo amplification, overexpression, and fusion inbreast cancer. Genes Ghromosomes Cancer 2002, 35:311-317.
23. Jackson K, Yu MC, Arakawa K, Fiala E, Youn B, Fiegl H, Müller-Holzner E,Widschwendter M, Ehrlich M: DNA hypomethylation is prevalent even inlow-grade breast cancers. Cancer Biol Ther 2004, 3:1225-1231.
24. Tommasi S, Karm DL, Wu X, Yen Y, Pfeifer GP: Methylation of homeoboxgenes is a frequent and early epigenetic event in breast cancer. BreastCancer Res 2009, 11:R14.
25. Laux DE, Curran EM, Welshons WV, Lubahn DB, Huang TH:Hypermethylation of the Wilms’ tumor suppressor gene CpG island inhuman breast carcinomas. Breast Cancer Res 1999, 56:35-43.
26. Novak P, Jensen T, Oshiro MM, Wozniak RJ, Nouzova M, Watts GS,Klimecki WT, Kim C, Futscher BW: Epigenetic inactivation of the HOXAgene cluster in breast cancer. Cancer Res 2006, 66:10664-10670.
27. Hoeflich KP, O’Brien C, Boyd Z, Cavet G, Guerrero S, Jung K, Januario T,Savage H, Punnoose E, Truong T, Zhou W, Berry L, Murray L, Amler L,Belvin M, Friedman LS, Lackner MR: In vivo antitumor activity of MEK and
Ruike et al. BMC Genomics 2010, 11:137http://www.biomedcentral.com/1471-2164/11/137
Page 10 of 11
phosphatidylinositol 3-kinase inhibitors in basal-like breast cancermodels. Clin Cancer Res 2009, 15:4649-64.
28. Saxonov S, Berg P, Brutlag DL: A genome-wide analysis of CpGdinucleotides in the human genome distinguishes two distinct classesof promoters. Proc Natl Acad Sci USA 2006, 103:1412-1417.
29. Lacroix M, Leclercq G: Relevance of breast cancer cell lines as models forbreast tumours: an update. Breast Cancer Res Treat 2004, 83:249-289.
30. Lombaerts M, van Wezel T, Philippo K, Dierssen JW, Zimmerman RM,Oosting J, van Eijk R, Eilers PH, Water van de B, Cornelisse CJ, Cleton-Jansen AM: E-cadherin transcriptional downregulation by promotermethylation but not mutation is related to epithelial-to-mesenchymaltransition in breast cancer cell lines. Br J Cancer 2006, 94:661-671.
31. Cheng AS, Culhane AC, Chan MW, Venkataramu CR, Ehrich M, Nasir A,Rodriguez BA, Liu J, Yan PS, Quackenbush J, Nephew KP, Yeatman TJ,Huang TH: Epithelial progeny of estrogen-exposed breast progenitorcells display a cancer-like methylome. Cancer Res 2008, 68:1786-1796.
32. Dumont N, Wilson MB, Crawford YG, Reynolds PA, Sigaroudinia M, Tlsty TD:Sustained induction of epithelial to mesenchymal transition activatesDNA methylation of genes silenced in basal-like breast cancers. Proc NatlAcad Sci USA 2008, 105:14867-14872.
33. Jones PA: The DNA methylation paradox. Trends Genet 1999, 15:34-37.34. Burk U, Schubert J, Wellner U, Schmalhofer O, Vincan E, Spaderna S,
Brabletz T: A reciprocal repression between ZEB1 and members of themiR-200 family promotes EMT and invasion in cancer cells. EMBO Rep2008, 9:582-589.
doi:10.1186/1471-2164-11-137Cite this article as: Ruike et al.: Genome-wide analysis of aberrantmethylation in human breast cancer cells using methyl-DNAimmunoprecipitation combined with high-throughput sequencing. BMCGenomics 2010 11:137.
Submit your next manuscript to BioMed Centraland take full advantage of:
• Convenient online submission
• Thorough peer review
• No space constraints or color figure charges
• Immediate publication on acceptance
• Inclusion in PubMed, CAS, Scopus and Google Scholar
• Research which is freely available for redistribution
Submit your manuscript at www.biomedcentral.com/submit
Ruike et al. BMC Genomics 2010, 11:137http://www.biomedcentral.com/1471-2164/11/137
Page 11 of 11