genome-wide analyses of early translational responses to
TRANSCRIPT
Abiotic stress infl uences the translation of mRNAs in plants. To gain a global view of the early translational response to abiotic stress, we investigated genome-wide changes in mRNA translation in Arabidopsis thaliana suspension cell cultures exposed to brief periods of two types of stress: elevated temperature (37 ° C) and high salinity (200 mM NaCl). Microarray analyses revealed that polysome association of most transcripts, which were monitored by using polysomal- and non-polysomal-associated RNA pools, was variably depressed by both stresses within 10 min. We also inspected coordination of changes in translational profi les with transcriptional profi les, and found no simple correlations between the changes in these two processes under both stresses. In addition, we uncovered that the 10 min heat- and salt-inducible changes in polysome association of individual transcripts affected specifi c biological functions differently; some functional classes were recalcitrant to the overall depression, while others were hypersensitive to it. Heat and salt stresses imposed similar, but not identical, changes in polysome association of individual transcripts, and the functional categories with differential responses from all other genes (i.e. recalcitrant or hypersensitive functional categories) displayed some overlap between the two stresses, suggesting similar underlying mechanisms. Our results highlight the importance of dynamic changes in mRNA translation, which include selective translation and extensive repression of a subset of transcripts, in plant abiotic stress responses.
Keywords: Arabidopsis thaliana suspension cell cultures • Heat stress • Microarray • Polysomes • Salt stress • Translational control .
Abbreviations : AGI , Arabidopsis Genome Initiative ; CHX , cycloheximide ; cRNA , complementary RNA ; ES , expression score ; HS , heat stress ; PS , polysome score ; qRT-PCR , quantitative real-time PCR ; r-luc , Renilla luciferase ; SS , salt stress.
Introduction
Alteration of gene expression triggered by a variety of abiotic stresses, such as elevated temperature, high salinity and drought, is an essential mechanism which allows plants to respond and adapt to adverse conditions, and thereby ensure survival. In addition to changes in individual mRNA levels in total RNA populations (steady-state mRNA levels), it has long been recognized that translational effi ciency of individual mRNAs dynamically changes in response to various abiotic stresses ( Bailey-Serres 1999 ), e.g. elevated temperature ( Key et al. 1981 , Nover et al. 1989 ), high salinity ( Ben-Zioni et al. 1967 ), dehydra-tion ( Ben-Zioni et al. 1967 , Hsiao 1970 , Kawaguchi et al. 2004 ) and oxygen deprivation ( Sachs et al. 1980 , Branco-Price et al. 2005 ). While synthesis of normal proteins is inhibited under these abiotic stress conditions, a fraction of transcripts is known to be recalcitrant to global translational repression ( Bailey-Serres 1999 ). For example, anaerobic polypeptide genes such as the alcohol dehydrogenase gene escape global translational repression and remain actively translated under oxygen deprivation ( Fennoy et al. 1998 ). Selective translational regulation of mRNA subsets is thought to be particularly important because of the critical functions of the encoded proteins in responding to abiotic stresses.
Recently, DNA microarrays have been applied to monitor changes in the translation state of individual mRNAs on a whole-genome scale in response to some abiotic stresses in Arabidopsis thaliana (reviewed in Bailey-Serres et al. 2009 ). The translation state is a parameter refl ecting the degree to which individual gene transcripts are translated into the correspond-ing proteins. Typically, the translation state is evaluated either by comparing mRNA levels in the polysomal (multiribosomal) and non-polysomal (free and/or monoribosomal) complexes in cell extract fractionated through a sucrose density gradient or by examining the correlation between total cellular and poly-some-bound mRNA levels. In leaves exposed to dehydration ( Kawaguchi et al. 2004 , Kawaguchi and Bailey-Serres 2005 ),
Genome-Wide Analyses of Early Translational Responses to Elevated Temperature and High Salinity in Arabidopsis thaliana Hideyuki Matsuura 1 , 3 , Yu Ishibashi 1 , Atsuhiko Shinmyo 1 , Shigehiko Kanaya 2 and Ko Kato 1 , ∗ 1 Graduate School of Biological Sciences, Nara Institute of Science and Technology, 8916-5 Takayama, Ikoma, Nara, 630-0192 Japan 2 Graduate School of Information Science, Nara Institute of Science and Technology, 8916-5 Takayama, Ikoma, Nara, 630-0192 Japan 3 Present address: Graduate School of Pharmaceutical Sciences, Osaka University, 1-6 Yamadaoka, Suita, Osaka 565-0871, Japan ∗ Corresponding author: E-mail, [email protected] ; Fax, + 81-743-72-5469 (Received November 1, 2009; Accepted January 14, 2010)
Plant Cell Physiol. 51(3): 448–462 (2010) doi:10.1093/pcp/pcq010, available online at www.pcp.oxfordjournals.org© The Author 2010. Published by Oxford University Press on behalf of Japanese Society of Plant Physiologists.All rights reserved. For permissions, please email: [email protected]
448 Plant Cell Physiol. 51(3): 448–462 (2010) doi:10.1093/pcp/pcq010 © The Author 2010.
Regular Paper
Dow
nloaded from https://academ
ic.oup.com/pcp/article/51/3/448/1895718 by guest on 29 January 2022
seedlings exposed to hypoxia ( Branco-Price et al. 2005 ) and cell cultures under sucrose starvation ( Nicolai et al. 2006 ), it has been shown that the A. thaliana mRNA translation state is regulated differentially among different mRNA species; the majority of transcripts show varying degrees of translational repression, while a subset of transcripts escape such repression and remain actively translated. These studies have endorsed the importance of differential translational control in plant abiotic stress responses. Most recently, Branco-Price et al. (2008) reported that differential translational regulation plays important roles in energy conservation as well as in regulation of gene expression under transient oxygen deprivation, based upon a quantitative evaluation of translational and metabolic adjustments in response to that stress.
Elevated temperature (heat stress; HS) and high salinity (salt stress; SS) disturb cellular homeostasis in plants and can lead to severe retardation in growth and development, and even death. Plants exposed to HS or SS exhibit a characteristic set of cellular and metabolic responses. One response typical to both stresses is an accelerated transcription of a set of stress-related genes, such as those encoding heat shock proteins ( Rizhsky et al. 2002 , Seki et al. 2002 ). Moreover, HS and SS are shown to lead to a decrease in the synthesis of normal proteins in soybean seedlings ( Key et al. 1981 ), tomato cell cultures ( Nover et al. 1989 ) and Arabidopsis cell cultures ( Ndimba et al. 2005 ). While the translational responses to HS and SS have been examined at the cellular level, translational responses of individual transcripts to these two important abiotic stresses have not yet been characterized on a whole-genome scale, and the biological signifi cance of the response has not been assessed.
In this study, we performed genome-wide analyses of trans-lational control in A. thaliana suspension cell cultures exposed to two important abiotic stresses, HS and SS. Since the most conspicuous advantage of translational control over other regulatory mechanisms of gene expression is of its immediacy ( Mathews et al. 2007 ), we focused on earlier (i.e. 10 min) responses compared with previous similar studies ( Kawaguchi et al. 2004 , Branco-Price et al. 2005 , Kawaguchi and Bailey-Serres 2005 , Branco-Price et al. 2008 , Nicolai et al. 2006 ). To obtain a better understanding of translational control in response to abiotic stress, networks of co-regulated mRNAs and the biological signifi cance of this process in plants, we conducted a number of further analyses. First, we focused on the responses of individual transcripts as well as of functional groups (subsets of genes encoding proteins with similar functions) that show a differential response relative to other genes. Secondly, we investigated the coordination of changes in translation state with accumulated transcript levels. The regulation of gene expression occurs at multiple levels, and it has been known that interconnections exist among these control layers ( Mazzucotelli et al. 2008 ). Thirdly, we directly compared trans-lational responses to HS and SS with one another. Although genome-wide transcriptome comparisons have been widely employed in plants under various abiotic stresses to uncover
transcriptional control and signaling pathways critical for plant abiotic stress responses ( Chen et al. 2002 , Kreps et al. 2002 , Seki et al. 2002 , Rabbani et al. 2003 ), no study has performed side-by-side monitoring of translational responses to different stresses on a whole-genome scale. Because the same experi-mental materials, methodologies and microarray platform were used, comparison between the two data sets could be straightforward. Through the analyses described above, our study uncovered trends in translational control of different mRNAs in response to a short period of HS and SS.
Results and Discussion
Genome-wide analysis of the polysome association of individual mRNAs The experimental scheme for characterizing the translational response of A. thaliana cell cultures to HS and SS is shown in Fig. 1A . We monitored the infl uence of a short period of HS and SS on global polysome–mRNA association by separating cell extracts using sucrose density gradient centrifugation (polysome fractionation assay). Within 10 min of HS (shift from 22 to 37 ° C) or SS (addition of 200 mM NaCl to the culture medium), polysome profi les (254 nm absorbance profi le) showed a drastic decrease in polysomal (two or more ribo-somes) regions and a concomitant increase in non-polysomal (80S monoribosome and ribosomal subunits) regions ( Fig. 1A ). These changes indicate a decrease in polysome-bound mRNA and a concomitant increase in monoribosome-bound or free mRNA. These results are indicative of global translational repression following exposure to HS or SS, consistent with previous reports for several other plant species ( Ben-Zioni et al. 1967 , Key et al. 1981 , Nover et al. 1989 , Ndimba et al. 2005 ). Translational repression following exposure to HS or SS was further examined by [ 35 S]methionine pulse labeling experiments, which showed that de novo protein synthesis in HS- or SS-treated cells is impaired relative to the control cells ( Fig. 1B ). Because 10 min of HS or SS induces drastic changes in mRNA–polysome association but not in cell growth (data not shown), these stress conditions were selected for further analyses.
Next, the polysome association of individual transcripts in A. thaliana cells exposed to HS (37 ° C/10 min), SS (200 mM NaCl/10 min) and their corresponding control conditions (22 ° C and no NaCl, respectively) was evaluated on a whole-genome scale using DNA microarrays. Cell extracts were frac-tionated using the polysome fractionation assay, pooled to two fractions—polysomal mRNA (fractions 1–3 in the absor-bance profi le shown in Fig. 1A ) and non-polysomal mRNA (fractions 5–7 in the absorbance profi le shown in Fig. 1A )— converted into Cy3- and Cy5-labeled complementary RNAs (cRNAs), and subsequently subjected to co-hybridization on Agilent Arabidopsis 3 Oligo Microarrays. Since the amount of total RNAs in polysome and non-polysome fractions is not constant for the four conditions, we spiked a known amount of
449
Translational response to heat and salt stress
Plant Cell Physiol. 51(3): 448–462 (2010) doi:10.1093/pcp/pcq010 © The Author 2010.
Dow
nloaded from https://academ
ic.oup.com/pcp/article/51/3/448/1895718 by guest on 29 January 2022
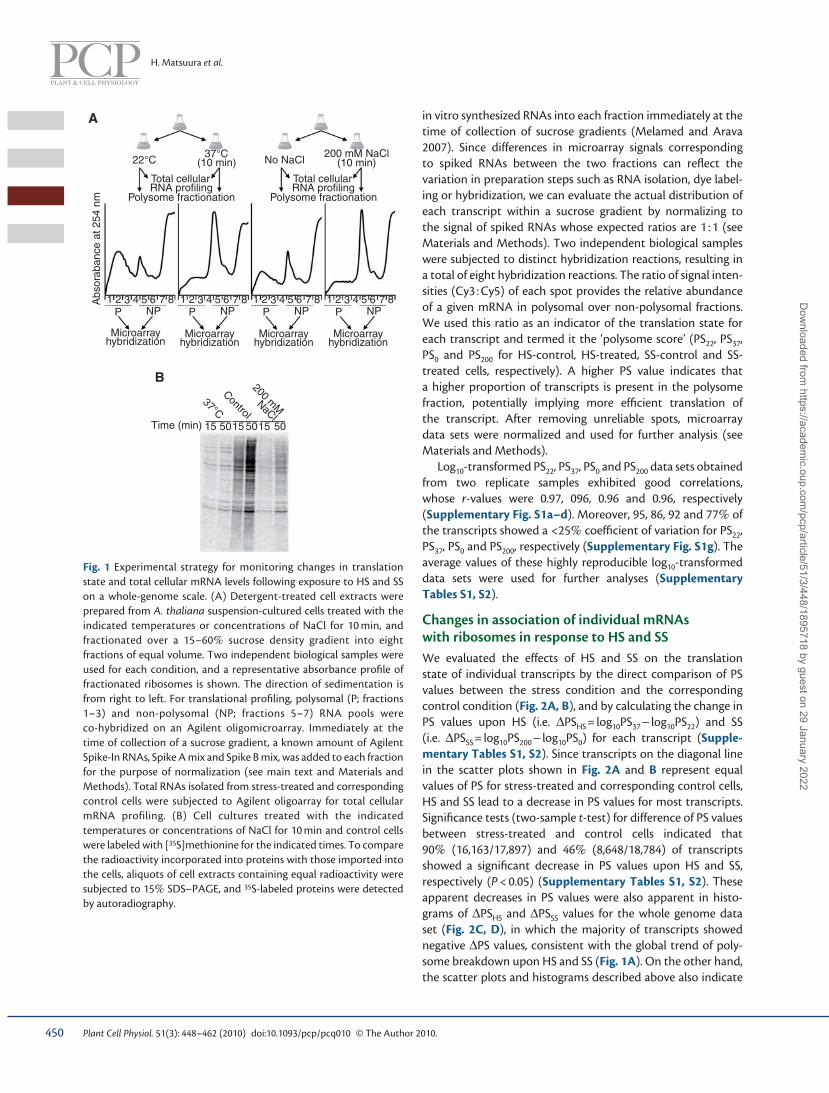
in vitro synthesized RNAs into each fraction immediately at the time of collection of sucrose gradients ( Melamed and Arava 2007 ). Since differences in microarray signals corresponding to spiked RNAs between the two fractions can refl ect the variation in preparation steps such as RNA isolation, dye label-ing or hybridization, we can evaluate the actual distribution of each transcript within a sucrose gradient by normalizing to the signal of spiked RNAs whose expected ratios are 1 : 1 (see Materials and Methods). Two independent biological samples were subjected to distinct hybridization reactions, resulting in a total of eight hybridization reactions. The ratio of signal inten-sities (Cy3 : Cy5) of each spot provides the relative abundance of a given mRNA in polysomal over non-polysomal fractions. We used this ratio as an indicator of the translation state for each transcript and termed it the ‘polysome score’ (PS 22 , PS 37 , PS 0 and PS 200 for HS-control, HS-treated, SS-control and SS-treated cells, respectively). A higher PS value indicates that a higher proportion of transcripts is present in the polysome fraction, potentially implying more effi cient translation of the transcript. After removing unreliable spots, microarray data sets were normalized and used for further analysis (see Materials and Methods).
Log 10 -transformed PS 22 , PS 37 , PS 0 and PS 200 data sets obtained from two replicate samples exhibited good correlations, whose r -values were 0.97, 096, 0.96 and 0.96, respectively (Supplementary Fig. S1a–d). Moreover, 95, 86, 92 and 77 % of the transcripts showed a <25 % coeffi cient of variation for PS 22 , PS 37 , PS 0 and PS 200 , respectively (Supplementary Fig. S1g). The average values of these highly reproducible log 10 -transformed data sets were used for further analyses (Supplementary Tables S1, S2).
Changes in association of individual mRNAs with ribosomes in response to HS and SS We evaluated the effects of HS and SS on the translation state of individual transcripts by the direct comparison of PS values between the stress condition and the corresponding control condition ( Fig. 2A, B ), and by calculating the change in PS values upon HS (i.e. ∆ PS HS = log 10 PS 37 − log 10 PS 22 ) and SS (i.e. ∆ PS SS = log 10 PS 200 − log 10 PS 0 ) for each transcript (Supple-mentary Tables S1, S2). Since transcripts on the diagonal line in the scatter plots shown in Fig. 2A and B represent equal values of PS for stress-treated and corresponding control cells, HS and SS lead to a decrease in PS values for most transcripts. Signifi cance tests (two-sample t -test) for difference of PS values between stress-treated and control cells indicated that 90 % (16,163/17,897) and 46 % (8,648/18,784) of transcripts showed a signifi cant decrease in PS values upon HS and SS, respectively ( P < 0.05) (Supplementary Tables S1, S2). These apparent decreases in PS values were also apparent in histo-grams of ∆ PS HS and ∆ PS SS values for the whole genome data set ( Fig. 2C, D ), in which the majority of transcripts showed negative ∆ PS values, consistent with the global trend of poly-some breakdown upon HS and SS ( Fig. 1A ). On the other hand, the scatter plots and histograms described above also indicate
22°C37°C
(10 min)
Total cellularRNA profiling
Polysome fractionation
Total cellularRNA profiling
Polysome fractionation
Abs
orab
ance
at 2
54 n
m
1 2 3 4 5 6 7 8 1 2 3 4 5 6 7 8 1 2 3 4 5 6 7 8 1 2 3 4 5 6 7 8
No NaCl200 mM NaCl
(10 min)
P NP
Microarrayhybridization
P NP
Microarrayhybridization
P NP
Microarrayhybridization
P NP
Microarrayhybridization
Time (min) 15 5015 50 5015
37°C
Control
200 mMNaCl
B
A
Fig. 1 Experimental strategy for monitoring changes in translation state and total cellular mRNA levels following exposure to HS and SS on a whole-genome scale. (A) Detergent-treated cell extracts were prepared from A. thaliana suspension-cultured cells treated with the indicated temperatures or concentrations of NaCl for 10 min, and fractionated over a 15–60 % sucrose density gradient into eight fractions of equal volume. Two independent biological samples were used for each condition, and a representative absorbance profi le of fractionated ribosomes is shown. The direction of sedimentation is from right to left. For translational profi ling, polysomal (P; fractions 1–3) and non-polysomal (NP; fractions 5–7) RNA pools were co-hybridized on an Agilent oligomicroarray. Immediately at the time of collection of a sucrose gradient, a known amount of Agilent Spike-In RNAs, Spike A mix and Spike B mix, was added to each fraction for the purpose of normalization (see main text and Materials and Methods). Total RNAs isolated from stress-treated and corresponding control cells were subjected to Agilent oligoarray for total cellular mRNA profiling. (B) Cell cultures treated with the indicated temperatures or concentrations of NaCl for 10 min and control cells were labeled with [ 35 S]methionine for the indicated times. To compare the radioactivity incorporated into proteins with those imported into the cells, aliquots of cell extracts containing equal radioactivity were subjected to 15 % SDS–PAGE, and 35 S-labeled proteins were detected by autoradiography.
450
H. Matsuura et al.
Plant Cell Physiol. 51(3): 448–462 (2010) doi:10.1093/pcp/pcq010 © The Author 2010.
Dow
nloaded from https://academ
ic.oup.com/pcp/article/51/3/448/1895718 by guest on 29 January 2022

that some transcripts are recalcitrant to the global translational impairment induced by HS and SS, while others are hypersensi-tive. These differential changes in translation state in response to a short period of HS or SS are similar to those previously reported to be seen in response to drought and oxygen depriva-tion ( Kawaguchi et al. 2004 , Kawaguchi and Bailey-Serres 2005 , Branco-Price et al. 2005 , Branco-Price et al. 2008 ).
Our microarray data set was validated by quantitative real-time PCR (qRT-PCR) for a subset of transcripts which were selected to represent a wide range of ∆ PS and PS values. Some transcripts whose accumulated amount was increased upon HS were also selected based on the transcriptome analyses described later. Cell extracts subjected to polysome fractionation were fractionated into eight fractions, and rela-tive amounts of specifi c transcripts present in each fraction were quantifi ed using qRT-PCR ( Fig. 3A ). When the PS 22 , PS 37 , PS 0 , PS 200 , ∆ PS HS and ∆ PS SS values determined by qRT-PCR were compared with the corresponding values determined by microarray analyses ( Table 1 ), all values displayed high correla-tions ( r = 0.88–0.95) between the two independent methods ( Fig. 3B and Supplementary Fig. S2).
Genome-wide analysis of changes in total cellular mRNA levels in response to HS and SS To gain insight into the genome-wide connection between cellular responses at the level of translation and total cellular mRNA abundance, we also used the Agilent oligoarray in a non-fractionated RNA (total RNA) transcriptome profi ling experiment comparing cells treated with 10 min of HS or SS and control cells ( Fig. 1A ). We isolated total RNAs from two independent cell cultures for each condition (HS-control, HS-treated, SS-control and SS-treated cells) and determined the ratio of signal intensities for stress-treated over control cells with good reproducibility (Supplementary Fig. S1e–g), hereafter termed ‘expression scores’ (ES HS and ES SS for HS and SS treatments, respectively). qRT-PCR on some transcripts validated the total RNA profi ling results by showing a high correlation of log 10 ES HS values ( r = 0.98) between the two experimental methods (Supplementary Fig. S2c and Table 1 ).
We found that 209 and 225 transcripts increased by > 3-fold in total cellular mRNA levels following exposure to 10 min of HS and SS, respectively, with statistical signifi cance ( P < 0.05) in both replicated microarray analyses (Supplementary Table S3).
2.0
1.5
1.5 2.0
1.0
1.0
0.5
0.5
–0.5
–0.5
–1.0
–1.0–1.5
–1.5
0
0
0.5–0.5–1.0–1.5 00
2.0
1.5
1.5 2.0
1.0
1.0
0.5
0.5
–0.5
–0.5
–1.0
–1.0–1.5
–1.5
0
0
Log10PS22 Log10PS0
Log 1
0PS
200
Log 1
0PS
37
2500
2000
5000
4000
3000
2000
1000
1500
1000
500
0
Gen
e nu
mbe
r
Gen
e nu
mbe
r
DPSHS
0.5–0.5–1.0–1.5 0DPSSS
Mean=–0.31
SD=0.21
Mean=–0.77
SD=0.32
A B
C D
Fig. 2 Genome-wide analyses of translational control in response to HS and SS. (A and B) The indicators for translation state, ‘polysome score (PS)’ (i.e. the relative abundance of RNAs in polysomes vs. non-polysomes), were evaluated for each transcript and for each condition by microarray analyses, and log 10 PS 22 and log 10 PS 37 (A; n = 17,897) or log 10 PS 0 and log 10 PS 200 (B; n = 18,784) were plotted for each transcript. The values are the average of two biological replicates. (C and D) Indicator for change in translation state upon stress treatments, ‘ ∆ PS’, was calculated as the change in PS values upon stress treatments for individual transcripts, and the histogram of ∆ PS HS (C) or ∆ PS SS (D) values is shown for the whole genome data set. The mean and SD of the ∆ PS values are provided.
451
Translational response to heat and salt stress
Plant Cell Physiol. 51(3): 448–462 (2010) doi:10.1093/pcp/pcq010 © The Author 2010.
Dow
nloaded from https://academ
ic.oup.com/pcp/article/51/3/448/1895718 by guest on 29 January 2022

40
30
20
10
01 2 3 4 65 7 8
4050
30
20
100
4050
30
20
100
Rel
ativ
e R
NA
leve
l (%
)
Rel
ativ
e R
NA
leve
l (%
)
HS-control cells (22°C) HS-treated cells (37°C/10 min)
Putative histone H1 SAND
Fraction number1 2 3 4 65 7 8
Fraction number
4050
30
20
100
1 2 3 4 65 7 8Fraction number R
elat
ive
RN
A le
vel (
%)
4050
30
20
100
1 2 3 4 65 7 8Fraction number
1 2 3 4 65 7 8Fraction number
GSA1
SS-control cells (No NaCl) SS-treated cells (200 mM NaCl/10 min)
GSA1Putative PP2C
DPS
(qR
T-P
CR
dat
a)
0.5
0.5
–0.5
–0.5
–1.5
–1.5–2.0
–2.0
–1.0
–1.0
0
0DPS (microarry data)
r=0.95
HSSS
A
B
Fig. 3 Validation of microarray data using the qRT-PCR method for a subset of transcripts. (A) Example polysome profi les of specifi c transcripts. Transcript levels of the indicated genes relative to external control r-luc mRNA, which was introduced into each fraction immediately at the time of collection of the sucrose gradient, was determined by qRT-PCR using total RNA isolated from each fraction. Fraction number corresponds to that in the absorbance profi le shown in Fig. 1A . Results are graphically represented as the ratio of transcripts present in each fraction to the sum of all fractions. A representative profi le of two biological replicates is shown. (B) ∆ PS HS and ∆ PS SS values were calculated for 16 and eight genes, respectively, based on the polysome profi les determined by qRT-PCR as described above, and compared with the corresponding values determined by microarray analysis. The Pearson correlation coeffi cient and the regression line (dotted line) for all data points are shown. The data plotted are summarized in Table 1 .
Supplementary Fig. S3a and b display the histogram of the average value of log 10 ES HS and log 10 ES SS for two replicated microarray analyses. The observation that the variations of the changes in total cellular mRNA levels were narrower (Supplementary Fig. S3a, b) than changes in translation state ( Fig. 2C, D ) imply that, although the changes in both total cellular mRNA levels and mRNA translation state occur early in response to HS and SS, translational control is likely to target a greater number of mRNA species than control of total cellular mRNA levels.
Relationship of the changes in translation state and steady-state mRNA levels following exposure to HS or SS We compared changes in translation state upon HS and SS (i.e. ∆ PS HS and ∆ PS SS , respectively) with changes in steady-state mRNA levels upon HS and SS (i.e. log 10 ES HS and log 10 ES SS , respectively) for individual transcripts using our microarray data sets. No simple correlation was found between ∆ PS HS vs. log 10 ES HS ( Fig. 4A ) and ∆ PS SS vs. log 10 ES SS ( Fig. 4B ) by scatter plot analyses, suggesting that responses to HS and SS at the translational level are generally independent of those in the steady-state mRNA level. We came to a similar conclusion when we focused on HS- or SS-inducible genes, which are defi ned as the genes whose mRNA abundance increased by > 3-fold upon the corresponding stress in both replicated microarrays ( P < 0.05) (Supplementary Table S3). In Fig. 4C
and D, we show the relative frequency histograms of ∆ PS HS and ∆ PS SS values, respectively, for the corresponding stress-inducible transcripts as well as for all other transcripts in the whole genome set. The average ∆ PS HS value for HS-inducible transcripts ( − 0.62) was signifi cantly larger than that for all other transcripts ( − 0.77) ( P < 10 − 5 ) ( Fig. 4C ). There are likely to be at least two groups of HS-inducible transcripts; the fi rst group is recalcitrant to the global repression of polysome association induced by HS, and the second set obeys the general trend of global repression of polysome association. In contrast, the average ∆ PS SS value for SS-inducible transcripts ( − 0.39) was signifi cantly smaller than that for all other transcripts ( − 0.31) ( P < 0.01), indicating that the SS-inducible transcripts tend to be hypersensitive to reduced polysome association induced by SS ( Fig. 4D ). These results suggest that, in general, HS- and SS-inducible transcripts are not necessarily recalcitrant to global translational repression induced by their respective stresses. Transcripts induced but not actively trans-lated under HS or SS might be an investment for adaptation to prolonged stress or for homeostasis after relief from the stress conditions. Branco-Price et al. (2008) identifi ed genes with similar patterns of transcript accumulation and translation in Arabidopsis seedlings in response to hypoxia stress using cluster analysis, and demonstrated a strong dichotomy between the two types of regulation. On the other hand, they also found an exceptional cluster to show strong concordant induction in transcript accumulation and translation.
452
H. Matsuura et al.
Plant Cell Physiol. 51(3): 448–462 (2010) doi:10.1093/pcp/pcq010 © The Author 2010.
Dow
nloaded from https://academ
ic.oup.com/pcp/article/51/3/448/1895718 by guest on 29 January 2022

Table 1 Comparison of the values of indicators determined by microarray and qRT-PCR analyses for a subset of genes
AGI code Description Microarray QRT-PCR
Log 10 PS 22 Log 10 PS 37 ∆ PS HS Log 10 ES HS Log 10 PS 22 Log 10 PS 37 ∆ PS HS Log 10 ES HS
At4g10250 Heat shock protein 22.0 2.15 3.02
At5g59720 Heat shock protein 18.2 0.88 0.71 − 0.17 1.53 0.82 0.30 − 0.52 2.26
At3g08970 Putative DnaJ protein 1.28 0.11 − 1.16 1.51 0.90 0.01 − 0.89 1.61
At5g59820 Zinc fi nger protein Zat12 0.80 0.74 − 0.06 1.43 0.57 0.19 − 0.38 1.45
At3g62260 Protein phosphatase, putative 0.76 0.34 − 0.42 0.72 0.69 0.08 − 0.60 0.88
At5g15450 ClpB heat shock protein-like 1.35 0.37 − 0.98 0.70 1.21 0.13 − 1.08 0.69
At3g28210 Zinc fi nger protein, putative 1.05 0.37 − 0.68 0.62 0.77 0.21 − 0.57 0.61
At5g56010 Heat shock protein 81-3 1.18 0.89 − 0.29 0.13 1.04 0.73 − 0.30 0.14
At4g32060 Calcium-binding EF hand family protein 0.39 0.71 0.32 0.01 0.40 0.57 0.17 0.06
At5g63570 Glutamate-1-semialdehyde 2,1-aminomutase 1.35 − 0.35 − 1.70 0.02 1.00 − 0.49 − 1.48 0.00
At5g26710 Glutamate-tRNA ligase, putative 1.23 0.48 − 0.75 0.04 1.15 0.29 − 0.85 − 0.01
At1g06760 Histone H1, putative 0.96 1.15 0.19 − 0.01 0.97 1.01 0.03 − 0.01
At1g07320 Ribosomal protein L4 1.26 − 0.35 − 1.61 0.01 1.04 − 0.46 − 1.51 − 0.02
At2g28390 SAND family protein 1.11 0.34 − 0.77 0.00 1.05 0.14 − 0.91 − 0.02
At2g18050 Histone H1-3 (HIS1-3) 0.68 0.82 0.15 0.02 0.63 0.44 − 0.19 − 0.04
At3g18780 Actin 2 (ACT2) 1.05 − 0.57 − 1.62 0.92 − 0.59 − 1.52
At4g14560 Indole-3-acetic acid inducible (IAA1) 0.62 1.00 0.37 − 0.13 0.61 0.68 0.07 − 0.05
AGI code Description Microarray QRT-PCR
Log 10 PS 0 Log 10 PS 200 ∆ PS SS Log 10 PS 0 Log 10 PS 200 ∆ PS SS
At3g62260 Protein phosphatase, putative 0.71 0.51 − 0.20 0.76 0.58 − 0.18
At3g28210 Zinc fi nger protein, putative 0.94 0.70 − 0.24 0.77 0.80 0.03
At5g56010 Heat shock protein 81-3 1.24 1.19 − 0.05 1.12 0.91 − 0.21
At5g63570 Glutamate-1-semialdehyde 2,1-aminomutase 1.30 0.44 − 0.86 1.16 0.20 − 0.96
At1g06760 Histone H1, putative 1.01 1.05 0.04 0.99 0.80 − 0.19
At1g07320 Ribosomal protein L4 1.13 0.42 − 0.70 1.18 0.27 − 0.91
At2g28390 SAND family protein 1.11 0.53 − 0.58 0.89 0.59 − 0.29
At4g14560 Indole-3-acetic acid inducible (IAA1) 0.60 0.93 0.33 0.69 0.91 0.22
The table summarizes the results shown in Fig. 3B and Supplementary Fig. S2 with AGI codes and their description.
Changes in polysome association of mRNAs encoding proteins with different biological functions in response to HS or SS To gain insights into the roles of translational control in plant responses to HS and SS, we searched for groups of genes encoding proteins with similar biological functions (functional categories) that demonstrate a coordinated change in transla-tion state in response to HS or SS by the use of Wilcoxon’s P -value. Wilcoxon’s P -value gives the probability of whether the response (or the distribution of indicators) of the genes in a given group is signifi cantly different from that of other genes in the whole genome set. The genes represented with ∆ PS HS and ∆ PS SS values (Supplementary Table S4) in our microarray data set were classifi ed into > 1,000 functional categories based on a plant-specifi c ontology developed in MapMan
( Thimm et al. 2004 , Usadel et al. 2005 ), and Wilcoxon’s P -values were calculated for individual categories using the PageMan ( Usadel et al. 2006 ; http://mapman.mpimp-golm.mpg.de/pageman ) and the MapMan applications ( Thimm et al. 2004 , Usadel et al. 2005 ; http://gabi.rzpd.de/projects/MapMan ). The results of the Wilcoxon test are summarized in Supplementary Table S5. Supplementary Fig. S4 provides a visualization of the Wilcoxon’s P -values for functional categories on a false color scale. We found that the distributions of ∆ PS HS and ∆ PS SS values of 16 and 39 functional categories, respectively, were biased in the positive direction compared with all other genes, indicating that those functional categories are recalcitrant to global translational repression upon HS and SS. The recalcitrant functional categories included, for example, those related to biotic stress, glutathione S -transferase, transcriptional regulation,
453
Translational response to heat and salt stress
Plant Cell Physiol. 51(3): 448–462 (2010) doi:10.1093/pcp/pcq010 © The Author 2010.
Dow
nloaded from https://academ
ic.oup.com/pcp/article/51/3/448/1895718 by guest on 29 January 2022

chromatin structure, protein degradation and receptor kinases. In addition, there were 29 and 94 functional categories whose distributions of ∆ PS HS and ∆ PS SS values, respectively, were biased in the negative direction compared with all other genes, indicating that those functional categories are hypersensitive to translational repression under HS and SS. The hypersensitive functional categories included, for example, those related to photosynthesis, amino acid and nucleotide metabolism, and protein synthesis and ribosomal proteins. These results underscore that HS- or SS-induced alterations in polysome association lead to differential regulation of specifi c biological functions, which might contribute to the cellular abiotic stress response.
We also subjected the log 10 ES HS or log 10 ES SS values in our microarray data set to functional categorization and Wilcoxon’s test, and found that the direct comparison of P -values of each functional category for ∆ PS HS and log 10 ES HS or ∆ PS SS and log 10 ES SS showed no simple correlation (Supple-mentary Fig. S5). These results suggest that differentially regulated functional categories at the translational level are not simply similar to those at the total cellular mRNA level, implying unique roles for translational control compared with
transcriptional control in gene expression regulation during abiotic stress responses.
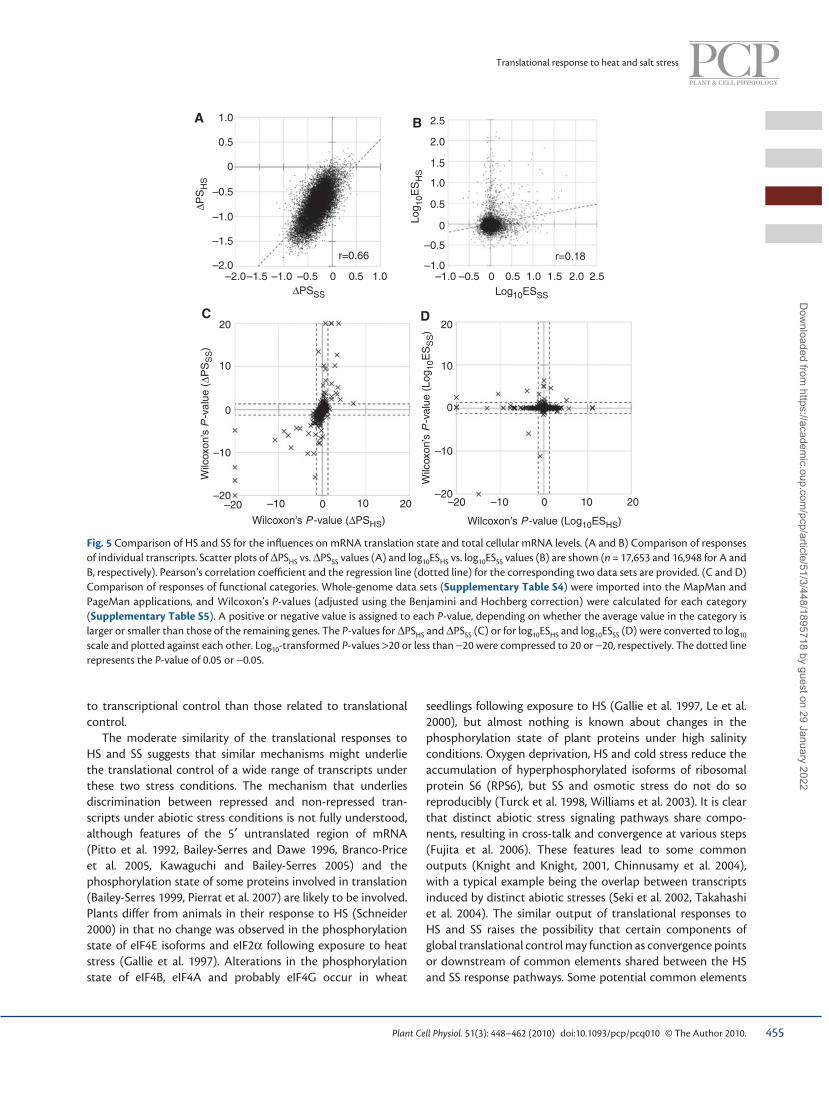
Comparison of changes in translation state in response to HS and SS at the level of individual transcripts We next compared the changes in translation state imposed by HS and SS (i.e. ∆ PS HS and ∆ PS SS ) at the levels of individual transcripts, which demonstrated that the two indicators showed a relatively high correlation ( r = 0.66) ( Fig. 5A ), despite the difference in intensity of each treatment and types of treatments. This observation implies that the translational responses of individual transcripts to two distinct forms of stress are globally similar. The similarity of translational control between HS and SS contrasts with our earlier measurements of total cellular mRNA levels, where there was no such correlation. Log 10 ES HS plotted against log 10 ES SS showed a much lower correlation ( r = 0.18) of the two indicators ( Fig. 5B ), compared with ∆ PS HS and ∆ PS SS . Consistent with this lower correlation, out of 209 HS-inducible and 225 SS-inducible transcripts, only about 10 % ( n = 22) overlapped (Supplementary Table S3). This difference might refl ect greater diversity of factors related
1.0
1.0
1.0
0.5
0.5
0.5
–0.5
–0.5
–0.5
–1.0
–1.0
–1.0–2.0
–2.0
2.0 2.5
–1.5
–1.5
1.5
0
0
0
Log10ESHS
DPS
HS
DPSHS
1.00.5–0.5–1.0–2.0 –1.5 0DPSSS
1.0
1.0
0.5
0.5
–0.5
–0.5
–1.0
–1.0–2.0
2.0 2.5
–1.5
1.5
0
0Log10ESss
DPS
ss
Rel
ativ
e fr
eque
ncy
(%)
Rel
ativ
e fr
eque
ncy
(%)20
15
5
0
10
30
25
20
15
5
0
10
A B
C D
Fig. 4 Connection of the changes in translation state and mRNA abundance in response to HS or SS. (A and B) Scatter plots of ∆ PS HS vs. log 10 ES HS values (A) and ∆ PS SS vs. log 10 ES SS values (B) of individual genes in the whole genome data sets are shown ( n = 17,093 and 17,138 for A and B, respectively). (C and D) Relative frequency histograms of ∆ PS HS (C) or ∆ PS SS (D) values of transcripts whose total cellular mRNA levels increased by > 3-fold in response to HS (C; n = 175) or SS (D; n = 165) (fi lled square with a dotted line in black), compared with those of all the other transcripts ( n = 16,918 and 16,973 for C and D, respectively) (fi lled circle with a solid line in gray). The lists of HS- and SS-inducible transcripts are shown in Supplementary Table S3.
454
H. Matsuura et al.
Plant Cell Physiol. 51(3): 448–462 (2010) doi:10.1093/pcp/pcq010 © The Author 2010.
Dow
nloaded from https://academ
ic.oup.com/pcp/article/51/3/448/1895718 by guest on 29 January 2022
to transcriptional control than those related to translational control.
The moderate similarity of the translational responses to HS and SS suggests that similar mechanisms might underlie the translational control of a wide range of transcripts under these two stress conditions. The mechanism that underlies discrimination between repressed and non-repressed tran-scripts under abiotic stress conditions is not fully understood, although features of the 5 ′ untranslated region of mRNA ( Pitto et al. 1992 , Bailey-Serres and Dawe 1996 , Branco-Price et al. 2005 , Kawaguchi and Bailey-Serres 2005 ) and the phosphorylation state of some proteins involved in translation ( Bailey-Serres 1999 , Pierrat et al. 2007 ) are likely to be involved. Plants differ from animals in their response to HS ( Schneider 2000 ) in that no change was observed in the phosphorylation state of eIF4E isoforms and eIF2 α following exposure to heat stress ( Gallie et al. 1997 ). Alterations in the phosphorylation state of eIF4B, eIF4A and probably eIF4G occur in wheat
seedlings following exposure to HS ( Gallie et al. 1997 , Le et al. 2000 ), but almost nothing is known about changes in the phosphorylation state of plant proteins under high salinity conditions. Oxygen deprivation, HS and cold stress reduce the accumulation of hyperphosphorylated isoforms of ribosomal protein S6 (RPS6), but SS and osmotic stress do not do so reproducibly ( Turck et al. 1998 , Williams et al. 2003 ). It is clear that distinct abiotic stress signaling pathways share compo-nents, resulting in cross-talk and convergence at various steps ( Fujita et al. 2006 ). These features lead to some common outputs ( Knight and Knight, 2001 , Chinnusamy et al. 2004 ), with a typical example being the overlap between transcripts induced by distinct abiotic stresses ( Seki et al. 2002 , Takahashi et al. 2004 ). The similar output of translational responses to HS and SS raises the possibility that certain components of global translational control may function as convergence points or downstream of common elements shared between the HS and SS response pathways. Some potential common elements
1.0
1.0
0
0
0.5
0.5
–0.5
–0.5
–1.0
–1.0–2.0
–2.0
–1.5
–1.5
DPS
HS
Log 1
0ES
HS
Log10ESSSDPSSS
r=0.66
2.5
2.5
2.0
2.0
1.5
1.5
1.0
1.0
0.5
0.5
–0.5
–0.5–1.0
–1.0
0
0
r=0.18
20 20
2020
10 10
1010
–10 –10
–10 –10–20 –20
–20 –20
0 0
0 0
Wilc
oxon
’s P
-val
ue (
DPS
SS)
Wilc
oxon
’s P
-val
ue (
Log 1
0ES
SS)
Wilcoxon’s P -value (DPSHS) Wilcoxon’s P -value (Log10ESHS)
A B
C D
Fig. 5 Comparison of HS and SS for the infl uences on mRNA translation state and total cellular mRNA levels. (A and B) Comparison of responses of individual transcripts. Scatter plots of ∆ PS HS vs. ∆ PS SS values (A) and log 10 ES HS vs. log 10 ES SS values (B) are shown ( n = 17,653 and 16,948 for A and B, respectively). Pearson’s correlation coeffi cient and the regression line (dotted line) for the corresponding two data sets are provided. (C and D) Comparison of responses of functional categories. Whole-genome data sets (Supplementary Table S4) were imported into the MapMan and PageMan applications, and Wilcoxon’s P -values (adjusted using the Benjamini and Hochberg correction) were calculated for each category (Supplementary Table S5). A positive or negative value is assigned to each P -value, depending on whether the average value in the category is larger or smaller than those of the remaining genes. The P -values for ∆ PS HS and ∆ PS SS (C) or for log 10 ES HS and log 10 ES SS (D) were converted to log 10 scale and plotted against each other. Log 10 -transformed P -values > 20 or less than − 20 were compressed to 20 or − 20, respectively. The dotted line represents the P -value of 0.05 or − 0.05.
455
Translational response to heat and salt stress
Plant Cell Physiol. 51(3): 448–462 (2010) doi:10.1093/pcp/pcq010 © The Author 2010.
Dow
nloaded from https://academ
ic.oup.com/pcp/article/51/3/448/1895718 by guest on 29 January 2022

are reactive oxygen species, hormones ( Fujita et al. 2006 ) or energy signals regulated by energy sensor protein kinases ( Baena-González et al. 2007 ), which are known to be induced by various abiotic stresses ( Fujita et al. 2006 , Baena-González and Sheen 2008 ). In contrast, reasons for similar, but not identical, changes in polysome association of individual transcripts in response to HS and SS are expected to be multifarious. Differences might be attributed to distinctions in intensity of each treatment. Additionally, distinctions in translation factors and/or RNA-binding proteins engaged in translational control and in modifi cations of those factors and/or proteins might contribute to the differences in responses to HS and SS. For example, the modifi cations of RPS6 are known to be different in plants under HS and SS conditions ( Turck et al. 1998 , Williams et al. 2003 ).
Comparison of changes in translation state in response to HS and SS at the level of functional categories We also compared the changes in translation state imposed by HS and SS at the level of functional categories. Wilcoxon’s P -values with Benjamini and Hochberg correction for each functional category for ∆ PS HS and ∆ PS SS (summarized in Supplementary Table S5) were directly compared ( Fig. 5C ). These comparisons showed that more functional categories
are likely to show similar translational responses to HS and SS ( Fig. 5C ; also see Table 2 ) compared with responses at the level of total cellular mRNA abundance ( Fig. 5D and Supple-mentary Table S6). These results imply that translational control might play a more general (less stress-specifi c) role which is common to responses to HS and SS, compared with the control at the total cellular mRNA levels.
We found 13 functional categories to be recalcitrant to global translational repression upon both HS and SS, and those related to stress, chromatin (histone), transcriptional regulation, and protein degradation via ubiquitin E3 were among these categories ( Table 2 ). Because damaged proteins are toxic to cells, regulation of protein degradation is suggested to play an important role in the survival of cells under abiotic stress including HS and SS ( Sahi et al. 2006 , Huang and Xu 2008 ). For example, decreased 26S proteasome accumulation is hypersensitive to HS, which causes protein misfolding ( Kurepa et al. 2008 ). When Wilcoxon tests were conducted on the genome-wide analyses of translational control in Arabidopsis leaves exposed to 12 h of dehydration stress in a previous report ( Kawaguchi and Bailey-Serres 2005 ) (Supplemenatray Table S7), we found nine functional categories to be recalcitrant to global translational repression (Supplementary Fig. S6). Interestingly, the functional groups for transcriptional regulation and protein degradation via ubiquitin
Table 2 Recalcitrant or hypersensitive functional categories
BIN name (BIN code) P -values
∆ PS HS ∆ PS SS DRL a
Photosynthesis (PS) PS (1) 8.3E-04 2.6E-06 –
PS.calvin cyle (1.3) 9.0E-06 3.7E-05 –
Cell wall cell wall.precursor synthesis (10.1) 8.5E-03 1.4E-03 –
Lipid metabolism lipid metabolism.‘exotics’ (steroids, squalene etc) (11.8) 2.5E-02 7.6E-04 –
lipid metabolism.‘exotics’ (steroids, squalene etc).sphingolipids (11.8.1) 7.0E-03 2.6E-02 –
Amino acid metabolism amino acid metabolism (13) 2.5E-02 2.0E-16 –
amino acid metabolism.synthesis (13.1) 1.2E-02 5.5E-11 –
Stress stress (20) 3.5E-04 2.9E-04 –
stress.biotic (20.1) 7.1E-05 5.0E-03 –
stress.biotic.PR-proteins (20.1.7) 7.5E-04 1.5E-04 –
Nucleotide metabolism nucleotide metabolism (23) 3.1E-02 1.4E-06 3.1E-02
nucleotide metabolism.phosphotransfer and pyrophosphatases (23.4) 1.5E-02 6.4E-04 –
Miscellaneous misc.misc2 (26.1) 4.0E-02 7.2E-04 –
RNA RNA (27) – 6.5E-11 4.0E-03
RNA.regulation of transcription (27.3) – 0.0E + 00 7.4E-06
RNA.regulation of transcription.AP2/EREBP, APETALA2/Ethylene-responsive element binding protein family (27.3.3)
7.0E-03 9.3E-07 –
RNA.regulation of transcription.MYB domain transcription factor family (27.3.25) 2.5E-04 7.3E-06 –
DNA DNA.synthesis/chromatin structure (28.1) 7.0E-03 9.7E-04 –
DNA.synthesis/chromatin structure.histone (28.1.3) 7.9E-08 4.4E-02 –
Continued
456
H. Matsuura et al.
Plant Cell Physiol. 51(3): 448–462 (2010) doi:10.1093/pcp/pcq010 © The Author 2010.
Dow
nloaded from https://academ
ic.oup.com/pcp/article/51/3/448/1895718 by guest on 29 January 2022

E3 were among the nine categories ( Table 2 ), suggesting that these two categories might be recalcitrant to translational repression independent of plant material, methodology, and type and duration of stress treatment, and hence may be crucial general processes in abiotic stress response. Some recal-citrant functional categories common to both HS and SS, such as those related to histone and 60S ribosomal protein subunit L41 ( Table 2 ), might provide insight into the impor-tance of regulation of those functions in plant stress responses, and therefore merit further investigation. We also found some functional categories to be recalcitrant to repression in a stress-specifi c manner. The functional category related to phospholi-pase D, which is involved in the salicylic acid-mediated signaling pathway under HS response in Arabidopsis ( Larkindale et al. 2005 , Krinke et al. 2009 ), was found to be recalcitrant to repression in response to HS (Supplementary Fig. S4). We also
found the functional categories related to receptor kinase to be recalcitrant to repression in response to SS (Supplementary Fig. S4). A recent study demonstrated that a leucine-rich repeat receptor-like kinase plays a role in mediating early events in the response of Medicargo truncatula to salt stress ( de Lorenzo et al. 2009 ). In addition, a few reports suggest potential roles of receptor kinases in abiotic stress responses in Arabidopsis ( Hong et al. 1997 , Osakabe et al. 2005 ).
Twenty-four functional categories were found to be hyper-sensitive to global translational repression under both HS and SS conditions ( Table 2 ). When functional categories hypersensitive to translational repression were compared among different microarray data sets, those related to protein synthesis, especially ribosomal proteins, were commonly identifi ed for all of the microarray data sets analyzed [i.e. dehydration stress reported by Kawaguchi and Bailey-Serres (2005) , HS and SS] ( Table 2 ).
Table 2 Continued
BIN name (BIN code) P -values
∆ PS HS ∆ PS SS DRL a
Protein protein (29) 1.7E-09 8.5E-06 1.2E-06
protein.synthesis (29.2) 4.7E-33 3.1E-17 4.9E-62
protein.synthesis.ribosomal protein (29.2.1) 5.8E-42 1.5E-21 3.6E-66
protein.synthesis.ribosomal protein.prokaryotic (29.2.1.1) 1.5E-11 7.8E-08 5.9E-09
protein.synthesis.ribosomal protein.prokaryotic.chloroplast (29.2.1.1.1) 1.8E-08 9.3E-07 1.8E-07
protein.synthesis.ribosomal protein.prokaryotic.chloroplast.50S subunit (29.2.1.1.1.2) 1.3E-06 4.3E-05 6.5E-06
protein.synthesis.ribosomal protein.prokaryotic.unknown organellar (29.2.1.1.3) 1.2E-02 5.0E-02 –
protein.synthesis.ribosomal protein.eukaryotic (29.2.1.2) 9.8E-31 3.6E-14 2.4E-59
protein.synthesis.ribosomal protein.eukaryotic.40S subunit (29.2.1.2.1) 7.9E-08 1.3E-09 7.5E-20
protein.synthesis.ribosomal protein.eukaryotic.60S subunit (29.2.1.2.2) 1.1E-22 1.4E-05 1.3E-38
protein.synthesis.ribosomal protein.eukaryotic.60S subunit.L41 (29.2.1.2.2.41) 7.0E-03 3.6E-03 –
protein.synthesis.elongation (29.2.4) 9.1E-03 8.1E-03 –
protein.degradation (29.5) – 8.9E-03 8.6E-04
protein.degradation.ubiquitin.E3 (29.5.11.4) 8.5E-03 0.0E + 00 5.6E-04
protein.degradation.ubiquitin.E3.RING (29.5.11.4.2) – 2.3E-06 1.6E-03
protein.degradation.ubiquitin.E3.SCF (29.5.11.4.3) 1.2E-03 6.5E-11 –
protein.degradation.ubiquitin.E3.SCF.FBOX (29.5.11.4.3.2) 3.7E-04 2.2E-13 –
Signaling signalling.receptor kinases (30.2) – 3.7E-10 3.1E-02
Transport transport (34) 5.0E-04 5.5E-11 –
transport.p- and v-ATPases (34.1) 2.3E-02 1.7E-02 3.1E-02
transport.p- and v-ATPases.H + -transporting two-sector ATPase (34.1.1) 3.9E-02 – 3.1E-02
transport.metabolite transporters at the mitochondrial membrane (34.9) 2.4E-03 1.8E-04 –
Not assigned not assigned (35) 7.0E-03 0.0E + 00 –
not assigned.unknown (35.2) 1.7E-04 0.0E + 00 –
Wilcoxon’s P -value gives the probability of whether the average value of each indicator among genes in a functional group is signifi cantly higher (blue) or lower (pink) than the average values of all other genes in the whole genome set. Functional categories which are found to be recalcitrant or hypersensitive to at least two different stresses analyzed are given with their BIN names and BIN codes by collapsing non-signifi cant categories. The complete analyses are displayed in Supplementary Figs. S4 and S6. PS, photosynthesis; PR-proteins, pathogenesis-related proteins; misc, miscellaneous; SCF, Skp1-Cul1-F-box-protein. a Microarray data sets reported by Kawaguchi and Bailey-Serres (2005) were used ( http://bioinfo.ucr.edu/projects/arab_ribosome/search.php ).
457
Translational response to heat and salt stress
Plant Cell Physiol. 51(3): 448–462 (2010) doi:10.1093/pcp/pcq010 © The Author 2010.
Dow
nloaded from https://academ
ic.oup.com/pcp/article/51/3/448/1895718 by guest on 29 January 2022

A signifi cant decrease in polysome association of mRNAs encoding ribosomal proteins was observed in Arabidopsis in response to mild dehydration, oxygen deprivation and sucrose starvation ( Kawaguchi et al. 2004 , Branco-Price et al. 2005 , Kawaguchi and Bailey-Serres 2005 , Nicolai et al. 2006 , Branco-Price et al. 2008 ). Because protein synthesis is one of the most energetically costly processes, this is consistent with the view that global translational repression, especially the repression of ribosome biogenesis, is an important mechanism of energy conservation under adverse conditions ( Proud 2007 , Branco-Price et al. 2008 ). On the other hand, HS and/or SS induces the hypersensitive response for other functional categories, such as those related to photosynthesis, the Calvin cycle, the cell wall, lipid metabolism, amino acid metabolism, nucleotide metabolism, and p- and v-ATPase (Supplementary Fig. S4), suggesting that intense repression of translation of some transcripts may have consequences beyond energy conservation on plants undergoing abiotic stress.
Conclusion The present study highlights the signifi cant contribution and fundamental roles of translational control in plant abiotic stress responses. In addition to contributing to energy conservation, the dynamic, selective translation and repression of translation of specifi c subsets of transcripts is likely to infl uence multiple aspects of gene expression during stress responses in a different manner from transcriptional control. Further characterization of translational control, such as how the 5 ′ untranslated region determines selection or which protein factors are involved in the translational response of an mRNA to abiotic stresses, could provide a wealth of information to aid in elucidating complex gene regulatory networks in the plant stress response, and may contribute to the development of novel strategies to improve plant stress tolerance via genetic manipulation.
Materials and Methods
Plant material, culture conditions and stress treatments Aradidopsis thaliana suspension cell strain T87 ( Axelos et al. 1992 ) was cultured in modifi ed LS medium ( Nagata et al. 1992 ) with constant agitation at 120 r.p.m. at 22 ° C under a 16 h light/8 h dark photoperiod. Stress-treated and respective control cells were prepared from the same batch of 3- or 4-day-old cultured cells. Cultured cells were incubated for 10 min in a water bath set at 37 ° C for HS treatment or at 22 ° C for the control treat-ment, or treated with 200 mM NaCl by adding 5 M NaCl at 1 : 25 dilution to the culture medium for SS treatment. An equivalent volume of water was added for the control treatment for SS treatment. SS-treated and corresponding control cells were incubated at 22 ° C for 10 min and washed with 180 mM mannitol solution that was iso-osmotic relative to the culture medium ( Nakayama et al. 2000 ). At least two independent biological replicate samples were used for individual analyses.
Polysome fractionation assay Polysomes were fractionated by sucrose density gradient centrifugation as described previously ( Davies and Abe 1995 ) with minor modifi cations. Approximately 0.3 g of stress-treated or corresponding control cells were harvested by suction fi ltration and pulverized in liquid nitrogen with a mortar and pestle. The resulting frozen powder was homogenized in 1.5 ml of buffer U (200 mM Tris–HCl, pH 8.5, 50 mM KCl, 25 mM MgCl 2 , 2 mM EGTA, 100 µg ml − 1 heparin, 2 % polyoxyethylene 10-tridecyl ether and 1 % sodium deoxycholate) and centri-fuged at 15,000 × g for 10 min at 4 ° C. Aliquots of supernatant were layered on 4.6 ml of a 15–60 % sucrose density gradient in buffer B (50 mM Tris–HCl, pH 8.5, 25 mM KCl and 10 mM MgCl 2 ) and centrifuged at 55,000 r.p.m. for 50 min at 4 ° C in an SW55 rotor (Beckman Coulter, Fullerton, CA, USA). The gradient was collected from the bottom using a peristaltic pump with simultaneous recording of absorbance profi les at 254 nm using a UV monitor (Monitor UV-1; GE Healthcare, Buckinghamshire, UK).
In vivo metabolic labeling Suspension-cultured cells (approximately 220 µg FW ml − 1 ) were labeled with [ 35 S]methionine at a fi nal concentration of 62.5 nCi µl − 1 for 15 or 50 min after treating the cells with heat (37 ° C), salt (200 mM NaCl) or the respective control treatments for 10 min. Cycloheximide (CHX) was added to the culture medium at a fi nal concentration of 50 µg ml − 1 to stop further protein synthesis, and cells were washed three times with culture medium containing 50 µg ml − 1 CHX. Collected cells were frozen in liquid nitrogen and lysed, using sea sand (Nakarai Tesque, Kyoto, Japan) and a plastic pestle, in a solution containing 0.1 M Tris–HCl (pH 8.0), 0.1 M NaCl, 5 mM EDTA, 10 mM β -mercaptoethanol and 2.5 mM phenylmethylsulfonyl fl uoride. After removing cell debris by centrifugation, the supernatant was mixed with SDS sample buffer and boiled. The radioactivity in each supernatant was counted with a LS6500 liquid scintillation counter (Beckman Coulter), and an aliquot of extracts containing equal radioactivity was subjected to 15 % SDS–PAGE. Vacuum-dried gels were autora-diographed and 35 S-labeled proteins were detected with a BAS-2500 Bio-Imaging analyzer (Fujifi lm, Tokyo, Japan).
RNA isolation from sucrose gradients For qRT-PCR analysis, cell lysate separated through a 15–60 % sucrose density gradient was fractionated into eight fractions of approximately 650 µl each. Guanidine hydrochloride at a fi nal concentration of 5.5 M, together with 5 ng of in vitro synthesized capped, polyadenylated Renilla luciferase ( r-luc ) mRNA ( Matsuura et al. 2008 ), was preliminarily added to each collection tube. The r-luc mRNA was used as an external control to correct for varying effi ciencies of subsequent RNA isolation and RT-PCR processes. RNA was precipitated from each fraction by the addition of an equal volume of ethanol, overnight incubation at − 20 ° C and centrifugation
458
H. Matsuura et al.
Plant Cell Physiol. 51(3): 448–462 (2010) doi:10.1093/pcp/pcq010 © The Author 2010.
Dow
nloaded from https://academ
ic.oup.com/pcp/article/51/3/448/1895718 by guest on 29 January 2022

at 10,000 r.p.m. for 45 min in a JA-20 rotor (Beckman Coulter). The resulting precipitate was washed with 80 % ethanol. Subsequent RNA purifi cation was performed using an RNeasy kit (Qiagen, Hilden, Germany) with on-column DNase I treat-ment according to the manufacturer’s instructions. RNA was eluted by 30–50 µl of RNase-free water. Equal volumes of RNA solution from each fraction were subjected to qRT-PCR analysis.
For microarray analysis, RNA was isolated from sucrose gradients as described above for qRT-PCR analysis with some modifi cation. First, fractions 1–3 (polysome fraction) and 5–7 (non-polysome fraction) out of eight fractions were individu-ally collected and pooled into tubes containing guanidine hydrochloride (fi nal concentration, 5.5 M) (direction of sedi-mentation is from fraction 8 to fraction 1). For external con-trols, equal volumes (2–5 µl) of Spike A and Spike B Mix (Two-Color RNA Spike-In Kit; Agilent Technologies, Palo Alto, CA, USA) were added to polysome and non-polysome frac-tions, respectively, concomitantly with the collection of the sucrose gradient. Each spike-in mixture contains 10 in vitro syn-thesized, polyadenylated transcripts at various pre-determined ratios. These transcripts are derived from the adenovirus E1A transcriptome and are represented by corresponding spots on the Agilent oligoarray used in this study. Eluted RNA solution from RNeasy mini spin columns was further subjected to LiCl precipitation by the addition of LiCl at a fi nal concentration of 1.5 M, followed by centrifugation. After ethanol precipitation, the RNA pellet was resuspended in RNase-free water. RNA integrity was examined with an Agilent Bioanalyzer 2100 (Agilent Technologies).
Isolation of total RNA Approximately 0.1 g of cultured cells was harvested and pulverized as described above for the polysome fractionation assay. First, total RNA was isolated from the resulting frozen powder using TRIzol Reagent (Invitrogen, Carlsbad, CA, USA) followed by RNeasy mini spin columns (Qiagen) with on-column DNase I treatment. The reagents and kit were used according to the manufacturer’s instructions. RNA integrity was examined with an Agilent Bioanalyzer 2100 (Agilent Technologies).
qRT-PCR analysis qRT-PCR analysis was performed as described previously ( Matsuura et al. 2008 ). Briefl y, cDNAs were synthesized at a 20 µl reaction scale with equal volumes of RNA solution (typically 1–2 µl) from each gradient fraction or 1 µg of total RNA using a Transcriptor First Strand cDNA Synthesis Kit (Roche Applied Science, Mannheim, Germany) with anchored oligo(dT) 18 primers. PCR was performed using 1 µl of a 1 : 10 dilution of fi rst-strand cDNA, LightCycler 480 SYBR Green I Master (Roche Applied Science) and gene-specifi c primer sets (Supplementary Table S8) in a LightCycler 480 (Roche Applied Science). Melting curve analysis was carried out for each primer set to verify the presence of a single melting peak
after amplifi cation. ‘No cDNA’ samples (water) and ‘no RT’ samples were included as negative controls.
DNA oligonucleotide microarray hybridization and scanning Fluorescent cRNA was generated from polysomal and non-polysomal RNA or total RNAs from stress-treated and control cells using a Low RNA Input Fluorescent Linear Amplifi cation Kit (Agilent Technologies). A 500 ng aliquot of RNA was sub-jected to reverse transcription using MMLV reverse tran-scriptase and an oligo(dT) primer containing the T7 promoter, and subsequently in vitro transcribed using T7 RNA polymerase, resulting in Cy3-labeled and Cy5-labeled cRNAs. The cRNA was purifi ed using RNeasy mini spin columns (Qiagen). Polysomal RNAs and total RNAs derived from stress-treated cells were labeled with Cy3, and non-polysomal RNAs and total RNAs derived from the control cells were labeled with Cy5. Mixtures of 0.85 µg of Cy3-labeled and Cy5-labeled cRNAs (either polysomal and non-polysomal RNAs derived from an identical cell lysate or total RNAs from stress-treated and corresponding control cells) were co-hybridized at 65 ° C for 17 h on an Agilent Technologies 4 × 44K Arabidopsis 3 60mer oligo microarray. The slide was washed and scanned with an Agilent G2505 Scanner (Agilent Technologies) at a pixel resolution size of 5 µm to detect fl uorescence intensity. Hybridizations were performed using two independent biological replicate samples.
Microarray data analysis The fl uorescent intensity of individual features (spots) on scanned images was quantifi ed and corrected for background signal using Feature Extraction software (Agilent Technologies). To analyze only microarray data of high quality, we evaluated the reproducibility of the microarray analyses according to the manufacturer’s publication ( http://www.chem.agilent.com/Library/technicaloverviews/Public/5988-8611EN.pdf ), and only features that passed three criteria were used for further analysis. Features fl agged in Feature Extraction software as non-uniform (IsFeatNonUnifOL and IsFeatPopnOL fi eld), satu-rated (IsSaturated fi eld) or low signal (IsWellAboveBG fi eld) in either of the two biological replicates were omitted. Total RNA profi ling data were normalized using a Linear and LOWESS method, which is the default method for normalizing Agilent microarrays. This method performs a linear normalization, and then applies a non-linear LOWESS normalization to remove potential dye bias. Polysomal RNA profi ling data were normal-ized via a Linear and LOWESS method followed by spike-in normalization utilizing a Two-Color RNA Spike-In Kit (Agilent Technologies). As described above, since 10 in vitro synthesized E1A transcripts were added to each fraction in various pre-determined ratios concomitantly with the collection of a sucrose gradient, their signal ratios between two fractions can be used to monitor variation in preparation steps such as RNA isolation, reverse transcription, sample amplifi cation, dye labeling or hybridization. High correlations of observed and
459
Translational response to heat and salt stress
Plant Cell Physiol. 51(3): 448–462 (2010) doi:10.1093/pcp/pcq010 © The Author 2010.
Dow
nloaded from https://academ
ic.oup.com/pcp/article/51/3/448/1895718 by guest on 29 January 2022

expected log ratios for these spike-in RNAs were observed for all microarray analyses (data not shown). Out of 10 spike-in RNAs, two (E1A_r60_1 and E1A_r60_a20 RNAs, whose expected ratios are 1 : 1) were used for spike-in normalization. Thirty-two spots are spotted on the microarray for each spike-in RNA. For total RNA profi ling, the ratio of the intensity value in the stress sample (Cy3) over that in the control sample (Cy5) was calculated for features that passed the above criteria: this was defi ned as the expression score (ES). For polysomal RNA profi ling, the ratio of the intensity value in the polysomal RNA sample (Cy3) over that in the non-polysomal RNA sample (Cy5) was calculated, and defi ned as the translation state or polysome score (PS). The average of log 10 -transformed (Cy3/Cy5) values was calculated for genes mapped on more than two features on an array, and then for the two biological replicates.
Functional classifi cation and statistical signifi cance test Our microarray data sets and those provided by Kawaguchi and Bailey-Serres (2005) ( http://bioinfo.ucr.edu/projects/arab_ribosome/search.php ) were imported into PageMan (version 0.12) ( Usadel et al. 2006 , http://mapman.mpimp-golm.mpg.de/pageman ) or MapMan (version 2.2.0) software ( Thimm et al. 2004 , Usadel et al. 2005 , http://gabi.rzpd.de/projects/MapMan /), and Wilcoxon’s P -values with Benjamini and Hochberg correc-tion and average data values of genes in individual functional categories or BINS were calculated. The results of Wilcoxon tests were visualized using the PageMan application. ‘Ath_AGI_TAIR8’ was used as a mapping fi le ( http://gabi.rzpd.de/database/java-bin/MappingDownloader ) for MapMan and PageMan analyses. Only genes having no identical locus AGI (Arabidopsis Genome Initiative) codes on the microarray were subjected to assignment procedures in microarray data sets.
Accession numbers Microarray data sets are available on the public CIBEX database (Center for Information Biology gene EXpression database) in the DDBJ (DNA Data Bank of Japan) with accession number CBX69 ( http://cibex.nig.ac.jp/index.jsp ).
Supplementary data
Supplementary data are available at PCP online.
Funding
This work was supported by the New Energy and Industrial Technology Development Organization (NEDO) [the Green Biotechnology Program]; Ministry of Education, Culture, Sports, Science and Technology (MEXT), Japan; Global COE Program at NAIST [Frontier Biosciences: Strategies for Survival and Adaptation in a Changing Global Environment].
Acknowledgments
We would like to thank H. Maeda, Y. Kodama, A. Nakagawa and K. Harada for critical reading of the manuscript. We would also acknowledge the RIKEN Plant Cell Bank (Tsukuba, Japan) for providing the Arabidopsis suspension cell strain T87. We thank Björn Usadel at Max Planck Institute of Molecular Plant Physiology for providing the mapping fi le for Mapman and Pageman analyses.
References
Axelos , M. , Curie , C. , Mazzolini , L. , Bardet , C. and Lescure , B. ( 1992 ) A protocol for transient gene expression in Arabidopsis thaliana protoplasts isolated from cell suspension cultures . Plant Physiol.
Biochem. 30 : 123 – 128 . Baena-González , E. , Rolland , F. , Thevelein , J.M. and Sheen , J. ( 2007 )
A central integrator of transcription networks in plant stress and energy signaling . Nature 448 : 938 – 942 .
Baena-González , E. and Sheen , J. ( 2008 ) Convergent energy and stress signaling . Trends Plant Sci. 13 : 474 – 482 .
Bailey-Serres , J. ( 1999 ) Selective translation of cytoplasmic mRNAs in plants . Trends Plant Sci. 4 : 142 – 148 .
Bailey-Serres , J. and Dawe , R.K. ( 1996 ) Both 5 ′ and 3 ′ sequences of maize adh1 mRNA are required for enhanced translation under low-oxygen conditions . Plant Physiol. 112 : 685 – 695 .
Bailey-Serres , J. , Sorenson , R. and Juntawong , P. ( 2009 ) Getting the message across: cytoplasmic ribonucleoprotein complexes . Trends
Plant Sci. 14 : 443 – 453 . Ben-Zioni , A. , Itai , C. and Vaadia , Y. ( 1967 ) Water and salt stresses,
kinetin and protein synthesis in tobacco leaves . Plant Physiol. 42 : 361 – 365 .
Branco-Price , C. , Kaiser , R.A. , Jang , C.J. , Larive C.K. and Bailey-Serres , J. ( 2008 ) Selective mRNA translation coordinates energetic and metabolic adjustments to cellular oxygen deprivation and reoxygenation in Arabidopsis thaliana . Plant J. 56 : 743 – 755 .
Branco-Price , C. , Kawaguchi , R. , Ferreira , R.B. and Bailey-Serres , J. ( 2005 ) Genome-wide analysis of transcript abundance and translation in Arabidopsis seedlings subjected to oxygen deprivation . Ann. Bot.
(Lond) 96 : 647 – 660 . Chen , W. , Provart , N.J. , Glazebrook , J. , Katagiri , F. , Chang , H.S. ,
Eulgem , T. , et al . ( 2002 ) Expression profi le matrix of Arabidopsis transcription factor genes suggests their putative functions in response to environmental stresses . Plant Cell 14 : 559 – 574 .
Chinnusamy , V. , Schumaker , K. and Zhu , J.K. ( 2004 ) Molecular genetic perspectives on cross-talk and specifi city in abiotic stress signaling in plants . J. Exp. Bot. 55 : 225 – 236 .
Davies , E. and Abe , S. ( 1995 ) Methods for isolation and analysis of polyribosomes . Methods Cell Biol. 50 : 209 – 222 .
de Lorenzo , L. , Merchan , F. , Laporte , P. , Thompson , R. , Clarke , J. , Sousa , C. , et al . ( 2009 ) A novel plant leucine-rich repeat receptor kinase regulates the response of Medicago truncatula roots to salt stress . Plant Cell 21 : 668 – 680 .
Fennoy , S.L. , Nong , T. and Bailey-Serres , J. ( 1998 ) Transcriptional and post-transcriptional processes regulate gene expression in oxygen-deprived roots of maize . Plant J. 15 : 727 – 735 .
Fujita , M. , Fujita , Y. , Noutoshi , Y. , Takahashi , F. , Narusaka , Y. , Yamaguchi-Shinozaki , K. , et al . ( 2006 ) Crosstalk between abiotic and biotic stress
460
H. Matsuura et al.
Plant Cell Physiol. 51(3): 448–462 (2010) doi:10.1093/pcp/pcq010 © The Author 2010.
Dow
nloaded from https://academ
ic.oup.com/pcp/article/51/3/448/1895718 by guest on 29 January 2022

responses: a current view from the points of convergence in the stress signaling networks . Curr. Opin. Plant Biol. 9 : 436 – 442 .
Gallie , D.R. , Le , H. , Caldwell , C. , Tanguay , R.L. , Hoang , N.X. and Browning , K.S. ( 1997 ) The phosphorylation state of translation initiation factors is regulated developmentally and following heat shock in wheat . J. Biol. Chem. 272 : 1046 – 1053 .
Hsiao , T.C. ( 1970 ) Rapid changes in levels of polyribosomes in Zea mays in response to water stress . Plant Physiol. 46 : 281 – 285 .
Hong , S.W. , Jon , J.H. , Kwak , J.M. and Nam , H.G. ( 1997 ) Identifi cation of receptor-like protein kinase gene rapidly induced by abscisic acid, dehydration, high salt, and cold treatments in Arabidopsis thaliana . Plant Physiol. 113 : 1203 – 1212 .
Huang , B. and Xu , C. ( 2008 ) Identifi cation and characterization of proteins associated with plant tolerance to heat stress . J. Integr.
Plant Biol. 50 : 1230 – 1237 . Kawaguchi , R. and Bailey-Serres , J. ( 2005 ) mRNA sequence features
that contribute to translational regulation in Arabidopsis . Nucleic
Acids Res. 33 : 955 – 965 . Kawaguchi , R. , Girke , T. , Bray , E.A. and Bailey-Serres , J. ( 2004 ) Differential
mRNA translation contributes to gene regulation under non-stress and dehydration stress conditions in Arabidopsis thaliana . Plant J. 38 : 823 – 839 .
Key , J.L. , Lin , C.Y. and Chen , Y.M. ( 1981 ) Heat shock proteins of higher plants . Proc. Natl Acad. Sci. USA 78 : 3526 – 3530 .
Knight , H. and Knight , M.R. ( 2001 ) Abiotic stress signaling pathways: specifi city and cross-talk . Trends Plant Sci. 6 : 262 – 267 .
Kreps , J.A. , Wu , Y. , Chang , H.S. , Zhu , T. , Wang , X. and Harper , J.F. ( 2002 ) Transcriptome changes for Arabidopsis in response to salt, osmotic, and cold stress . Plant Physiol. 130 : 2129 – 2141 .
Krinke , O. , Flemr , M. , Vergnolle , C. , Collin , S. , Renou , J.P. , Taconnat , L. , et al . ( 2009 ) Phospholipase D activation is an early component of the salicylic acid signaling pathway in Arabidopsis cell suspensions . Plant Physiol. 150 : 424 – 436 .
Kurepa , J. , Toh-E , A. and Smalle , J.A. ( 2008 ) 26S proteasome regulatory particle mutants have increased oxidative stress tolerance . Plant J. 53 : 102 – 114 .
Larkindale , J. , Hall , J.D. , Knight , M.R. and Vierling , E. ( 2005 ) Heat stress phenotypes of Arabidopsis mutants implicate multiple signaling pathways in the acquisition of thermotolerance . Plant Physiol. 138 : 882 – 897 .
Le , H. , Browning , K.S. and Gallie , D.R. ( 2000 ) The phosphorylation state of poly(A)-binding protein specifi es its binding to poly(A) RNA and its interaction with eukaryotic initiation factor (eIF) 4F, eIFiso4F, and eIF4B . J. Biol. Chem. 275 : 17452 – 17462 .
Mathews , M.B. , Sonenberg , N. and Hershey , J.W.B. ( 2007 ) Origins and principles of translational control . In Translational Control in Biology and Medicine . Edited by Mathews , M.B. , Sonenberg , N. and Hershey , J.W.B. pp. 1 – 40 . Cold Spring Harbor Laboratory Press , Cold Spring Harbor, NY .
Matsuura , H. , Shinmyo , A. and Kato , K. ( 2008 ) Preferential translation mediated by Hsp81-3 5 ′ -UTR during heat shock involves ribosome entry at the 5 ′ -end rather than an internal site in Arabidopsis suspension cells . J. Biosci. Bioeng. 105 : 39 – 47 .
Mazzucotelli , E. , Mastrangelo , A.M. , Crosatti , C. , Guerra , D. , Stanca , A.M. and Cattivelli , L. ( 2008 ) Abiotic stress response in plants: when post-transcriptional and post-translational regulations control transcription . Plant Sci. 174 : 420 – 431 .
Melamed , D. and Arava , Y. ( 2007 ) Genome-wide analysis of mRNA polysomal profi les with spotted DNA microarrays . Methods Enzymol. 431 : 177 – 201 .
Nagata , T. , Nemoto , Y. and Hasezawa , S. ( 1992 ) Tobacco BY-2 cell line as the ‘HeLa’ cell in the cell biology of higher plants . Int. Rev. Cytol. 132 : 1 – 30 .
Nakayama , H. , Yoshida , K. , Ono , H. , Murooka , Y. and Shinmyo , A. ( 2000 ) Ectoine, the compatible solute of Halomonas elongata, confers hyperosmotic tolerance in cultured tobacco cells . Plant
Physiol. 122 : 1239 – 1247 . Ndimba , B.K. , Chivasa , S. , Simon , W.J. and Slabas , A.R. ( 2005 )
Identifi cation of Arabidopsis salt and osmotic stress responsive proteins using two-dimensional difference gel electrophoresis and mass spectrometry . Proteomics 5 : 4185 – 4196 .
Nicolai , M. , Roncato , M.A. , Canoy , A.S. , Rouquie , D. , Sarda , X. , Freyssinet , G. , et al . ( 2006 ) Large-scale analysis of mRNA translation states during sucrose starvation in Arabidopsis cells identifi es cell proliferation and chromatin structure as targets of translational control . Plant Physiol. 141 : 663 – 673 .
Nover , L. , Scharf , K.D. and Neumann , D. ( 1989 ) Cytoplasmic heat shock granules are formed from precursor particles and are associated with a specifi c set of mRNAs . Mol. Cell Biol. 9 : 1298 – 1308 .
Osakabe , Y. , Maruyama , K. , Seki , M. , Satou , M. , Shinozaki , K. and Yamaguchi-Shinozaki , K. ( 2005 ) Leucine-rich repeat receptor-like kinase1 is a key membrane-bound regulator of abscisic acid early signaling in Arabidopsis . Plant Cell 17 : 1105 – 1119 .
Pierrat , O.A. , Mikitova , V. , Bush , M.S. , Browning , K.S. and Doonan , J.H. ( 2007 ) Control of protein translation by phosphorylation of the mRNA 5 ′ -cap-binding complex . Biochem. Soc. Trans. 35 : 1634 – 1637 .
Pitto , L. , Gallie , D.R. and Walbot , V. ( 1992 ) Role of the leader sequence during thermal repression of translation in maize, tobacco, and carrot protoplasts . Plant Physiol. 100 : 1827 – 1833 .
Proud , C.G. ( 2007 ) Signalling to translation: how signal transduction pathways control the protein synthetic machinery . Biochem. J. 403 : 217 – 234 .
Rabbani , M.A. , Maruyama , K. , Abe , H. , Khan , M.A. , Katsura , K. , Ito , Y. , et al . ( 2003 ) Monitoring expression profi les of rice genes under cold, drought, and high-salinity stresses and abscisic acid application using cDNA microarray and RNA gel-blot analyses . Plant Physiol. 133 : 1755 – 1767 .
Rizhsky , L. , Liang , H. and Mittler , R. ( 2002 ) The combined effect of drought stress and heat shock on gene expression in tobacco . Plant Physiol. 130 : 1143 – 1151 .
Sachs , M.M. , Freeling , M. and Okimoto , R. ( 1980 ) The anaerobic proteins of maize . Cell 20 : 761 – 767 .
Sahi , C. , Singh , A. , Blumwald , E. and Grover , A. ( 2006 ) Beyond osmolytes and transporters: novel plant salt stress tolerance-related genes from transcriptional profi ling data . Physiol. Plant. 127 : 1 – 9 .
Schneider , R.J. ( 2000 ) Translational control during heat shock . In Translational Control of Gene Expression . Edited by Sonenberg , N. , Hershey , J.W.B. and Mathews , M.B. pp. 581 – 593 . Cold Spring Harbor Laboratory Press , Cold Spring Harbor, NY .
Seki , M. , Narusaka , M. , Ishida , J. , Nanjo , T. , Fujita , M. , Oono , Y. , et al . ( 2002 ) Monitoring the expression profi les of 7000 Arabidopsis genes under drought, cold and high-salinity stresses using a full-length cDNA microarray . Plant J. 31 : 279 – 292 .
Takahashi , S. , Seki , M. , Ishida , J. , Satou , M. , Sakurai , T. , Narusaka , M. , et al . ( 2004 ) Monitoring the expression profi les of genes induced by hyperosmotic, high salinity, and oxidative stress and abscisic acid treatment in Arabidopsis cell culture using a full-length cDNA microarray . Plant Mol. Biol. 56 : 29 – 55 .
461
Translational response to heat and salt stress
Plant Cell Physiol. 51(3): 448–462 (2010) doi:10.1093/pcp/pcq010 © The Author 2010.
Dow
nloaded from https://academ
ic.oup.com/pcp/article/51/3/448/1895718 by guest on 29 January 2022

Thimm , O. , Bläsing , O. , Gibon , Y. , Nagel , A. , Meyer , S. , Krüger , P. , et al . ( 2004 ) MAPMAN: a user-driven tool to display genomics data sets onto diagrams of metabolic pathways and other biological processes . Plant J. 37 : 914 – 939 .
Turck , F. , Kozma , S.C. , Thomas , G. and Nagy , F. ( 1998 ) A heat-sensitive Arabidopsis thaliana kinase substitutes for human p70s6k function in vivo . Mol. Cell Biol. 18 : 2038 – 2044 .
Usadel , B. , Nagel , A. , Steinhauser , D. , Gibon , Y. , Bläsing , O.E. , Redestig , H. , et al . ( 2006 ) PageMan: an interactive ontology tool to
generate, display, and annotate overview graphs for profi ling experiments . BMC Bioinformatics 7 : 535 .
Usadel , B. , Nagel , A. , Thimm , O. , Redestig , H. , Blaesing , O.E. , Palacios-Rojas , N. , et al . ( 2005 ) Extension of the visualization tool MapMan to allow statistical analysis of arrays, display of corresponding genes, and comparison with known responses . Plant Physiol. 138 : 1195 – 1204 .
Williams , A.J. , Werner-Fraczek , J. , Chang , I.F. and Bailey-Serres , J. ( 2003 ) Regulated phosphorylation of 40S ribosomal protein S6 in root tips of maize . Plant Physiol. 132 : 2086 – 2097 .
462
H. Matsuura et al.
Plant Cell Physiol. 51(3): 448–462 (2010) doi:10.1093/pcp/pcq010 © The Author 2010.
Dow
nloaded from https://academ
ic.oup.com/pcp/article/51/3/448/1895718 by guest on 29 January 2022