genome patterns of selection and introgression of ... · genome patterns of selection and...
TRANSCRIPT

Genome Patterns of Selection and Introgression ofHaplotypes in Natural Populations of the House Mouse(Mus musculus)Fabian Staubach1,2, Anna Lorenc1, Philipp W. Messer2, Kun Tang3, Dmitri A. Petrov2, Diethard Tautz1*
1 Max Planck Institute for Evolutionary Biology, Plon, Germany, 2 Department of Biology, Stanford University, Stanford, California, United States of America, 3 CAS-MPG
Partner Institute and Key Laboratory for Computational Biology, Shanghai Institutes for Biological Sciences, Chinese Academy of Sciences, Shanghai, China
Abstract
General parameters of selection, such as the frequency and strength of positive selection in natural populations or the roleof introgression, are still insufficiently understood. The house mouse (Mus musculus) is a particularly well-suited modelsystem to approach such questions, since it has a defined history of splits into subspecies and populations and sinceextensive genome information is available. We have used high-density single-nucleotide polymorphism (SNP) typing arraysto assess genomic patterns of positive selection and introgression of alleles in two natural populations of each of thesubspecies M. m. domesticus and M. m. musculus. Applying different statistical procedures, we find a large number ofregions subject to apparent selective sweeps, indicating frequent positive selection on rare alleles or novel mutations.Genes in the regions include well-studied imprinted loci (e.g. Plagl1/Zac1), homologues of human genes involved inadaptations (e.g. alpha-amylase genes) or in genetic diseases (e.g. Huntingtin and Parkin). Haplotype matching between thetwo subspecies reveals a large number of haplotypes that show patterns of introgression from specific populations of therespective other subspecies, with at least 10% of the genome being affected by partial or full introgression. Using neutralsimulations for comparison, we find that the size and the fraction of introgressed haplotypes are not compatible with a puremigration or incomplete lineage sorting model. Hence, it appears that introgressed haplotypes can rise in frequency due topositive selection and thus can contribute to the adaptive genomic landscape of natural populations. Our data support thenotion that natural genomes are subject to complex adaptive processes, including the introgression of haplotypes fromother differentiated populations or species at a larger scale than previously assumed for animals. This implies that some ofthe admixture found in inbred strains of mice may also have a natural origin.
Citation: Staubach F, Lorenc A, Messer PW, Tang K, Petrov DA, et al. (2012) Genome Patterns of Selection and Introgression of Haplotypes in Natural Populationsof the House Mouse (Mus musculus). PLoS Genet 8(8): e1002891. doi:10.1371/journal.pgen.1002891
Editor: Michael H. Kohn, Rice University, United States of America
Received January 27, 2012; Accepted June 11, 2012; Published August 30, 2012
Copyright: � 2012 Staubach et al. This is an open-access article distributed under the terms of the Creative Commons Attribution License, which permitsunrestricted use, distribution, and reproduction in any medium, provided the original author and source are credited.
Funding: The work was funded by institutional support through the Max Planck Society (http://www.mpg.de/de) and a DFG (http://www.dfg.de)Forschungsstipendium to FS (STA 1154/1). The funders had no role in study design, data collection and analysis, decision to publish, or preparation of themanuscript.
Competing Interests: The authors have declared that no competing interests exist.
* E-mail: [email protected]
Introduction
Genomic approaches allow an increasingly deeper insight into
the forces that shape the evolution of genomes in populations.
While it is evident that genome evolution depends on a balance of
mutation, neutral evolution, negative selection and adaptation, the
relative importance of each of these parameters is still only partly
understood. Systematic genome scans for selective sweeps have
shown that loci under recent positive selection can be readily
detected in natural populations, but also that sweep signatures may
be generated through drift effects associated with population
bottlenecks or other demographic factors [1,2]. Therefore a
number of more refined statistical procedures have now been
developed that allow better distinguishing positive selection from
drift effects [3–6]. In combination with high-density genome data,
it is thus possible to get deeper insights in the impact of positive
selection on genome evolution.
Another factor of increasing relevance for understanding the
genetic composition of natural populations is allelic introgression
from other subspecies or closely related species. While it is well
known that hybridization between differentiated populations and
species is relevant for the evolution of many plant species, the
realization that similar processes are ongoing in animal popula-
tions has only come recently [7–10]. While several examples of
hybrid speciation in animals have now been described, there are
still only few examples of introgression of specific chromosomal
regions [11–14]. Evidence that introgressed chromosomal regions
play a role in adaptation is still anecdotal and involves strong
selection as in the case of warfarin resistance in mice [13] or direct
mate choice signals in butterflies [14].
We use natural populations of house mice (Mus musculus) to
study the genetics of adaptations [15–17]. Originating in Asia,
several species and subspecies of mice have evolved within the
genus Mus in the past million years [18–20]. M. m. domesticus and
M. m. musculus have separated about 300,000–500,000 years ago,
which reflects in numbers of generations and relative molecular
divergence the split of chimpanzees and humans. However, they
are still considered subspecies, since they can be crossed and do
PLOS Genetics | www.plosgenetics.org 1 August 2012 | Volume 8 | Issue 8 | e1002891

not live in sympatry. On the other hand, hybrid males are often
sterile [21,22], leading some authors to consider them as separate
species [19].
House mice have spread across the world and live in diverse
habitats. As commensals of humans, they have also spread in the
context of developing human agriculture in Europe and Asia
within the past few thousand years, followed by a colonization of
the rest of the world in the wake of transcontinental shipping
within the past few hundred years [18].
For the present study, we use two natural populations each from
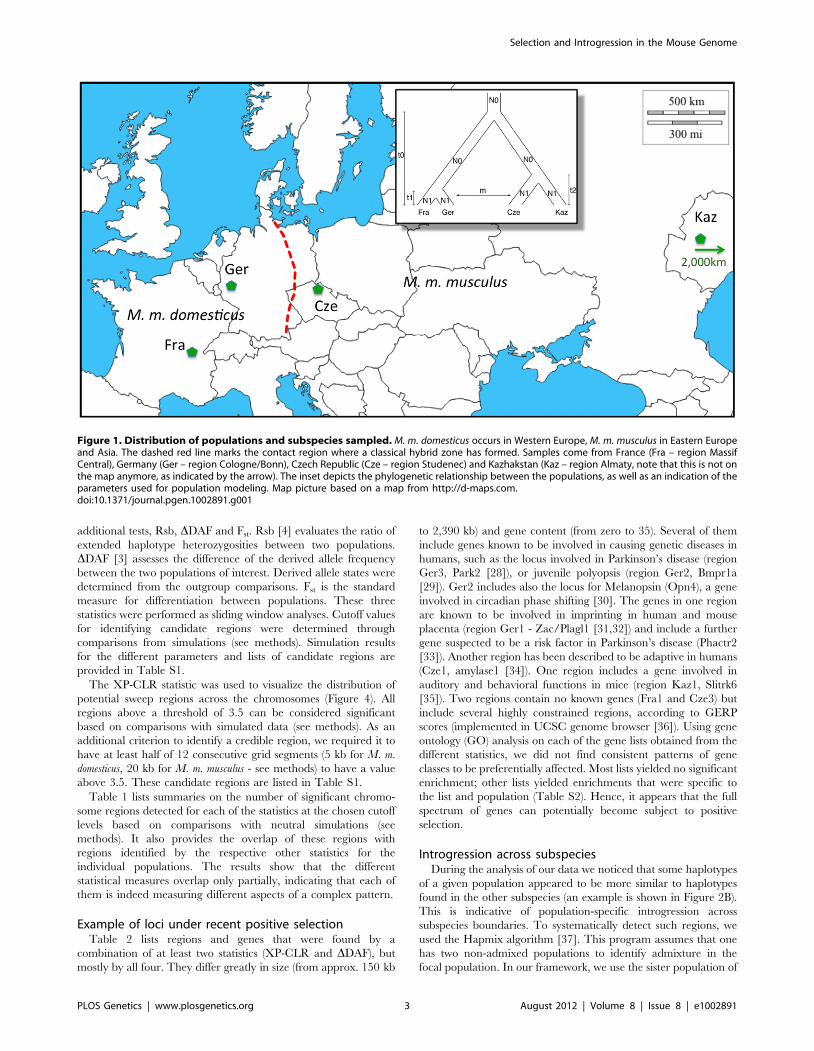
M. m. domesticus and M. m. musculus (Figure 1). The two M. m.
domesticus populations are from Southern France (Fra) and Western
Germany (Ger) and are derived from a colonization wave of
Western Europe starting about 3,000 years ago [23]. The
demographic history of the two M. m. musculus populations from
the Czech Republic (Cze) and Kazakhstan (Kaz) is older but lies
most likely still within the time frame of agricultural expansion of
humans [24].
We use the Affymetrix Mouse Diversity Genotyping Array [25]
for genotyping wild caught individuals from the respective
populations. This array was designed to cover the variation for
M. m. domesticus and M. m. musculus since they are the main
subspecies relevant for laboratory strains of house mice. However,
we found in our analysis that calling SNPs in M. m. musculus
appears less reliable and we have therefore refined the statistical
approaches to retrieve reliable genotype calls. We use these data to
apply a number of statistical procedures for detecting positive
selection whereby each procedure has its merits and problems for
such screens. Our data from a systematic, genome wide screen for
introgressed regions provide a major new insight into the
frequency of introgression of chromosomal regions between
specific populations. To test whether the observed frequencies of
introgressed regions within a population as well as their lengths
can be explained by neutral processes alone, we compare our
results to coalescent simulations testing different migration
parameters and suggest that both, selective sweeps caused by rare
alleles or new mutations, as well as adaptive introgression of
haplotypes shape the composition of the genomes of mice.
Results
Data quality and filteringThe Affymetrix Mouse Diversity Genotyping Array (MDGA)
was designed on the basis of SNP differences between several
laboratory mouse strains, both traditional and wild-derived inbred
strains [25]. However, we noticed that the application of the
recommended genotype calling methods to the wild mouse
samples yielded an unexpectedly high fraction of SNPs incorrectly
genotyped as heterozygous (see Methods). The set of SNPs
interrogated by the MGDA is biased towards SNPs present in M.
m. domesticus, although a number of SNPs polymorphic outside of
this subspecies were added. Nevertheless, for samples with
increasing genetic distance to M. m. domesticus, we saw an increase
in apparently false heterozygote calls. We applied therefore the
additional filtering steps described in the methods section. This
yielded a list of approx. 470,000 high quality SNPs, 264,000 of
which were polymorphic in M. m. domesticus and 167,000 were
polymorphic in M. m. musculus. This difference reflects the
ascertainment bias towards M. m. domesticus, since the M. m.
musculus populations are not less polymorphic in unbiased analyses
[19,26]. We obtained high quality data from 11 unrelated wild
caught individuals per population, representing 22 autosomal
chromosome samples. We used males and females, implying that
the coverage for the sex chromosomes was lower. Since statistical
power drops with the number of chromosomes, we refrain from
using data from the sex chromosomes in the further analysis.
The overall distance analysis shows that the populations and the
individuals within the populations are mostly well separated, i.e.
represent unrelated animals as expected based on the sampling
scheme applied (Figure 2A). The distance plot shows the longest
branch lengths for the M. m. domesticus populations, in line with the
somewhat biased representation of SNPs.
Linkage disequilibriumAssessing linkage disequilibrium allows estimating average sizes
of haplotypes that could become subject to selection in a
population. Linkage disequilibrium was therefore calculated for
all four populations. Figure 3A shows plots of r2 against physical
distance for up to 100 kb. The strongest decay is seen in the M. m.
musculus population from Kaz. This is in line with the observation
that the Kaz population has a higher genetic diversity [15], most
likely since it represents an ancestral population close to the source
of the species. The LD decay observed for the M. m. domesticus
populations is similar to LD estimates for a wild Arizona M. m.
domesticus population [27] i.e. the genetic diversity is comparable
between the newly colonized North American continent and the
Western European populations, from which the North American
mice are derived. This suggests that no severe bottleneck has
occurred during the colonization of North America, probably due
to multiple introgressions from various European populations.
However, the M. m. musculus population from the Czech
Republic shows a slower decay than the Kaz population. We
ascribe this in part to the presence of large introgressed regions
from the other subspecies in this population (see below) and have
therefore produced a second version of the LD plot excluding all
regions showing signs of introgression for all populations
(Figure 3B). This results indeed in a closer correspondence of
the values to those of the other populations. Generally, however,
linkage of SNPs beyond 100 kb is rare, even in the Cze
population.
Selective sweep scansWe used the XP-CLR statistic that evaluates allele frequency
differentiation between populations [5] to identify candidate
regions for selective sweeps along the chromosomes in the two
population pairs. This statistic is particularly robust to ascertain-
ment bias and population demography [5], but may still not
capture all regions of interest. We have therefore applied three
Author Summary
Although there is abundant evidence for phenotypicadaptation in natural populations, it is still a challenge tounderstand the underlying genetic processes. House micehave colonized the world in several successive waves, themost recent ones in the wake of the spread of humanagriculture and trans-oceanic shipping. They have adaptedto many habitats and climates, and their populationsprovide a rich source of opportunities for studying theimpact of adaptation and positive selection on thegenome. By scanning the whole genome of four naturalpopulations of mice, we detect abundant evidence forrecent positive selection, including loci that are known tobe involved in genetic diseases in humans. Unexpectedly,we also find a high proportion of gene exchange betweenpopulations that have long been separated. This findingsupports the notion that hybridization and transfer ofalleles can significantly contribute to new genetic materialsubject to positive selection.
Selection and Introgression in the Mouse Genome
PLOS Genetics | www.plosgenetics.org 2 August 2012 | Volume 8 | Issue 8 | e1002891
additional tests, Rsb, DDAF and Fst. Rsb [4] evaluates the ratio of
extended haplotype heterozygosities between two populations.
DDAF [3] assesses the difference of the derived allele frequency
between the two populations of interest. Derived allele states were
determined from the outgroup comparisons. Fst is the standard
measure for differentiation between populations. These three
statistics were performed as sliding window analyses. Cutoff values
for identifying candidate regions were determined through
comparisons from simulations (see methods). Simulation results
for the different parameters and lists of candidate regions are
provided in Table S1.
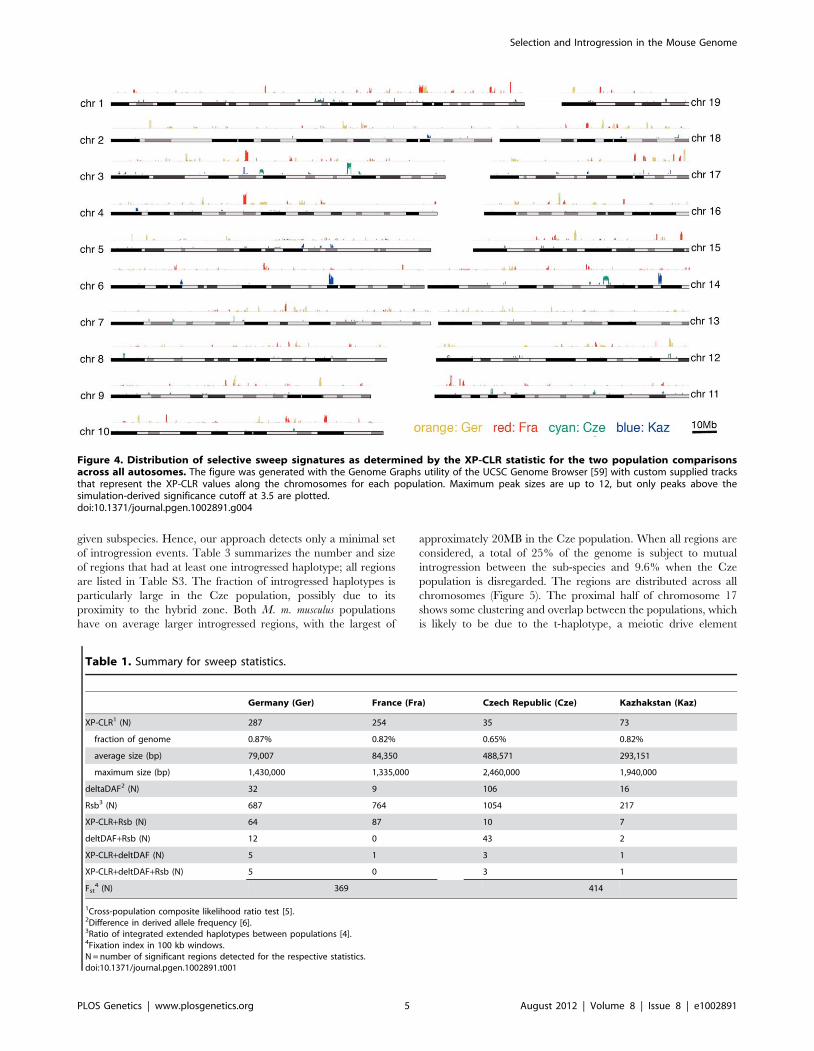
The XP-CLR statistic was used to visualize the distribution of
potential sweep regions across the chromosomes (Figure 4). All
regions above a threshold of 3.5 can be considered significant
based on comparisons with simulated data (see methods). As an
additional criterion to identify a credible region, we required it to
have at least half of 12 consecutive grid segments (5 kb for M. m.
domesticus, 20 kb for M. m. musculus - see methods) to have a value
above 3.5. These candidate regions are listed in Table S1.
Table 1 lists summaries on the number of significant chromo-
some regions detected for each of the statistics at the chosen cutoff
levels based on comparisons with neutral simulations (see
methods). It also provides the overlap of these regions with
regions identified by the respective other statistics for the
individual populations. The results show that the different
statistical measures overlap only partially, indicating that each of
them is indeed measuring different aspects of a complex pattern.
Example of loci under recent positive selectionTable 2 lists regions and genes that were found by a
combination of at least two statistics (XP-CLR and DDAF), but
mostly by all four. They differ greatly in size (from approx. 150 kb
to 2,390 kb) and gene content (from zero to 35). Several of them
include genes known to be involved in causing genetic diseases in
humans, such as the locus involved in Parkinson’s disease (region
Ger3, Park2 [28]), or juvenile polyopsis (region Ger2, Bmpr1a
[29]). Ger2 includes also the locus for Melanopsin (Opn4), a gene
involved in circadian phase shifting [30]. The genes in one region
are known to be involved in imprinting in human and mouse
placenta (region Ger1 - Zac/Plagl1 [31,32]) and include a further
gene suspected to be a risk factor in Parkinson’s disease (Phactr2
[33]). Another region has been described to be adaptive in humans
(Cze1, amylase1 [34]). One region includes a gene involved in
auditory and behavioral functions in mice (region Kaz1, Slitrk6
[35]). Two regions contain no known genes (Fra1 and Cze3) but
include several highly constrained regions, according to GERP
scores (implemented in UCSC genome browser [36]). Using gene
ontology (GO) analysis on each of the gene lists obtained from the
different statistics, we did not find consistent patterns of gene
classes to be preferentially affected. Most lists yielded no significant
enrichment; other lists yielded enrichments that were specific to
the list and population (Table S2). Hence, it appears that the full
spectrum of genes can potentially become subject to positive
selection.
Introgression across subspeciesDuring the analysis of our data we noticed that some haplotypes
of a given population appeared to be more similar to haplotypes
found in the other subspecies (an example is shown in Figure 2B).
This is indicative of population-specific introgression across
subspecies boundaries. To systematically detect such regions, we
used the Hapmix algorithm [37]. This program assumes that one
has two non-admixed populations to identify admixture in the
focal population. In our framework, we use the sister population of
Figure 1. Distribution of populations and subspecies sampled. M. m. domesticus occurs in Western Europe, M. m. musculus in Eastern Europeand Asia. The dashed red line marks the contact region where a classical hybrid zone has formed. Samples come from France (Fra – region MassifCentral), Germany (Ger – region Cologne/Bonn), Czech Republic (Cze – region Studenec) and Kazhakstan (Kaz – region Almaty, note that this is not onthe map anymore, as indicated by the arrow). The inset depicts the phylogenetic relationship between the populations, as well as an indication of theparameters used for population modeling. Map picture based on a map from http://d-maps.com.doi:10.1371/journal.pgen.1002891.g001
Selection and Introgression in the Mouse Genome
PLOS Genetics | www.plosgenetics.org 3 August 2012 | Volume 8 | Issue 8 | e1002891

a given subspecies as one possible source and the populations of
the other subspecies as another source (e.g. if Ger is our focal
population we use Fra as one potential source and combine Kaz
and Cze into the other potential source). This allows us to detect
population-specific introgression, but we would evidently miss all
cases where introgresssion occurred into both populations of a
Figure 2. Neighbor joining trees of population samples, based on Manhattan distances. The scale bars refer to the number ofsubstitutions per SNP genotyped. (A) For all autosomal SNPs in the study, grouped by sample and rooted by outgroup species. The shorter branchlengths for the M. m. musculus populations as well as the outgroups reflect the ascertainment bias for polymorphic SNPs in these subspecies andspecies. (B) For all haplotypes of a 6MB region on chromosome 6. Some haplotypes of Kaz group with M. m. domesticus due to introgression. The Czepopulation is partially introgressed by shorter fragments of M. m. domesticus haplotypes in this region (see Figure S1 for depiction of haplotype tracksof this region), which results in some paraphyletic groupings for some haplotypes.doi:10.1371/journal.pgen.1002891.g002
Figure 3. Pairwise LD (r2) between markers over distance for each of the populations in the study. (A) full dataset, (B) all regions ofintrogression removed.doi:10.1371/journal.pgen.1002891.g003
Selection and Introgression in the Mouse Genome
PLOS Genetics | www.plosgenetics.org 4 August 2012 | Volume 8 | Issue 8 | e1002891
given subspecies. Hence, our approach detects only a minimal set
of introgression events. Table 3 summarizes the number and size
of regions that had at least one introgressed haplotype; all regions
are listed in Table S3. The fraction of introgressed haplotypes is
particularly large in the Cze population, possibly due to its
proximity to the hybrid zone. Both M. m. musculus populations
have on average larger introgressed regions, with the largest of
approximately 20MB in the Cze population. When all regions are
considered, a total of 25% of the genome is subject to mutual
introgression between the sub-species and 9.6% when the Cze
population is disregarded. The regions are distributed across all
chromosomes (Figure 5). The proximal half of chromosome 17
shows some clustering and overlap between the populations, which
is likely to be due to the t-haplotype, a meiotic drive element
Figure 4. Distribution of selective sweep signatures as determined by the XP-CLR statistic for the two population comparisonsacross all autosomes. The figure was generated with the Genome Graphs utility of the UCSC Genome Browser [59] with custom supplied tracksthat represent the XP-CLR values along the chromosomes for each population. Maximum peak sizes are up to 12, but only peaks above thesimulation-derived significance cutoff at 3.5 are plotted.doi:10.1371/journal.pgen.1002891.g004
Table 1. Summary for sweep statistics.
Germany (Ger) France (Fra) Czech Republic (Cze) Kazhakstan (Kaz)
XP-CLR1 (N) 287 254 35 73
fraction of genome 0.87% 0.82% 0.65% 0.82%
average size (bp) 79,007 84,350 488,571 293,151
maximum size (bp) 1,430,000 1,335,000 2,460,000 1,940,000
deltaDAF2 (N) 32 9 106 16
Rsb3 (N) 687 764 1054 217
XP-CLR+Rsb (N) 64 87 10 7
deltDAF+Rsb (N) 12 0 43 2
XP-CLR+deltDAF (N) 5 1 3 1
XP-CLR+deltDAF+Rsb (N) 5 0 3 1
Fst4 (N) 369 414
1Cross-population composite likelihood ratio test [5].2Difference in derived allele frequency [6].3Ratio of integrated extended haplotypes between populations [4].4Fixation index in 100 kb windows.N = number of significant regions detected for the respective statistics.doi:10.1371/journal.pgen.1002891.t001
Selection and Introgression in the Mouse Genome
PLOS Genetics | www.plosgenetics.org 5 August 2012 | Volume 8 | Issue 8 | e1002891

consisting of several inversions reducing local recombination. The
t-haplotype covers the centromeric half of chromosome 17 and has
introgressed from another species [38]. Therefore it is recognized
as mutually introgressed by the Hapmix algorithm in our
populations. Hence, we have omitted this region from the further
statistical calculations, although it has only little impact on the
overall pattern.
To assess whether the observed introgression could be
compatible with a neutral migration-introgression model, we
simulated datasets with varying population size and migration
rates ranging from very small migration rates, which one would
expect under sporadic long distance migration model, to relatively
frequent migration, such as to be expected in the proximity to the
hybrid zone (see methods). We applied Hapmix with the same
settings as used for analysis of the empirical data to the simulated
data sets. Figure 6 suggests that the observed frequency of
introgressed haplotypes (Figure 6 left) as well as observed
haplotype length (Figure 6 middle) would require migration rates
higher than 4Nm = 1 in a neutral model. However migration rates
of that magnitude are incompatible with the observed fraction of
the genome affected by migration for all but the Cze population
(Figure 6 right). If migration rates were sufficiently high to
generate the observed high frequencies and lengths of introgressed
haplotypes, a fraction of .15% of the genome should show
evidence of introgression. The observed fractions of the genome
subject to introgression are significantly lower, 2.8% for the Ger
and Fra populations and 5.8% for the Kaz population (Table 3).
On the other hand, the relative frequency of introgressed
haplotypes is higher than expected in a neutral model. At a
threshold of 4Nm = 1 we would expect less than 1% of all
introgressed haplotypes to be at a frequency larger than 4 out of
22, but the observed fractions of haplotypes with higher frequency
are much larger (Kaz: 8.1%, Cze 19.7%, Ger 20.3% and Fra
27%). This suggests that a large fraction of the haplotypes is
subject to forces that lead to a faster increase in frequency than
expected by chance.
We can estimate significance of this observation by assuming a
migration rate of 4Nm = 1. At this migration rate simulations
match the proportion of the genome subject to introgression in the
Czech population while for all other populations a greater fraction
of the genome would be expected to have introgressed leaving p
values more conservative. Nevertheless the observed frequency of
introgressed haplotypes is significantly higher in all populations
compared to neutral simulations (p,2.2e-16 for Germany, France
and Czech Republic and p = 0.02 for Kazakhstan).
The introgressed regions could also reflect incomplete lineage
sorting since the split of the sub-species, as it has been proposed
in the analysis of several specific loci [19]. We have therefore
sought to estimate this effect within our data and analysis
framework. Using Hapmix on simulated data without migration,
we find only a small number of positive regions per population,
which allows calculating a false discovery rate (FDR) of 5% or less
(Table 3).
GO analysis of genes covered by introgressed regions (Table
S3) showed some enrichment terms due to the inclusion of gene
clusters. Most notably, a large olfactory receptor gene cluster on
chromosome 7 (see below), the bitter taste receptor gene cluster
on chromosome 6 and the cluster of epidermis genes Sprr and
Lce on chromosome 3 show complex mutual patterns of
introgression.
Table 2. Examples of selective sweep regions identified by multiple statistics.
Location2 size (kb) classification genes in the region1
Ger1 chr1012719281–13144281
425 coding, imprinted, disease related Phactr2 (phosphatase and actinregulator 2 isoform A), Plagl1(pleiomorphic adenoma gene-like1), Zac1 (zinc finger protein)
Ger2 chr1435,222,025–35,451,7633
230 coding, disease related Bmpr1a (bone morphogeneticprotein receptor type-1A), Ldb3(LIM domain-binding protein 3isoform), Opn4 (melanopsinisoform 1)
Ger3 chr1711,520,278–12,071,811
550 coding, disease related Park2 (parkinson protein 2 - E3ubiquitin-protein ligase parkin)
Fra1 chr1259,560,813–59,710,943
150 non-coding center of 680 kb non-codingregion
Fra2 chr1538,059,935–38,210,538
150 coding Odf1, main protein of sperm tailouter dense fibers
Cze1 chr3112,689,523–115,078,986
2,390 coding, disease related Amy2b (amylase 2b isoform 1),Amy2a5 (pancreatic alpha-amylase), Amy1 (alpha-amylase 1),Col11a1 (collagen alpha-1(XI)chain), Olfm3 (olfactomedin 3)
Cze2 chr729571436–30171436
600 coding ca 35 partially overlapping genes
Cze3 chr86013855–6933855
920 non-coding center of an approx 3 Mb non-coding region
Kaz1 chr14109933747–111553747
1,620 coding (mostly non-coding) Slitrk6 (SLIT and NTRK-like protein 6)
1Lists only genes in the region with functional information in the mouse.2Overlapping windows of different statistics combined.3Combines three neighboring XP-CLR positive regions.doi:10.1371/journal.pgen.1002891.t002
Selection and Introgression in the Mouse Genome
PLOS Genetics | www.plosgenetics.org 6 August 2012 | Volume 8 | Issue 8 | e1002891

VisualizationTo visualize selective sweeps and introgressed regions in the
population and chromosome context, we generated UCSC browser
custom tracks based on phased data from the individuals in each
population. Figure 7 shows two examples of such tracks with their
associated genes. Figure 7A shows a sweep around the locus
involved in Huntington’s disease in humans (Huntingtin) in the Fra
population. Interestingly, the region is at the same time part of a
larger region that has introgressed into the Kaz population.
Figure 7B shows the sweeps around the alpha-amylase genes (see
Cze1 in Table 2). Although sweeps are evident for Fra, Ger and
Cze, only the Cze region is identified by all three statistics. Again,
there is a long region of introgression into Kaz and a shorter one
into Fra. In fact, the sweep allele in Fra is apparently also derived
from an introgressed haplotype. Additional example regions for
sweeps and introgression are shown in Figure S1.
Discussion
Our analysis provides an insight into the complex interplay
between selection, introgression and drift in natural populations of
the house mouse. We cannot even claim that we have identified all
complexities, since the deme structure of mice with local
inbreeding is difficult to capture in standard statistical models.
However, our sampling scheme for the local populations was
designed to get a representative sample across a whole area, which
is more likely to represent a more long-term stable population
sample [15]. In our previous microsatellite based screens for
selective sweeps in these populations [15,16], we had already
found that patterns of positive selection can be readily detected
and we estimated a frequency of more than one cycle of positive
selection per 100 generations [16]. The SNP based survey here is
compatible with this finding, although the results cannot be
directly compared, since microsatellites have a much higher
mutation rate than SNPs and will therefore detect primarily very
recent events. An unexpected finding in our study here was that
introgression of genomic fragments across the M. m. domesticus/M.
m. musculus boundary does appear to play a larger role than
previously expected and that the frequency and size distribution of
the introgressed fragments can not be explained by a neutral
introgression model. This suggests a general interplay between
selection and introgression shaping the genomes, which is difficult
to disentangle. Still, we discuss these factors in turn in the
following, since we have used different approaches to detect them.
Table 3. Genome regions affected by introgression.
Ger Fra Cze Kaz all w/o Cze all
Hapmix1 (N) 374 466 1,316 270 1,110 2,426
average size (bp) 189,757 150,514 347,088 461,483 239,377 297,806
maximum size (bp) 2,292,307 3,808,863 19,446,657 12,506,547 12,506,547 19,446,657
part of genome2 (%) 2.8 2.8 17.7 4.9 9.6 24.8
FDR (%) 2.2 1.2 3.8 5.0
1Region in proximal half of chromosome 17 (t-region) omitted.2Corrected for omitted genome region.doi:10.1371/journal.pgen.1002891.t003
Figure 5. Distribution of introgressed regions across the chromosomes. Introgressed regions into M. m. domesticus in blue, into M. m.musculus in red. Elevated blocks indicate regions found in both populations of the respective subspecies. The figure was generated with the GenomeGraphs utility of the UCSC Genome Browser [59].doi:10.1371/journal.pgen.1002891.g005
Selection and Introgression in the Mouse Genome
PLOS Genetics | www.plosgenetics.org 7 August 2012 | Volume 8 | Issue 8 | e1002891

Patterns of positive selectionA number of statistical methods have been developed to infer
selection from SNP data in population surveys. The best datasets
for applying such tests were so far available for human populations
[1,3,6,39]. The data that we obtained from the mouse arrays now
begin to parallel the human data availability, at least with respect
to SNP coverage. We have explored a range of reasonable
demographic scenarios that are in line with previous population
genetic results [19,20,26,40] to obtain estimates for cutoff values
reflecting neutral processes for the various statistics. Since it
became clear that adaptive introgression plays a significant role in
shaping polymorphisms, and since this would be difficult to model
because of the many combinations of parameters that could play a
role, we refrained from an even deeper exploration of the
demographic parameter space. Each of the statistics yields a list of
candidate regions, but the overlap between these lists is limited, as
it was also observed for human data [2]. This suggests that the
statistical procedures are necessarily limited to their respective
model of evolution, while the reality of adaptive processes is
dynamical and complex and involves also as yet unsolved
questions of the influence of deme structures and long-term
stability of local populations.
The XP-CLR statistic appears currently best suited to deal with
this complexity (as tested by the authors [5]), although it is
necessarily also limited with respect to not taking into account
possible confounding influences of introgression. Under our cutoff
chosen for candidate regions (which can be considered to be
conservative), we find that about 0.8% of the genome are covered
in each population, suggesting that genetic draft contributes
significantly to the evolutionary genome dynamics in mouse
populations.
Depending on effective population size and other parameters,
significant sweep signatures may be traceable for only 10,000
generations [41], which is not much more than the estimated time
of separation between the Fra and Ger populations. In our
previous microsatellite screen we found that 200–300 selective
sweeps should have occurred in each lineage since their separation
[16]. This is in accordance with the number of regions identified in
Figure 6. Comparison of introgression parameters (colored bars) with neutral models for introgression (white bars, numbers on thex-axis refer to migration rates in 4Nm). Top: M. m. domesticus populations, bottom: M. m. musculus populations. Thick horizontal lines representthe median, boxes range from first to third quartile, whiskers extend to 1.5 times the interquartile range, data points outside that range are drawn ascircles.doi:10.1371/journal.pgen.1002891.g006
Selection and Introgression in the Mouse Genome
PLOS Genetics | www.plosgenetics.org 8 August 2012 | Volume 8 | Issue 8 | e1002891

the XP-CLR statistic (287 for Ger and 254 for Fra), although one
has to keep in mind that the exact number depends on the cutoff
criteria. Still, the order of magnitude appears to correspond,
although the approaches are rather different [16]. The Cze and
Kaz populations may have been separated for a longer time,
causing older signatures of selection to increasingly vanish and
become undetectable. The fact that a smaller number of regions
are identified in these populations may be due to a lower density of
informative SNPs in M. m. musculus populations, or the population
history may be more complex, i.e. the model applied for obtaining
a cutoff may not be fully adequate. Still, independent of the exact
number of sweep regions identified, it is evident that sweep
candidates can be readily retrieved in the mouse, implying that
new mutations or rare alleles can frequently become subject to
positive selection. An in depth analysis of this question in humans
has suggested that selective sweeps based on new mutations have
been rare in the recent human history [39]. This analysis was
based on re-sequencing data, which are not yet available for our
mouse populations. Still, given that both the microsatellite
approach [16], as well as the data here show that many classic
signatures of sweeps can be identified, it would appear that mouse
populations are somewhat different from human populations in
this respect and possibly also more typical for natural populations.
Some of the gene regions that were identified by more than one
statistic are of particular biological interest. For example, genes
that have been implicated in causing diseases in humans would
have been expected to be primarily under purifying selection, since
most of them are derived from old conserved genes [42]. The fact
that two of the most studied disease genes in humans (Huntingtin
and Parkin) come out as loci that are subject to positive selection
and introgression suggests that evolution keeps shaping the
function of such genes. This supports the notion that medical
aspects of gene functions can profit from taking evolutionary
considerations into account [43].
IntrogressionIt had previously been noticed that different gene regions can
have different phylogenetic genealogies between populations of M.
m. domesticus and M. m. musculus [19,40,44]. Although incomplete
lineage sorting is formally another explanation for phylogenetic
discordance at some loci [19], this explanation could be excluded
for the highly polymorphic minisatellite loci studied by [44]. Our
Figure 7. Haplotype tracks showing sweeps and introgression regions. Lines represent two reconstructed haplotypes for each individual.The data are displayed as custom tracks in the UCSC browser [59]. SNP positions are depicted as vertical bars, SNP variants that are more frequent inM. m. domesticus are in red, M. m. musculus in blue. Spaces between the SNP positions are filled with the color corresponding to the flanking SNPs. Ifthese are of different color, the space is broken up in the middle. Known genes in the regions are depicted below (taken from the UCSC GenomeBrowser database - [14]). Sweep regions and corresponding genes are highlighted as yellow boxes, introgressed haplotypes are indicated by yellowarrows that point to the respective haplotype tracks that include them. (A) Genome region around the Huntingtin (Htt) locus on chromosome 5,showing a sweep in the Fra population and introgression into the Kaz population. (B) Genome region around the alpha-amylase gene cluster (Amy)on chromosome 3, with mutual sweeps in the Ger and Fra population and introgression in the Kaz and Fra population. Note that the introgressedhaplotype in Kaz extends further than depicted here (covering approx. 33 Mb in several pieces).doi:10.1371/journal.pgen.1002891.g007
Selection and Introgression in the Mouse Genome
PLOS Genetics | www.plosgenetics.org 9 August 2012 | Volume 8 | Issue 8 | e1002891

simulation analysis does also not suggest that incomplete lineage
sorting contributes much to the observed sharing of haplotypes.
Hence, we conclude that a relatively large fraction of the genome
can become subject to introgression from haplotypes of the other
subspecies, even between populations that are very far apart of
each other. Introgression across the hybrid zone between M. m.
domesticus and M. m. musculus has suggested that the median cline
width of introgressed markers is about 30 km [45]. However, these
authors noticed also a long tail in the distribution and some of the
markers with long-range introgression fall into regions that we see
as introgressed haplotypes (not shown). Our samples of the Cze
population came from a region about 200 km away from the
hybrid zone, the ones for the Ger population are about 450 km
away (in east-west direction). In our analysis, we find the Cze
sample much more invaded by M. m. domesticus haplotypes, which
is in agreement with closer location to the hybrid zone, but also in
line with previous findings that there is usually an asymmetry of
introgression of markers from M. m. domesticus into M. m. musculus
[45,46]. However, the Fra and the Kaz populations are far away
from a population of the respective other subspecies (Figure 1) and
still show a similar extent of introgression as the populations closer
to the hybrid zone. Hence, it can only be rare long-distance
dispersal, most likely aided by human transport that leads to the
transfer of haplotypes rather than slow diffusion emerging from
the hybrid zone.
Once an introgression has occurred, the haplotypes should
quickly break up through recombination while being subject to
drift. The long introgressed haplotypes that we have observed are
either refractory to recombination, for example due to an
inversion, or confer a selective advantage, i.e. spread faster than
they can break down. Although we cannot rule out hat inversions
exist for some regions, the visual analysis suggests that breakdown
products can segregate in parallel to the longest haplotypes (Figure
S1). Hence, recombination does appear to take place during the
spread of the haplotypes. We have found only few cases where a
detectable haplotype was fixed and is associated with a sweep
signature (Figure 7B). However, if we compare the frequency and
length distribution with our simulated data, we have to conclude
that a major fraction of introgressed haplotypes is subject to
positive selection, although not yet fixed. Different scenarios could
explain this observation. Selection coefficients might not be
sufficiently strong to fix the introgressed haplotypes quickly and
at the time when the relevant advantageous alleles get fixed, the
haplotype may have broken down to a size where it is beyond the
threshold of recognition in our data. Alternatively, frequency
dependent or balancing selective forces could also play a role in
preventing fixation.
Adaptive introgression of chromosome regions, even across
species boundaries, has been described for alleles that cause
warfarin resistance in mice [13]. Also, the phenomenon of
hybrid speciation leading to new adaptations suggests that the
introgression and mixing of haplotypes from different lineages
can well become advantageous [7–10] and can quickly lead to
new adaptive lineages [47]. Hybrid speciation in butterflies has
been directly linked to introgressed haplotypes involved in wing
patterning [14]. Hence, there is abundant evidence that
genomic material coming from related species can confer an
advantage to populations. Although M. m. domesticus and M. m.
musculus are not formally designated as separate species, they are
in a stage of divergence that is typical for many closely related
species, where hybridization is still possible. Hence, we expect
that the degree of introgression that we see between our
subspecies may occur in a similar way among many closely
related species pairs.
There is an ongoing discussion on whether inbred laboratory
mouse strains are ultimately derived from a mixture of subspecies
crossed in during some phase of the inbreeding process [48,49].
However, with our finding of large-scale introgression of
haplotypes under natural conditions, this question will become
of less relevance, since a truly ‘‘pure’’ population might not exist in
nature anyway. In fact, a previous study of wild derived inbred
mouse strains typed with a smaller set of SNPs had already
suggested a rather high degree of introgression of haplotypes
between the subspecies [50]. However, the M. m. musculus strains
analyzed in this study were derived from the Czech Republic,
where a major influence of introgression from the hybrid zone
occurs (as we see it also in our data). Moreover, the possible
influence of adaptive introgression was not tested by these authors.
The GO analysis did provide some enrichment terms of gene
classes for introgressed regions, but closer analysis showed that this
is due to the fact that a few regions encode gene clusters, such as
olfactory genes or bitter taste receptor genes. This leads to a
relative over-representation of terms like ‘‘sensory perception’’ or
‘‘G-protein coupled receptor activity’’ for the whole statistic,
although this is only due to these clusters. Overall, we see no
general pattern of types of genes subject to introgression across the
genome. Still, the fact that the gene clusters mentioned are
involved in introgression is of particular interest, since they code
for genes that are very likely subject to population specific
adaptations, as has also been noted previously [45]. Other gene
clusters, like the major urinary proteins (MUPs), which are
involved in individual recognition [51], would thus also expected
to be subject to introgression, but there are still problems with an
appropriate annotation of these regions [52], i.e. they are not
sufficiently covered in the SNP array and were therefore outside
our detection capacity. Hence, dedicated studies will be required
to explore this further.
ConclusionOur data suggest that the genome of natural populations is not
only shaped by drift and selection, but also by introgression from
sister-species. As discussed above, there is increasing evidence that
this occurs also in other animal species, including even humans,
where haplotypes from Neandertals and Denisovans have
introgressed in some populations [12,53]. We should therefore
like to propose ‘‘comet alleles’’ as a generic term for such
haplotypes which introgress across sub-species and species
boundaries. Like real comets, which come from the outer solar
system, they come from other evolutionary lineages. Like comets,
which dip into the solar system, ‘‘comet alleles’’ dip into another
evolutionary lineage, can become more shiny (i.e. increase locally
in frequency), can break up (i.e. can recombine), can disappear
again, or can impact (i.e. get fixed). We anticipate that comet
alleles will be found frequently among closely related species, once
high-density polymorphism data become more broadly available.
This will posit new challenges for designing appropriate popula-
tion models for the investigation of the role of positive selection in
shaping the genomes.
Materials and Methods
Ethics statementAll animal work followed the legal requirements, was
registered under number V312-72241.123-34 (97-8/07) and
approved by the ethics commission of the Ministerium fur
Landwirtschaft, Umwelt und landliche Raume, Kiel (Germany)
on 27. 12. 2007.
Selection and Introgression in the Mouse Genome
PLOS Genetics | www.plosgenetics.org 10 August 2012 | Volume 8 | Issue 8 | e1002891
Mouse sampling and DNA extractionMice were collected in Germany (in the Cologne-Bonn area),
France (in the Massif Central), Czech Republic (around Studenec)
and Kazakhstan (around Almaty) taking care to obtain a
representative local sample as described in [15]. DNA samples
were run on a 0.7% agarose gel to ensure high DNA quality prior
to further processing. DNA samples of eleven mice per population
plus the outgroup species Mus caroli, Mus famulus, Mus spretus, Mus
cypriacus, and Mus macedonicus were processed. SNP typing
microarrays (Affymetrix Mouse Diversity Genotyping Array) were
processed according to the recommended procedures of the
supplier.
Filtering SNPs to have only reliable callsFirst, we excluded from the analysis all SNPs flagged as
unreliable in the array annotation file provided by Affymetrix.
Because we found BRLMM-P calling (Affymetrix) to be suscep-
tible to false heterozygote calls when a probe set is not compatible
with a sample (sequences complementary to the probes are missing
in a genome, and this concerns mostly M. m. musculus samples), all
SNPs called heterozygous were re-checked. Only those, which had
an average intensity for both alleles higher than a cutoff, were
retained. The cutoff was the first quantile (0.1) of homozygous calls
in the reference (M. m. domesticus) samples, or when those were
unavailable, prior homozygote cluster centers, distributed by
Affymetrix, were used to determine the cutoffs. As this procedure
still does not remove all false heterozygous calls, we conservatively
excluded also from each population SNPs not concordant with
Hardy-Weinberg equilibrium (one sided Fisher test with p,0.01).
Protocol S1 provides additional details.
Assessment of linkage disequilibriumWe used the command line option of haploview [62] version 4.1
with default settings on data filtered as previously described to
calculate r2. For plotting, all pairs of SNPs with a highly similar
physical distance (within a 100 bp range) were binned into groups
followed by calculation of median r2 for each bin.
Statistics to trace selective sweepsAmong the large number of available statistics to search for
natural selection in genomic data, we chose a number of
complementary statistics to suit our experimental setup. We
focused our search on comparisons between sister populations
from the same subspecies (Ger vs. Fra, Kaz vs. Cze) to minimize
effects of ascertainment bias and demography that could arise in
cross-subspecies comparisons. We found that Rsb [4] and XP-
CLR [5] are well suited for comparing the sister populations while
focusing on two different informative aspects of the data. XP-CLR
uses population differentiation as a means to detect regions under
selection and hence is particularly robust against ascertainment
bias, while Rsb compares length and frequency of haplotypes
between populations. We then supplemented these statistics with
the difference in derived allele frequency (DDAF [6]) and the
classical measure of population differentiation Fst.
XP-CLR values were calculated using scripts made available by
[5] at (http://genepath.med.harvard.edu/reich). The following
parameters were used: window size 0.02 cm, grid size 5 kb for M.
m. domesticus populations and 20 kb for M. m. musculus, maximum
# of SNPs within a window 50, correlation level from which the
SNPs contribution to XP-CLR result was down weighted 0.95.
Genetic positions based on [54] from the Affymetrix annotation
file were taken as input. For each population the sister population
of the same subspecies was taken as a reference for generating
XP-CLR values. To identify candidate regions for a population,
we normalized its XP-CLR values by subtracting the mean and
dividing by the standard deviation. Chromosomal regions where at
least half of the consecutive 12 grid segments were above the
simulation-based cutoff value were designated candidate regions.
Overlapping regions were collapsed.
For Rsb, DDAF and Fst we used a sliding window approach
(100 kb windows, 50 kb increment) to detect candidate windows
outside simulation defined cutoffs. Different cutoff levels are
provided in Table S1. For the analysis presented in the text, we
used the most stringent one at p,0.001. Windows with fewer than
10 SNPs were discarded. Rsb values were calculated applying Perl
scripts as described in [4] to phased data (fastphase [55]). Because
large gaps in the available genotype information can cause
misleading Rsb results, SNPs closer than 300 kb to gaps of at least
1 Mb were removed from the Rsb analysis. DDAF was calculated
as described in [6]. We used the genotyping data from Mus spretus,
Mus cypriacus and Mus macedonicus to determine the ancestral state of
SNPs. In cases were data for these three species were either not
available or inconclusive, the ancestral state was inferred from
either Mus famulus or Mus caroli, if possible. Heterozygous
genotypes in the outgroup species were disregarded. Fst was
calculated using the formula Fst = 1-Hs/Ht where Hs is the mean
heterozygosity of the two populations and Ht is twice the product
of the heterozygosities within populations. We also applied the
correction for sample size developed by [57] with almost identical
results (data not shown) due to our filtering procedure and
proceeded with the simpler formula above.
Detection of introgressed haplotypesHapmix [37] was developed to infer the ancestries of
chromosomal fragments of an admixed individual using genotype
information from two potential source populations in a Hidden
Markov Model. We leveraged this approach to detect chromo-
somal fragments that have introgressed from the other subspecies
into our population of interest. Therefore we chose the sister
population from the same subspecies as one potential source and
the other subspecies as alternative source. If the ancestry of a
chromosomal region was assigned to the alternative source, i.e. to
the other subspecies, we regarded this region as introgressed.
Adjacent and overlapping chromosomal regions in which the
ancestry of at least one haplotype was assigned to the other
subspecies were merged into introgressed regions that, following
the principle of parsimony, stem most likely from a single
introgression event. Frequencies of comet haplotypes were
determined by counting the number of individuals within such a
region that show evidence for introgression using an R script.
We applied Hapmix with standard settings but adjusted the
recombination parameters to values observed in mouse as
described in [54] to phased data (fastphase [55]). Genetic positions
from the Affymetrix annotation file were taken as input for
Hapmix. To avoid confounding resolution effects of the mouse
linkage map on detection and assignment of start and end points of
introgressed haplotypes, we allowed for an appropriate amount of
recombination between markers that differed in physical position
but were assigned the same genetic position on the mouse linkage
map. Therefore the genetic distance between markers adjacent to
a block of markers at the same genetic position was split amongst
the markers in between according to physical distance.
Time since admixture was set to 100 generations and the
miscopying parameter to 0.0005, which we found to allow for
optimal use of the resolution of the MWGDA to also detect smaller
introgressed haplotypes with reasonable power by intense visual
Selection and Introgression in the Mouse Genome
PLOS Genetics | www.plosgenetics.org 11 August 2012 | Volume 8 | Issue 8 | e1002891

verification. The minimum per SNP certainty threshold to call a
SNP introgressed was 0.9 (default setting).
To estimate a false discovery rate (FDR) for introgressed regions
we applied Hapmix with the same settings we used for empirical
data to simulations without introgression (see next paragraph for
demographic parameters). Because migration is set to zero in these
simulations, the remaining regions that are detected as being
introgressed reflect incomplete lineage sorting. Assuming a
genome size of 2.7 Gb in mice FDR = 2.7*n/o, where n is the
number of regions detected in 1 Gb of simulated data without
migration and o is the number of observed introgressed regions in
the empirical data.
Simulations and cutoffsTo determine cutoffs for sweep statistics under a neutral scenario
we employed coalescent simulations with ms [56]. We combined
data from previous studies to generate a likely demographic scenario
[19,20,23,26,40] using the following parameters (compare inset
Figure 1 for annotation): N0 = 100,000; N1 = 10,000; 20,000;
50,000; 100,000; t0 = 1,000,000; t1 = 3,000; t2 = 10,000. We
simulated 1,000 regions of 1 Mb size for each scenario. To analyze
the expectation of introgressed haplotype length and frequency
under a neutral model we added migration between subspecies at
varying rates (4Nm = 0.001, 0.01, 0.1, 10) to the model and varied
population size between 100,000 and 10,000 representing a 10-fold
reduction in effective population size after the split of sister
populations until present.
Rejection samplingTo resemble the ascertainment scheme of the chip design in our
neutral simulations we extend an approach first introduced by
[58]. We use a rejection-sampling algorithm to ascertain a subset
of SNPs from a neutral simulation such that the frequency spectra
in the four subpopulations estimated for the ascertained SNP set
resemble those observed in the chip data. Our algorithm achieves
this by minimizing the distance
s~X
i,x
1{g�i (x)=gi(x)� �2
,
where g�i (x) is the number of SNPs in the ascertained set for which
the derived allele is at frequency x in subpopulation i, and gi(x) is
the respective observed number in the chip data. The summation
is over all four subpopulations and all population frequencies in
the data, including loss (x = 0) and fixation (x = 1) in a subpopu-
lation. We start our algorithm with an empty set of ascertained
SNPs. We then choose a random SNP from the simulation data,
add it to the ascertained set, and calculate the new s. If the new s is
smaller than the s of the set without this SNP, the SNP is kept in
the ascertained set, otherwise it is rejected. We then chose a
random SNP from the ascertained set, remove it, and check
whether this lowers s or not. If it does, the SNP is removed from
the ascertained set, otherwise it is kept. We then choose again a
random SNP from the simulation data and repeat the above
process until no further improvement in s has been achieved over a
substantial number of cycles, which we defined to be 10 times the
number of segregating sites in the simulation sample.
Other analysesData visualization was done with the UCSC genome browser
[59] for the mouse genome assembly mm9. Custom tracks were
generated for the phased haplotype data (using fastphase [55]) and
the windows identified by the different statistics. The ‘‘Tables’’
function [60] and the ‘‘Genome Graphs’’ utility were used to
calculate fractions of genome affected and to retrieve gene lists
overlapping with the respective windows. Gene lists were then
analyzed with FuncAssociate 2.0 [61] for enrichment of GO
terms. The trees shown in Figure 2 are based on Manhattan
distances. Because the polymorphisms typed with the WGDA are
not only the function of a natural mutational process, but also of
ascertainment bias, standard distance corrections like the Jukes-
Cantor model are not suitable for such a data structure.
Manhattan distances do not apply assumptions about underlying
mutational processes.
Data availabilityThe SNP data are deposited under doi:10.5061/dryad.s3h97 at
the DRYAD data repository (http://datadryad.org/)
Supporting Information
Figure S1 Further examples for sweeps and introgressed regions
based on browser tracks.
(DOCX)
Protocol S1 Statistics on the effects of filtering on SNP calling.
(DOCX)
Table S1 Results of sweep statistics and candidate gene lists.
(XLS)
Table S2 Gene Ontology (GO) over-representation analysis for
sweep gene lists.
(XLSX)
Table S3 Introgressed regions and Gene Ontology (GO) over-
representation analysis for introgressed gene lists.
(XLSX)
Acknowledgments
We thank Sonja Ihle, Tina Harr, Meike Teschke, and Francois Bonhomme
for providing DNA samples. We thank Frank Chan for the first version of
the browser tracks; Jeff Kidd for advice on data analysis; and Frank Chan,
Tina Harr, and Arne Nolte for comments on the manuscript.
Author Contributions
Conceived and designed the experiments: FS DT. Performed the
experiments: FS. Analyzed the data: FS AL PWM DAP DT. Contributed
reagents/materials/analysis tools: KT. Wrote the paper: FS DT.
References
1. Akey JM (2009) Constructing genomic maps of positive selection in humans:
Where do we go from here? Genome Research 19: 711–722.
2. Oleksyk TK, Smith MW, O’Brien SJ (2010) Genome-wide scans for footprints of
natural selection. Philosophical Transactions of the Royal Society B-Biological
Sciences 365: 185–205.
3. Sabeti PC, Schaffner SF, Fry B, Lohmueller J, Varilly P, et al. (2006) Positive
natural selection in the human lineage. Science 312: 1614–1620.
4. Tang K, Thornton KR, Stoneking M (2007) A new approach for using genome
scans to detect recent positive selection in the human genome. PLos Biol 5: e171.
doi:10.1371/journal.pbio.0050171
Selection and Introgression in the Mouse Genome
PLOS Genetics | www.plosgenetics.org 12 August 2012 | Volume 8 | Issue 8 | e1002891

5. Chen H, Patterson N, Reich D (2010) Population differentiation as a test for
selective sweeps. Genome Research 20: 393–402.6. Grossman SR, Shylakhter I, Karlsson EK, Byrne EH, Morales S, et al. (2010) A
Composite of Multiple Signals Distinguishes Causal Variants in Regions of
Positive Selection. Science 327: 883–886.7. Barton NH (2001) The role of hybridization in evolution. Molecular Ecology 10:
551–568.8. Burke JM, Arnold ML (2001) Genetics and the fitness of hybrids. Annual Review
of Genetics 35: 31–52.
9. Mallet J (2007) Hybrid speciation. Nature 446: 279–283.10. Nolte AW, Tautz D (2010) Understanding the onset of hybrid speciation. Trends
in Genetics 26: 54–58.11. Kulathinal RJ, Stevison LS, Noor MAF (2009) The Genomics of Speciation in
Drosophila: Diversity, Divergence, and Introgression Estimated Using Low-Coverage Genome Sequencing. PLoS Genet 5: e1000550. doi:10.1371/
journal.pgen.1000550
12. Green RE, Krause J, Briggs AW, Maricic T, Stenzel U, et al. (2010) A DraftSequence of the Neandertal Genome. Science 328: 710–722.
13. Song Y, Endepols S, Klemann N, Richter D, Matuschka FR, et al. (2011)Adaptive Introgression of Anticoagulant Rodent Poison Resistance by
Hybridization between Old World Mice. Current Biology 21: 1296–1301.
14. Salazar C, Baxter SW, Pardo-Diaz C, Wu G, Surridge A, et al. (2010) GeneticEvidence for Hybrid Trait Speciation in Heliconius Butterflies. PLoS Genet 6:
e1000930. doi:10.1371/journal.pgen.100093015. Ihle S, Ravaoarimanana I, Thomas M, Tautz D (2006) An analysis of signatures
of selective sweeps in natural populations of the house mouse. Molecular Biologyand Evolution 23: 790–797.
16. Teschke M, Mukabayire O, Wiehe T, Tautz D (2008) Identification of Selective
Sweeps in Closely Related Populations of the House Mouse Based onMicrosatellite Scans. Genetics 180: 1537–1545.
17. Staubach F, Teschke M, Voolstra CR, Wolf JBW, Tautz D (2010) A test of theneutral model of expression change in natural populations of house mouse
subspcies. Evolution 64: 549–560.
18. Guenet JL, Bonhomme F (2003) Wild mice: an ever-increasing contribution to apopular mammalian model. Trends in Genetics 19: 24–31.
19. Geraldes A, Basset P, Gibson B, Smith KL, Harr B, et al. (2008) Inferring thehistory of speciation in house mice from autosomal, X-linked, Y-linked and
mitochondrial genes. Molecular Ecology 17: 5349–5363.20. Rajabi-Maham H, Orth A, Bonhomme F (2008) Phylogeography and
postglacial expansion of Mus musculus domesticus inferred from mitochondrial
DNA coalescent, from Iran to Europe. Molecular Ecology 17: 627–641.21. Britton-Davidian J, Fel-Clair F, Lopez J, Alibert P, Boursot P (2005) Postzygotic
isolation between the two European subspecies of the house mouse: estimatesfrom fertility patterns in wild and laboratory-bred hybrids. Biological Journal of
the Linnean Society 84: 379–393.
22. Good JM, Handel MA, Nachman MW (2008) Asymmetry and polymorphism ofhybrid male sterility during the early stages of speciation in house mice.
Evolution 62: 50–65.23. Cucchi T, Vigne JD, Auffray JC (2005) First occurrence of the house mouse
(Mus musculus domesticus Schwarz & Schwarz, 1943) in the WesternMediterranean: a zooarchaeological revision of subfossil occurrences. Biological
Journal of the Linnean Society 84: 429–445.
24. Cucchi T, Balasescu A, Bem C, Radu V, Vigne JD, et al. (2011) New insightsinto the invasive process of the eastern house mouse (Mus musculus musculus):
Evidence from the burnt houses of Chalcolithic Romania. Holocene 21: 1195–1202.
25. Yang H, Ding YM, Hutchins LN, Szatkiewicz J, Bell TA, et al. (2009) A
customized and versatile high-density genotyping array for the mouse. NatureMethods 6: 663–U655.
26. Baines JF, Harr B (2007) Reduced X-linked diversity in derived populations ofhouse mice. Genetics 175: 1911–1921.
27. Laurie CC, Nickerson DA, Anderson AD, Weir BS, Livingston RJ, et al. (2007)
Linkage disequilibrium in wild mice. PLoS Genet 3: e144. doi:10.1371/journal.pgen.0030144
28. Shimura H, Hattori N, Kubo S, Mizuno Y, Asakawa S, et al. (2000) FamilialParkinson disease gene product, parkin, is a ubiquitin-protein ligase. Nature
Genetics 25: 302–305.29. Howe JR, Bair JL, Sayed MG, Anderson ME, Mitros FA, et al. (2001) Germline
mutations of the gene encoding bone morphogenetic protein receptor 1A in
juvenile polyposis. Nature Genetics 28: 184–187.30. Panda S, Sato TK, Castrucci AM, Rollag MD, DeGrip WJ, et al. (2002)
Melanopsin (Opn4) requirement for normal light-induced circadian phaseshifting. Science 298: 2213–2216.
31. Piras G, El Kharroubi A, Kozlov S, Escalante-Alcalde D, Hernandez L, et al.
(2000) Zac1 (Lot1), a potential tumor suppressor gene, and the gene for epsilon-sarcoglycan are maternally imprinted genes: Identification by a subtractive
screen of novel uniparental fibroblast lines. Molecular and Cellular Biology 20:3308–3315.
32. Kamiya M, Judson H, Okazaki Y, Kusakabe M, Muramatsu M, et al. (2000)The cell cycle control gene ZAC/PLAGL1 is imprinted - a strong candidate
gene for transient neonatal diabetes. Human Molecular Genetics 9: 453–460.
33. Wider C, Lincoln SJ, Heckman MG, Diehl NN, Stone JT, et al. (2009) Phactr2and Parkinson’s disease. Neuroscience Letters 453: 9–11.
34. Perry GH, Dominy NJ, Claw KG, Lee AS, Fiegler H, et al. (2007) Diet and theevolution of human amylase gene copy number variation. Nature Genetics 39:
1256–1260.
35. Matsumoto Y, Katayama K, Okamoto T, Yamada K, Takashima N, et al.
(2011) Impaired Auditory-Vestibular Functions and Behavioral Abnormalities of
Slitrk6-Deficient Mice. PLoS ONE 6: e16497. doi:10.1371/journal.-pone.0016497
36. Davydov EV, Goode DL, Sirota M, Cooper GM, Sidow A, et al. (2010)Identifying a High Fraction of the Human Genome to be under Selective
Constraint Using GERP plus. PLoS Comput Biol 6: e1001025. doi:10.1371/journal.pcbi.1001025
37. Price AL, Tandon A, Patterson N, Barnes KC, Rafaels N, et al. (2009) Sensitive
Detection of Chromosomal Segments of Distinct Ancestry in AdmixedPopulations. PLoS Genet 5: e1000519. doi:10.1371/journal.pgen.1000519
38. Morita T, Kubota H, Murata K, Nozaki M, Delarbre C, et al. (1992) Evolutionof the mouse t-haplotype - recent and worldwide introgression to Mus musculus.
Proceedings of the National Academy of Sciences of the United States ofAmerica 89: 6851–6855.
39. Hernandez RD, Kelley JL, Elyashiv E, Melton SC, Auton A, et al. (2011) ClassicSelective Sweeps Were Rare in Recent Human Evolution. Science 331: 920–
924.
40. Salcedo T, Geraldes A, Nachman MW (2007) Nucleotide variation in wild andinbred mice. Genetics 177: 2277–2291.
41. Przeworski M (2002) The signature of positive selection at randomly chosen loci.Genetics 160: 1179–1189.
42. Domazet-Loso T, Tautz D (2008) An Ancient Evolutionary Origin of GenesAssociated with Human Genetic Diseases. Molecular Biology and Evolution 25:
2699–2707.
43. Perlman RL (2011) EVOLUTIONARY BIOLOGY a basic science for
medicine in the 21st century. Perspectives in Biology and Medicine 54: 75–88.
44. Bonhomme F, Rivals E, Orth A, Grant GR, Jeffreys AJ, et al. (2007) Species-wide distribution of highly polymorphic minisatellite markers suggests past and
present genetic exchanges among House Mouse subspecies. Genome Biology 8.
45. Teeter KC, Payseur BA, Harris LW, Bakewell MA, Thibodeau LM, et al. (2008)
Genome-wide patterns of gene flow across a house mouse hybrid zone. GenomeResearch 18: 67–76.
46. Wang LY, Luzynski K, Pool JE, Janousek V, Dufkova P, et al. (2011) Measures
of linkage disequilibrium among neighbouring SNPs indicate asymmetries acrossthe house mouse hybrid zone. Molecular Ecology 20: 2985–3000.
47. Stemshorn KC, Reed FA, Nolte AW, Tautz D (2011) Rapid formation ofdistinct hybrid lineages after secondary contact of two fish species (Cottus sp.).
Molecular Ecology 20: 1475–1491.
48. White MA, Ane C, Dewey CN, Larget BR, Payseur BA (2009) Fine-Scale
Phylogenetic Discordance across the House Mouse Genome. PLoS Genet 5:e1000729. doi:10.1371/journal.pgen.1000729
49. Keane TM, Goodstadt L, Danecek P, White MA, Wong K, et al. (2011) Mouse
genomic variation and its effect on phenotypes and gene regulation. Nature 477:289–294.
50. Pool JE, Nielsen R (2009). Inference of historical changes in migration rate fromthe lengths of migrant tracts. Genetics 181: 711–719.
51. Hurst JL, Payne CE, Nevison CM, Marie AD, Humphries RE, et al. (2001)Individual recognition in mice mediated by major urinary proteins. Nature 414:
631–634.
52. Mudge JM, Armstrong SD, McLaren K, Beynon RJ, Hurst JL, et al. (2008)
Dynamic instability of the major urinary protein gene family revealed by
genomic and phenotypic comparisons between C57 and 129 strain mice.Genome Biology 9.
53. Reich D, Green RE, Kircher M, Krause J, Patterson N, et al. (2010) Genetichistory of an archaic hominin group from Denisova Cave in Siberia. Nature 468:
1053–1060.
54. Shifman S, Bell JT, Copley RR, Taylor MS, Williams RW, et al. (2006) A high-
resolution single nucleotide polymorphism genetic map of the mouse genome.
PLoS Biol 4: e395. doi:10.1371/journal.pbio.0040395
55. Scheet P, Stephens M (2006) A fast and flexible statistical model for large-scale
population genotype data: Applications to inferring missing genotypes andhaplotypic phase. American Journal of Human Genetics 78: 629–644.
56. Hudson RR (2002) Generating samples under a Wright-Fisher neutral model ofgenetic variation. Bioinformatics 18: 337–338.
57. Weir BS, Cockerham CC (1984) Estimationg F-statistics for the analysis ofpopulation structure. Evolution 38: 1358–1370.
58. Voight BF, Kudaravalli S, Wen XQ, Pritchard JK (2006) A map of recent
positive selection in the human genome. PLoS Biol 4: e72. doi:10.1371/journal.pbio.0040072
59. Kent WJ, Sugnet CW, Furey TS, Roskin KM, Pringle TH, et al. (2002) Thehuman genome browser at UCSC. Genome Research 12: 996–1006.
60. Karolchik D, Hinrichs AS, Furey TS, Roskin KM, Sugnet CW, et al. (2004) TheUCSC Table Browser data retrieval tool. Nucleic Acids Research 32: D493–
D496.
61. Berriz GF, Beaver JE, Cenik C, Tasan M, Roth FP (2009) Next generation
software for functional trend analysis. Bioinformatics 25: 3043–3044.
62. Barrett JC, Fry B, Maller J, Daly MJ (2005) Haploview: analysis andvisualization of LD and haplotype maps. Bioinformatics 21: 263–265.
Selection and Introgression in the Mouse Genome
PLOS Genetics | www.plosgenetics.org 13 August 2012 | Volume 8 | Issue 8 | e1002891