genetic selection for milk quality where are...
TRANSCRIPT
GENETIC SELECTION FOR MILK QUALITY – WHEREARE WE?
David Erf
Dairy Technical Services Geneticist
Zoetis
OVERVIEW
» The history of genetic evaluations
» The importance of direct selection for a trait
» Selection for improving mastitis today
» How the information is working in the field

HEADLINES: Holstein is ‘invisible cow': Trouble-free
animal nears lifetime milk record in just 10 lactations
Betzoldvale Scott Mar.
• 11-year-old Holstein has
produced 348,450
pounds of milk in her
lifetime (as of May 2011)
• Became pregnant on her
first service insemination
every year
www.thecountrytoday.com/front_page/article_ec780704-86d1-11e0-8571-
001cc4c002e0.html Accessed January 2, 2016

RECOVERING HEIFER RAISING COSTS TAKES TIME
Adapted from Ferguson and Galligan, WCDS, 1995.

LONGEVITY-DRIVEN PROFIT
0%
5%
10%
15%
20%
25%
30%
35%
40%
45%
70
75
80
85
90
95
100
105
110
115
1 2 3 4 5 6 7 8
% o
f To
tal
Milk
/Co
w/D
ay u
sin
g 3
05
M
Parity Group
Performance and Percent of Herd by ParityCows >100DIM
Milk/Day
% of Herd
Data on file, Dec. 2015 Herd example, Zoetis, Inc.

IMPACT OF MORBIDITY IS SIGNIFICANT IN DAIRY COWS
Incidence per
Lactation Range
Cost ($) per
Case
Culling
Risk1 (%)
Displaced Abomasum 3-5% 1,2,3,4,13 $494 4 26.9
Ketosis 5-14% 1,3,4,13 $117-289 4,5 32.5
Lameness 10-48% 2,4,6,13 $177-469 4,7 16 2
Mastitis 12-40% 1,2,3,4,8,13 $155-224 4,8,9 32.7
Metritis 2-37% 1,3,10,11,13 $300-358 10,11 17.1
Retained Placenta 5-15% 1,2,3,4,11,12 $206-315 4,12 31.71 Grohn, Y. et al. 1998. Effect of Diseases on the Culling of Holstein Dairy Cows in New York State. J. of Dairy Sci, 81(4):966-978.2 USDA. 2008. Dairy 2007, Part II: Changes in the U.S. Dairy Cattle Industry, 1991–2007 USDA-APHIS-VS, CEAH. Fort Collins, CO #N481.0311.3 Bar, D., et al. 2007. Effect of repeated episodes of generic clinical mastitis on milk yield in dairy cows. Journal of dairy science 90(10):4643-4653.4 Guard, C. 2009. The costs of common diseases of dairy cattle. Central Veterinary Conference Proceedings. Kansas City, MO..5 McArt, J.A. et al, 2015. Hyperketonemia in early lactation dairy cattle: a deterministic estimate of component and total cost per case. J. of Dairy Sci. 98(3):2043-2054.e Bicalho, R.C. Lameness in Dairy Cattle: A debilitating disease or a Disease of Debilitated Cattle? Western Dairy Management Conference, 2011. Pg 73-83.7 Cha, E. et al. 2010. The cost of different types of lameness in dairy cows calculated by dynamic programming. Preventive veterinary medicine 97(1):1-8.8 Cha, E, et al. 2014. Optimal insemination and replacement decisions to minimize the cost of pathogen-specific clinical mastitis in dairy cows. Journal of dairy science 97(4):2101-2117.9 Cha, E, et al. 2011. The cost and management of different types of clinical mastitis in dairy cows estimated by dynamic programming. Journal of dairy science 94(9):4476-4487.10 Overton, M. and J. Fetrow. 2008. Economics of postpartum uterine health. Proc Dairy Cattle Reproduction Council:39-44.11 "The Value of Uterine Health: the diseases, the causes, and the financial implications." Dairy Cattle Reproduction Council article.12 Guard, C., 1999. Retained Placenta: Causes and Treatments. Advances in Dairy Technology (1999) Vol. 11, page 81.13 Zwald, N.R., K.A. Weigel, Y.M. Chang, R.D. Welper and J.S. Clay. 2004. Genetic selection of Health Traits using Producer-Recorded Data. I. Incidence Rates, Heritability Estimates and Sire
Breeding Values. J. of Dairy Sci., 87:4287-4294.

THE HISTORY OF NEW TRAITS IN GENETIC EVALUATIONS
» Prior to 1994 – Milk, Fat, Protein and Type
» 1994 – Net Merit (NM$), SCS, Productive Life (PL)
» 2003 – Daughter Pregnancy Rate (DPR)
» 2008 – Stillbirth – Daughter and Sire
» 2011 – Heifer Conception Rate (HCR), Cow Conception Rate
(CCR)
» 2016 - Livability

WELLNESS IS NOW A
PROFITABLE CHOICE

CLARIFIDE® PLUS FOR HOLSTEINS
CDCB Official Evaluation
• Parentage
• Production
• Reproduction
• Health
• Type
Wellness Traits
• Mastitis
• Lameness
• Metritis
• Retained Placenta
• Displaced Abomasum
• Ketosis
Genetic Conditions
• Polled (no fee)
• Milk Components
• Infertility Haplotypes
• Other genetic conditions*
* CVM, Brachyspina and Beta Casein
A2 available with add-on fee.
DWP$TM
Animal Ranking

CREATING WELLNESS TRAIT GENOMIC PREDICTIONS
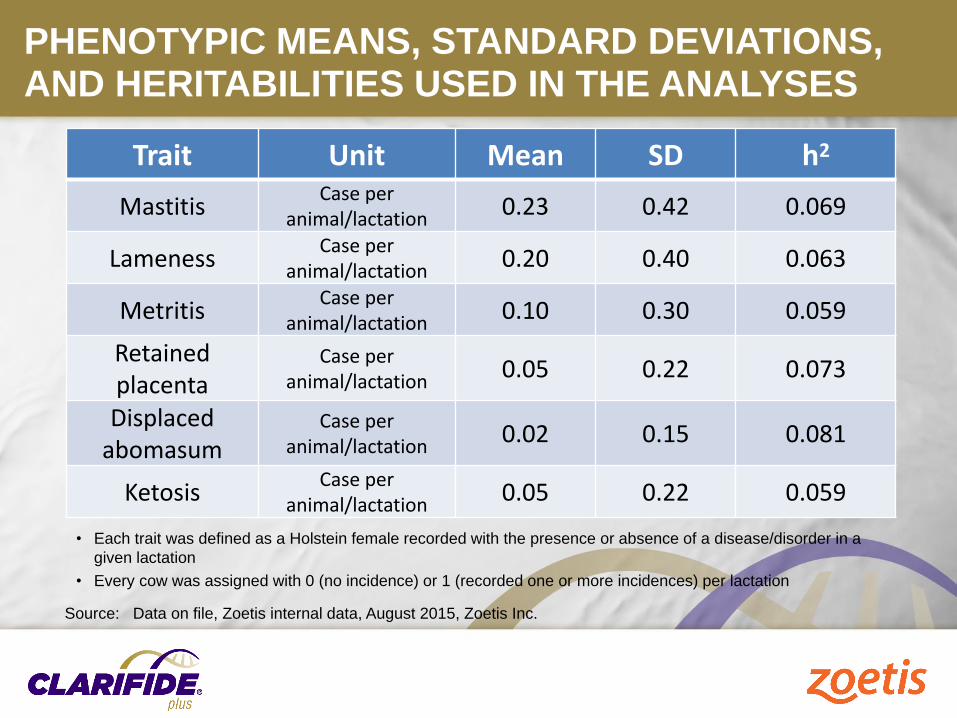
PHENOTYPIC MEANS, STANDARD DEVIATIONS, AND HERITABILITIES USED IN THE ANALYSES
Trait Unit Mean SD h2
MastitisCase per
animal/lactation0.23 0.42 0.069
LamenessCase per
animal/lactation0.20 0.40 0.063
MetritisCase per
animal/lactation0.10 0.30 0.059
Retained placenta
Case per animal/lactation
0.05 0.22 0.073
Displaced abomasum
Case per animal/lactation
0.02 0.15 0.081
KetosisCase per
animal/lactation0.05 0.22 0.059
• Each trait was defined as a Holstein female recorded with the presence or absence of a disease/disorder in a
given lactation
• Every cow was assigned with 0 (no incidence) or 1 (recorded one or more incidences) per lactation
Source: Data on file, Zoetis internal data, August 2015, Zoetis Inc.

MILLIONS OF RECORDS CONTRIBUTE TO AVERAGE RELIABILITIES OF 49 OR HIGHER
Trait
Reliabilities (%) of young genotyped and
pedigreed females
GPTA ReliabilityTraditional Parent
Average Reliability
MAST 51 19
LAME 50 18
METR 49 17
RETP 50 17
DA 49 16
KET 50 16
29,901 heifer observations (<2 years old)
Source: Data on file, Zoetis internal data, August 2015, Zoetis Inc.
Reliabilities are similar or better than Reliability of some core CDCB traits (i.e. HCR & DSB)
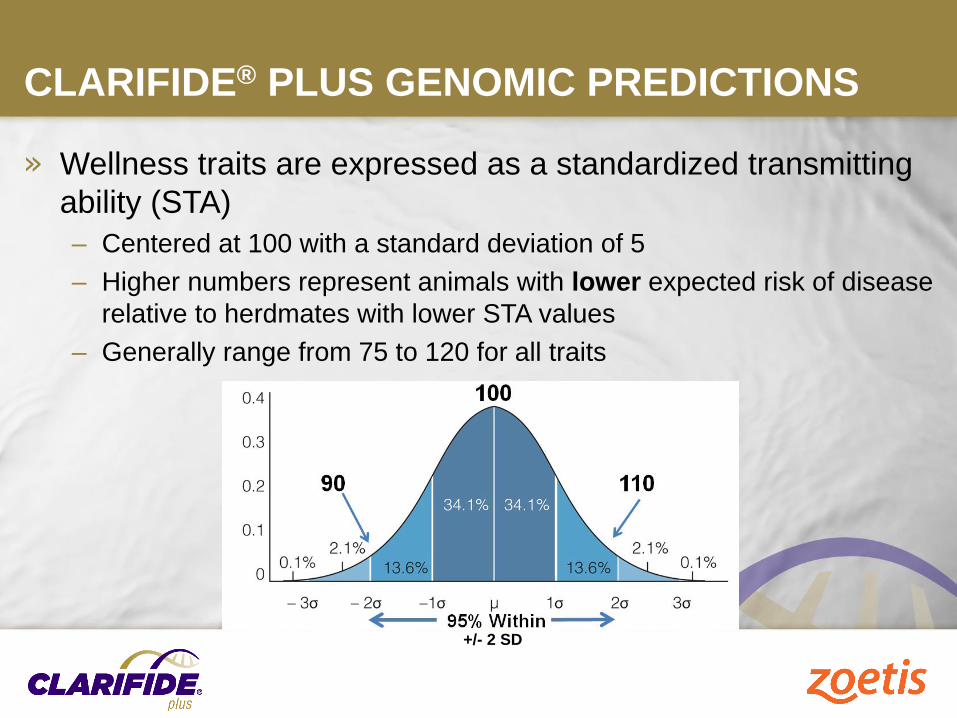
CLARIFIDE® PLUS GENOMIC PREDICTIONS
» Wellness traits are expressed as a standardized transmitting
ability (STA)
– Centered at 100 with a standard deviation of 5
– Higher numbers represent animals with lower expected risk of disease
relative to herdmates with lower STA values
– Generally range from 75 to 120 for all traits
+/- 2 SD

SOMATIC CELL SCORE FOR HOLSTEIN’S HAS BEEN IMPROVING OVER TIME
Data on file, Enlight herd data, Accessed Dec 2015, Zoetis Inc.
Genetic Progress for SCS (heritability = 0.12)
0
10
20
30
40
50
60
70
1996 2001 2007
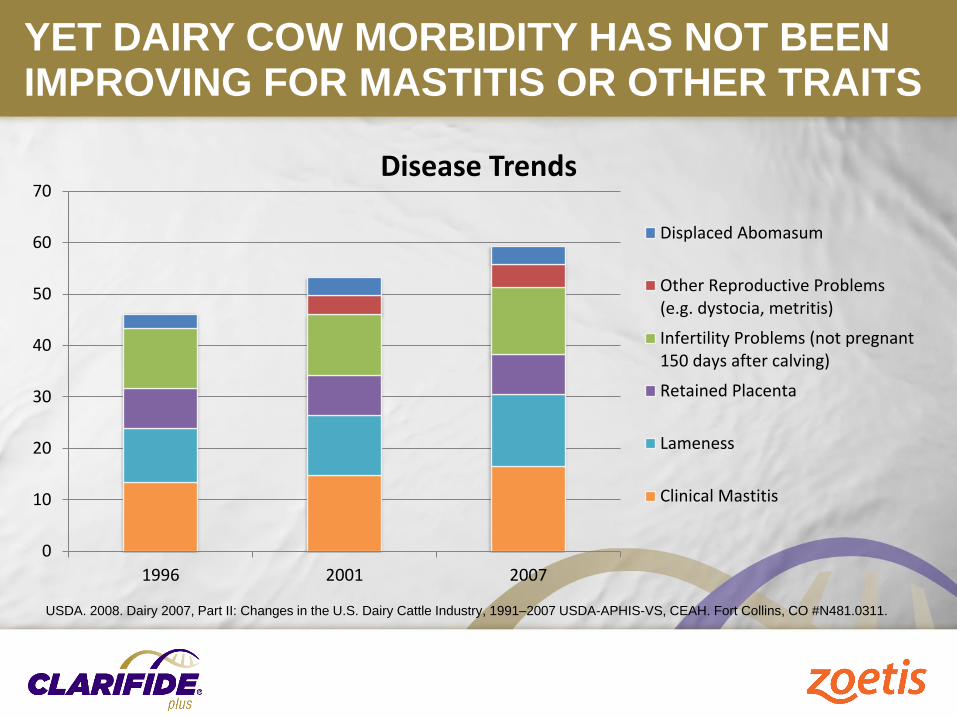
Disease Trends
Displaced Abomasum
Other Reproductive Problems(e.g. dystocia, metritis)
Infertility Problems (not pregnant150 days after calving)
Retained Placenta
Lameness
Clinical Mastitis
YET DAIRY COW MORBIDITY HAS NOT BEEN IMPROVING FOR MASTITIS OR OTHER TRAITS
USDA. 2008. Dairy 2007, Part II: Changes in the U.S. Dairy Cattle Industry, 1991–2007 USDA-APHIS-VS, CEAH. Fort Collins, CO #N481.0311.

SOME TRAITS HAVE HIGH CORRELATION BETWEEN
EACH OTHER, LIKE MILK AND PROTEIN
0
10
20
30
40
50
60
70
-500 0 500 1000 1500 2000
GP
TA
Pro
tein
[lb
s]
GPTA Milk [lbs]
Correlation in Breed = 0.83a
Observed Correlation=0.81
a http://aipl.arsusda.gov/reference/nmcalc-2014.htm, Accessed Dec. 15, 2015
Data on file, Dec. 2014 Data package n = 30, Zoetis Inc.
Yet selecting for Protein, to get more protein, is best

SOME TRAITS HAVE MEDIUM OR LOW CORRELATION, LIKE MILK AND FAT
0
10
20
30
40
50
60
70
80
90
100
-500 0 500 1000 1500 2000
GP
TA
Fat
[lb
s]
GPTA Milk [lbs]
Correlation in Breed = 0.43a
Observed Correlation=0.20
a http://aipl.arsusda.gov/reference/nmcalc-2014.htm, Accessed Dec. 15, 2015
Data on file, Dec. 2014 Data package n = 30, Zoetis Inc.
Here direct selection for Fat is highly necessary if you want to improve fat

BOTTOM LINE, DIRECT SELECTION IS BEST!
» To make the most genetic and phenotypic progress in a trait,
use direct selection, not indirect
» Examples:
Goal Indirect
trait
Direct trait Estimated
correlation
Improve
reproductionPL
Daughter Pregnancy Rate
(DPR)0.64
Reduce mastitis
casesSCS New genomic Mastitis trait -0.45
Reduce
lameness
PL New genomic Lameness trait 0.28
FLC New genomic Lameness trait 0.00
Reduce metritis PL New genomic Metritis trait 0.32
Source: Data on file, Zoetis internal data, August 2015, Zoetis Inc.

DIRECT SELECTION IS BEST!
Genomic Prediction – Quintiles
Ave
rag
e D
ise
as
e In
cid
en
ce
• Data includes Ref.
Pop. n= 76K
• Not useful for
validation purposes
since phenotypic
records are
contributing to the
Mastitis Prediction
• Good example we
can expect from
the validation data
of how direct
selection is best
Genomic Mastitis vs GPTA for SCS
Source: Data on file, Zoetis internal data, August 2015, Zoetis Inc.
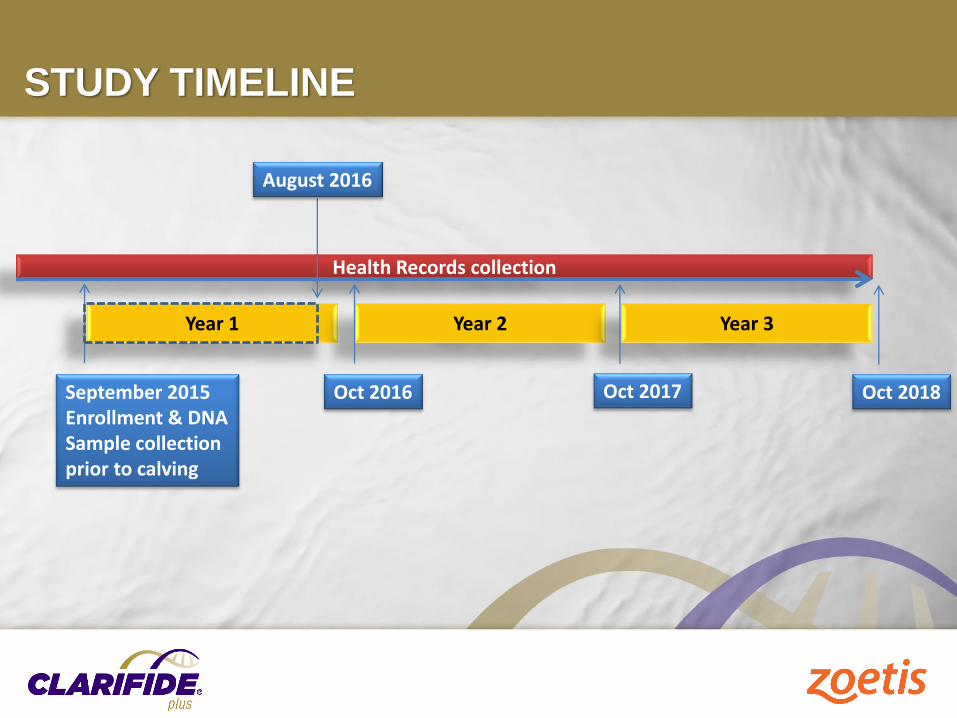
STUDY TIMELINE
Health Records collection
Year 1 Year 2 Year 3
September 2015Enrollment & DNA Sample collection prior to calving
Oct 2016 Oct 2017 Oct 2018
August 2016

DISTRIBUTION OF ENROLLED HERDS

LOCATION AND SAMPLING OF ANIMALS
Herd State Number of Sampled Animals
1 MI 3182 MN 3083 ID 3444 CA 3505 CA 3506 WI 2927 NY 2538 GA 3059 CA 334
10 WI 36311 ID 350
Animals Sampled 3567
Animals eliminated* -692
Animals included in the study 2875(66% Nulliparous, 33% Primiparous)
Source: Data on file, Zoetis internal data, October 2016, Zoetis Inc.
* Animals eliminated due to calving date outside desired window, breed conflict, sample failures

DEFINING AFFECTED AND HEALTHY RECORDS
First and second lactation records were assigned to one of three possible phenotypes by trait:
1. “Healthy” (0): no documented incidence of the health event before 306 DIM
2. “Diseased” (1): a documented incidence of the health event before 306 DIM
3. “Excluded” (.): missing lactation record and/or animals that were healthy and sold/died before the 90th percentile DIM by trait
Calving
DIM 0305 Day Lactation
RP
4 DIM
METR
DIM 9
MAST
DIM 250
KET
DIM 16
LAME
DIM 265DA
DIM 66

ASSOCIATION BETWEEN MAST STA GROUPS AND MASTITIS EVENTS
15.9%A
11.2%B11.1%B
8.5%C
92.3W
97.7X
101.1Y
105.2Z
85
90
95
100
105
110
0.0%
5.0%
10.0%
15.0%
20.0%
Worst 25% 26-50% 51-76% Best 25%
LS-M
eas
STA
Mar
gin
al M
ean
s
Genetic Groups
Source: Data on file, Zoetis internal data, October 2016, Zoetis Inc.
Prevalence: P<0.0001; STA: P<0.0001

15.9%A
11.2%B11.1%B
8.5%C
92.3W
97.7X
101.1Y
105.2Z
85
90
95
100
105
110
0.0%
5.0%
10.0%
15.0%
20.0%
Worst 25% 26-50% 51-76% Best 25%
LS-M
eas
STA
Mar
gin
al M
ean
s
Genetic Groups
ASSOCIATION BETWEEN MAST STA GROUPS AND MASTITIS EVENTS
Genetic Group Est. Cost per Cow5
Bottom 25% $35.7426-50% $25.0751-75% $24.71Top 25% $18.81
5 Cha et al ., 2011. Journal of Dairy Science 94(9):4476-4487.
Source: Data on file, Zoetis internal data, October 2016, Zoetis Inc.
Prevalence: P<0.0001; STA: P<0.0001

EXPECTED PHENOTYPIC PREVALENCE IN FIRST LACTATION
Source: Data on file, Zoetis internal data, October 2016, Zoetis Inc.
0%
5%
10%
15%
20%
25%
30%
35%
40%
90 91 92 93 94 95 96 97 98 99 100 101 102 103 104 105 106 107 108 109 110
MetritisMastitisLameness

SUMMARY AND CONCLUSIONS
» We have made great progress genetically on Somatic Cell Score –
It has been and continues to be a good tool.
» But, we have a new tool for genetic selection for lower incidences
of mastitis and it is working out in the field.
» To make the most progress in reducing mastitis – it will take a
combination of the best management practices along with a focus
on the genetic side to give the best results.