genetic population differentiation and connectivity among ... · research article genetic...
TRANSCRIPT
RESEARCH ARTICLE
Genetic population differentiation and connectivity amongfragmented Moor frog (Rana arvalis) populationsin The Netherlands
Paul Arens Æ Theo van der Sluis ÆWendy P. C. van’t Westende Æ Ben Vosman ÆClaire C. Vos Æ Marinus J. M. Smulders
Received: 4 October 2006 / Accepted: 16 July 2007
� Springer Science+Business Media B.V. 2007
Abstract We studied the effects of landscape
structure, habitat loss and fragmentation on genetic
differentiation of Moor frog populations in two
landscapes in The Netherlands (Drenthe and Noord-
Brabant). Microsatellite data of eight loci showed
small to moderate genetic differentiation among
populations in both landscapes (FST values 0.022
and 0.060, respectively). Both heterozygosity and
population differentiation indicate a lower level of
gene flow among populations in Noord-Brabant,
where populations were further apart and have
experienced a higher degree of fragmentation for a
longer period of time as compared to populations in
Drenthe. A significant isolation-by-distance pattern
was found in Drenthe, indicating a limitation in
dispersal among populations due to geographic
distance. In Noord-Brabant a similar positive corre-
lation was obtained only after the exclusion of a
single long-time isolated population. After randomised
exclusion of populations a significant additional neg-
ative effect of roads was found but not of other
landscape elements. These results are discussed in
view of improving methodology of assessing the
effects of landscape elements on connectivity.
Keywords SSRs � Molecular markers �Habitat fragmentation � Genetic diversity �Landscape history � Amphibians � Time delay �Landscape scale
Introduction
Habitat fragmentation is a threat to the survival of
wildlife populations, as isolated populations are
more susceptible to demographic and genetic sto-
chasticity. This can be compensated by dispersal of
individuals among populations, as long as there is
sufficient connectivity between habitat patches. Such
a habitat network may effectively form a meta-
population. Therefore, quantifying dispersal and the
degree to which different parts of the landscape
matrix between suitable habitat patches facilitate or
impede movements (Ricketts 2001), has a high
research priority in conservation biology (Wiens
1997; Rickets 2001). Dispersal may be measured by
direct field methods, but this is costly and time-
consuming and suffers from a number of limitations
(Crochet 1996; Vos et al. 2002). In particular
Electronic supplementary material The online versionof this article (doi:10.1007/s10980-007-9132-4) containssupplementary material, which is available to authorized users.
P. Arens (&) � W. P. C. van’t Westende �B. Vosman � M. J. M. Smulders
Department of Biodiversity and Breeding, Plant Research
International, Wageningen UR, P.O. Box 16, 6700 AA
Wageningen, The Netherlands
e-mail: [email protected]
T. van der Sluis � C. C. Vos
Department of Landscape Ecology, Alterra, Wageningen
UR, P.O. Box 47, 6700 AA Wageningen, The Netherlands
123
Landscape Ecol
DOI 10.1007/s10980-007-9132-4
long-distance dispersal, which is an important factor
determining extinction rate and recolonisation suc-
cess, is difficult to measure directly. Dispersal can
also be estimated from population genetic analyses
(Neigel 1997), although these estimates may reflect
the historical rather than the present day situation.
Nevertheless, assessment of population genetic
structure and especially combined population genet-
ics with landscape ecology in a landscape genetic
approach (Manel et al. 2003; Holderegger and
Wagner 2006), can improve our understanding of
the effects of habitat fragmentation.
In The Netherlands, habitat fragmentation for
small ground-dwelling animal species with limited
dispersal capacity is relatively recent. An example of
such a species is the Moor frog (Rana arvalis
Nilsson). The aquatic habitat of the Moor frog
consists of moorland ponds and swamps. Its terres-
trial habitat consists mainly of moorlands but also
includes hedgerows and mixed woods with a well-
developed herb layer. Moor frogs occur mainly in
moorlands in the southern and eastern parts of The
Netherlands. Habitat loss, fragmentation and intensi-
fication of land use in these areas started in the first
half of the previous century. As Moor frogs become
adult in their third year of life, a relatively low
number of 30 to 40 (overlapping) generations has
passed since habitats became fragmented. Due to the
time lag involved in genetic differentiation through
drift, a new equilibrium between migration and
genetic drift may not have been reached yet. Conse-
quently, overall population differentiation might still
be low even if habitat fragmentation at present is
severe (Bossart and Prowell 1998).
Nevertheless using a permeability model, Vos
et al. (2001) showed that genetic effects of fragmen-
tation on small spatial scales and in a short time span
(65 years) could already be detected in Rana arvalis.
Although overall population differentiation was low,
barriers (roads and railways) between populations
emerged as a distinct factor that reduced gene flow
among populations. In the present study, we set out to
test whether this approach is broadly useful and
whether a significant correlation between genetic
differentiation of populations and landscape elements
depends on specific properties (scale and topology) of
the studied landscape. We used two study landscapes
(Drenthe and Noord-Brabant) that differ in landscape
scale and degree of landscape fragmentation.
Material and methods
General description of study areas
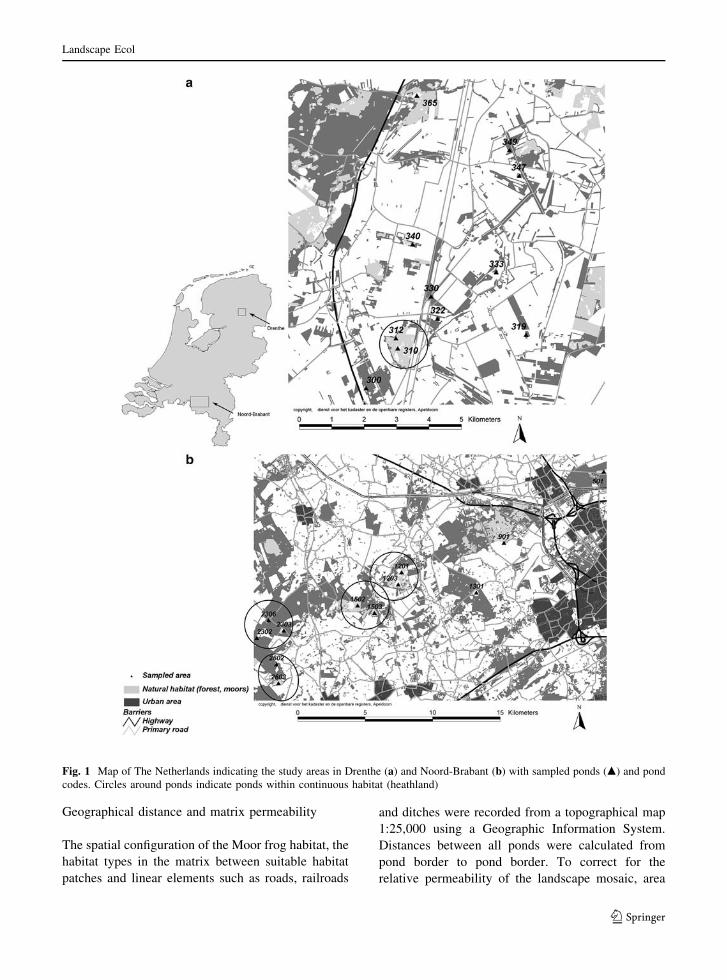
The study was conducted in Drenthe and Noord-
Brabant, two provinces in The Netherlands (Fig. 1)
that formerly contained large, continuous areas of
Moor frog suitable habitat. Currently, Moor frog
habitat has been strongly reduced in area and
increased in fragmentation. Noord-Brabant and Dren-
the differ in their extent of habitat fragmentation. The
average distance among ponds in Noord-Brabant
(8629 m) is almost twice the distance among ponds in
Drenthe (4612 m). In addition, matrix permeability is
lower in Noord-Brabant because of higher farming
intensity, urbanisation, road density and traffic
intensity (Van der Sluis and Vos 1997). Furthermore,
reproductive sites in Noord-Brabant have become
less favourable for Moor frogs due to water pollution
as a result of intensive agriculture (Hoogerwerf and
Crombaghs 1993).
The timing and speed of habitat fragmentation in
both study areas was derived from historic maps
(Historische atlas Drenthe/Noord-Brabant 1989).
Until the mid-19th century, Noord-Brabant formed
a vast plain, with heathlands, moors and forests, often
grazed by sheep. By 1922, some 55% of the area was
cultivated. By the 1950s, only 10% of the area
remained natural. At present, land use is a mixture of
livestock grazing and arable farming, and less than
10% of the surface area is still natural habitat. Hence,
the transition of largely natural habitat to cultivated
land in Noord-Brabant took place in the early 20th
century, in a period of about 50 years. The study area
in Drenthe was still unfragmented until 1932. The
only infrastructure was a railway running through the
area; otherwise, heathlands and moors were well
connected. However, the map from 1950 showed that
about 50% of the area had been converted into
agricultural land. In 1957, the landscape had almost
reached its present shape and land use was predom-
inantly arable farming. Many of the remaining ponds
are nowadays situated in small patches of natural
areas of a few hectares, with the exception of ponds
310, 312 and 365, which are located in extensive
moorland complexes (Fig. 1). This means that land
transformation in Drenthe took place between 1930
and 1950, in a relative short period of 20 years and is
more recent than in Noord-Brabant.
Landscape Ecol
123
Geographical distance and matrix permeability
The spatial configuration of the Moor frog habitat, the
habitat types in the matrix between suitable habitat
patches and linear elements such as roads, railroads
and ditches were recorded from a topographical map
1:25,000 using a Geographic Information System.
Distances between all ponds were calculated from
pond border to pond border. To correct for the
relative permeability of the landscape mosaic, area
Fig. 1 Map of The Netherlands indicating the study areas in Drenthe (a) and Noord-Brabant (b) with sampled ponds (m) and pond
codes. Circles around ponds indicate ponds within continuous habitat (heathland)
Landscape Ecol
123
and length of habitat types and linear landscape
elements were calculated in a 200 m wide strip
between ponds (Vos et al. 2001). Area types that are
avoided by Moor frogs, such as dry and open areas
(Hartung 1991), agricultural land and developed
areas, or those that form potential barriers, such as
roads and railroads, were considered negative land-
scape elements reducing permeability of the
landscape. Four road types were distinguished: four
lane motorways, secondary roads ([7 m wide),
tertiary roads (4–7 m wide) and quaternary roads
(paved roads\4 m wide). To aggregate the effects of
all road types, road lengths were multiplied with a
factor (mean traffic volume) to correct for traffic
intensity as compared to quaternary roads (Vos and
Chardon 1998; Van der Sluis and Vos 1997). Habitat
types preferred by Moor frogs (Hartung 1991) were
regarded as positive landscape elements improving
matrix permeability (Forman 1995). These included
deciduous forest, mixed forest, hedgerows and
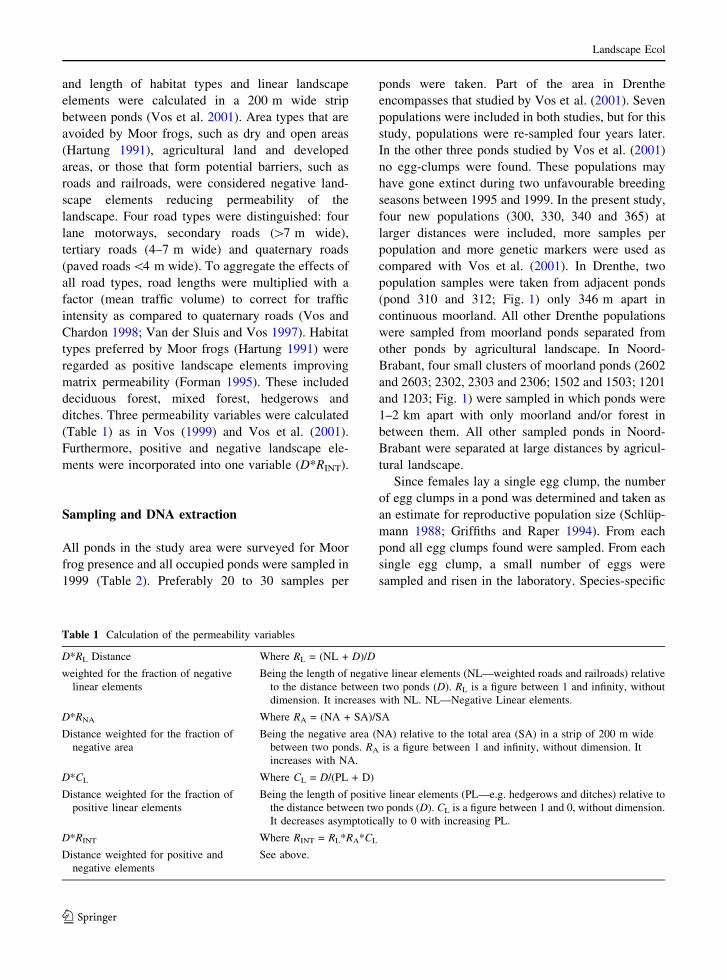
ditches. Three permeability variables were calculated
(Table 1) as in Vos (1999) and Vos et al. (2001).
Furthermore, positive and negative landscape ele-
ments were incorporated into one variable (D*RINT).
Sampling and DNA extraction
All ponds in the study area were surveyed for Moor
frog presence and all occupied ponds were sampled in
1999 (Table 2). Preferably 20 to 30 samples per
ponds were taken. Part of the area in Drenthe
encompasses that studied by Vos et al. (2001). Seven
populations were included in both studies, but for this
study, populations were re-sampled four years later.
In the other three ponds studied by Vos et al. (2001)
no egg-clumps were found. These populations may
have gone extinct during two unfavourable breeding
seasons between 1995 and 1999. In the present study,
four new populations (300, 330, 340 and 365) at
larger distances were included, more samples per
population and more genetic markers were used as
compared with Vos et al. (2001). In Drenthe, two
population samples were taken from adjacent ponds
(pond 310 and 312; Fig. 1) only 346 m apart in
continuous moorland. All other Drenthe populations
were sampled from moorland ponds separated from
other ponds by agricultural landscape. In Noord-
Brabant, four small clusters of moorland ponds (2602
and 2603; 2302, 2303 and 2306; 1502 and 1503; 1201
and 1203; Fig. 1) were sampled in which ponds were
1–2 km apart with only moorland and/or forest in
between them. All other sampled ponds in Noord-
Brabant were separated at large distances by agricul-
tural landscape.
Since females lay a single egg clump, the number
of egg clumps in a pond was determined and taken as
an estimate for reproductive population size (Schlup-
mann 1988; Griffiths and Raper 1994). From each
pond all egg clumps found were sampled. From each
single egg clump, a small number of eggs were
sampled and risen in the laboratory. Species-specific
Table 1 Calculation of the permeability variables
D*RL Distance Where RL = (NL + D)/D
weighted for the fraction of negative
linear elements
Being the length of negative linear elements (NL—weighted roads and railroads) relative
to the distance between two ponds (D). RL is a figure between 1 and infinity, without
dimension. It increases with NL. NL—Negative Linear elements.
D*RNA Where RA = (NA + SA)/SA
Distance weighted for the fraction of
negative area
Being the negative area (NA) relative to the total area (SA) in a strip of 200 m wide
between two ponds. RA is a figure between 1 and infinity, without dimension. It
increases with NA.
D*CL Where CL = D/(PL + D)
Distance weighted for the fraction of
positive linear elements
Being the length of positive linear elements (PL—e.g. hedgerows and ditches) relative to
the distance between two ponds (D). CL is a figure between 1 and 0, without dimension.
It decreases asymptotically to 0 with increasing PL.
D*RINT Where RINT = RL*RA*CL
Distance weighted for positive and
negative elements
See above.
Landscape Ecol
123
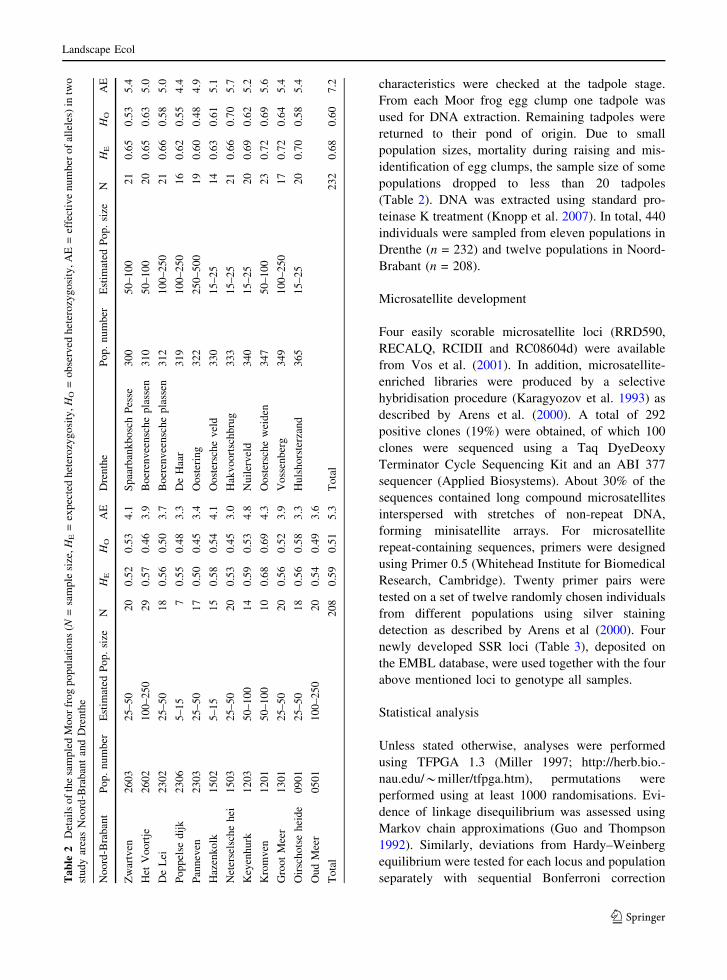
characteristics were checked at the tadpole stage.
From each Moor frog egg clump one tadpole was
used for DNA extraction. Remaining tadpoles were
returned to their pond of origin. Due to small
population sizes, mortality during raising and mis-
identification of egg clumps, the sample size of some
populations dropped to less than 20 tadpoles
(Table 2). DNA was extracted using standard pro-
teinase K treatment (Knopp et al. 2007). In total, 440
individuals were sampled from eleven populations in
Drenthe (n = 232) and twelve populations in Noord-
Brabant (n = 208).
Microsatellite development
Four easily scorable microsatellite loci (RRD590,
RECALQ, RCIDII and RC08604d) were available
from Vos et al. (2001). In addition, microsatellite-
enriched libraries were produced by a selective
hybridisation procedure (Karagyozov et al. 1993) as
described by Arens et al. (2000). A total of 292
positive clones (19%) were obtained, of which 100
clones were sequenced using a Taq DyeDeoxy
Terminator Cycle Sequencing Kit and an ABI 377
sequencer (Applied Biosystems). About 30% of the
sequences contained long compound microsatellites
interspersed with stretches of non-repeat DNA,
forming minisatellite arrays. For microsatellite
repeat-containing sequences, primers were designed
using Primer 0.5 (Whitehead Institute for Biomedical
Research, Cambridge). Twenty primer pairs were
tested on a set of twelve randomly chosen individuals
from different populations using silver staining
detection as described by Arens et al (2000). Four
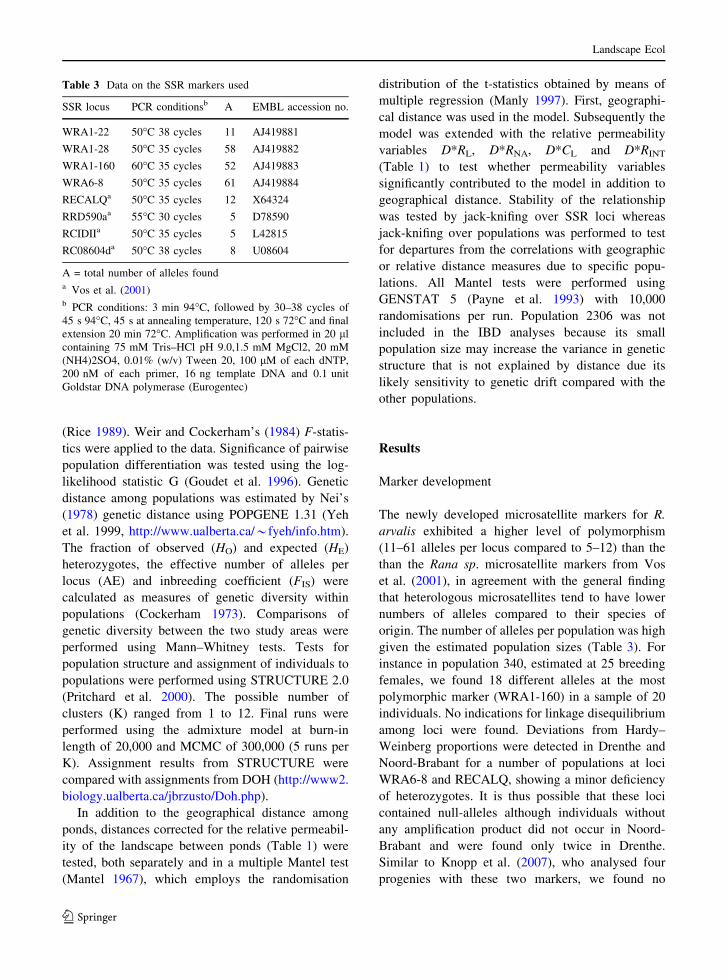
newly developed SSR loci (Table 3), deposited on
the EMBL database, were used together with the four
above mentioned loci to genotype all samples.
Statistical analysis
Unless stated otherwise, analyses were performed
using TFPGA 1.3 (Miller 1997; http://herb.bio.-
nau.edu/*miller/tfpga.htm), permutations were
performed using at least 1000 randomisations. Evi-
dence of linkage disequilibrium was assessed using
Markov chain approximations (Guo and Thompson
1992). Similarly, deviations from Hardy–Weinberg
equilibrium were tested for each locus and population
separately with sequential Bonferroni correctionTa
ble
2D
etai
lso
fth
esa
mp
led
Mo
or
fro
gp
op
ula
tio
ns
(N=
sam
ple
size
,H
E=
exp
ecte
dh
eter
ozy
go
sity
,H
O=
ob
serv
edh
eter
ozy
go
sity
,A
E=
effe
ctiv
en
um
ber
of
alle
les)
intw
o
stu
dy
area
sN
oo
rd-B
rab
ant
and
Dre
nth
e
No
ord
-Bra
ban
tP
op
.n
um
ber
Est
imat
edP
op
.si
zeN
HE
HO
AE
Dre
nth
eP
op
.n
um
ber
Est
imat
edP
op
.si
zeN
HE
HO
AE
Zw
artv
en2
60
32
5–
50
20
0.5
20
.53
4.1
Sp
aarb
ank
bo
sch
Pes
se3
00
50
–1
00
21
0.6
50
.53
5.4
Het
Vo
ort
je2
60
21
00
–2
50
29
0.5
70
.46
3.9
Bo
eren
vee
nsc
he
pla
ssen
31
05
0–
10
02
00
.65
0.6
35
.0
De
Lei
23
02
25
–5
01
80
.56
0.5
03
.7B
oer
env
een
sch
ep
lass
en3
12
10
0–
25
02
10
.66
0.5
85
.0
Po
pp
else
dij
k2
30
65
–1
57
0.5
50
.48
3.3
De
Haa
r3
19
10
0–
25
01
60
.62
0.5
54
.4
Pan
nev
en2
30
32
5–
50
17
0.5
00
.45
3.4
Oo
ster
ing
32
22
50
–5
00
19
0.6
00
.48
4.9
Haz
enk
olk
15
02
5–
15
15
0.5
80
.54
4.1
Oo
ster
sch
ev
eld
33
01
5–
25
14
0.6
30
.61
5.1
Net
erse
lsch
eh
ei1
50
32
5–
50
20
0.5
30
.45
3.0
Hak
vo
ort
sch
bru
g3
33
15
–2
52
10
.66
0.7
05
.7
Key
enh
urk
12
03
50
–1
00
14
0.5
90
.53
4.8
Nu
iler
vel
d3
40
15
–2
52
00
.69
0.6
25
.2
Kro
mv
en1
20
15
0–
10
01
00
.68
0.6
94
.3O
ost
ersc
he
wei
den
34
75
0–
10
02
30
.72
0.6
95
.6
Gro
ot
Mee
r1
30
12
5–
50
20
0.5
60
.52
3.9
Vo
ssen
ber
g3
49
10
0–
25
01
70
.72
0.6
45
.4
Oir
sch
ots
eh
eid
e0
90
12
5–
50
18
0.5
60
.58
3.3
Hu
lsh
ors
terz
and
36
51
5–
25
20
0.7
00
.58
5.4
Ou
dM
eer
05
01
10
0–
25
02
00
.54
0.4
93
.6
To
tal
20
80
.59
0.5
15
.3T
ota
l2
32
0.6
80
.60
7.2
Landscape Ecol
123
(Rice 1989). Weir and Cockerham’s (1984) F-statis-
tics were applied to the data. Significance of pairwise
population differentiation was tested using the log-
likelihood statistic G (Goudet et al. 1996). Genetic
distance among populations was estimated by Nei’s
(1978) genetic distance using POPGENE 1.31 (Yeh
et al. 1999, http://www.ualberta.ca/*fyeh/info.htm).
The fraction of observed (HO) and expected (HE)
heterozygotes, the effective number of alleles per
locus (AE) and inbreeding coefficient (FIS) were
calculated as measures of genetic diversity within
populations (Cockerham 1973). Comparisons of
genetic diversity between the two study areas were
performed using Mann–Whitney tests. Tests for
population structure and assignment of individuals to
populations were performed using STRUCTURE 2.0
(Pritchard et al. 2000). The possible number of
clusters (K) ranged from 1 to 12. Final runs were
performed using the admixture model at burn-in
length of 20,000 and MCMC of 300,000 (5 runs per
K). Assignment results from STRUCTURE were
compared with assignments from DOH (http://www2.
biology.ualberta.ca/jbrzusto/Doh.php).
In addition to the geographical distance among
ponds, distances corrected for the relative permeabil-
ity of the landscape between ponds (Table 1) were
tested, both separately and in a multiple Mantel test
(Mantel 1967), which employs the randomisation
distribution of the t-statistics obtained by means of
multiple regression (Manly 1997). First, geographi-
cal distance was used in the model. Subsequently the
model was extended with the relative permeability
variables D*RL, D*RNA, D*CL and D*RINT
(Table 1) to test whether permeability variables
significantly contributed to the model in addition to
geographical distance. Stability of the relationship
was tested by jack-knifing over SSR loci whereas
jack-knifing over populations was performed to test
for departures from the correlations with geographic
or relative distance measures due to specific popu-
lations. All Mantel tests were performed using
GENSTAT 5 (Payne et al. 1993) with 10,000
randomisations per run. Population 2306 was not
included in the IBD analyses because its small
population size may increase the variance in genetic
structure that is not explained by distance due its
likely sensitivity to genetic drift compared with the
other populations.
Results
Marker development
The newly developed microsatellite markers for R.
arvalis exhibited a higher level of polymorphism
(11–61 alleles per locus compared to 5–12) than the
than the Rana sp. microsatellite markers from Vos
et al. (2001), in agreement with the general finding
that heterologous microsatellites tend to have lower
numbers of alleles compared to their species of
origin. The number of alleles per population was high
given the estimated population sizes (Table 3). For
instance in population 340, estimated at 25 breeding
females, we found 18 different alleles at the most
polymorphic marker (WRA1-160) in a sample of 20
individuals. No indications for linkage disequilibrium
among loci were found. Deviations from Hardy–
Weinberg proportions were detected in Drenthe and
Noord-Brabant for a number of populations at loci
WRA6-8 and RECALQ, showing a minor deficiency
of heterozygotes. It is thus possible that these loci
contained null-alleles although individuals without
any amplification product did not occur in Noord-
Brabant and were found only twice in Drenthe.
Similar to Knopp et al. (2007), who analysed four
progenies with these two markers, we found no
Table 3 Data on the SSR markers used
SSR locus PCR conditionsb A EMBL accession no.
WRA1-22 50�C 38 cycles 11 AJ419881
WRA1-28 50�C 35 cycles 58 AJ419882
WRA1-160 60�C 35 cycles 52 AJ419883
WRA6-8 50�C 35 cycles 61 AJ419884
RECALQa 50�C 35 cycles 12 X64324
RRD590aa 55�C 30 cycles 5 D78590
RCIDIIa 50�C 35 cycles 5 L42815
RC08604da 50�C 38 cycles 8 U08604
A = total number of alleles founda Vos et al. (2001)b PCR conditions: 3 min 94�C, followed by 30–38 cycles of
45 s 94�C, 45 s at annealing temperature, 120 s 72�C and final
extension 20 min 72�C. Amplification was performed in 20 ll
containing 75 mM Tris–HCl pH 9.0,1.5 mM MgCl2, 20 mM
(NH4)2SO4, 0.01% (w/v) Tween 20, 100 lM of each dNTP,
200 nM of each primer, 16 ng template DNA and 0.1 unit
Goldstar DNA polymerase (Eurogentec)
Landscape Ecol
123
evidence for null-alleles in an analysis of 20 offspring
from one egg clump. This indicates that the frequency
of null-alleles, if they occur, is low.
Genetic variation and population differentiation
All loci were highly polymorphic in Drenthe, with a
mean number of effective alleles of 7.2. Observed
heterozygosity varied across populations (0.48–0.70).
There was a slight overall heterozygote deficit
(Ho = 0.60, He = 0.68) indicating some local
inbreeding (FIS = 0.096, 95% C.I. 0.029–0.183).
The overall FST value in Drenthe was 0.022 (95%
C.I. 0.014–0.034) showing low but significant pop-
ulation differentiation. Pairwise FST values between
populations ranged from –0.011 to 0.061. The two
ponds within the same moorland (populations 310
and 312) had a pairwise FST value of –0.011,
consistent with unrestricted gene flow.
Genetic variation in Noord-Brabant was lower, as
observed heterozygosities (0.45–0.69) and effective
number of alleles in Noord-Brabant (mean 5.9) were
significantly lower than in Drenthe (Mann–Whitney
tests; P \ 0.01). Eight populations were fixed for the
same allele at the RRD590a locus. There was again a
small heterozygote deficit (Ho = 0.51, He = 0.59) and
slight inbreeding (FIS = 0.086, 95% C.I. 0.027–
0.180). The level of population differentiation in
Noord-Brabant was higher with a FST value of 0.060
(95% C.I. 0.041–0.091). Pairwise FST values ranged
from 0 to 0.175 indicating that some individual
populations were considerably differentiated. Some
populations in Drenthe and Noord-Brabant were not
significantly differentiated from each other and
formed population complexes of two or three ponds
situated within natural areas of Noord-Brabant
(Fig. 1; pond codes starting with 12, 23 or 26) or of
neighbouring populations in close proximity within
the southern part of Drenthe (310/312 + 330,
330 + 322), with the exception of two populations
(330 + 319), which were 4 km apart.
Another way to evaluate the relative isolation of
populations is the use of assignment tests. As
predicted by Pritchard and Wen (Documentation for
STRUCTURE software; http://pritch.bsd.uchica-
go.edu/structure.html) for populations showing
isolation-by-distance (see below), most individuals
in our study areas were assigned to various clusters
with almost equal probabilities. In Drenthe, no clear
results could be obtained with respect to the number
of inferred clusters K. Similarly assignments by DOH
showed that for none of the populations more than
50% of the individuals were assigned to their original
population, and for all populations, individuals were
assigned to at least six different populations. For
Noord-Brabant, likelihoods suggested that four clus-
ters could be identified (k = 3, Ln = –4404; k = 4,
Ln = –4401; k = 5, Ln = –4451; k = 6, Ln = –4467;
k = 7, Ln = –4586; average result of five runs), even
though many individuals had admixed assignment to
the inferred clusters. Individuals from population
0901 formed a clearly separate group with all
individuals from this population assigned with high
probabilities to one cluster. The remaining individ-
uals were largely split into three clusters; (1)
individuals from population 1301; (2) individuals
from population complexes 12 and 15; (3) individuals
from population complexes 23 and 26 (see Supple-
mentary Figure 1S). DOH also exclusively assigned
individuals from 0901 to their original population,
whereas it assigned individuals from the other
populations to various populations but mainly within
the clusters described above.
Permeability model analysis
Among populations in Drenthe, a highly significant
correlation was found with geographical distance (D),
which explained 42.2% of the total variance
(Table 4). Besides geographical distance, also the
geographical distances corrected for negative area
D*RNA, for negative linear elements D*RL and for
positive linear elements D*CL as well as the
integrated D*RINT showed a significant correlation
with genetic distance. However in multiple Mantel
tests, none of these permeability-adjusted distances
had a significant additional effect (P [ 0.24) on top
of geographical distance D.
In Noord-Brabant, at first no significant correlation
was found between the pairwise genetic and geo-
graphic distances across all populations. Examination
of the scatter plot indicated that points largely
deviating from the expected increase of genetic
distance with geographic distance were all associated
with population 0501 (Fig. 2). Inspection of historic
maps showed that population 0501, the most eastern
Landscape Ecol
123
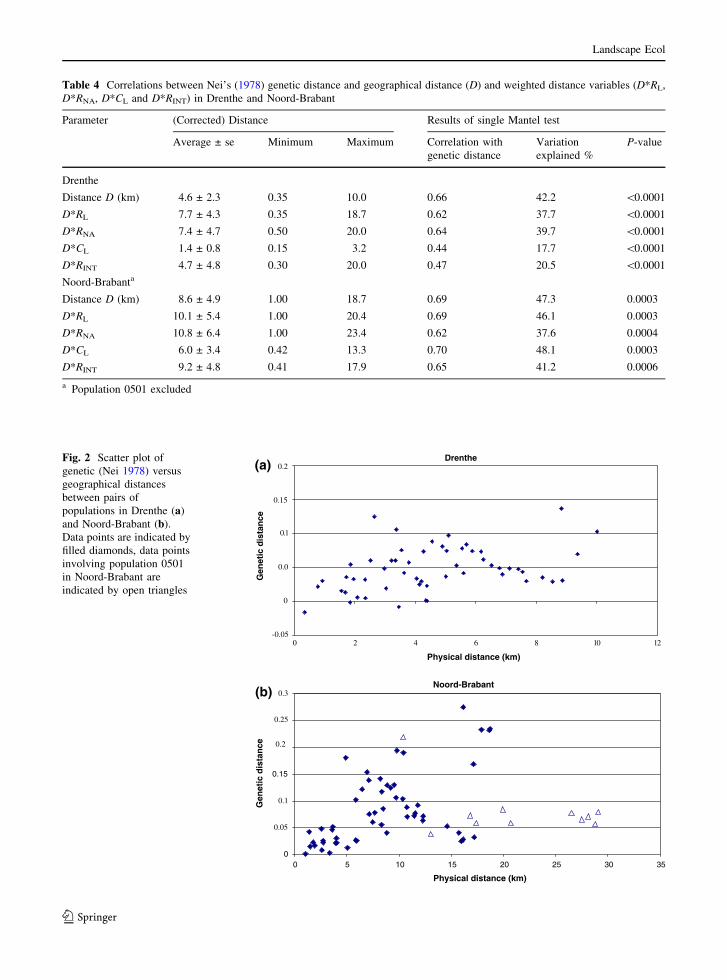
Table 4 Correlations between Nei’s (1978) genetic distance and geographical distance (D) and weighted distance variables (D*RL,
D*RNA, D*CL and D*RINT) in Drenthe and Noord-Brabant
Parameter (Corrected) Distance Results of single Mantel test
Average ± se Minimum Maximum Correlation with
genetic distance
Variation
explained %
P-value
Drenthe
Distance D (km) 4.6 ± 2.3 0.35 10.0 0.66 42.2 \0.0001
D*RL 7.7 ± 4.3 0.35 18.7 0.62 37.7 \0.0001
D*RNA 7.4 ± 4.7 0.50 20.0 0.64 39.7 \0.0001
D*CL 1.4 ± 0.8 0.15 3.2 0.44 17.7 \0.0001
D*RINT 4.7 ± 4.8 0.30 20.0 0.47 20.5 \0.0001
Noord-Brabanta
Distance D (km) 8.6 ± 4.9 1.00 18.7 0.69 47.3 0.0003
D*RL 10.1 ± 5.4 1.00 20.4 0.69 46.1 0.0003
D*RNA 10.8 ± 6.4 1.00 23.4 0.62 37.6 0.0004
D*CL 6.0 ± 3.4 0.42 13.3 0.70 48.1 0.0003
D*RINT 9.2 ± 4.8 0.41 17.9 0.65 41.2 0.0006
a Population 0501 excluded
(a)Drenthe
-0.05
0
.01
20 4 6 8 10 12
Physical distance (km)
Gen
etic
dis
tan
ce
25 30 35
Noord-Brabant
0
0.15
0 5 10 15 20
Physical distance (km)
Gen
etic
dis
tan
ce
(b)
0.2
0.15
0.0
0.3
0.25
0.2
0.05
0.1
Fig. 2 Scatter plot of
genetic (Nei 1978) versus
geographical distances
between pairs of
populations in Drenthe (a)
and Noord-Brabant (b).
Data points are indicated by
filled diamonds, data points
involving population 0501
in Noord-Brabant are
indicated by open triangles
Landscape Ecol
123
one in our study, was already poorly connected to
other populations in 1850 and was separated from the
rest of the study area by the construction of a canal
between 1906 and 1923 and a four-lane motorway
next to the canal later on. Reanalyses of the
correlation between genetic and geographic distances
without population 0501 resulted in significant cor-
relations with all distance measures (Table 4),
explaining between 37.6 (D*RNA) and 48.1%
(D*CL) of the variation. In multiple Mantel tests,
none of the permeability-adjusted distances added to
a model with geographical distance alone (P [ 0.22).
As observed for population 0501, permeability
correlations may be obscured by single populations.
On the other hand, correlations may also be associ-
ated with single populations at the edge of a study
area (Bossart and Prowell 1998). To check for this,
re-analyses of the Mantel tests were performed by
systematically excluding one population per analysis.
For Drenthe, the results of these analyses were
similar to the original one, with all distance measures
significantly related to genetic distance but none of
the permeability-adjusted distances significant in the
multiple Mantel tests. In Noord-Brabant, all distance
measures were significant in each of the tests as well,
but here the distance corrected for negative linear
elements D*RL added significantly to a model with
geographical distance in the multiple Mantel test only
if population 0901 was excluded. Exclusion of any of
the other populations did not change the Mantel test
results.
Discussion
Genetic variation
We found small to moderate (FST = 0.022 in Dren-
the; FST = 0.060 in Noord-Brabant) population
differentiation in the two study areas in The Nether-
lands. The relatively longer time-span and higher
level of habitat fragmentation (including increased
interpond distances) for Noord-Brabant could be the
cause of the higher FST-values among its Moor frog
populations. The higher degree of population isola-
tion in Noord-Brabant, compared to Drenthe, can also
be discerned from the lower numbers of alleles, the
fixation of locus RRD590a in eight out of twelve
populations, and the significantly lower degree of
heterozygosity. A different recolonisation history of
the two areas causing different basic population
differentiation seems unlikely because both areas are
only 150 km apart. Furthermore, the range of allele
sizes was comparable in both areas.
Population genetic studies in amphibians have
mainly focused on large geographic scales and
consequently observed higher levels of population
differentiation than found in our study (Newman and
Squire 2001). For R. arvalis, genetic data on popu-
lation differentiation are only available from Knopp
et al. (2007), who found moderate to high population
differentiation levels (FST = 0.06 to 0.40) in Sweden
among populations 110–660 km apart. Fine-scale
studies in amphibians employing microsatellite mark-
ers (Scribner et al. 1994; Call 1997; Call et al. 1998;
Newman and Squire 2001) found levels of differen-
tiation comparable to our study, in Bufo bufo
(FST = 0.016 at 5.5–14.5 km distances), Rana lutei-
ventris (FST = 0.04 at 16 km; FST = 0.07 at 3–
34 km) and R. sylvatica (FST = 0.014 at 0.05–
21 km). Furthermore, R. arvalis exhibits comparable
levels of genetic variation to other pond-breeding
anurans (Brede and Beebee 2004; Scribner et al.
2001; Palo et al. 2004). Assessments of landscape
history and matrix permeability in these studies are
lacking, precluding further comparison.
Population differentiation and landscape change
Until 1850, the two studied landscapes formed large
areas of unfragmented habitat with many ponds as
potential breeding sites for the Moor frog. Since then,
habitat loss and fragmentation has been more
pronounced in Noord-Brabant. For instance, a study
on water retention in Noord-Brabant showed that the
surface area of ponds has decreased by almost 97%
due to direct loss of ponds and lowered water tables (
http://www.levenmetwater.nl). Currently, breeding
ponds are on average 8.6 km apart, compared to
4.6 km in Drenthe. Dispersal distances of individual
Moor frogs have been estimated to be 1–3 km, with a
strong reduction in pond occupancy by roads (Har-
tung 1991; Vos and Chardon 1998). This would
imply that both study areas, but especially Noord-
Brabant, can be presently considered to be frag-
mented. Whereas the level of population
differentiation is still low, the current permeability of
Landscape Ecol
123
the landscape matrix suggests that this genetic
structure is unlikely to reflect present day gene flow
levels although a definitive conclusion can not be
drawn based on the present data. Nevertheless, we
feel that our assumption of the genetic structure
reflecting an intermediate situation between the his-
toric situation in 1850 and the current landscape
(Broughton and Harrison 2003) is a safe one. If the
time since separation has been insufficient for com-
plete divergence due to drift or to accumulation of
mutations, populations will still resemble each other
even in the absence of present-day gene flow (Bossart
and Prowell 1998). Fragmentation started around
1910 in Noord-Brabant but only after 1932 in Dren-
the. Because Moor frogs become adult in the third
year of life (Hartung 1991), relatively few genera-
tions (max. 40) have passed since habitat
fragmentation started. The species’ life history char-
acteristics may to some extent counteract drift. The
occurrence of overlapping generations and the pos-
sibility of multiple paternities (found in the single egg
clump tested and is also observed in the related R.
temporaria; Vieites et al. 2004), may contribute to
the maintenance of genetic diversity in Moor frog
populations. Alternatively, the numbers of alleles
found in the populations may indicate that current
population sizes are higher than estimated based on
egg clump counts. Population differentiation and
assignment tests indicated that several populations
belong to the same population complex. If popula-
tions encompass more than a single breeding pond,
drift and local loss of genetic diversity would be
diminished.
The magnitude of the effect of drift for a relatively
low number of generations on the level of population
differentiation can be estimated in simulation models.
We performed such simulations of the process of
population differentiation starting with randomly
assigned alleles to populations, mimicking severe
fragmentation of a panmictic population using
EASYPOP 1.8 (Balloux 2001). In these simulations,
an island model with equal migration to all popula-
tions was assumed, in which the effective number of
alleles for the overall area, the estimated population
sizes and the number of populations, from either
Drenthe or Noord-Brabant were used. Simulations of
FST values during 200 generations were performed
using gene flow (Nm) values of 0.5 or 1.0 (Whitlock
and McCauley 1998), thus mimicking a situation of
limited gene flow after severe fragmentation. The
simulations indicated that, even with such a low level
of gene flow, FST values of 0.06 (as found in our
study) are only reached after approximately 30 and
40 generations. Equilibrium FST levels were only
attained after more than 100 generations irrespec-
tively of the population model used (island or 2-D
stepping stone; data not shown). Hence, it is likely
that the populations in our study were not in
migration-drift equilibrium, and that inferences about
current gene flow cannot be drawn.
Matrix permeability and dispersal
For an isolation by distance (IBD) relation to
establish between populations, dispersal between
neighbouring ponds has to be possible but is
restricted, so that populations differentiate from each
other with increasing distance (Hutchinson and
Templeton 1999). Both in Drenthe and in Noord-
Brabant, an IBD pattern was found between popula-
tions separated by maximum distances of 10.0 and
18.6 km, respectively. For Noord-Brabant, the model
including population 0501, for which historic data
indicated that it was effectively isolated from the
other populations in the early 1900’s, was not
significant. Once 0501 was excluded, all IBD
relationships became significant. According to Boss-
art and Prowell (1998), it can be concluded that this
population is not connected by gene flow, even if its
absolute level of differentiation is low. Although
seemingly counterintuitive, populations with an abso-
lute barrier to gene flow between them can actually
show low levels of differentiation because genetic
drift is undirected (Hutchinson and Templeton 1999).
In the same time, if a population is large, the level of
genetic drift is very low, and the population would
not differentiate from other ones. This may actually
be the case for population 0501, because a compar-
ison of historic maps showed that 17% of its habitat
in 1850 is still present today, compared to only 1–2%
for other populations. Because the population differ-
entiation of 0501 to most populations is low the latter
explanation seems the most likely one.
In order to identify present-day landscape ele-
ments affecting gene flow, their effect has to be
strong. Negative landscape elements like roads and
canals are formidable barriers and were often present
Landscape Ecol
123
for a longer time period. Hence, they are more likely
to be identified as gene flow barriers then other
landscape elements. Nevertheless, effects of these
negative landscape elements can also be concealed.
In Noord-Brabant, population 0901 is situated in a
military training area for tanks and, thus consisting of
a high proportion of unsuitable land not accounted for
in the landscape permeability measures. The fact that
this population had the largest geographic distance to
other populations and was also genetically different
as shown in the assignment test obscured the effect of
roads in this study area. The probability of the
presence of populations such as 0501 and 0901 with a
different population history and/or associated with an
unequal distribution of certain landscape elements is
likely to increase in larger and thus less homogeneous
study areas. This may explain why in Drenthe, in
contrast to the study of Vos et al. (2001), none of the
landscape features had an effect in multiple Mantel
tests. However, without population 0901, the distance
corrected for negative linear elements D*RL (includ-
ing roads) did significantly add to the genetic
differentiation in the permeability model.
We have not been able to show any effects of other
landscape elements. It may be that the positive and/or
negative effects are too weak to have become
significant after a limited number of generations.
However, it may also be that the way in which we
have calculated a type of structural connectivity
measure, along 200-m strips through the landscape,
does not accurately reflect the landscape as experi-
enced by Moor frogs. For a more functional
connectivity measure for R. arvalis, research on
movement behaviour of frogs within landscapes is
needed, so that real movement tracks can be modelled
(Opdam et al. 2003). Such a permeability analysis
(Chardon et al. 2003; Stevens et al. 2006), based on
empirical data of current dispersal or gene flow may
be less sensitive to landscape heterogeneity and
populations differing in history.
Acknowledgements We kindly acknowledged private
landowners and nature conservation organisations (SBB,
Natuurmonumenten, Drents Landschap, Brabants Landschap,
Landgoed De Utrecht) for their permission to access fens and
ponds. We want to thank H. Houweling and H. Meeuwsen for
their assistance in the spatial modelling and GIS applications,
R. Snep for the historical analysis and all people who
participated in the field work. W. van Delden, R.
Holderegger and two anonymous reviewers are kindly
acknowledged for their helpful comments on an earlier
version of this paper.
References
Arens P, Van‘t Westende W, Bugter R, Smulders MJM,
Vosman B (2000) Microsatellite markers for the European
tree frog Hyla arborea. Molecular Ecology 9:1944–1946
Balloux F (2001) A computer program for the simulation of
population genetics EASYPOP (version 1.7). J Heredity
92:301–302
Bossart JL, Prowell DP (1998) Genetic estimates of population
structure and gene flow: limitations, lessons and new
directions. Trends Ecol Evol 13:202–206
Brede EG, Beebee TJC (2004) Contrasting population struc-
tures in two sympatric anurans: implications for species
conservation. Heredity 92:110–117
Broughton RE, Harrison RG (2003) Nuclear gene genealogies
reveal historical, demographic and selective factors
associated with speciation in field crickets. Genetics
163:1389–1401
Call DR (1997) Microsatellite characteristics and population
structure for two anurans (Rana luteiventris and Hylaregilla). PhD Dissertation, Washington State University,
Pullman
Call DR, Hallett JG, Mech SG, Evans M (1998) Considerations
for measuring genetic variation and population structure
with multilocus fingerprinting. Mol Ecol 7:1337–1346
Chardon JP, Adriaensen F, Matthysen E (2003) Incorporating
landscape elements into a connectivity measure: a case
study for the speckled wood butterfly (Pararge aegeriaL.). Landsc Ecol 18:561–573
Cockerham CC (1973) Analysis of gene frequencies. Genetics
74:679–700
Crochet PA (1996) Can measures of gene flow help to evaluate
bird dispersal? Acta Oecologica 17:459–474
Forman RTT (1995) Land mosaics; the ecology of landscapes
and regions. Cambridge University Press, Cambridge
Goudet J, Raymond M, Demeeus T, Rousset F (1996) Testing
differentiation in diploid populations. Genetics 144:1933–
1940
Griffiths RA, Raper SJ (1994) How many clumps are there in a
mass of frog spawn? British Herpetol Bull 50:14–17
Guo SW, Thompson EA (1992) Performing the exact test
of Hardy–Weinberg proportion for multiple alleles.
Biometrics 48:361–372
Hartung H (1991) Untersuchungen zur terrestrischen Biologie
von Populationen des Moorfrosches (Rana arvalis Nilsson
1842) unter besonderer Berucksichtigung der Jah-
resmobilitat. PhD thesis, University of Hamburg,
Hamburg
Historische atlas Drenthe en Noord-Brabant (1989) Robas
producties, Den Ilp
Holderegger R, Wagner HH (2006) A brief guide to landscape
genetics. Landsc Ecol 21:793–796
Hoogerwerf G, Crombaghs B (1993) Herpetofauna onderzoek.
Voorkomen en verspreiding van herpetofauna en kwaliteit
van leefgebieden in het zuiden en oosten van
Landscape Ecol
123
Noord-Brabant. Limes Divergens adviesbureau voor
Natuur and Landschap, Nijmegen
Hutchinson DW, Templeton AR (1999) Correlation of pairwise
genetic and geographic distance measures: inferring the
relative influences of gene flow and drift on distribution of
genetic variability. Evolution 53:1898–1914
Karagyozov L, Kalcheva ID, Chapman M (1993) Construction
of random small-insert genomic libraries highly enriched
for simple sequence repeats. Nucleic Acids Res 21:3911–
3912
Knopp T, Cano JM, Crochet PA, Merila J (2007) Contrasting
levels of variation in neutral and quantitative genetic loci
on island populations of Moor frogs (Rana arvalis).
Conserv Genet 8:45–56
Manel S, Schwartz MK, Luikart G, Taberlet P (2003) Land-
scape genetics: Combining landscape ecology and
population genetics. Trends in Ecol Evol 18:189–197
Mantel N (1967) The detection of disease clustering and a
generalized regression approach. Cancer Res 27:209–220
Manly BFJ (1997) Randomization, bootstrap and Monte Carlo
methods in biology. Chapman and Hall, New York
Nei M (1978) Estimation of average heterozygosity and
genetic distance from a small number of individuals.
Genetics 89:583–590
Neigel JE (1997) A comparison of alternative strategies for
estimating dispersal and gene flow from genetic markers.
Ann Rev Ecol Systemat 28:105–128
Newman RA, Squire T (2001) Microsatellite variation and
fine-scale population structure of wood frogs (Rana sylv-atica). Mol Ecol 10:1087–1100
Opdam P, Verboom J, Pouwels R (2003) Landscape cohesion:
an index for the conservation potential of landscapes for
biodiversity. Landsc Ecol 18:113–126
Palo JU, Schmeller DS, Laurila A, Primmer CR, Kuzmin SL,
Merila J (2004) High degree of population subdivision in
a widespread amphibian. Mol Ecol 13:2631–2644
Payne RW, Lane PW, Baird DB, Gilmour AR, Harding SA,
Morgan GW, Murray DA, Thompson R, Todd AD, Tun-
nicliffe Wilson G, Webster R, Welham SJ (1993) Genstat
5, release 3, reference manual. Clarendon Press, Oxford
Pritchard JK, Stephens M, Donnelly P (2000) Inference of
population structure using multilocus genotype data.
Genetics 155:945–959
Rice WR (1989) Analyzing tables of statistical tests. Evolution
43:223–225
Ricketts TH (2001) The matrix matters: effective isolation in
fragmented landscapes. The American Naturalist 158:87–
99
Schlupmann M (1988) Ziele und Methoden der Grasfrosch-
Laichballen-Zahlung in Westfalen. Jahrbuch fur Feldher-
petologie 2:67–88
Scribner KT, Arntzen JW, Burke T (1994) Comparative anal-
ysis of intra- and interpopulation genetic diversity in Bufobufo, using allozyme, single-locus microsatellite, mini-
satellite and multilocus minisatellite data. Mol Biol Evol
11:737–748
Scribner KT, Arntzen JW, Cruddace N, Oldham RS, Burke T
(2001) Environmental correlates of toad abundance and
population genetic diversity. Biol Conserv 98:201–210
Stevens VM, Verkenne C, Vandewoestijne S, Wesselingh RA,
Baguette M (2006) Gene flow and functional connectivity
in the natterjack toad. Mol Ecol 15:2333–2344
Van der Sluis T, Vos CC (1997) Scenario studie verstoring
heikikker door wegverkeer Noord-Brabant. In: Farjon H,
Hazendonk NFC, Hoefnagel WJC (eds) Verkenningen
natuur en verstedelijking 1995–2020. SC-DLO, IKC-
Natuurbeheer, IBN-DLO, Wageningen, pp 1–27
Vieites DR, Nieto-Roman S, Barluenga M, Palanca A, Vences
M, Meyer A (2004) Post-mating clutch piracy in an
amphibian. Nature 431:305–308
Vos CC (1999) A frog’s-eye view of the landscape. Quanti-
fying connectivity for fragmented amphibian populations.
Ph.D. thesis Wageningen University, Wageningen
Vos CC, Chardon JP (1998) Effects of habitat fragmentation
and road density on the distribution pattern of the Moor
frog Rana arvalis. J Appl Ecol 35:44–56
Vos CC, Antonisse-De Jong AG, Goedhart PW, Smulders
MJM (2001) Genetic similarity as a measure for con-
nectivity between fragmented moor frog (Rana arvalis)
populations. Heredity 86:598–608
Vos CC, Baveco H, Grashof-Bokdam CJ (2002) Corridors and
species dispersal. In: Gutzwiller KJ (ed) Applying land-
scape ecology in biological conservation. Springer, New
York, pp 84–104
Weir BS, Cockerham CC (1984) Estimating F-statistics for the
analysis of population-structure. Evolution 38:1358–1370
Whitlock MC, McCauley DE (1998) Indirect measures of gene
flow and migration: Fst=1/(4Nm + 1). Heredity 82:117–
125
Wiens JA (1997) Metapopulation dynamics and landscape
ecology. In: Hanski I, Gilpin ME (eds) Metapopulation
biology: ecology, genetics and evolution. Academic Press,
San Diego, pp 43–68
Landscape Ecol
123