genetic linkage and association studies in celiac disease ... · genetic linkage and association...
TRANSCRIPT

1
Genetic linkage and association studies in
celiac disease: discoveries from whole genome analysis
Svetlana Adamović
Department of Medical Genetics and Clinical Genetics
Institute of Biomedicine
The Sahlgrenska Academy
at
University of Gothenburg
Sweden

2

3
PREFACE
One of the most exciting moments a geneticist may experience is finding The
Gene or genetic variant responsible for the disease or trait he/she is dedicated
to. The way to the goal is very often a roller coaster, with it’s slowly ups and
speedy downs, neck breaking loops and twisted curves, but yet – nobody wants
to get off. We are searching in the dark, playing hide-and-seek, swinging from
the highest excitement to the deepest depression (in a few hours sometimes…)
but we enjoy every single moment of it.
Even if I don’t give you any big answers in this book, I am still immeasurably
proud that you are holding it in your hands. It is because I learned, during my
time as a researcher in this project, that - even if we don’t reach the end point of
our journey, we can still make a great contribution travelling to it.
May you find what you are looking for.
Chinese course

4
5
ABSTRACT
Celiac Disease (CD) or Gluten Sensitive Enteropathy (GSE) is a life-long disorder. It is characterized by inflammation in the small intestine of genetically predisposed individuals caused by inappropriate immune response to gluten, a protein enriched in some of our common grains (wheat, rye and barley). The toxicity of gluten is manifested by the autoimmune action of T-lymphocytes on mucosal cells in the small intestine, disrupting its vital function of absorbing nutrients from the food. The disease affects predominantly children, but it can develop later in life as well. Untreated CD involves risk for major complications: Dermatitis herpetiformis (“the celiac disease of the skin”), nutritional deficiencies, osteoporosis, anaemia, fertility problems, neurological disturbances and malignancies. The only known treatment for CD is a lifelong adherence to gluten-free diet (GFD).
In a Scandinavian genome wide scan, performed by our group and published in 2001, eight chromosomal regions apart from HLA showed nominal significance (p < 0,05), among them 5q31-33. This region was previously suggested as a susceptibility region in other complex diseases: asthma, type 1 diabetes, rheumatoid arthritis and inflammatory bowel disease.
The main goal of this study was to explore the region of 18cM on 5q31-33, identify genetic risk factors and evaluate their contribution to the development of CD. In 2003 a joint analysis of four independent genome scans was performed by the European Genetics Cluster on Coeliac Disease, a collaborative work between six European research groups, including our. Data from Italian, Finnish, UK and Swedish/Norwegian cohorts, a total of 442 families, was pooled together and analysed. The meta-analysis using pooled data confirmed 5q31-33 as the second most significant region after the HLA region.
After the meta-analysis, we applied a fine mapping strategy on the 18cM region on 5q31-33. The most essential result of this study was the strengthened linkage signal on 5q31-33
In 2006 we used the Illumina platform (GoldenGate assay technology) to perform an extensive screen of the region on 5q31-33. This study identified seven associated regions within 5q31-33 and a number of associated haplotypes but none of the association signals could explain the linkage peak observed in the families previously.
In 2007 we performed a follow-up study of the association to the region comprising IL2/IL21 genes on 4q27, reported in the first genome-wide association study (GWAS) in celiac cases and controls. We confirmed that the IL2/IL21 region is a susceptibility region in CD.
6
Unfortunately, the first GWAS failed to identify specific genes predisposing to CD. The GWAS as well as our own fine mapping study pointed out the difficulties scientists face in searching for the causing variants in complex diseases. It appears that causing variants may be hard to detect with association analysis alone because of the strong linkage disequilibrium in associated regions. However, the GWAS detected a number of CD associated genomic regions which remain to be explored.
7
INDEX
PREFACE 3
ABSTRACT 5
INTRODUCTION 9
THE WORLD OF GENES 9 GREGOR MENDEL 10 POLYGENIC INHERITANCE 12 MENDELIAN VS COMPLEX TRAITS 13 CELL DIVISION 14 THE CENTRAL DOGMA OF MOLECULAR BIOLOGY 16 CROSSING OVER / RECOMBINATION 18 GENETIC LINKAGE 19 MUTATIONS 20 POLYMERASE CHAIN REACTION, PCR 21
FINDING GENES 23
GENETIC LINKAGE AND ASSOCIATION 23
GENOME-WIDE ASSOCIATION STUDIES (GWAS) 26
CELIAC DISEASE 27
GLUTEN – NUTRITIOUS OR TOXIC? 27
CLINICAL MANIFESTATIONS OF CD 29
EPIDEMIOLOGY OF CD: the famous “Celiac Iceberg” 29
GENETICS OF CD 30
THIS STUDY 35
BACKGROUND 35
AIM 36
MATERIAL & METHODS 36 FAMILIES 36 GENOTYPING: Concept of genetic markers 36
THE WORKFLOW AND DISCUSSION OF RESULTS 39 PAPER I: THE META-ANALYSIS 39 PAPER II: THE FINE MAPPING STUDY 40 PAPER III: THE COMPREHENSIVE SCREEN STUDY 40
8
PAPER IV: REPLICATION OF ASSOCIATED HAPLOTYPES 41 PAPER V: ASSOCIATION OF IL2/IL21 REGION AND FcgRIIa IN CD 41
CONCLUDING REMARKS AND FUTURE PERSPECTIVE 42
ACKNOWLEDGEMENTS 44
REFERENCES 46
9
INTRODUCTION
THE WORLD OF GENES
Life is just four letters…
Every living being on this planet has its very own life code written by four letters only: A, C, G and T. These letters represent the four nucleotides (A = adenine, C = cytosine, G = guanine and T = thymine) which build up the deoxyribonucleic acid molecules, the DNA. Different arrangements of nucleotides in the DNA provide the key to diversity among living organisms. But, there is one rule to obey: A always pairs with T and C always pairs with G, which means that whatever amount of A in the DNA – the amount of T is equal. Similarly, whatever amount of C – the same amount of G is present in the DNA (Chargaff’s rule). The ratio of A+T : C+G vary between species and make them unique.
The four letters are lined in rows, like strings of pearls, telling the story about the individual carrying them. And it is a long story: the DNA of a single cell contains information equal to almost 600 000 printed pages of 500 words each, a library of about 1 000 books! The DNA from an average human, unwound and joined together, makes the string that could stretch from the Earth to the Sun 400 times, a distance of 93 million miles - one way.
The DNA molecule is shaped like a twisted zipper, consisting of two perfectly fitting strands. It is called a double helix. Almost every cell in our bodies contains nearly two meters of DNA. In order to fit into the cell nucleus, which is only 1/10 of the cell’s volume, the DNA undergoes remarkable twisting and coiling and gets tightly packed into the chromosomes. Each chromosome consists of two chromatides. There are two types of chromosomes: autosomes and sex chromosomes. Humans have 22 pairs of autosomes and one pair of sex chromosomes (XX or XY). Together they are making the human genome.
Chromosome pairs are passed to us from our parents, one chromosome in each pair comes from our mom, the other one from our dad. So, we have 46 chromosomes in our cells, with one exception - our germ cells, female eggs and male sperms. They only have one half of every pair, altogether 23 chromosomes. When they meet and get united a new individual is created with 46 chromosomes in this very first cell. Whether it is going to be a boy or a girl is decided by the sex chromosome carried by the sperm: an X gives a girl, a Y gives a boy.
Traits are passing from generation to generation. We resemble our parents, or maybe our grandparents, but are clearly distinct from them. It looks like we
10
inherit our characteristics in a random, “blended” manner, but the process is carried out with perfect precision. The first one to demonstrate the principles of inheritance was
GREGOR MENDEL
Planting the seeds of genetics
Mendel was a nature loving Augustinian monk, living in 19th century Brünn, Austria (today Brno, Czech Republic). His interests in plants led him into studies of how traits were inherited. Inspired by Jean-Baptiste de Lamarck, Mendel wanted to illustrate the influence of the environment upon plants. Instead, he observed that the offspring retained the important traits from its parents and concluded that environment had no effect on the inheritance. Hereby, the idea of heredity was born.
Mendel didn’t know anything about chemistry of inheritance. He applied a very sophisticated experiment using the plants of the garden pea, Pisum Sativum, bred the plants repeatedly and observed only the outward appearance of the progeny, one character at the time. The outwards characteristics or physical traits are today called phenotypes.
The brilliance of Mendel’s work was based on understanding statistics even before the formal statistics was developed. He observed that inheritance follows certain numerical patterns and that some traits appeared more often then others. He even observed that some traits “disappeared” in the first offspring generation and then re-appeared in the next, when plants were pollinated with the plants from the same generation or were allowed to self-pollinate. He kept careful records and published his findings in 1866, but nobody took notice. The biologists of that time were occupied by Charles Darwin’s evolutional theory. It took more than 30 years for the scientific community to recognize Gregor Mendel’s work.
Mendel postulated rules that explain factors affecting heredity. Today we call them Mendelian laws of inheritance.
11
Mendelian law of unit characters: An individual inherit two factors (alleles) affecting the actual trait, one from each parent.
Mendelian law of dominance: One of the factors may dominate or hide the other. The trait observed in the offspring is the dominant trait. The trait that disappears in the offspring is the recessive trait.
Mendelian law of segregation: The two factors affecting the trait must separate in the parental generation, when gametes are formed. A parent randomly passes one allele for each trait to each offspring.
Mendelian law of independent assortment: The factors affecting different traits are inherited independently of each other.
Today we call the two factors (alleles), which an individual inherit from its parents, a genotype. Each genotype consists of two alleles, one from each parent. An allele is the genetic information in a certain position (locus) on the parental chromosome. The two alleles come from the exact same position on the mother’s and on the father’s chromosomes. If an allele is dominant, we write it with capital letter (A, B, C), if it is recessive we use lowercase (a, b, c). If both alleles are the same, the individual is homozygous for given trait. When the individual inherit two dominant alleles it is said to be homozygous dominant; if the individual inherit two recessive alleles it is said to be homozygous recessive. In contrast, if the inherited alleles are different, the individual is heterozygous. Since the dominant allele always is expressed, the individual is said to be heterozygous dominant.
In the world of genetics it is like in the real world: there is no rule without exceptions. Those exceptions were not discovered by Mendel and are therefore called non-Mendelian inheritance:
Incomplete dominance or co-dominance: a type of inheritance where both alleles for a specific trait are expressed, which results in a combined phenotype (like pink flowers when you cross plants with red and white flowers).
Sex-linked inheritance: when the trait is controlled by genes located on sex chromosomes. Those traits show up exclusively or more frequently in one sex. Examples are haemophilia and red-green colour blindness in males.
Polygenic inheritance: simply opposite from pleiotropic inheritance - several genes affect the same trait. The perfect examples of polygenic inheritance are eye1 and skin colour, and the subject of this thesis – celiac disease.
12
POLYGENIC INHERITANCE
When 1 + 1 + 1 = 1
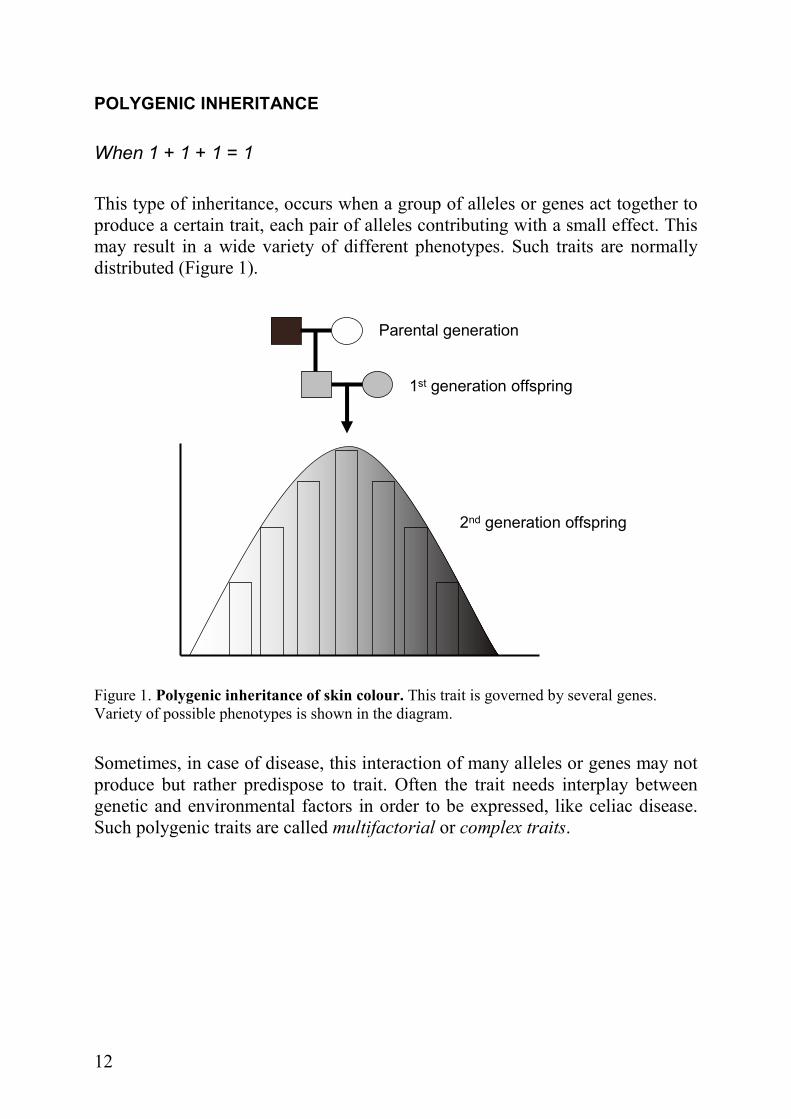
This type of inheritance, occurs when a group of alleles or genes act together to produce a certain trait, each pair of alleles contributing with a small effect. This may result in a wide variety of different phenotypes. Such traits are normally distributed (Figure 1).
Parental generation
1st generation offspring
2nd generation offspring
Figure 1. Polygenic inheritance of skin colour. This trait is governed by several genes. Variety of possible phenotypes is shown in the diagram.
Sometimes, in case of disease, this interaction of many alleles or genes may not produce but rather predispose to trait. Often the trait needs interplay between genetic and environmental factors in order to be expressed, like celiac disease. Such polygenic traits are called multifactorial or complex traits.
13
MENDELIAN VS COMPLEX TRAITS
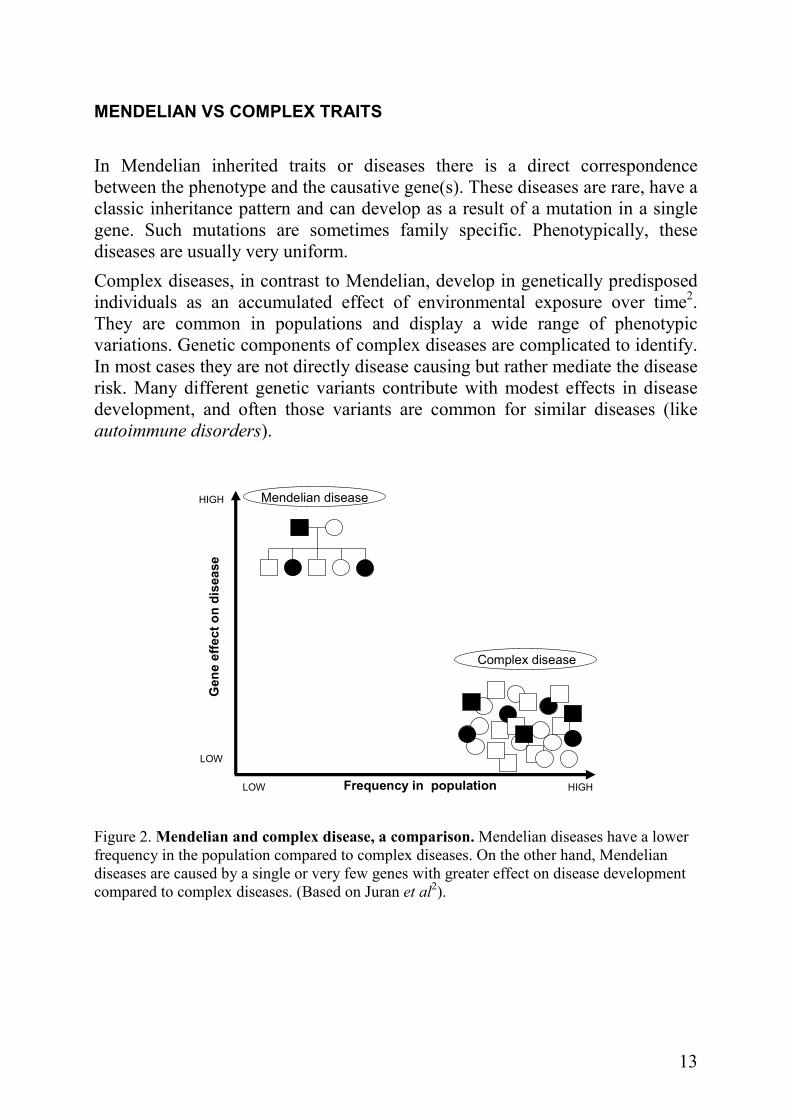
In Mendelian inherited traits or diseases there is a direct correspondence between the phenotype and the causative gene(s). These diseases are rare, have a classic inheritance pattern and can develop as a result of a mutation in a single gene. Such mutations are sometimes family specific. Phenotypically, these diseases are usually very uniform.
Complex diseases, in contrast to Mendelian, develop in genetically predisposed individuals as an accumulated effect of environmental exposure over time2. They are common in populations and display a wide range of phenotypic variations. Genetic components of complex diseases are complicated to identify. In most cases they are not directly disease causing but rather mediate the disease risk. Many different genetic variants contribute with modest effects in disease development, and often those variants are common for similar diseases (like autoimmune disorders).
Complex disease
Mendelian diseaseHIGH
LOW
HIGHLOW Frequency in population
Gene effecton disease
Figure 2. Mendelian and complex disease, a comparison. Mendelian diseases have a lower frequency in the population compared to complex diseases. On the other hand, Mendelian diseases are caused by a single or very few genes with greater effect on disease development compared to complex diseases. (Based on Juran et al
2).

14
CELL DIVISION
Simple in principle, complicated in practice
There are two major characteristics of an organism - growth and reproduction. Both of them are achieved by cell division.
Growth is due to mitosis, a process of cell division resulting in two identical copies of the original cell. Before the cell starts dividing, the chromosomes are duplicated by the process called DNA replication. The double helix unwinds and the two strands separates. Each strand is now a template for a new DNA molecule. New strands are formed by pairing complementary bases with the old strands. Two new molecules are made; each has one new and one old strand. They are both identical to the original DNA molecule.
Parental DNA molecule
1st replication
2nd replication
Figure 3. DNA-replication. The synthesis of the DNA using itself as a template. In the first replication cycle, the parental DNA molecule (indicated by rough lines) unwinds making two templates for the synthesis of new strands. After each replication cycle the daughter molecules contain one parental strand and one newly-replicated strand.
Mitosis precisely and evenly divides duplicated chromosomes, providing each new cell with an identical and complete set of genetic instructions. Of course, the other cell components (organelles and cytoplasm) are also duplicated and
15
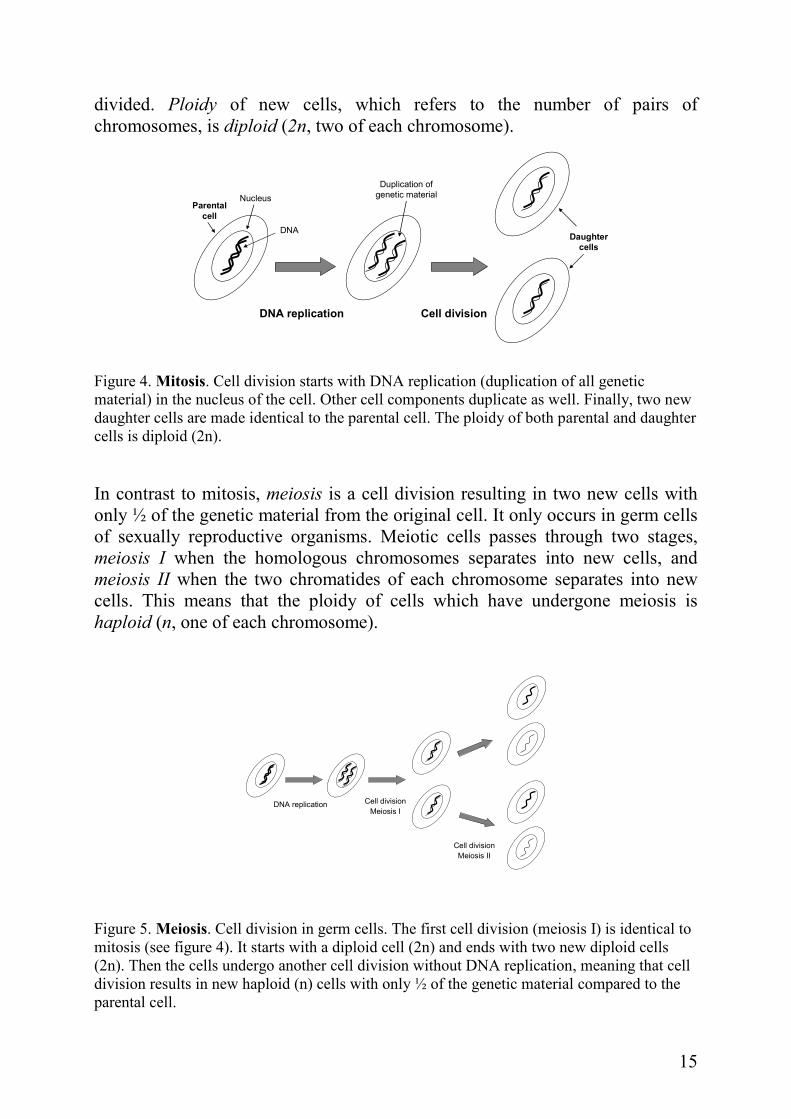
divided. Ploidy of new cells, which refers to the number of pairs of chromosomes, is diploid (2n, two of each chromosome).
DNA replication Cell division
DNA
NucleusParental
cell
Duplication of
genetic material
Daughter
cells
Figure 4. Mitosis. Cell division starts with DNA replication (duplication of all genetic material) in the nucleus of the cell. Other cell components duplicate as well. Finally, two new daughter cells are made identical to the parental cell. The ploidy of both parental and daughter cells is diploid (2n).
In contrast to mitosis, meiosis is a cell division resulting in two new cells with only ½ of the genetic material from the original cell. It only occurs in germ cells of sexually reproductive organisms. Meiotic cells passes through two stages, meiosis I when the homologous chromosomes separates into new cells, and meiosis II when the two chromatides of each chromosome separates into new cells. This means that the ploidy of cells which have undergone meiosis is haploid (n, one of each chromosome).
DNA replication Cell division
Meiosis I
Cell division
Meiosis II
Figure 5. Meiosis. Cell division in germ cells. The first cell division (meiosis I) is identical to mitosis (see figure 4). It starts with a diploid cell (2n) and ends with two new diploid cells (2n). Then the cells undergo another cell division without DNA replication, meaning that cell division results in new haploid (n) cells with only ½ of the genetic material compared to the parental cell.
16
THE CENTRAL DOGMA OF MOLECULAR BIOLOGY
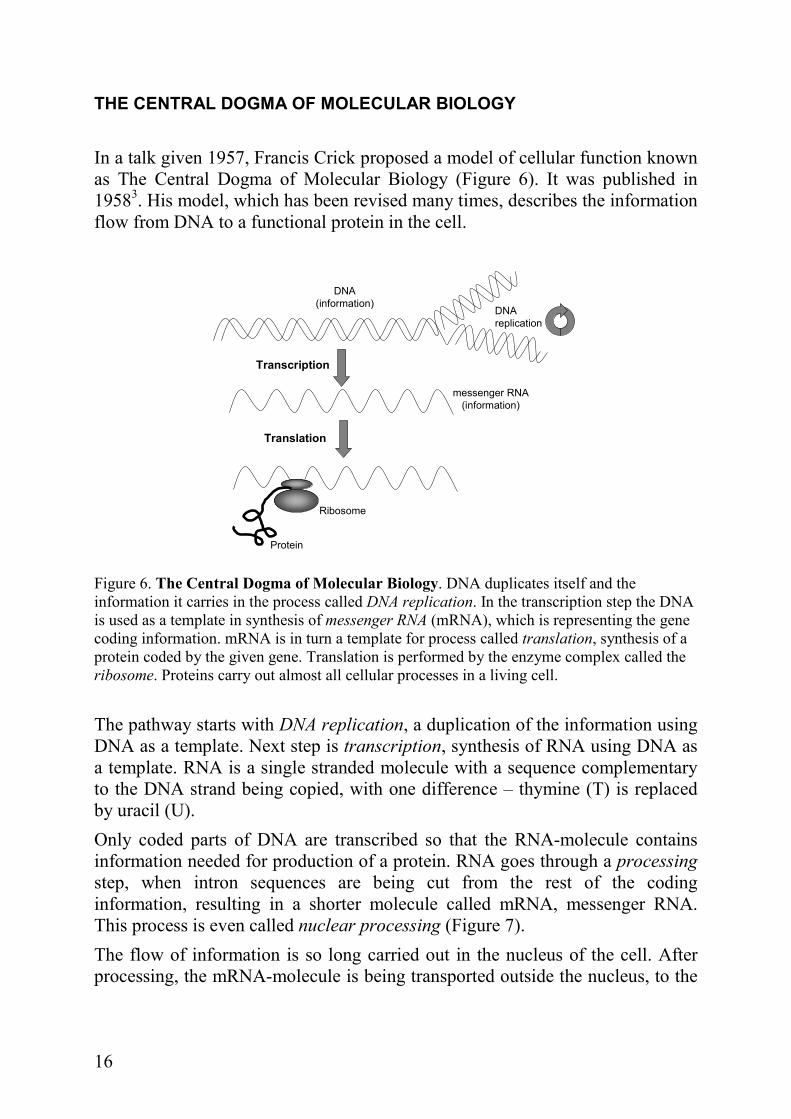
In a talk given 1957, Francis Crick proposed a model of cellular function known as The Central Dogma of Molecular Biology (Figure 6). It was published in 19583. His model, which has been revised many times, describes the information flow from DNA to a functional protein in the cell.
DNA
replication
Transcription
Translation
Protein
messenger RNA
(information)
DNA
(information)
Ribosome
Figure 6. The Central Dogma of Molecular Biology. DNA duplicates itself and the information it carries in the process called DNA replication. In the transcription step the DNA is used as a template in synthesis of messenger RNA (mRNA), which is representing the gene coding information. mRNA is in turn a template for process called translation, synthesis of a protein coded by the given gene. Translation is performed by the enzyme complex called the ribosome. Proteins carry out almost all cellular processes in a living cell.
The pathway starts with DNA replication, a duplication of the information using DNA as a template. Next step is transcription, synthesis of RNA using DNA as a template. RNA is a single stranded molecule with a sequence complementary to the DNA strand being copied, with one difference – thymine (T) is replaced by uracil (U).
Only coded parts of DNA are transcribed so that the RNA-molecule contains information needed for production of a protein. RNA goes through a processing step, when intron sequences are being cut from the rest of the coding information, resulting in a shorter molecule called mRNA, messenger RNA. This process is even called nuclear processing (Figure 7).
The flow of information is so long carried out in the nucleus of the cell. After processing, the mRNA-molecule is being transported outside the nucleus, to the
17
cytoplasm, where the next step is taking place: protein synthesis or translation. This process involves large molecular complexes called ribosomes.
Coding sequence of DNA (gene)
Newly syntethized RNA (T=U)
TRANSCRIPTION
RNA PROCESSING
RNA PROCESSING
RNA PROCESSING
mRNA
Figure 7. From DNA to mRNA. Flow of information in the cell nucleus.
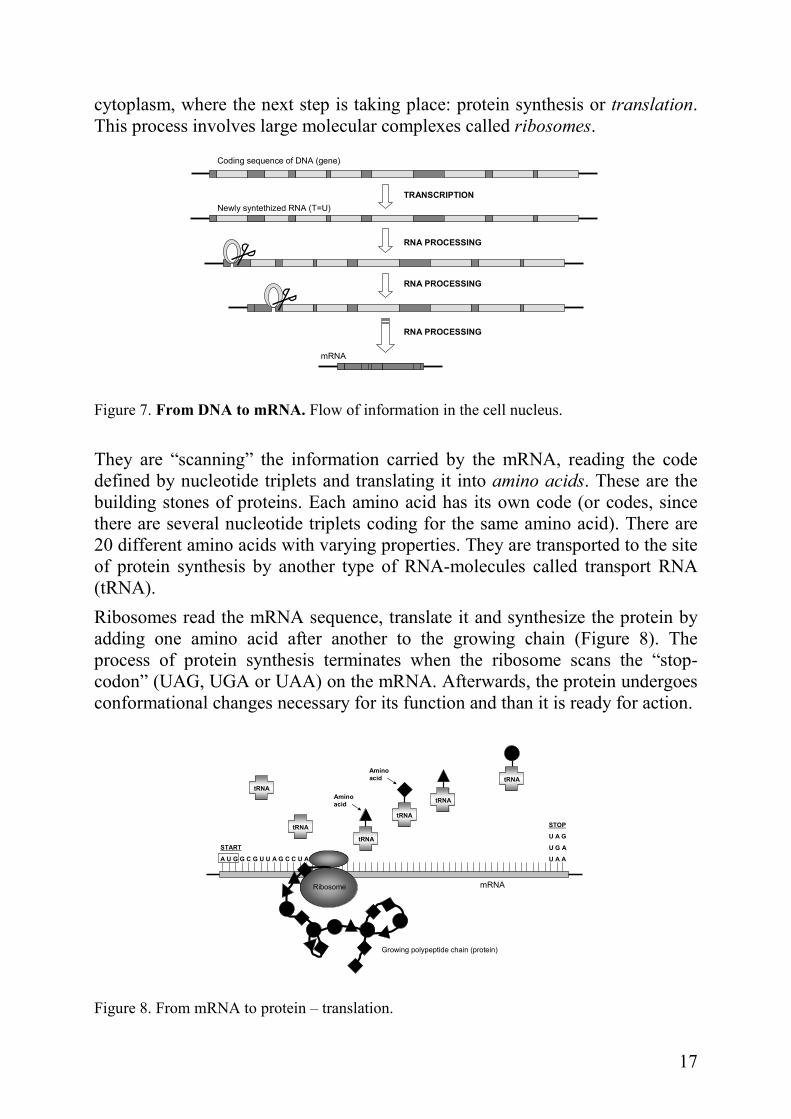
They are “scanning” the information carried by the mRNA, reading the code defined by nucleotide triplets and translating it into amino acids. These are the building stones of proteins. Each amino acid has its own code (or codes, since there are several nucleotide triplets coding for the same amino acid). There are 20 different amino acids with varying properties. They are transported to the site of protein synthesis by another type of RNA-molecules called transport RNA (tRNA).
Ribosomes read the mRNA sequence, translate it and synthesize the protein by adding one amino acid after another to the growing chain (Figure 8). The process of protein synthesis terminates when the ribosome scans the “stop-codon” (UAG, UGA or UAA) on the mRNA. Afterwards, the protein undergoes conformational changes necessary for its function and than it is ready for action.
STOP
U A G
U G A
U A A
START
A U G G C G U U A G C C U A
Ribosome
tRNA
tRNA
tRNA
tRNA
tRNA
tRNA
mRNA
Amino
acid
Amino
acid
Growing polypeptide chain (protein)
Figure 8. From mRNA to protein – translation.

18
CROSSING OVER / RECOMBINATION
Mother Nature’s own bioengineering One important event during the meiosis I is the crossing over of chromatides. The two homologues break at identical positions and then the “broken” sections join the other homologue (Figure 9). This creates new combinations of alleles on each chromosome called recombinants. Crossing over occurs randomly at least once and sometimes several times on every chromosome. This helps “mixing” the genes the offspring inherit from its parents.
The farther apart two genes are, the greater the chance of crossing over occurring between them and the greater the chance of recombination between them. It occurs randomly between two homologous DNA segments, thus the frequency of recombination between two sites is reflecting the physical distance between the sites. The average proportion of times recombination occurs between two locations on the chromosome (loci) per meiosis, is referred to as recombination fraction, θ. It varies from 0 for two completely linked loci and 0.5 for two unlinked loci (maximum value 0.5 corresponds to 50% chance for recombination).
Figure 9. Crossing over. Sometimes during the cell division the two chromosomes of a homologous pair may exchange segments, producing genetic variation.
One genetic map unit or 1 M (morgan) is the distance between two loci for which the average number of crossovers is 1. Smaller units, centi-morgans (cM), are more convenient to use. 1cM corresponds to about 750,000 to 1,000,000 base pairs in humans and is named after the pioneering geneticist Thomas Hunt Morgan.
Probability of crossing over increases with increased distance between the two loci and is not constant over the chromosome. There is a strong inhibition of crossing over near the centromere, e.g. For unknown reason, there are regions on
19
the chromosome where recombination occur more frequently than in other parts. Such regions are called hot spots of recombination.
If there is no recombination between two genes, they will be passed together to the offspring. Such genes are said to be linked together.
GENETIC LINKAGE
Building genetic maps
Linkage in humans can be detected using pedigree analysis and following the pattern for inheritance of a trait from parents to their children. If the trait is often passed to the next generation together with specific markers, then we can conclude that genes governing the trait are located close to these markers on the chromosome. Generally, genetic markers used in linkage studies are sites of heterozygosity, a kind of silent DNA variation that is not associated with any measurable phenotypic expression. The most frequently used types of markers are microsatellites and single nucleotide polymorphisms (SNPs).
Microsattelites are short DNA sequences arranged in a repetitive pattern. They are also called short tandem repeats. Microsatellites can be up to six nucleotides long: two-nucleotide repeats (CACACA…), three-nucleotide repeats (CTGCTGCTG…), tetra repeats of four nucleotides (ACTCACTCACTC…) The number of times the sequence is repeated often varies between individuals in the population, which makes microsatellites very suitable for following the inheritance pattern in pedigrees. They are abundant, evenly distributed through the genome and highly polymorphic. Estimated number of microsatellites in the human genome is ~ 165.0004. Microsatellites are inherited according to Mendelian laws5.
The other types of genetic variances are single nucleotide polymorphisms, SNPs. As the name clearly implies, they occur when a single nucleotide in a certain position in the genome varies between individuals. SNPs are highly abundant in the human genome and are found with much higher frequency in non-coding than in coding regions. According to dbSNP build 129 (April 2008) there are 14,708,752 SNPs in the human genome (http://www.ncbi.nlm.nih.gov/projects/SNP/), of which 6,573,789 are validated by independent re-sequencing.
In contrast to genetic maps, the physical maps are made by sequencing the DNA which gives the exact position of every gene and nucleotide on the chromosome.
20
MUTATIONS
For better or for worse…
Mutations are changes in DNA sequence. They can be caused by radiation (X-rays, cosmic rays, man-made or natural radioactive sources), chemicals, viral infections or arise spontaneously due to unequal crossing over or recombination. The daily mutation rate in human cells is 6 000 mutations/cell, but efficient repair mechanisms ensure that most of these are repaired. However, some of those DNA mutations become permanent in our cells during a lifetime, either through mistakes during DNA copying or cell division or, because of damages from the environment. Mutations occur in all types of cells with various consequences: in somatic cells they can cause cancer and in germ cells they can lead to new traits in the offspring. But, we can not forget that mutations sometimes have beneficial outcome in evolutionary perspective by giving the organism a better chance for adapting to environmental changes.
There is a range of DNA mutations:
• Gene mutations; large segments are affected or a single nucleotide within a codon or a regulatory region is altered (point mutations). Example for the latter:
ACGGTC Original DNA sequence
ACTGTC Substitution; replacement of a single nucleotide with another nucleotide
AGCGTC Inversion; two neighbouring nucleotides change their places
ACGGCTC Insertion; a single nucleotide is randomly added in a sequence
ACGTC Deletion; a single nucleotide is removed from the sequence
AACGGTC Duplication; addition of the same kind of nucleotide in the sequence.
Mutations may have severe effects on the protein which is coded by the sequence. Insertions, deletions and duplications cause a frame shift in the open reading frame (ORF), which may result in altered protein function or dysfunctional protein. Substitution and inversion may change an amino acid in the sequence of the protein or cause a premature termination of translation by making a “stop-codon”.
21
• Chromosomal mutations; two classes exist:
Structural mutations can involve deletions, insertions, or inversions of large sections of DNA. In some cases, deleted sections may attach to other chromosomes, disrupting both the chromosome that loses the DNA and the one that gains it. Such mutations are also called chromosome rearrangements.
Numerical changes, loss or gain of an entire chromosome. If this kind of mutation takes place in a germ cell, it results in changes of total number of chromosomes in the offspring. Examples:
Trisomy gain of one chromosome (Down’s syndrome, gain of chr 21)
Monosomy loss of one chromosome (Turner’s syndrome, loss of chr X)
POLYMERASE CHAIN REACTION, PCR
One of the major breakthroughs in the field of genetics was the Polymerase Chain Reaction, PCR. It was invented and first described by Kary Mullis in 1985, published in 19876 and rewarded by Nobel Prize in 1993.
“I was working for Cetus, making oligonucleotides. They were heady
times. Biotechnology was in flower and one spring night while the
California buckeyes were also in flower I came across the polymerase
chain reaction. I was driving with Jennifer Barnett to a cabin I had been
building in northern California. She and I had worked and lived together
for two years. She was an inspiration to me during that time as only a
woman with brains, in the bloom of her womanhood, can be. That morning
she had no idea what had just happened. I had an inkling. It was the first
day of the rest of my life.”
- from Karry Mullis’s autobiography at the Nobel e-
Museum
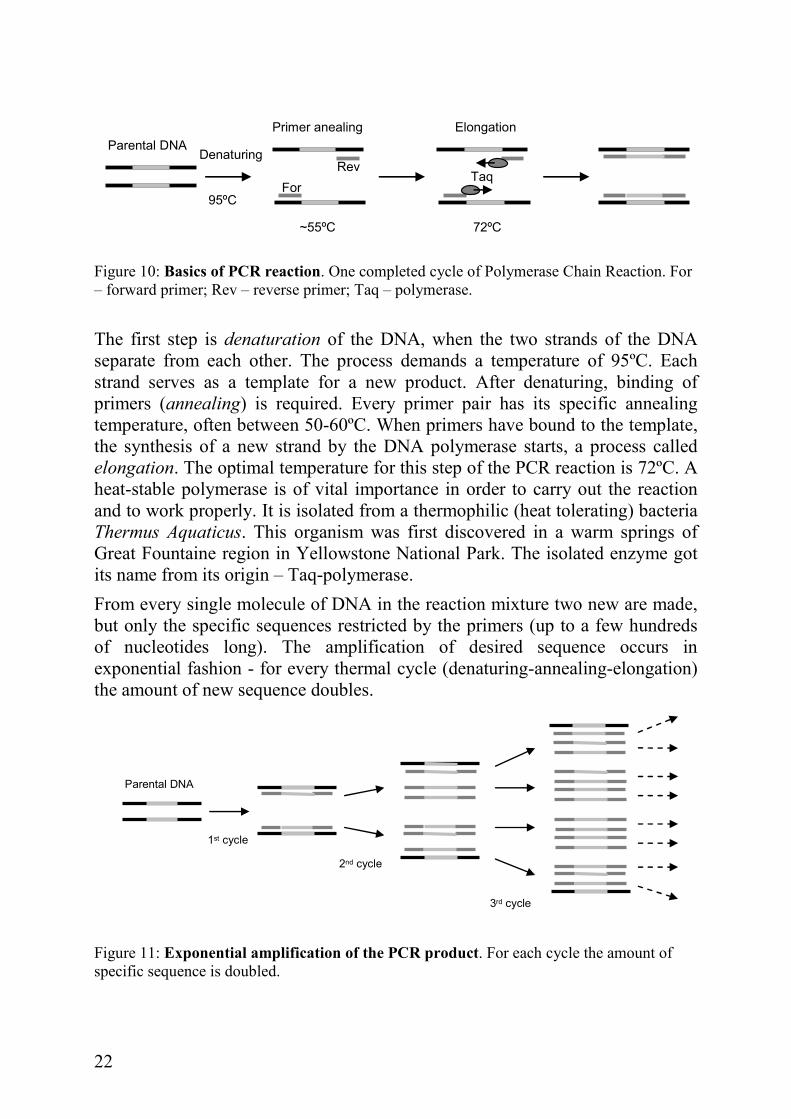
In a few words, PCR can be described as DNA replication in a test tube. It targets and amplifies specific sequences from a mixture of DNA. The reaction requires genomic DNA, sequence-specific forward and reverse primers, DNA polymerase, free nucleotides and buffer containing magnesium. The basics of the reaction are explained in the figure 10.
22
Parental DNA Denaturing
95ºC
Primer anealing
~55ºC
Elongation
72ºC
For
RevTaq
Figure 10: Basics of PCR reaction. One completed cycle of Polymerase Chain Reaction. For – forward primer; Rev – reverse primer; Taq – polymerase.
The first step is denaturation of the DNA, when the two strands of the DNA separate from each other. The process demands a temperature of 95ºC. Each strand serves as a template for a new product. After denaturing, binding of primers (annealing) is required. Every primer pair has its specific annealing temperature, often between 50-60ºC. When primers have bound to the template, the synthesis of a new strand by the DNA polymerase starts, a process called elongation. The optimal temperature for this step of the PCR reaction is 72ºC. A heat-stable polymerase is of vital importance in order to carry out the reaction and to work properly. It is isolated from a thermophilic (heat tolerating) bacteria Thermus Aquaticus. This organism was first discovered in a warm springs of Great Fountaine region in Yellowstone National Park. The isolated enzyme got its name from its origin – Taq-polymerase.
From every single molecule of DNA in the reaction mixture two new are made, but only the specific sequences restricted by the primers (up to a few hundreds of nucleotides long). The amplification of desired sequence occurs in exponential fashion - for every thermal cycle (denaturing-annealing-elongation) the amount of new sequence doubles.
Parental DNA
1st cycle
2nd cycle
3rd cycle
Figure 11: Exponential amplification of the PCR product. For each cycle the amount of specific sequence is doubled.
23
FINDING GENES
Looking for a needle in a haystack
Disease susceptibility factors (genes or genetic variants) are possible to locate in the genome by measuring the associations between genetic markers and the disease in a certain population. In multifactorial (or complex) traits, which the most traits actually are, finding susceptibility factors might be a challenge because of possible interactions between the causal genes (epistasis), interactions between genes and environmental factors, genetic heterogeneity or sometimes limited statistical power7; 8. One difficulty geneticists often meet is that a great deal of identified genetic risk factors is likely to account for very small fractions of the variation in a given phenotype.
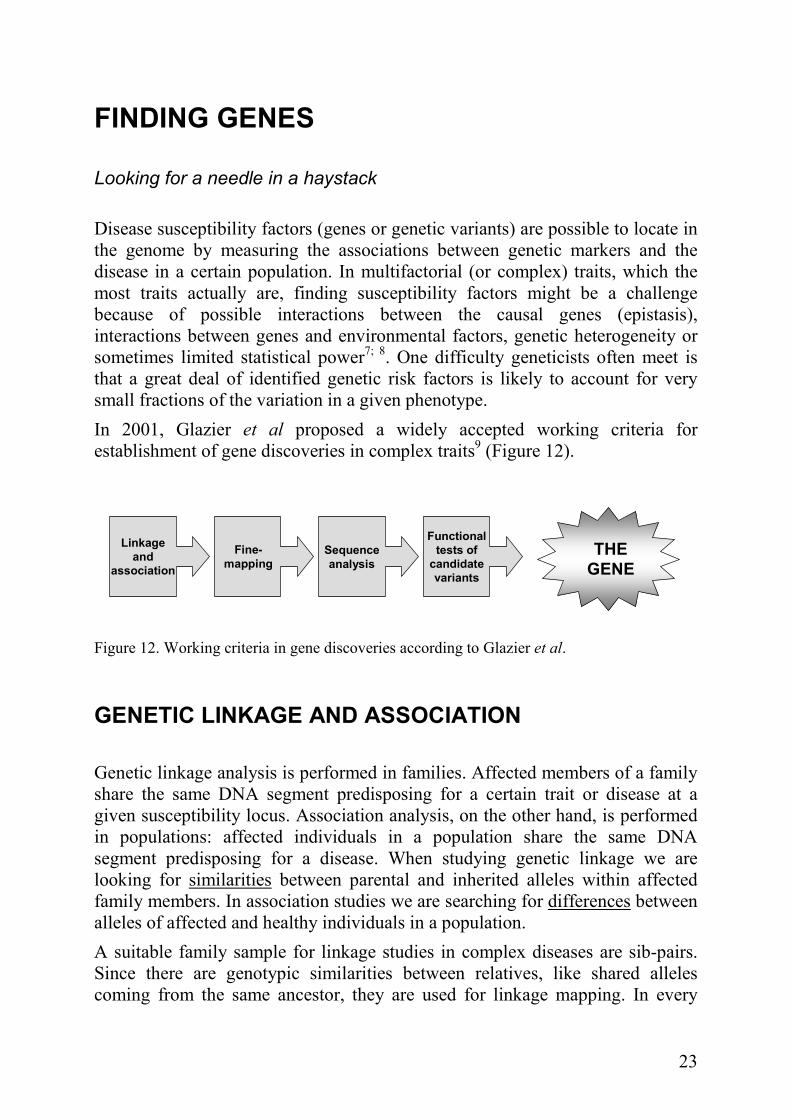
In 2001, Glazier et al proposed a widely accepted working criteria for establishment of gene discoveries in complex traits9 (Figure 12).
Linkage
and
association
Fine-
mapping
Sequence
analysis
Functional
tests of
candidate
variants
THE
GENE
Figure 12. Working criteria in gene discoveries according to Glazier et al.
GENETIC LINKAGE AND ASSOCIATION
Genetic linkage analysis is performed in families. Affected members of a family share the same DNA segment predisposing for a certain trait or disease at a given susceptibility locus. Association analysis, on the other hand, is performed in populations: affected individuals in a population share the same DNA segment predisposing for a disease. When studying genetic linkage we are looking for similarities between parental and inherited alleles within affected family members. In association studies we are searching for differences between alleles of affected and healthy individuals in a population.
A suitable family sample for linkage studies in complex diseases are sib-pairs. Since there are genotypic similarities between relatives, like shared alleles coming from the same ancestor, they are used for linkage mapping. In every
24
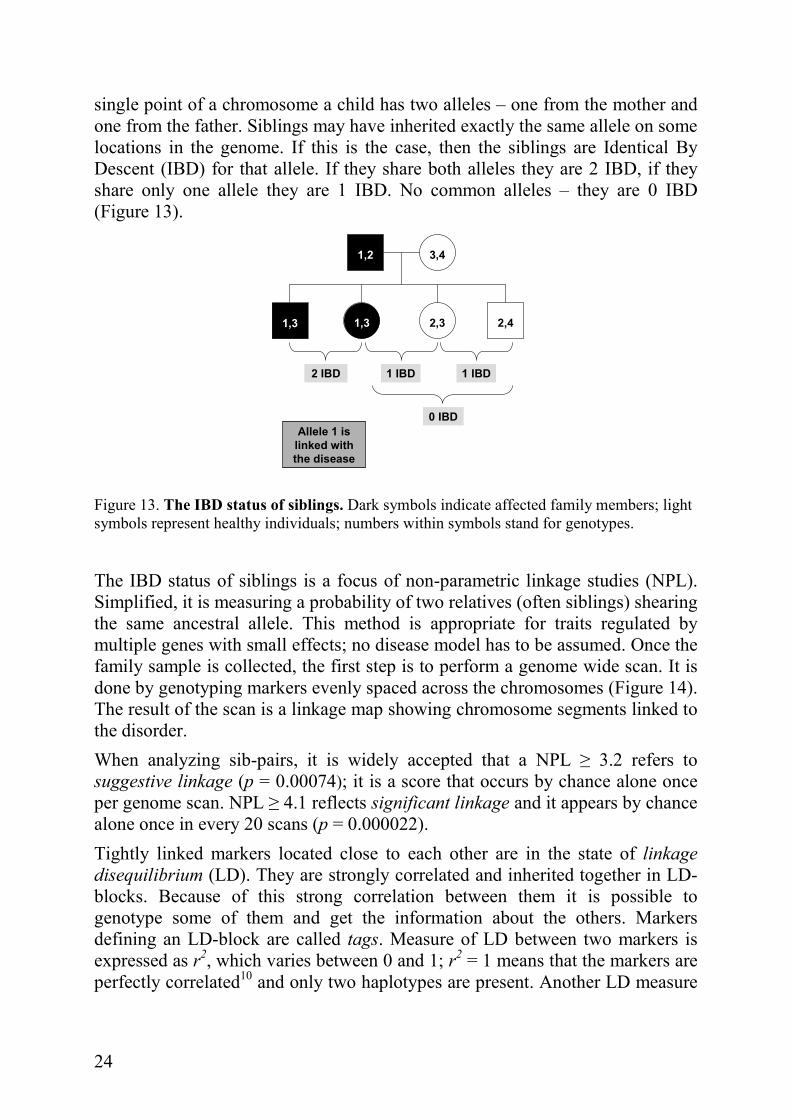
single point of a chromosome a child has two alleles – one from the mother and one from the father. Siblings may have inherited exactly the same allele on some locations in the genome. If this is the case, then the siblings are Identical By Descent (IBD) for that allele. If they share both alleles they are 2 IBD, if they share only one allele they are 1 IBD. No common alleles – they are 0 IBD (Figure 13).
1,2 3,4
1,3 1,3 2,42,3
2 IBD 1 IBD
0 IBD
Allele 1 is
linked with
the disease
1 IBD
Figure 13. The IBD status of siblings. Dark symbols indicate affected family members; light symbols represent healthy individuals; numbers within symbols stand for genotypes.
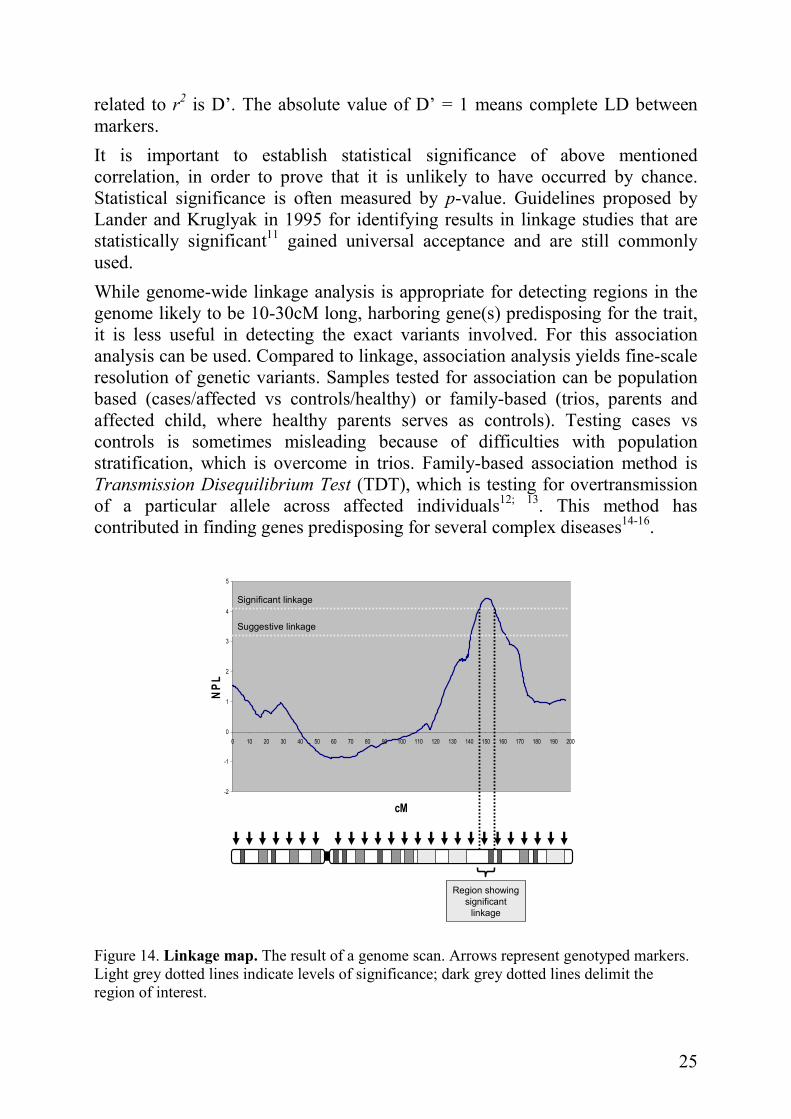
The IBD status of siblings is a focus of non-parametric linkage studies (NPL). Simplified, it is measuring a probability of two relatives (often siblings) shearing the same ancestral allele. This method is appropriate for traits regulated by multiple genes with small effects; no disease model has to be assumed. Once the family sample is collected, the first step is to perform a genome wide scan. It is done by genotyping markers evenly spaced across the chromosomes (Figure 14). The result of the scan is a linkage map showing chromosome segments linked to the disorder.
When analyzing sib-pairs, it is widely accepted that a NPL ≥ 3.2 refers to suggestive linkage (p = 0.00074); it is a score that occurs by chance alone once per genome scan. NPL ≥ 4.1 reflects significant linkage and it appears by chance alone once in every 20 scans (p = 0.000022).
Tightly linked markers located close to each other are in the state of linkage
disequilibrium (LD). They are strongly correlated and inherited together in LD-blocks. Because of this strong correlation between them it is possible to genotype some of them and get the information about the others. Markers defining an LD-block are called tags. Measure of LD between two markers is expressed as r2, which varies between 0 and 1; r2 = 1 means that the markers are perfectly correlated10 and only two haplotypes are present. Another LD measure
25
related to r2 is D’. The absolute value of D’ = 1 means complete LD between markers.
It is important to establish statistical significance of above mentioned correlation, in order to prove that it is unlikely to have occurred by chance. Statistical significance is often measured by p-value. Guidelines proposed by Lander and Kruglyak in 1995 for identifying results in linkage studies that are statistically significant11 gained universal acceptance and are still commonly used.
While genome-wide linkage analysis is appropriate for detecting regions in the genome likely to be 10-30cM long, harboring gene(s) predisposing for the trait, it is less useful in detecting the exact variants involved. For this association analysis can be used. Compared to linkage, association analysis yields fine-scale resolution of genetic variants. Samples tested for association can be population based (cases/affected vs controls/healthy) or family-based (trios, parents and affected child, where healthy parents serves as controls). Testing cases vs controls is sometimes misleading because of difficulties with population stratification, which is overcome in trios. Family-based association method is Transmission Disequilibrium Test (TDT), which is testing for overtransmission of a particular allele across affected individuals12; 13. This method has contributed in finding genes predisposing for several complex diseases14-16.
-2
-1
0
1
2
3
4
5
0 10 20 30 40 50 60 70 80 90 100 110 120 130 140 150 160 170 180 190 200
cM
NPL
Suggestive linkage
Significant linkage
Region showing
significant
linkage
Figure 14. Linkage map. The result of a genome scan. Arrows represent genotyped markers. Light grey dotted lines indicate levels of significance; dark grey dotted lines delimit the region of interest.

26
GENOME-WIDE ASSOCIATION STUDIES (GWAS)
“The goal of the International HapMap Project is to determine the
common patterns of DNA sequence variation in the human genome and to
make this information freely available in the public domain. An
international consortium is developing a map of these patterns across the
genome by determining the genotypes of one million or more sequence
variants, their frequencies and the degree of association between them, in
DNA samples from populations with ancestry from parts of Africa, Asia
and Europe.”
Nature, 18 december 2003
The International Haplotype Mapping (HapMap) Project has been a success in the last few years17. It is an international consortium consisting of 19 research centres. 270 individuals from populations with African, Asian and European ancestry have been genotyped for known variants across the genome with a minor allele frequency (MAF) > 0.05. Together with completion of the Human Genome Project in 2003 and constantly developing high throughput genotyping technology, it gives a possibility of scanning the whole genome for association with realistic sample sizes at affordable cost.
The method is based on examination of common variations in the genome. Because variations are inherited in blocks (the LD phenomenon) not all of them need to be genotyped, but still approximately 500,000 to 1 million SNPs are tested in each assay, which means that association signals must show a high level of statistical significance to survive the correction for multiple testing. According to the Catalog of Published Genome-Wide Association Studies (www.genome.gov), following the NHGRI/NIH criteria, 245 GWAS have been published and 1114 associated SNPs reported with p-values < 0.00001 as of 21 January 2009. One of the studies that attracted much attention is The Wellcome Trust Case-Control Consortium’s (WTCCC’s) GWAS for seven common complex diseases (coronary hart disease, type 1 diabetes, type 2 diabetes, rheumatoid arthritis, Crohn’s disease, bipolar disorder and hypertension) which was successful in uncovering many new disease genes underlying these diseases18.

27
CELIAC DISEASE
The world embracing illness
GLUTEN – NUTRITIOUS OR TOXIC?
Celiac Disease (CD) or Gluten Sensitive Enteropathy (GSE) is a life-long disorder characterized by inflammation in the small intestine of genetically predisposed individuals caused by inappropriate immune response to gluten. Gluten is formed when water is mixed with flour in bread baking process and it gives elasticity and viscosity to dough. It is mainly composed of endosperm proteins gliadin and glutenin (~80%), starch, lipids and fibres. Gliadin and glutenin are proteins enriched in wheat, related proteins in rye are called secalins and in barley hordeins19. Gliadin belongs to the group of prolamines, hydrophobic proteins with high content of glutamine and proline, which are soluble only in strong alcohol solutions. Glutenin is a member of glutelin family, soluble in diluted bases or acids. Both prolamines and glutelines are storage proteins, poor in nutritionally important amino acids.
The first findings in studies of gluten toxicity to celiac patients indicated that it was the gliadin fraction of gluten that was immunostimulatory factor in CD20. Most of the research in this field was focused on gliadin21-23 and the role of glutenin was ignored for a long time. But, the increasing understanding of their chemical structure and new analyzing methods revealed many similarities between them. Since 1999, several independent studies have shown that even glutenin is capable of raising the immune reaction in celiac patients24-26.
The toxicity of gluten is manifested by the autoimmune action of T-lymphocytes on mucosal cells in the small intestine, disrupting its vital function of absorbing nutrients from the food (Figure 15).
Gluten peptides, digested by the endopeptidases in the intestinal lumen, are being transported into the lamina propria, where deamidation of the peptides by tissue transglutaminase (tTG) takes place. These modified peptides are presented to the immune system by antigen presenting cells, carrying HLA molecules on their surface. Peptides are recognized by naïve CD4+ T-lymfocytes in association with HLA-DQ2 or DQ8, which activates them and initiates production of IFNγ and other inflammatory cytokines (Figure 16). The luminal surface of inflamed intestinal cells, which under normal conditions is enormously enlarged because of a presence of finger-like structures (villi), is now damaged and reduced.

28
Time of exposure to gluten
Gluten peptide
T
TD
T
TT T T
T
T
T
Healthy Inflamed Apoptotic
T
Figure 15. The autoimmune action on the intestinal cells in the presence of gluten. D indicates dendritic cell, acting as antigen presenting cell (APC); white T-cell represents naïve CD4+ T-cell; black T-cells are activated T-cells mediating their cytotoxic action via cytokines (IFNγ, TNFα, IL-15).
Cells are shrinking and contacts between them are destroyed. Consequently, the distance between cells increases and the passage for gluten peptides from lumen to lamina propria gets much easier. More gluten peptides support further T-cell activation, maintaining the inflammatory reaction in the gut. Long-term exposure to gluten leads to impaired intestinal function and cell death.
APCCD4+T
naïve
T active
HLA-DQ2 or
DQ8TCR
Gluten
peptideIL-15IFNγ
TNFα
Figure 16. Recognition of the gluten peptide and activation of the immune response. APC – antigen presenting cell carrying HLA-DQ2 or DQ8 molecule on its surface. TCR – T-cell receptor. IFNγ, TNFα, IL-15 – inflammatory cytokines secreted by the active T-cell.
29
CLINICAL MANIFESTATIONS OF CD
Symptomatically, CD is a very heterogeneous disorder. Patients show a wide variety of disease phenotypes. Symptoms may be “classical” with gastrointestinal manifestations like abdominal pain, vomiting and diarrhoea or constipation. Such symptoms are frequent in young patients and children27. The disease in children leads to growth stagnation due to malabsorption and in many cases delay of puberty or absence of it.
“Atypical” manifestation of CD with no symptoms from the gut is common in adult patients. Instead, they have symptoms of systemic character28 including weight loss, tiredness and fatigue. In some cases patients can be generally asymptomatic, but still having an ongoing inflammation in the intestine. Those patients have so called silent CD
29.
One group of patients may have positive serology due to inflammation, but no visible lesions or damage in the intestinal mucosa. The damage may come up later in life. This phenotype is known as potential or latent CD
30.
In all cases, untreated CD involves risk for major complications: Dermatitis herpetiformis (skin disease associated with CD)31, nutritional deficiencies32, osteoporosis33, anaemia34, fertility problems35, neurological disturbances36; 37 and malignancies38; 39. An Italian retrospective study from 2001 reported two fold increased mortality in undiagnosed celiac patients of all ages40, mostly because of developed lymphomas. The only known treatment for CD is lifelong adherence to gluten-free diet (GFD).
EPIDEMIOLOGY OF CD: the famous “Celiac Iceberg”
For a long time CD was considered a rare disease, but rapidly developing diagnostic methods in the past decade have changed this misconception. Considering geographical distribution of risk factors for CD – gluten-containing grains and HLA-haplotypes predisposing to disease, Europe is clearly a high-risk area41, but even in regions where CD was considered historically rare (South America, North Africa and Asia) new studies are showing that the disorder is evenly spread and the prevalence is estimated to ~1% in the US and other developed countries42; 43. Lower numbers in some countries are probably due to inaccuracy in reporting routines.
Looking at the celiac iceberg (Figure 17) one huge problem appears immediately: large portions of asymptomatic, silent and latent celiac patients with no typical symptoms remain undiagnosed. Increasing awareness of diseases associated with CD is making the disease more assessable, but it is still 5-10

30
undiagnosed affected individuals on every diagnosed patient, and in some countries with rare diagnostic facilities even higher, up to 50 undiagnosed on every diagnosed celiac patient.
Asymptomatic,
silent CD
Latent CD
Symptomatic
patients
Damaged
intestine
Normal
intestine
Geneticsusceptibility(DQ2 or DQ8)
Positive serology
Figure 17. The Celiac Iceberg. A schematic presentation of CD epidemiology. The white triangle on the top of the iceberg represents the “visible” portion of all patients affected by CD, those that are diagnosed. Remaining grey areas are patients not aware of having CD.
In 2001, Green et al found that the average time from disease onset to diagnosis in adult patients was 11 years44. This finding clearly implies the need of better understanding of CD among clinicians to counteract the complications, promote health and decrease medical costs to the society.
GENETICS OF CD
There is a strong genetic predisposition for CD. Italian twin study found 86% concordance probandwise and 75% pairwise for monozygotic twins, the highest reported for a multifactorial disease45. Concordance rate of 20% for dizygotic HLA identical twins is interpreting the significance of other genes besides HLA in CD. Several regions in the genome comprising susceptibility genes for CD have been reported:
CELIAC1 on 6p21.3 containing HLA genes.
Human Leukocyte Antigen, HLA, is a molecule expressed on the surface of all cells with the essential role of presenting antigens to the immune system. It presents both self-antigens from the body, teaching the immune system not to
31
react to them, and non-self-antigens coming from the outside of the body (as pathogens or toxins), telling to the immune system that it should fight the danger. The HLA molecule is coded by the HLA genes located on chromosome 6, characterized by an extremely high allelic diversity which is of vital importance for the presenting mechanism. HLA variants predisposing for CD are DQ2 and DQ8. The vast majority of CD patients (~95%) are carrying the HLA-DQ2 genotype. Those negative for DQ2 (~5%) have the other variant, DQ8. These variants are very common in the general population as well - about 20% are DQ2 positive. So, the conclusion is that DQ2 or DQ8 are necessary but not sufficient for developing CD.
So far HLA is the only known disease predisposing genetic variant in CD. It has been reported in a number of independent CD studies46; 47 and confirmed in meta-analysis of four European genome scans48. The HLA region have been implied as a susceptibility region in many other complex diseases: psoriasis49; 50, type 1 diabetes (IDDM)51, asthma52, dyslexia53, multiple sclerosis (MS)54, rheumatoid arthritis (RA)55, inflammatory bowel disease (IBD)56, Crohn’s disease57 etc.
The HLA region is characterized by strong LD, which often make fine mapping very difficult. Despite that, the haplotypes predisposing for CD has been identified and described58. As mentioned before, the majority of all patients are carrying the HLA-DQ2 molecule. It is a dimer encoded by DQ-A1*05 and DQ-B1*02 alleles. The risk alleles may be localised either on the same chromosome (cis) or on homologous chromosomes (trans). Being homozygous for the DQ2 haplotype increases susceptibility to CD59.
CELIAC2 on 5q31-33.
This region is known as a cytokine cluster, it harbours many immunological genes which makes it interesting in CD as an autoimmune disease. This was the only non-HLA region confirmed as a risk factor in a European genome wide linkage meta-analysis48. Before that, several independent CD studies reported linkage to 5q31-3346; 47; 60. The large number of genes mapping to the region made the candidate gene approach less appealing and our group chose a fine-mapping approach61 resulting in a significant linkage signal across 18cM on 5q31-33. In order to identify candidate variants or narrow the area of interest we carried out a comprehensive screen with a reasonably high resolution62. The study pinpointed seven associated haplotype regions, but none of them could account for the linkage signal in the region.
Apart from CD, 5q31-33 is a susceptibility region in other complex diseases: asthma63; 64, Crohn’s disease65, early onset IBD66, autoimmune thyroid disease (AITD)67, bipolar disease68, RA69, etc.
32
CELIAC3 on 2q33.
This locus is harbouring the cytotoxic T-lymphocyte associated (CTLA4) gene. Upon induction, the protein coded by this gene is transported to the surface of an activated T-cell after the recognition of the antigen (in this case gluten) where it is involved in modification of co-stimulatory signals that are vital in the immune system. CD28 molecules expressed on the surface of T-cells bind to B7 molecules expressed by APC, giving a proliferative signal to the T-cell. This co-stimulatory signal is essential in activation and differentiation of T-lymphocytes in immune responses. But, for regulative purposes, negative signals are needed that counteract the T-cell activation, and that is the role of CTLA470. Since CTLA4 has a stronger affinity for B7 than CD28, it competes out the CD28 molecules, which results in an inhibitory signal to the T-lymphocyte.
Djilali-Saiah et al investigated in 1998 a polymorphism at position 49 in exon 1 of the CTLA4 gene in celiac patients71. It was a substitution of A to G (A49G) which corresponded to an amino acid threonine change to alanine in the expressed protein. The A allele was significantly overrepresented in celiac patients compared to controls. Two years later our group confirmed association of this polymorphism in Scandinavian families affected by CD72.
Associations to polymorphisms in the CTLA4 locus are reported for several complex diseases: type 1 diabetes73, Graves’ disease74, Hashimoto’s thyroiditis and Addison’s disease75, systemic lupus erythematosus (SLE)76, etc.
CELIAC4 on 19p13.1
This locus is associated with a polymorphism in the myosin IX-B (MYO9B) gene in celiac patients. Members of the myosin protein family are motor proteins involved in cell motility. In enterocytes (intestinal cells) the role of MYO9B is in remodelling of the cytoskeleton and the tight junctions, which are the connection points between the cells. They are not only the cell-to-cell contacts but the complex communication centres mediating a variety of signals and facilitating the cross-talk between cells.
The single layer of enterocytes functions as a barrier between the environmental factors in the lumen of the intestine (food and microorganisms) and the insides of the body. One hypothesis is that the mutations in the MYO9B disrupts this barrier function and enhance the paracellular permeability of the intestine77.
The MYO9B locus has shown association with CD in Dutch sib-pairs78 and in a separate case/control study79. However, several European studies could not replicate this finding80-83.
According to published data, the MYO9B genetic locus is also a susceptibility factor in other autoimmune diseases84-87.
33
CELIAC5 on 15q11-13.
Linkage to this locus has been reported for a population isolate from north-eastern Finland88 with convincing LOD score of 3.74, but no replication studies have been published. Other complex diseases associated to 15q11-13 are Prader-Willi and Angelmans syndromes89 and autism90.
CELIAC6 on 4q27.
In the first GWAS performed by van Heel and colleagues91, a locus on 4q27 comprising KIAA1109, TENR(ADAD1), IL2 and IL21 genes showed the strongest association outside of the HLA-region, approximately 25kb from the 5’-end of the IL21 gene. The highest scored SNP was rs6822844 (overall p = 1.3x10⁻¹⁴). Because of very powerful LD the causal variant/s could not be determined in this study, however, the region was confirmed in three independent European samples. Also in our cohort this SNP showed a significant association to CD (p = 2x10⁻³)92.
Since the IL2 and IL21 genes are of great immunological importance, one possible hypothesis is that this locus is a general susceptibility locus in autoimmune diseases. A Dutch group tested this hypothesis in T1D and RA, and came to the conclusion that it was the case for both disorders93.
CELIAC7 on 1q31.
The third strongest association from the GWAS and its follow up study92 was to rs2816316 (p = 2.6x10⁻¹¹). This SNP is located within the strong LD block containing the RGS1 gene, which is involved in B-cell activation and proliferation through the regulation of the chemokine receptor signalling. RGS1 is found to be expressed in small intestinal biopsies94, which makes it even more interesting in CD.
CELIAC8 on 2q11-12.
This locus on chromosome 2, encompasses two genes coding for the receptor of the IL18 protein, IL18RAP and IL18R. This cytokine is highly relevant in CD since it induces T-cells to synthesize IFNγ which is involved in the intestinal inflammation. The locus has already been reported as susceptibility region in Crohn’s disease in a study from Welcome Trust Case Control Consortium (WTCCC)95 and in both ulcerative colitis and Crohn’s disease by Zhernakova et
al96.

34
CELIAC9 on 3p21.
A cluster of chemokine receptor genes influencing susceptibility to CD maps to this locus. Chemokines are proteins involved in the immune response; they act as chemoattractants and activators of lymphocytes (immune cells). The cluster includes CCR1, CCR2, CCRL2, CCR3, CCR5 and XCR1. We are currently testing SNPs in this locus.
CELIAC10 on 3q25-26.
A locus near the IL12A (or p35) gene which functions as a link between the innate and acquired immune responses. This region is linked to Asperger syndrome and autism as well97.
CELIAC11 on 3q28.
A locus within an LD block near the LPP gene (lipoma-preferred partner), involved in translocation of benign lipomas94.
CELIAC12 on 6q25.
A locus encompassing the TAGAP gene coding for a protein expressed by activated T-cells98. An SNP within TAGAP is associated with T1D99.
CELIAC13 on 12q24.
Association to two SNPs proximal to the SH2B3 gene (p = 8x10⁻⁸). One of the SNPs, rs3184504, has previously shown very strong association to T1D95. SH2B3 is highly expressed in lymphocytes (monocytes, dendritic cells, B- and T-cells). It is also expressed in small intestinal biopsies of celiac patients94, but this may be due to lymphocyte recruitment under the ongoing inflammatory response.
The locus on 12q24 is also involved in susceptibility to schizophrenia100 and SLE101.
Regions CELIAC7-13 are all confirmed in the GWAS follow-up study by Hunt et al94.

35
THIS STUDY
BACKGROUND
Our genome-wide scan of Swedish/Norwegian multiplex families was performed and published in 200147. From the beginning, 70 families were tested for linkage in order to identify susceptibility genes for CD. First preliminary results were followed up by additional genotyping of 34 multiplex families in regions with potential linkage to CD.
Beside the HLA-region on chromosome 6, eight other chromosomal regions showed nominal significance (p < 0,05), among them 5q31-33. This region was previously suggested as a susceptibility region in other complex diseases: asthma in Australian children in 1998102, rheumatoid arthritis (RA) in a French study in 1999103, inflammatory bowel disease (IBD) in Canadian families in 200066 and T1D in Australian study in 200163. Also, two other European groups reported 5q31-33 as a susceptibility region in celiac disease: one Finnish104 and one Italian60.
In the year 2000 our group got involved in The European Genetics Cluster on Celiac Disease. Beside Sweden, members of the cluster were Norway, Italy, France, United Kingdom and Finland. The main goal of the international collaboration was to bring data from four independent European genome scans together and evaluate results. Meta- and mega analysis was performed and published in 2003 in an article that attracted much attention48. In this pooled analysis, 5q31-33 was the only genetic region, except for HLA, that without a doubt manifested linkage to CD.
It was now confirmed, both in independent studies and in a joint analysis, that “there was something lurking on 5q” and it was the time to find out what that “something” was. The region of interest was approximately 18 cM long, comprising a cluster of immunologically important genes. Many of those genes seemed to be obvious candidates, but the problem was – they were too many. The only possible and manageable approach was to narrow the area of interest by fine mapping.
The period of intense genotyping was about to begin…
36
AIM
The main goal of this study was to explore the region of 18cM on 5q31-33, identify genetic risk factors and evaluate their contribution to the development of CD.
MATERIAL & METHODS
FAMILIES
During the 1990’s great efforts was done at the Queen Silvia’s Children’s Hospital in Gothenburg in collecting blood samples and clinical data from Swedish and Southern Norwegian sib-pairs affected by CD and their parents105. The aim was to perform a genome-wide scan in order to identify genes responsible for development of CD in the Scandinavian population. Only families who met all diagnostic criteria according to the ESPGHAN106 was included in the study. A sample of 107 families was collected, referred to as multiplex families in further text. Affected individuals were diagnosed by serological screening of blood samples and pathological evaluation of small intestinal biopsies before and after gluten-free diet and after gluten challenge.
Additional sample of 225 trios affected by celiac disease was collected at the same time for confirmation studies, preferably from South-West Sweden and Southern Norway. Diagnostic criteria were the same as for sib-pair families. This sample is referred to as simplex families in further text.
GENOTYPING: Concept of genetic markers
Microsatellites
Microsatellites were genotyped by fragment length analysis. Amplified, fluorescently labeled PCR-product was loaded on a gel. Different lengths of alleles (meaning – different number of repeats in the amplified sequence) were then separated by electrophoresis. The fluorescent dye enabled visualisation of the fragments by laser in an ABI PRISM® 377XL DNA sequencer (Applied Biosystems®). Alleles were analyzed by Genotyper® v 2.0 software (Applied Biosystems®).
37
SNPs
SNPs were analyzed by several different methods:
SNaPshot™: This method enables multiplexed runs with panels of up to ten SNPs in a single reaction. It is based on single-nucleotide extension of the unlabeled primer. The primer binds to the amplified template in the presence of fluorescently labeled nucleotides and polymerase. The polymerase extends the primer by adding a single nucleotide detectable by the laser in an ABI PRISM® 3100 Genetic Analyzer (Applied Biosystems®). Alleles were called by GeneScan® Analysis Software v 3.1 (Applied Biosystems®).
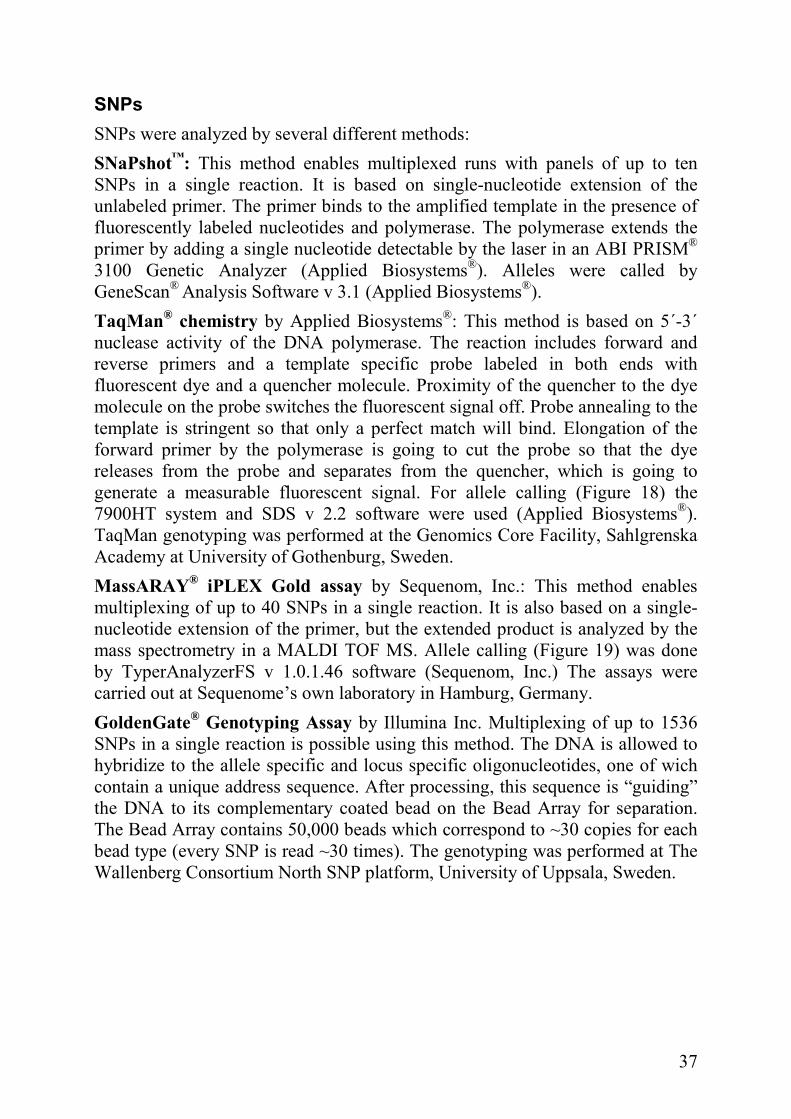
TaqMan® chemistry by Applied Biosystems®: This method is based on 5´-3´ nuclease activity of the DNA polymerase. The reaction includes forward and reverse primers and a template specific probe labeled in both ends with fluorescent dye and a quencher molecule. Proximity of the quencher to the dye molecule on the probe switches the fluorescent signal off. Probe annealing to the template is stringent so that only a perfect match will bind. Elongation of the forward primer by the polymerase is going to cut the probe so that the dye releases from the probe and separates from the quencher, which is going to generate a measurable fluorescent signal. For allele calling (Figure 18) the 7900HT system and SDS v 2.2 software were used (Applied Biosystems®). TaqMan genotyping was performed at the Genomics Core Facility, Sahlgrenska Academy at University of Gothenburg, Sweden.
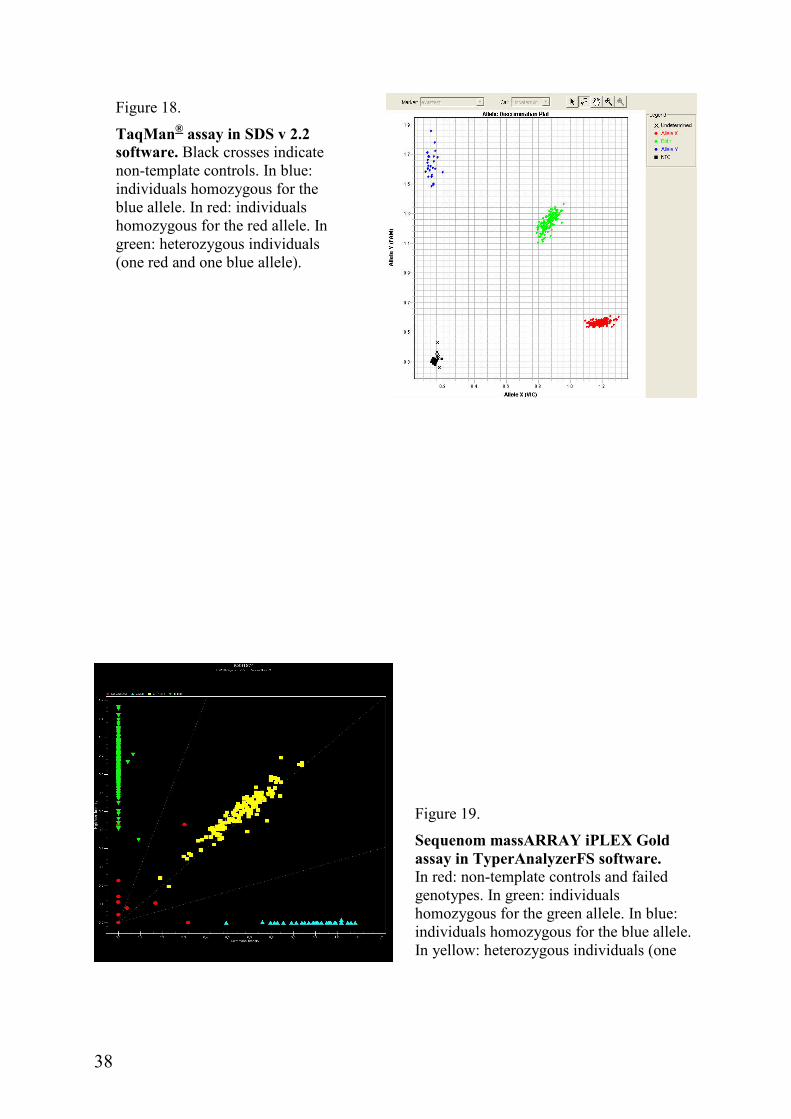
MassARAY® iPLEX Gold assay by Sequenom, Inc.: This method enables multiplexing of up to 40 SNPs in a single reaction. It is also based on a single-nucleotide extension of the primer, but the extended product is analyzed by the mass spectrometry in a MALDI TOF MS. Allele calling (Figure 19) was done by TyperAnalyzerFS v 1.0.1.46 software (Sequenom, Inc.) The assays were carried out at Sequenome’s own laboratory in Hamburg, Germany.
GoldenGate® Genotyping Assay by Illumina Inc. Multiplexing of up to 1536 SNPs in a single reaction is possible using this method. The DNA is allowed to hybridize to the allele specific and locus specific oligonucleotides, one of wich contain a unique address sequence. After processing, this sequence is “guiding” the DNA to its complementary coated bead on the Bead Array for separation. The Bead Array contains 50,000 beads which correspond to ~30 copies for each bead type (every SNP is read ~30 times). The genotyping was performed at The Wallenberg Consortium North SNP platform, University of Uppsala, Sweden.
38
Figure 18.
TaqMan® assay in SDS v 2.2 software. Black crosses indicate non-template controls. In blue: individuals homozygous for the blue allele. In red: individuals homozygous for the red allele. In green: heterozygous individuals (one red and one blue allele).
Figure 19.
Sequenom massARRAY iPLEX Gold assay in TyperAnalyzerFS software. In red: non-template controls and failed genotypes. In green: individuals homozygous for the green allele. In blue: individuals homozygous for the blue allele. In yellow: heterozygous individuals (one blue and one green allele).
39
THE WORKFLOW AND DISCUSSION OF RESULTS
PAPER I: THE META-ANALYSIS
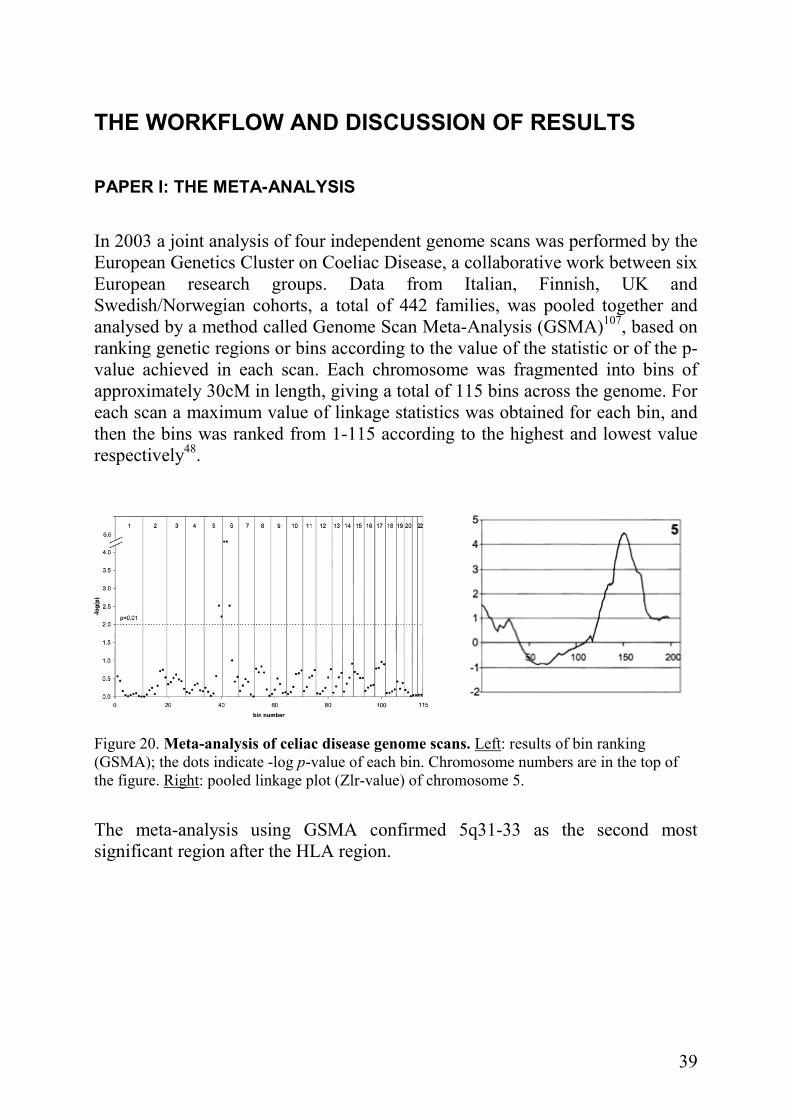
In 2003 a joint analysis of four independent genome scans was performed by the European Genetics Cluster on Coeliac Disease, a collaborative work between six European research groups. Data from Italian, Finnish, UK and Swedish/Norwegian cohorts, a total of 442 families, was pooled together and analysed by a method called Genome Scan Meta-Analysis (GSMA)107, based on ranking genetic regions or bins according to the value of the statistic or of the p-value achieved in each scan. Each chromosome was fragmented into bins of approximately 30cM in length, giving a total of 115 bins across the genome. For each scan a maximum value of linkage statistics was obtained for each bin, and then the bins was ranked from 1-115 according to the highest and lowest value respectively48.
Figure 20. Meta-analysis of celiac disease genome scans. Left: results of bin ranking (GSMA); the dots indicate -log p-value of each bin. Chromosome numbers are in the top of the figure. Right: pooled linkage plot (Zlr-value) of chromosome 5.
The meta-analysis using GSMA confirmed 5q31-33 as the second most significant region after the HLA region.
40
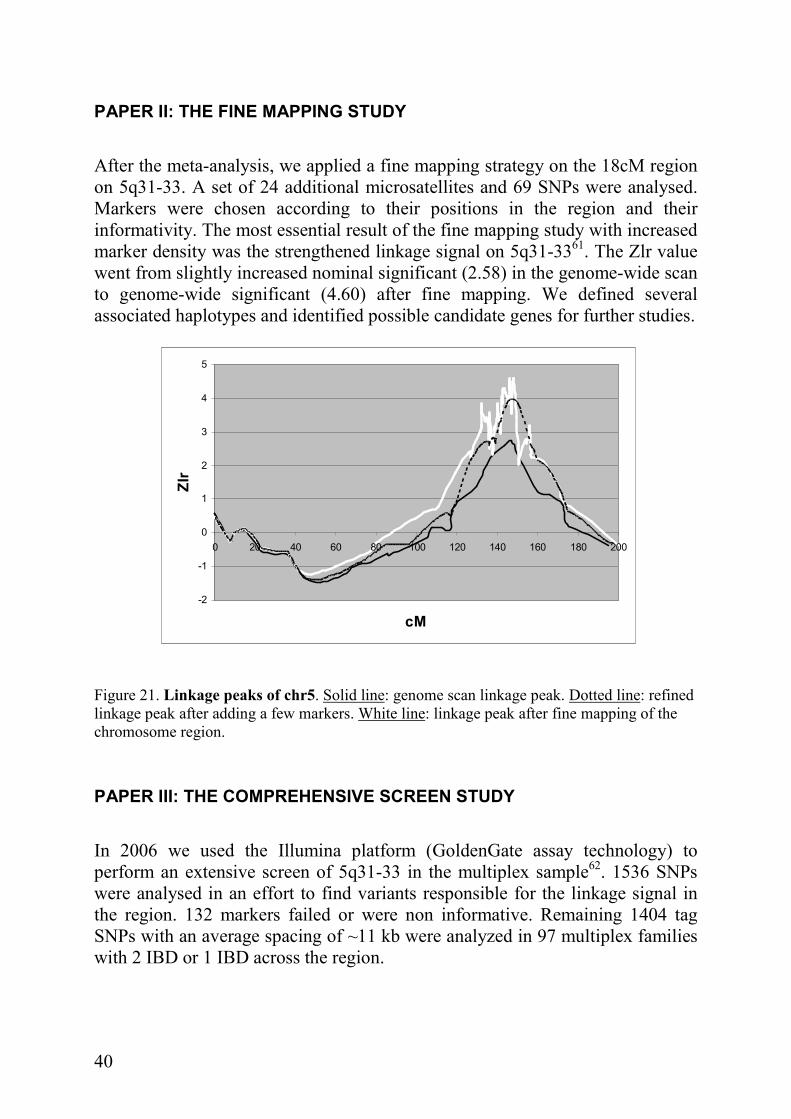
PAPER II: THE FINE MAPPING STUDY
After the meta-analysis, we applied a fine mapping strategy on the 18cM region on 5q31-33. A set of 24 additional microsatellites and 69 SNPs were analysed. Markers were chosen according to their positions in the region and their informativity. The most essential result of the fine mapping study with increased marker density was the strengthened linkage signal on 5q31-3361. The Zlr value went from slightly increased nominal significant (2.58) in the genome-wide scan to genome-wide significant (4.60) after fine mapping. We defined several associated haplotypes and identified possible candidate genes for further studies.
-2
-1
0
1
2
3
4
5
0 20 40 60 80 100 120 140 160 180 200
cM
Zlr
Figure 21. Linkage peaks of chr5. Solid line: genome scan linkage peak. Dotted line: refined linkage peak after adding a few markers. White line: linkage peak after fine mapping of the chromosome region.
PAPER III: THE COMPREHENSIVE SCREEN STUDY
In 2006 we used the Illumina platform (GoldenGate assay technology) to perform an extensive screen of 5q31-33 in the multiplex sample62. 1536 SNPs were analysed in an effort to find variants responsible for the linkage signal in the region. 132 markers failed or were non informative. Remaining 1404 tag SNPs with an average spacing of ~11 kb were analyzed in 97 multiplex families with 2 IBD or 1 IBD across the region.
41
This study identified seven associated regions within 5q31-33 and a number of associated haplotypes but none of the association signals could explain the linkage peak observed in the families previously.
PAPER IV: REPLICATION OF ASSOCIATED HAPLOTYPES
To confirm haplotypes defined in our comprehensive screen we used the Sequenom platform to genotype SNPs in our 225 trios108. A total of 75 SNPs were analysed. Unfortunately, the association signals from the comprehensive screen could not be confirmed. This may be due to the nature of the trio sample, or because we included unlinked trios in the analysis in the absence of linkage data from this cohort. Third possibility may be that we need to study a wider interval under the linkage peak and to increase marker density.
PAPER V: ASSOCIATION OF IL2/IL21 REGION AND FcgRIIa IN CD
In 2007 a genome-wide association (GWA) study in celiac cases and controls was performed by van Heel and colleagues in the UK91. Three independent cohorts showed association to the IL2/IL21 region on chromosome 4. In addition to CD, association to this region was found in Type 1 Diabetes (T1D) and rheumatoid arthritis (RA). Our aim was to confirm association in our cohort consisting of both multiplex and simplex families92. At the same time we wanted to test for association of newly reported susceptibility gene in autoimmune diseases on chromosome 1, FcgRIIa109.
This study confirmed that IL2/IL21 region on chromosome 4 is a susceptibility region in CD. On the other hand, we found no association of FcgRIIa in our sample.

42
CONCLUDING REMARKS AND FUTURE PERSPECTIVE
Compared to other autoimmune disorders, CD is very unique – both the environmental factor (gluten) and the exact HLA variants predisposing to disease are identified and extensively explored. Despite that, searching for other genetic risk factors contributing to the disease development has to date not been an easy task. Reported association signals could not explain the linkage data from previous studies, and a number of association signals could not be confirmed in independent samples. In addition, the first GWAS on CD could not identify any single susceptibility variant outside the HLA-locus. The GWAS gave very weak association in the CTLA4 locus on chromosome 2 and no association with MYO9B region on chromosome 19. As of 5q31-33, no association signal has been confirmed within our region of interest.
The GWAS as well as our own fine mapping study pointed out the difficulties scientists face in searching for the causing variants in CD, which of course is applicable on other complex diseases as well. It appears that causing variants may be hard to detect with association analysis. In addition, the individual effects of variants that the GWAS reported support the hypothesis of many genes with very modest effects, which clearly demands large sample sizes and excellent stratification methods in further studies.
Findings from this first GWAS should be tested for association in independent samples, specially the most significant signal on 4q27 locus comprising IL2/IL21 genes, both very interesting candidates in CD (pmeta-analysis = 4.8 x 10⁻¹¹
with the single SNP). Because of the strong LD in the region, van Heel and colleagues were not able to identify the exact causal variant associated with the disease, but efforts should be made in searching for other structural variants. Copy number variations (CNVs), for example, may influence the tagging ability of individual SNPs and decrease the power to detect associated variants.
GWAS findings in non-coding regions should get a proper attention, since they may be located in transcription binding sites or regulatory regions.
Another way of proceeding in my opinion is by analyzing expression of genes mapping to associated regions found by the GWAS, or genes influenced by those genes in known pathways. Our group has already performed a comparative pilot study in expression of genes involved in the immune response (data not reported in this thesis). Gene expression in intestinal biopsies from three celiac patients was compared to biopsies from three controls as well as expression of the same genes in blood samples from those individuals. Collecting a larger sample and analyzing expression might lead to some interesting insights.

43
For further gene expression studies, knowledge of gluten being the switch button for CD could be used in studies with intestinal cell cultures from celiac patients alternatively from animal models (Irish setter, i.e.). Cells would be challenged with gluten and gene expression before and after could be monitored. Comparison between gene expression in intestinal cells and blood should be made in order to establish possible correlations. Once an alteration in gene expression has been identified, it could be measured in high-risk infants upon introduction of gluten in the diet.
In conclusion, the GWA studies have opened a new exciting era in searching for genetic variants causing certain traits, but there is still a gap between the results and expectations.

44
ACKNOWLEDGEMENTS
Walking the road to this book took more than four years. Fortunately, I was never alone on the road. Some of my companions walked short distances and others walked every single step beside me. Some of them directed me and others gave me fuel when I was running on empty. Now it is time for me to acknowledge them all.
First of all, a few words to my children: Aleksandra, the creative power of our family; thank you for decorating the cover of this book. Jelena, I promise to listen more and talk less in the future. Thanks for all your help with the English! Peter, now I can get a “real job” so we can go shopping more often. I love you all; being your mom is the greatest achievement of my life.
Martin, the man with the capital M in my life: without you nothing would be complete, least of all - me. You have shown me what real life is all about. Love you all the way to the sky and back!
Åsa, my main supervisor: being in celiac project has enriched my life on many levels. I gained knowledge and experience in genetics, but more important – a friend for life. I will never forget our trips: the confusion in London, the laughter under the Eiffel Tower and the soaked Niagara tour. You have the biggest heart and most positive spirit on the Earth, don’t ever change!
Jan, my co-supervisor: I salute you for actively taking part in the ethical debate and letting people know what is right and wrong. You are an inspiration to us all, clearly showing which way we should go. Thank you for giving me a chance to make my dream come true.
Staffan, my statistician: I will never understand why you chose to do statistics for a living when you could support your family as a dancer or speech writer, but in the end I am grateful that you made that choice. I am not going to give you any credit for always taking us down to the ground when we were excited (that was mean) and for not believing in our hypotheses (ever), but I certainly am going to thank you for making our workdays more fun and our trips unforgettable. You get an extra star for all the dances
Henry and Audur, our clinicians: thank you for sharing your expertise in celiac disease; it was pleasant working with you. Audur, the days I spent in the surgery room collecting samples and looking how you worked gave me some of the most powerful memories from my time in the celiac project. It is almost comparable to the day we got our “super NPL” on chromosome 5! Special thanks to you and your colleague Britt-Marie Käck for collecting our families.
Thanks to all the people contributing to the celiac project during these eight years: Birgitta Hallberg, Britt-Louise Carlsson, Åsa Hellqvist, Ellen Hanson
45
and Julia Rundberg; our collaborators from Norway: Ludvig, Silja and Benedicte; the members of The Genetics Cluster on Celiac Disease with Luigi Greco in charge. It has been a great pleasure working with you all.
The staff at the Genomics Core Facility: Tommy, thanks for giving me a working space at Genomics for almost two years. Camilla, Catrine, Annica and Elham; sorry for crashing the robot, I thought it was able to read my mind… Thank you for your help and for those delicious breakfasts on Fridays.
All my colleagues on the 3rd floor: the former and present PhD students, students and their supervisors, Rose-Marie and Maria – I had a great time working with you all, I just hope that you enjoyed my company as well. Special hugs to my roommates Camilla and Saide; the three of us should start a radio show – we always have so much to say. I am sure we can put the “Rix MorronZoo” - people out of work!
The staff at the Department of Clinical Genetics: thank you all for being helpful and friendly.
Members of Stiller Wine and Food club: we are travelling around the world without leaving the kitchen. I really enjoy our culinary adventures; it is relaxing and funny to spend evenings cooking together and tasting the food and wines from near and far.
Thanks to all my friends and my family for keeping reminding me that there is more to life than work. Very special thanks to my “extra” children Victor, Amanda and August for being open-minded most of the time; Linda & Göran Jostrand for making our everyday life working by keeping my absent-minded fiancé on track; all my relatives and friends in Serbia for making our summer holidays enormously enjoyable; my mother Vera for obstinately trying to convince me for more than 30 years that this day would come (once more – she was right…); my dad Zika and my brother Zoran, my guardian angels in heaven, for watching over me day and night.
Finally, my deepest gratitude to all the celiac families for their willingness to participate in this project.
This project has received financial support from Vetenskapsrådet, LUA/ALF, Stiftelsen Claes Groschinskis minnesfond, Lenanderstiftelsen and Kungliga Vetenskaps- och Vitterhetssamhället.

46
REFERENCES
1. Zhu G, Evans DM, Duffy DL, Montgomery GW, Medland SE, Gillespie NA et al. A genome scan for eye color in 502 twin families: most variation is due to a QTL on chromosome 15q. Twin Res 2004; 7(2): 197-210.
2. Juran BD & Lazaridis KN. Applying genomics to the study of complex
disease. Semin Liver Dis 2007; 27(1): 3-12. 3. Crick FH. On protein synthesis. Symp Soc Exp Biol 1958; 12: 138-163. 4. Collins JR, Stephens RM, Gold B, Long B, Dean M & Burt SK. An
exhaustive DNA micro-satellite map of the human genome using high performance computing. Genomics 2003; 82(1): 10-19.
5. Liu Z, Tan G, Li P & Dunham RA. Transcribed dinucleotide
microsatellites and their associated genes from channel catfish Ictalurus punctatus. Biochem Biophys Res Commun 1999; 259(1): 190-194.
6. Mullis KB & Faloona FA. Specific synthesis of DNA in vitro via a
polymerase-catalyzed chain reaction. Methods Enzymol 1987; 155: 335-350.
7. Lander ES & Schork NJ. Genetic dissection of complex traits. Science
1994; 265(5181): 2037-2048. 8. Risch NJ. Searching for genetic determinants in the new millennium.
Nature 2000; 405(6788): 847-856. 9. Glazier AM, Nadeau JH & Aitman TJ. Finding genes that underlie
complex traits. Science 2002; 298(5602): 2345-2349. 10. Wray NR. Allele frequencies and the r2 measure of linkage
disequilibrium: impact on design and interpretation of association studies. Twin Res Hum Genet 2005; 8(2): 87-94.
11. Lander E & Kruglyak L. Genetic dissection of complex traits: guidelines
for interpreting and reporting linkage results. Nat Genet 1995; 11(3): 241-247.

47
12. Terwilliger JD & Ott J. A haplotype-based 'haplotype relative risk' approach to detecting allelic associations. Hum Hered 1992; 42(6): 337-346.
13. Spielman RS, McGinnis RE & Ewens WJ. Transmission test for linkage
disequilibrium: the insulin gene region and insulin-dependent diabetes mellitus (IDDM). Am J Hum Genet 1993; 52(3): 506-516.
14. Altshuler D, Hirschhorn JN, Klannemark M, Lindgren CM, Vohl MC,
Nemesh J et al. The common PPARgamma Pro12Ala polymorphism is associated with decreased risk of type 2 diabetes. Nat Genet 2000; 26(1): 76-80.
15. Hugot JP, Chamaillard M, Zouali H, Lesage S, Cezard JP, Belaiche J et
al. Association of NOD2 leucine-rich repeat variants with susceptibility to Crohn's disease. Nature 2001; 411(6837): 599-603.
16. Van Eerdewegh P, Little RD, Dupuis J, Del Mastro RG, Falls K, Simon J
et al. Association of the ADAM33 gene with asthma and bronchial hyperresponsiveness. Nature 2002; 418(6896): 426-430.
17. The International HapMap Project. Nature 2003; 426(6968): 789-796. 18. Genome-wide association study of 14,000 cases of seven common
diseases and 3,000 shared controls. Nature 2007; 447(7145): 661-678. 19. H.-D. Belitz RK, W. Seilmeier, and H. Wie. Structure and Function of
Gluten Proteins. Cereal Chemistry 1986; 63: 336-341. 20. Wieser H. The precipitating factor in coeliac disease. Baillieres Clin
Gastroenterol 1995; 9(2): 191-207. 21. Sjostrom H, Lundin KE, Molberg O, Korner R, McAdam SN, Anthonsen
D et al. Identification of a gliadin T-cell epitope in coeliac disease: general importance of gliadin deamidation for intestinal T-cell recognition. Scand J Immunol 1998; 48(2): 111-115.
22. van de Wal Y, Kooy YM, van Veelen PA, Pena SA, Mearin LM, Molberg
O et al. Small intestinal T cells of celiac disease patients recognize a natural pepsin fragment of gliadin. Proc Natl Acad Sci U S A 1998; 95(17): 10050-10054.

48
23. Lundin KE & Sollid LM. Gliadin peptide specific intestinal T cells in coeliac disease. Gut 2003; 52(2): 162.
24. van de Wal Y, Kooy YM, van Veelen P, Vader W, August SA, Drijfhout
JW et al. Glutenin is involved in the gluten-driven mucosal T cell response. Eur J Immunol 1999; 29(10): 3133-3139.
25. Spaenij-Dekking L, Kooy-Winkelaar Y, van Veelen P, Drijfhout JW,
Jonker H, van Soest L et al. Natural variation in toxicity of wheat: potential for selection of nontoxic varieties for celiac disease patients. Gastroenterology 2005; 129(3): 797-806.
26. Dewar DH, Amato M, Ellis HJ, Pollock EL, Gonzalez-Cinca N, Wieser H
et al. The toxicity of high molecular weight glutenin subunits of wheat to patients with coeliac disease. Eur J Gastroenterol Hepatol 2006; 18(5): 483-491.
27. Fasano A. Clinical presentation of celiac disease in the pediatric
population. Gastroenterology 2005; 128(4 Suppl 1): S68-73. 28. Green PH. The many faces of celiac disease: clinical presentation of
celiac disease in the adult population. Gastroenterology 2005; 128(4 Suppl 1): S74-78.
29. Garampazzi A, Rapa A, Mura S, Capelli A, Valori A, Boldorini R et al.
Clinical pattern of celiac disease is still changing. J Pediatr Gastroenterol
Nutr 2007; 45(5): 611-614. 30. Kaukinen K, Collin P & Maki M. Latent coeliac disease or coeliac disease
beyond villous atrophy? Gut 2007; 56(10): 1339-1340. 31. Reunala T. Dermatitis herpetiformis: coeliac disease of the skin. Ann Med
1998; 30(5): 416-418. 32. Malandrino N, Capristo E, Farnetti S, Leggio L, Abenavoli L, Addolorato
G et al. Metabolic and nutritional features in adult celiac patients. Dig Dis 2008; 26(2): 128-133.
33. Pistorius LR, Sweidan WH, Purdie DW, Steel SA, Howey S, Bennett JR
et al. Coeliac disease and bone mineral density in adult female patients. Gut 1995; 37(5): 639-642.
49
34. Hin H, Bird G, Fisher P, Mahy N & Jewell D. Coeliac disease in primary care: case finding study. BMJ 1999; 318(7177): 164-167.
35. Smecuol E, Maurino E, Vazquez H, Pedreira S, Niveloni S, Mazure R et
al. Gynaecological and obstetric disorders in coeliac disease: frequent clinical onset during pregnancy or the puerperium. Eur J Gastroenterol
Hepatol 1996; 8(1): 63-89. 36. Hadjivassiliou M, Boscolo S, Davies-Jones GA, Grunewald RA, Not T,
Sanders DS et al. The humoral response in the pathogenesis of gluten ataxia. Neurology 2002; 58(8): 1221-1226.
37. Tursi A, Giorgetti GM, Iani C, Arciprete F, Brandimarte G, Capria A et
al. Peripheral neurological disturbances, autonomic dysfunction, and antineuronal antibodies in adult celiac disease before and after a gluten-free diet. Dig Dis Sci 2006; 51(10): 1869-1874.
38. Solaymani-Dodaran M, West J & Logan RF. Long-term mortality in
people with celiac disease diagnosed in childhood compared with adulthood: a population-based cohort study. Am J Gastroenterol 2007; 102(4): 864-870.
39. Peters U, Askling J, Gridley G, Ekbom A & Linet M. Causes of death in
patients with celiac disease in a population-based Swedish cohort. Arch
Intern Med 2003; 163(13): 1566-1572. 40. Corrao G, Corazza GR, Bagnardi V, Brusco G, Ciacci C, Cottone M et al.
Mortality in patients with coeliac disease and their relatives: a cohort study. Lancet 2001; 358(9279): 356-361.
41. Fasano A & Catassi C. Current approaches to diagnosis and treatment of
celiac disease: an evolving spectrum. Gastroenterology 2001; 120(3): 636-651.
42. Catassi C & Fasano A. Celiac disease. Curr Opin Gastroenterol 2008;
24(6): 687-691. 43. Leeds JS, Hopper AD & Sanders DS. Coeliac disease. Br Med Bull 2008;
88(1): 157-170. 44. Green PHR, Stavropoulos SN, Panagi SG, Goldstein SL, McMahon DJ,
Absan H et al. Characteristics of adult celiac disease in the USA: results of a national survey. Am J Gastroenterol 2001; 96(1): 126-131.
50
45. Greco L, Romino R, Coto I, Di Cosmo N, Percopo S, Maglio M et al. The
first large population based twin study of coeliac disease. Gut 2002; 50(5): 624-628.
46. Liu J, Juo SH, Holopainen P, Terwilliger J, Tong X, Grunn A et al.
Genomewide linkage analysis of celiac disease in Finnish families. Am J
Hum Genet 2002; 70(1): 51-59. 47. Naluai AT, Nilsson S, Gudjonsdottir AH, Louka AS, Ascher H, Ek J et al.
Genome-wide linkage analysis of Scandinavian affected sib-pairs supports presence of susceptibility loci for celiac disease on chromosomes 5 and 11. Eur J Hum Genet 2001; 9(12): 938-944.
48. Babron MC, Nilsson S, Adamovic S, Naluai AT, Wahlstrom J, Ascher H
et al. Meta and pooled analysis of European coeliac disease data. Eur J
Hum Genet 2003; 11(11): 828-834. 49. Elder JT, Nair RP, Guo SW, Henseler T, Christophers E & Voorhees JJ.
The genetics of psoriasis. Arch Dermatol 1994; 130(2): 216-224. 50. Balendran N, Clough RL, Arguello JR, Barber R, Veal C, Jones AB et al.
Characterization of the major susceptibility region for psoriasis at chromosome 6p21.3. J Invest Dermatol 1999; 113(3): 322-328.
51. Davies JL, Kawaguchi Y, Bennett ST, Copeman JB, Cordell HJ, Pritchard
LE et al. A genome-wide search for human type 1 diabetes susceptibility genes. Nature 1994; 371(6493): 130-136.
52. Los H, Koppelman GH & Postma DS. The importance of genetic
influences in asthma. Eur Respir J 1999; 14(5): 1210-1227. 53. Francks C, Fisher SE, Marlow AJ, Richardson AJ, Stein JF & Monaco
AP. A sibling-pair based approach for mapping genetic loci that influence quantitative measures of reading disability. Prostaglandins Leukot Essent
Fatty Acids 2000; 63(1-2): 27-31. 54. Marrosu MG, Murru R, Murru MR, Costa G, Zavattari P, Whalen M et al.
Dissection of the HLA association with multiple sclerosis in the founder isolated population of Sardinia. Hum Mol Genet 2001; 10(25): 2907-2916.
51
55. Kilding R, Iles MM, Timms JM, Worthington J & Wilson AG. Additional genetic susceptibility for rheumatoid arthritis telomeric of the DRB1 locus. Arthritis Rheum 2004; 50(3): 763-769.
56. Ahmad T, Marshall SE & Jewell D. Genetics of inflammatory bowel
disease: the role of the HLA complex. World J Gastroenterol 2006; 12(23): 3628-3635.
57. Yang H, Plevy SE, Taylor K, Tyan D, Fischel-Ghodsian N, McElree C et
al. Linkage of Crohn's disease to the major histocompatibility complex region is detected by multiple non-parametric analyses. Gut 1999; 44(4): 519-526.
58. Sollid LM, Markussen G, Ek J, Gjerde H, Vartdal F & Thorsby E.
Evidence for a primary association of celiac disease to a particular HLA-DQ alpha/beta heterodimer. J Exp Med 1989; 169(1): 345-350.
59. Ploski R, Ek J, Thorsby E & Sollid LM. On the HLA-DQ(alpha 1*0501,
beta 1*0201)-associated susceptibility in celiac disease: a possible gene dosage effect of DQB1*0201. Tissue Antigens 1993; 41(4): 173-177.
60. Greco L, Babron MC, Corazza GR, Percopo S, Sica R, Clot F et al.
Existence of a genetic risk factor on chromosome 5q in Italian coeliac disease families. Ann Hum Genet 2001; 65(Pt 1): 35-41.
61. Adamovic S, Amundsen SS, Lie BA, Hellqvist A, Gudjonsdottir AH, Ek J
et al. Fine mapping study in Scandinavian families suggests association between coeliac disease and haplotypes in chromosome region 5q32. Tissue Antigens 2008; 71(1): 27-34.
62. Amundsen SS, Adamovic S, Hellqvist A, Nilsson S, Gudjonsdottir AH,
Ascher H et al. A comprehensive screen for SNP associations on chromosome region 5q31-33 in Swedish/Norwegian celiac disease families. Eur J Hum Genet 2007; 15(9): 980-987.
63. Morahan G, Huang D, Ymer SI, Cancilla MR, Stephen K, Dabadghao P et
al. Linkage disequilibrium of a type 1 diabetes susceptibility locus with a regulatory IL12B allele. Nat Genet 2001; 27(2): 218-221.
64. Randolph AG, Lange C, Silverman EK, Lazarus R, Silverman ES, Raby
B et al. The IL12B gene is associated with asthma. Am J Hum Genet 2004; 75(4): 709-715.

52
65. Armuzzi A, Ahmad T, Ling KL, de Silva A, Cullen S, van Heel D et al. Genotype-phenotype analysis of the Crohn's disease susceptibility haplotype on chromosome 5q31. Gut 2003; 52(8): 1133-1139.
66. Rioux JD, Silverberg MS, Daly MJ, Steinhart AH, McLeod RS, Griffiths
AM et al. Genomewide search in Canadian families with inflammatory bowel disease reveals two novel susceptibility loci. Am J Hum Genet 2000; 66(6): 1863-1870.
67. Sakai K, Shirasawa S, Ishikawa N, Ito K, Tamai H, Kuma K et al.
Identification of susceptibility loci for autoimmune thyroid disease to 5q31-q33 and Hashimoto's thyroiditis to 8q23-q24 by multipoint affected sib-pair linkage analysis in Japanese. Hum Mol Genet 2001; 10(13): 1379-1386.
68. Hong KS, McInnes LA, Service SK, Song T, Lucas J, Silva S et al.
Genetic mapping using haplotype and model-free linkage analysis supports previous evidence for a locus predisposing to severe bipolar disorder at 5q31-33. Am J Med Genet B Neuropsychiatr Genet 2004; 125B(1): 83-86.
69. Yamamoto K & Yamada R. Genome-wide single nucleotide
polymorphism analyses of rheumatoid arthritis. J Autoimmun 2005; 25 Suppl: 12-15.
70. Reiser H & Stadecker MJ. Costimulatory B7 molecules in the
pathogenesis of infectious and autoimmune diseases. N Engl J Med 1996; 335(18): 1369-1377.
71. Djilali-Saiah I, Schmitz J, Harfouch-Hammoud E, Mougenot JF, Bach JF
& Caillat-Zucman S. CTLA-4 gene polymorphism is associated with predisposition to coeliac disease. Gut 1998; 43(2): 187-189.
72. Naluai AT, Nilsson S, Samuelsson L, Gudjonsdottir AH, Ascher H, Ek J
et al. The CTLA4/CD28 gene region on chromosome 2q33 confers susceptibility to celiac disease in a way possibly distinct from that of type 1 diabetes and other chronic inflammatory disorders. Tissue Antigens 2000; 56(4): 350-355.
73. Nistico L, Buzzetti R, Pritchard LE, Van der Auwera B, Giovannini C,
Bosi E et al. The CTLA-4 gene region of chromosome 2q33 is linked to, and associated with, type 1 diabetes. Belgian Diabetes Registry. Hum Mol
Genet 1996; 5(7): 1075-1080.
53
74. Heward JM, Allahabadia A, Armitage M, Hattersley A, Dodson PM,
Macleod K et al. The development of Graves' disease and the CTLA-4 gene on chromosome 2q33. J Clin Endocrinol Metab 1999; 84(7): 2398-2401.
75. Donner H, Braun J, Seidl C, Rau H, Finke R, Ventz M et al. Codon 17
polymorphism of the cytotoxic T lymphocyte antigen 4 gene in Hashimoto's thyroiditis and Addison's disease. J Clin Endocrinol Metab 1997; 82(12): 4130-4132.
76. Hudson LL, Rocca K, Song YW & Pandey JP. CTLA-4 gene
polymorphisms in systemic lupus erythematosus: a highly significant association with a determinant in the promoter region. Hum Genet 2002; 111(4-5): 452-455.
77. Matter K & Balda MS. Signalling to and from tight junctions. Nat Rev
Mol Cell Biol 2003; 4(3): 225-236. 78. Van Belzen MJ, Meijer JW, Sandkuijl LA, Bardoel AF, Mulder CJ,
Pearson PL et al. A major non-HLA locus in celiac disease maps to chromosome 19. Gastroenterology 2003; 125(4): 1032-1041.
79. Monsuur AJ, de Bakker PI, Alizadeh BZ, Zhernakova A, Bevova MR,
Strengman E et al. Myosin IXB variant increases the risk of celiac disease and points toward a primary intestinal barrier defect. Nat Genet 2005; 37(12): 1341-1344.
80. Hunt KA, Monsuur AJ, McArdle WL, Kumar PJ, Travis SP, Walters JR
et al. Lack of association of MYO9B genetic variants with coeliac disease in a British cohort. Gut 2006; 55(7): 969-972.
81. Amundsen SS, Monsuur AJ, Wapenaar MC, Lie BA, Ek J, Gudjonsdottir
AH et al. Association analysis of MYO9B gene polymorphisms with celiac disease in a Swedish/Norwegian cohort. Hum Immunol 2006; 67(4-5): 341-345.
82. Giordano M, Marano C, Mellai M, Limongelli MG, Bolognesi E, Clerget-
Darpoux F et al. A family-based study does not confirm the association of MYO9B with celiac disease in the Italian population. Genes Immun 2006; 7(7): 606-608.
54
83. Nunez C, Marquez A, Varade J, Martinez A, Polanco I, Maluenda C et al. No evidence of association of the MYO9B polymorphisms with celiac disease in the Spanish population. Tissue Antigens 2006; 68(6): 489-492.
84. van Bodegraven AA, Curley CR, Hunt KA, Monsuur AJ, Linskens RK,
Onnie CM et al. Genetic variation in myosin IXB is associated with ulcerative colitis. Gastroenterology 2006; 131(6): 1768-1774.
85. Sanchez E, Alizadeh BZ, Valdigem G, Ortego-Centeno N, Jimenez-
Alonso J, de Ramon E et al. MYO9B gene polymorphisms are associated with autoimmune diseases in Spanish population. Hum Immunol 2007; 68(7): 610-615.
86. Latiano A, Palmieri O, Valvano MR, D'Inca R, Caprilli R, Cucchiara S et
al. The association of MYO9B gene in Italian patients with inflammatory bowel diseases. Aliment Pharmacol Ther 2008; 27(3): 241-248.
87. Santiago JL, Martinez A, Nunez C, de la Calle H, Fernandez-Arquero M,
de la Concha EG et al. Association of MYO9B haplotype with type 1 diabetes. Hum Immunol 2008; 69(2): 112-115.
88. Woolley N, Holopainen P, Ollikainen V, Mustalahti K, Maki M, Kere J et
al. A new locus for coeliac disease mapped to chromosome 15 in a population isolate. Hum Genet 2002; 111(1): 40-45.
89. Cassidy SB, Dykens E & Williams CA. Prader-Willi and Angelman
syndromes: sister imprinted disorders. Am J Med Genet 2000; 97(2): 136-146.
90. Buxbaum JD, Silverman JM, Smith CJ, Greenberg DA, Kilifarski M,
Reichert J et al. Association between a GABRB3 polymorphism and autism. Mol Psychiatry 2002; 7(3): 311-316.
91. van Heel DA, Franke L, Hunt KA, Gwilliam R, Zhernakova A, Inouye M
et al. A genome-wide association study for celiac disease identifies risk variants in the region harboring IL2 and IL21. Nat Genet 2007; 39(7): 827-829.
92. Adamovic S, Amundsen SS, Lie BA, Gudjonsdottir AH, Ascher H, Ek J
et al. Association study of IL2/IL21 and FcgRIIa: significant association with the IL2/IL21 region in Scandinavian coeliac disease families. Genes
Immun 2008; 9(4): 364-367.

55
93. Zhernakova A, Alizadeh BZ, Bevova M, van Leeuwen MA, Coenen MJ, Franke B et al. Novel association in chromosome 4q27 region with rheumatoid arthritis and confirmation of type 1 diabetes point to a general risk locus for autoimmune diseases. Am J Hum Genet 2007; 81(6): 1284-1288.
94. Hunt KA, Zhernakova A, Turner G, Heap GA, Franke L, Bruinenberg M
et al. Newly identified genetic risk variants for celiac disease related to the immune response. Nat Genet 2008; 40(4): 395-402.
95. Todd JA, Walker NM, Cooper JD, Smyth DJ, Downes K, Plagnol V et al.
Robust associations of four new chromosome regions from genome-wide analyses of type 1 diabetes. Nat Genet 2007; 39(7): 857-864.
96. Zhernakova A, Festen EM, Franke L, Trynka G, van Diemen CC,
Monsuur AJ et al. Genetic analysis of innate immunity in Crohn's disease and ulcerative colitis identifies two susceptibility loci harboring CARD9 and IL18RAP. Am J Hum Genet 2008; 82(5): 1202-1210.
97. Auranen M, Vanhala R, Varilo T, Ayers K, Kempas E, Ylisaukko-Oja T
et al. A genomewide screen for autism-spectrum disorders: evidence for a major susceptibility locus on chromosome 3q25-27. Am J Hum Genet 2002; 71(4): 777-790.
98. Mao M, Biery MC, Kobayashi SV, Ward T, Schimmack G, Burchard J et
al. T lymphocyte activation gene identification by coregulated expression on DNA microarrays. Genomics 2004; 83(6): 989-999.
99. Smyth DJ, Plagnol V, Walker NM, Cooper JD, Downes K, Yang JH et al.
Shared and distinct genetic variants in type 1 diabetes and celiac disease. N Engl J Med 2008; 359(26): 2767-2777.
100. Chumakov I, Blumenfeld M, Guerassimenko O, Cavarec L, Palicio M,
Abderrahim H et al. Genetic and physiological data implicating the new human gene G72 and the gene for D-amino acid oxidase in schizophrenia. Proc Natl Acad Sci U S A 2002; 99(21): 13675-13680.
101. Nath SK, Quintero-Del-Rio AI, Kilpatrick J, Feo L, Ballesteros M &
Harley JB. Linkage at 12q24 with systemic lupus erythematosus (SLE) is established and confirmed in Hispanic and European American families. Am J Hum Genet 2004; 74(1): 73-82.

56
102. Palmer LJ, Daniels SE, Rye PJ, Gibson NA, Tay GK, Cookson WO et al. Linkage of chromosome 5q and 11q gene markers to asthma-associated quantitative traits in Australian children. Am J Respir Crit Care Med 1998; 158(6): 1825-1830.
103. Cantagrel A, Navaux F, Loubet-Lescoulie P, Nourhashemi F, Enault G,
Abbal M et al. Interleukin-1beta, interleukin-1 receptor antagonist, interleukin-4, and interleukin-10 gene polymorphisms: relationship to occurrence and severity of rheumatoid arthritis. Arthritis Rheum 1999; 42(6): 1093-1100.
104. Holopainen P, Mustalahti K, Uimari P, Collin P, Maki M & Partanen J.
Candidate gene regions and genetic heterogeneity in gluten sensitivity. Gut 2001; 48(5): 696-701.
105. Gudjonsdottir AH. Clinical and genetical aspects of Celiac Disease,
University of Gothenburg, Gothenburg, 2008. 106. Revised criteria for diagnosis of coeliac disease. Report of Working
Group of European Society of Paediatric Gastroenterology and Nutrition. Arch Dis Child 1990; 65(8): 909-911.
107. Wise LH, Lanchbury JS & Lewis CM. Meta-analysis of genome searches.
Ann Hum Genet 1999; 63(Pt 3): 263-272. 108. Adamovic S AS, Lie BA, Gudjónsdóttir AH, Ek J, Ascher H, Wahlström
J, Nilsson J, Sollid LM, Naluai ÅT (2009). Replication of chromosome region 5q31-33 and celiac disease: A complex image emerges. In.
109. Alizadeh BZ, Valdigem G, Coenen MJ, Zhernakova A, Franke B,
Monsuur A et al. Association analysis of functional variants of the FcgRIIa and FcgRIIIa genes with type 1 diabetes, celiac disease and rheumatoid arthritis. Hum Mol Genet 2007; 16(21): 2552-2559.