genetic diversity and population structure of leafy kale...
TRANSCRIPT

General rights Copyright and moral rights for the publications made accessible in the public portal are retained by the authors and/or other copyright owners and it is a condition of accessing publications that users recognise and abide by the legal requirements associated with these rights.
Users may download and print one copy of any publication from the public portal for the purpose of private study or research.
You may not further distribute the material or use it for any profit-making activity or commercial gain
You may freely distribute the URL identifying the publication in the public portal If you believe that this document breaches copyright please contact us providing details, and we will remove access to the work immediately and investigate your claim.
Downloaded from orbit.dtu.dk on: Apr 14, 2019
Genetic diversity and population structure of leafy kale and Brassica rupestris Raf. insouth Italy
Maggioni, Lorenzo; von Bothmer, Roland; Poulsen, Gert; Branca, Ferdinando; Bagger Jørgensen, Rikke
Published in:Hereditas
Link to article, DOI:10.1111/hrd2.00058
Publication date:2014
Document VersionPublisher's PDF, also known as Version of record
Link back to DTU Orbit
Citation (APA):Maggioni, L., von Bothmer, R., Poulsen, G., Branca, F., & Bagger Jørgensen, R. (2014). Genetic diversity andpopulation structure of leafy kale and Brassica rupestris Raf. in south Italy. Hereditas, 151(6), 145-158.https://doi.org/10.1111/hrd2.00058

Genetic diversity and population structure of leafy kale and Brassica rupestris Raf. in south Italy LORENZO MAGGIONI 1,2 , ROLAND VON BOTHMER 2 , GERT POULSEN 3 , FERDINANDO BRANCA 4 and RIKKE BAGGER J Ø RGENSEN 5
1 Bioversity International, Maccarese (Fiumicino), Roma, Italy 2 Dept. of Plant Breeding, Swedish University of Agricultural Sciences, Alnarp, Sweden 3 Nordic Genetic Resource Center, Alnarp, Sweden 4 Dept. of Agriculture and Food Science (DISPA), University of Catania, Catania, Italy 5 Dept. of Chemical and Biochemical Engineering, Technical University of Denmark – DTU, Roskilde, Denmark
Maggioni, L., von Bothmer, R., Poulsen, G., Branca, F. and Bagger J ø rgensen, R. 2014 . Genetic diversity and population struc-ture of leafy kale and Brassica rupestris Raf. in south Italy. – Hereditas 151 : 145 – 158. Lund, Sweden. eISSN 1601-5223. Received 5 June 2014. Accepted 23 September 2014.
Local varieties of leafy kales ( Brassica oleracea L.) are grown in home gardens in Calabria and Sicily for self-consumption, in the same area where the wild relative Brassica rupestris Raf. also grows. With the use of AFLP markers, comparisons were made of the genetic diversity and population structure of ten wild and 22 cultivated populations, as well as of a hybrid population and of four commercial cultivars of different B. oleracea crops. The level of genetic diversity was higher in leafy kales than in wild populations and this diversity was mainly distributed within populations. Wild populations remained distinct from cultivated mate-rial. Additionally, most wild populations were distinctively isolated from each other. On the other hand, it was not possible to molecularly distinguish even geographically distant leafy kale populations from each other or from different B. oleracea crops. It was possible to detect inter-crossing between leafy kales and B. rupestris . Findings from this study illustrate the existing level of genetic diversity in the B. oleracea gene pool. Individual populations (either wild or leafy kales) with higher levels of genetic diver-sity have been identifi ed and suggestions are given for an informed conservation strategy. Domestication hypotheses are also discussed.
Lorenzo Maggioni, Bioversity International, Via dei Tre Denari 472/a, Maccarese (Fiumicino), Roma, Italy . Email: [email protected]
The brassica vegetables ( Brassica oleracea L.) are a dietary staple food in many parts of the world. The Food and Agriculture Organization of the United Nations (FAO) estimates that world commercial production of cabbages, caulifl owers, broccoli and other brassicas in 2011 was over 89 million tonnes from some 3.5 million hectares (FAOSTAT 2013). Wild relatives of B. oleracea vegeta-bles, carrying the same C genome (n � 9) as the cultivated crops, grow on the western Atlantic and Mediterranean seaboard cliffs of Europe. These include several species belonging to Section Brassica of the Brassica Genus. They are able to intercross with B. oleracea crops with various degrees of fertility and therefore belong to their primary or secondary gene pools and are, as such, of great importance for breeding purposes ( BOTHMER et al. 1995). As a recent example, a nutritionally enhanced broccoli variety, with high glucoraphanin content, was launched in the UK market in 2011, derived from a cross with a wild Sicilian Brassica villosa accession collected in 1984 (BBSRC 2011; MITHEN 2014).
Understanding the level and structure of the in situ genetic diversity of kales and their wild relatives can help identify germplasm that can be used for breeding purposes
and for genetic conservation. These studies can also con-tribute to a better understanding of crop domestication patterns ( SONG et al. 1990; MAGGIONI et al. 2010).
Our study focused on a few agro-ecosystems in Calabria and Sicily (south Italy), where leafy kale ( Brassica oleracea L. convar. acephala ( DC.) Alef. var. viridis L., nomenclature according to Mansfeld ’ s Ency-clopedia) ( HANELT and IPK 2001) is grown for self-consumption in home gardens, sometimes very near to populations of the wild relative B. rupestris Raf., which is endemic to Calabria and Sicily . For the fi rst time, molecular analysis has been applied to C genome wild brassica populations and to cultivated kale growing in the same area, based on samples collected at the same time.
Various types of molecular markers (isozymes, RAPDs, microsatellites and AFLPs) have been used in studies aimed at determining the levels of genetic diversity and the population structure of wild (n � 9) Brassica species ( HURTREZ-BOUSS È S 1996, LANN É R-HERRERA et al. 1996, L Á ZARO and AGUINAGALDE 1998a, 1998b, RAYBOULD et al. 1999, GERACI et al. 2004, WATSON-JONES et al. 2006, EDH et al. 2007). As a general trend, levels of genetic diversity within populations have been found to be variable, while
Hereditas 151: 145–158 (2014)
© 2015 The Authors. This is an Open Access article. DOI: 10.1111/hrd2.00058

146 L. Maggioni et al. Hereditas 151 (2014)
high values of genetic differentiation among populations were consistently found, indicating a tendency to isolation of each population, subject to limited gene fl ow.
The genetic diversity within B. oleracea crops appears to be generally lower than within wild taxa, as exempli-fi ed in analyses by MEI et al. (2010) on seven B. oleracea crops and by HINTUM et al. (2007) on genebank accessions of white cabbages. ALLENDER et al. (2007) found a wealth of diversity revealed by chloroplast SSRs among the Mediterranean wild species, contrasting with an apparent absence of chloroplast diversity in B. oleracea crops and contemporary UK natural populations of B. oleracea .
Our aim was to compare the genetic diversity and pop-ulation structure of collected cultivated and wild material as a whole, of Calabrian versus Sicilian populations and of the various populations collected within each local ecosystem. We also wished to investigate whether it is possible to use molecular means to distinguish wild from cultivated populations and to distinguish the leafy kales grown in different home gardens in this part of southern Italy from each other. Additionally, the investigations carried out in this study aimed to provide insights into the process of domestication of B. oleracea . There is currently no conclusive evidence regarding the progenitor species and the location of its initial domestication ( ZOHARY et al. 2012). Assuming that leafy kale was the earliest cultivated B. oleracea that resulted from the domestication of a wild ancestor, it seemed relevant to compare wild populations ( B. rupestris in our case) growing almost side by side with home gardened leafy kales.
With the use of AFLP markers we were able to detect a higher level of genetic diversity in leafy kales than in wild populations. This diversity was mainly distributed within populations. We were also able to distinguish wild from cultivated populations, but were not able to distinguish even geographically distant leafy kale populations from each other. It was possible to detect inter-crossing between leafy kales and B. rupestris , as reported by MAGGIONI et al. (2013). Findings from this study were helpful in exploring the existing level of genetic diversity in the B. oleracea gene pool and providing information for conservation strategies and breeding purposes. Finally, we made some considerations regarding the likelihood that domestication of B. oleracea took place in a Mediterranean scenario, similar to those that we have investigated here.
MATERIAL AND METHODS
Seed samples of leafy kales were collected in 2006 and 2007 from six home gardens and four wild populations of Brassica rupestris in Calabria and from 16 home gardens and four wild populations in Sicily. Additionally, a putative hybrid population between B. rupestris and leafy kale was collected in Sicily whose hybrid nature was
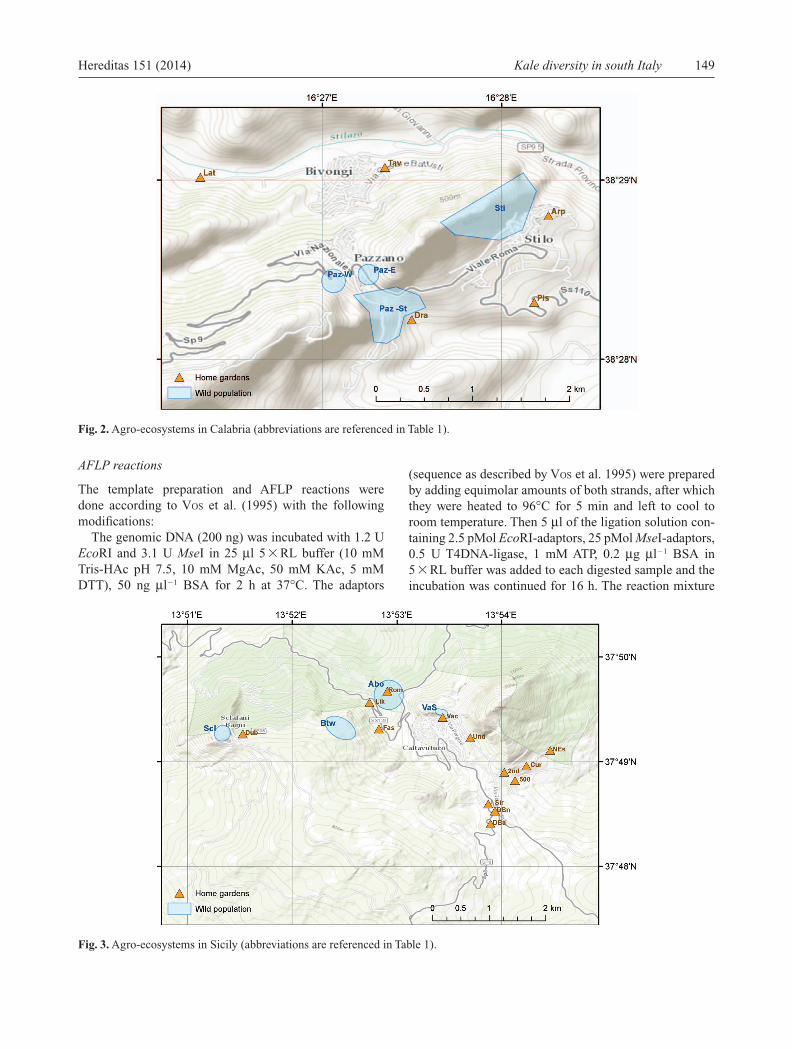
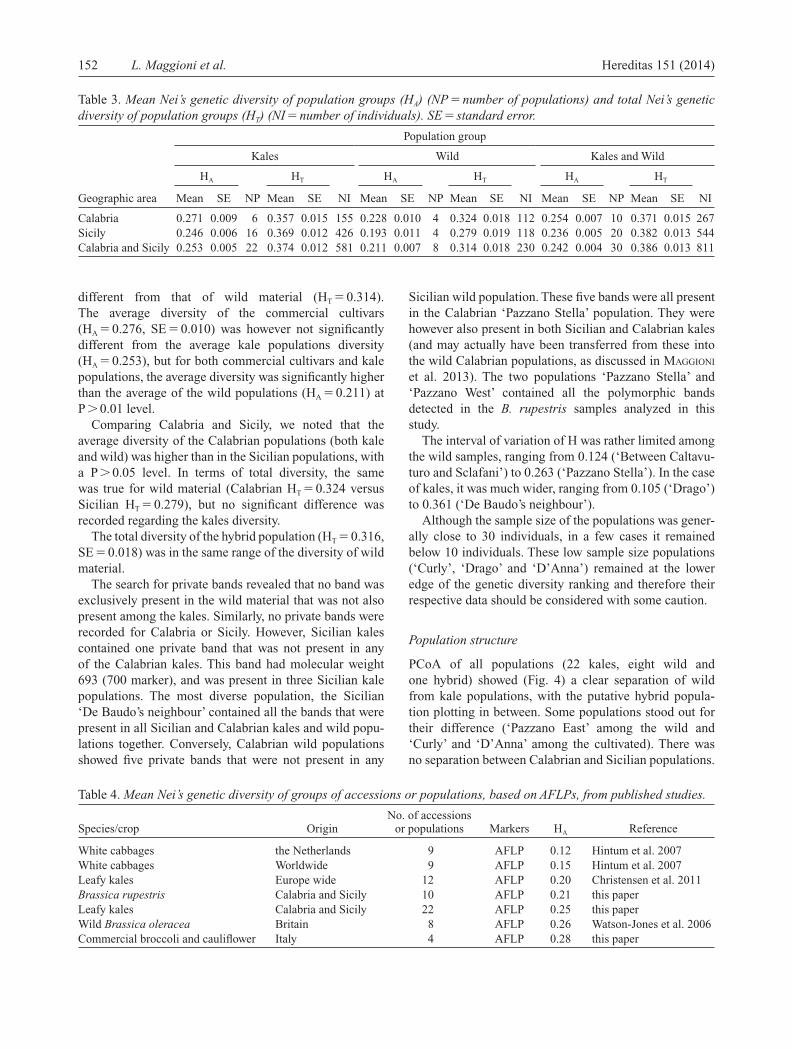
subsequently confi rmed ( MAGGIONI et al. 2013). Each pop-ulation was given a name derived from the collecting location or an associated trait. In the case of the leafy kales, we often used the family name of the local farmer. Each population corresponds to the material collected from a given home garden. In the case of wild samples, we attributed to a given population all samples growing within an identifi able geographic context (i.e. east or west of a village, top or bottom of a hill). The selected boundar-ies therefore have a certain degree of approximation and it is possible that some of the populations that we have kept distinct for the analysis are actually able to intercross and thus part of the same effective population. Seeds were col-lected keeping the offspring of each individual mother plant separate, and they received an accession number and were deposited for long-term conservation at the Univer-sity of Catania (Table 1). In Calabria, collecting from the wild and from home gardens took place in the surround-ings of the villages of Stilo, Pazzano and Bivongi (Reggio Calabria province). Sicilian populations were collected in the surroundings of Caltavuturo, Sclafani Bagni and Resuttano (Palermo province) (Fig. 1, 2, 3). Three com-mercial cultivars of caulifl ower and one of Calabrese broccoli were added to this study. Of these commercial ones, an unknown cultivar grown by Mr Romano in Caltavuturo was directly obtained from the farmer. The ‘ Ramoso calabrese tardivo ’ broccoli and the ‘ Romanesco natalino ’ and ‘ Violetto di Sicilia natalino ’ caulifl owers, which we bought in local shops as seed packets, are cultivars with a long tradition in Italy, obtained from selections of local populations.
Within each population, we analyzed the DNA extracted from seed harvested from as many mother plants as possi-ble. However, the number of mother plants available, or at least providing fertile seeds, was very variable. Therefore, the populations analyzed consisted of germinated seeds derived from as few as one, up to as many as 28 mother plants. In two cases (Dubolino and Gallo) the samples received from farmers were seed bulks, with no knowledge of the number of mother plants. For each population, we attempted to analyze at least 30 individuals, but in some cases, due to low germination, it was only possible to ana-lyze few plants (as few as fi ve). A total of 970 individuals were analyzed with AFLP markers (Table 2).
DNA extraction
Seeds were germinated in soil trays under greenhouse conditions, and leaf material was harvested at the 4 – 6 leaf stage. DNA was extracted from the leaves using the method described by DOYLE and DOYLE (1987) with the following modifi cations:
The leaf samples were powdered in a mixermill (Merck Retsch mm 300) with a steel bead. After transferring the

Hereditas 151 (2014) Kale diversity in south Italy 147
Table 1. Abbreviations, collecting sites and accession numbers of analyzed populations.
Populations/accessions Abbreviation Collecting site Accession numbers
Kales Calabria 1. Latassa Lat home garden of Mr Raffaele Latassa,
BivongiUNICT: 3781; 3768; 3779; 3785; 3774;
3767; 3762; 3784; 3783; 37822. Pistininzi Pis home garden of Mr Cosimo Pistininzi,
StiloUNICT 3758
3. Taverniti Tav home garden of Mr Nicola Taverniti, Bivongi
UNICT: 3736; 3737; 3739; 3740; 3766; 3773; 3771; 3791; 3792; 3777; 3788; 3760; 3790; 3856
4. Gallo Gal home garden of Mr Salvatore Gallo, Tizzano
UNICT 4013
5. Arparano Arp home garden of Mr Arparano, Stilo UNICT: 3801; 3805; 3809; 38126. Drago Dra home garden of Mr Giuseppe Drago,
PazzanoUNICT 3850
Wild Calabria 1. Pazzano Stella Paz-St rocks along the road at the base of
Monte StellaUNICT: 3765; 3770; 3772; 3780; 3789;
3794; 3807; 3810; 3813; 3815; 3816; 3817; 3819; 3821; 3849; 3853; 3854; 3855
2. Pazzano West Paz-W Pazzano, trail going uphill from the fountain, West side of town
UNICT 4014
3. Pazzano East Paz-E road from Pazzano, climbing up above the main square, East Side of town
UNICT: 3802; 3803; 3804; 3808; 3811; 3814; 3818
4. Stilo Sti Monte Consolino, around Norman castle and slopes and Stilo, along the road and surrounding of ‘ Cattolica ’
UNICT: 3775; 3776; 3778; 3787; 3793; 3795; 3796; 3797; 3799; 38004006; 4007; 4008; 4009; 4012
Kales Sicily 1. De Baudo’s
neighbourDBn home garden of Mr De Baudo’s
neighbour, CaltavuturoUNICT: 3958; 3959; 3961; 3962
2. Romano Rom home garden of Mr Giuseppe Romano, Caltavuturo
UNICT: 3714; 3721; 3724; 3726; 3730; 3732; 3733; 3734; 3741; 3742; 3743; 3744; 3745; 3746; 3747; 3831; 3852
3. Trompello Tro home garden of Mr Trompello, Resuttano
UNICT: 4001; 4002; 4003; 4004; 4005
4. Like macrocarpa Lik fenced garden along the road, near Caltavuturo
UNICT: 3992; 3993; 3994
5. Vacante Vac home garden above Via Ricossa, near the house of Mr Vacante, Caltavuturo
UNICT 3846; 3978; 3979; 3981; 3982; 3983; 3984; 3985; 3986
6. Tudia Tud in front of Borgo Tudia, Resuttano UNICT 3822; 3996; 3998; 3999; 40007. Siragusa Sir home garden of Mr Siragusa,
CaltavuturoUNICT: 3963; 3965
8. 500 m 500 Caltavuturo, 500 m from roundabout/electricity tower
UNICT 3678; 3968; 3969; 3970; 3971; 3972
9. N-E side NEs Caltavuturo, 1 km NE, NE side of the mountain
UNICT: 3686; 3692; 3690; 3966
10. De Baudo DBa home garden of Mr De Baudo, 2 km from the fountain in center of Caltavuturo, direction W
UNICT: 3684; 3688; 3694; 3696; 3703; 3704; 3830; 3831; 3841; 3851
11. Second garden 2nd Caltavuturo, 400 m from roundabout, eastward (second garden)
UNICT: 3702; 3973; 3974
12. D’Anna Dan Resuttano, outside the village, road to Tudia, D’Anna’s land
UNICT 3676
13. Fascist fountain Fas garden by the fascist fountain, along the road Caltavuturo-Sclafani Bagni
UNICT3995
14. Under rock Und below the rock, Caltavuturo UNICT: 3975; 3976; 397715. Dubolino Dub Sclafani Bagni, Dubolino home garden UNICT 382416. Curly Cur curly kale garden, Caltavuturo UNICT 3967
(Continued)

148 L. Maggioni et al. Hereditas 151 (2014)
Populations/accessions Abbreviation Collecting site Accession numbers
Wild Sicily 1. Vacante slope VaS Caltavuturo, slope above Via Ricossa
and near castle, NE-facing side of mountain
UNICT: 3681; 3685; 3705; 3707; 3859; 3860; 3862; 3863; 3865; 3869; 3874; 3838; 3839; 3847; 3848; 3857; 3858; 3861; 3864; 3866; 3870; 3872; 3873
2. Above Romano Abo rock above home garden Romano, Caltavuturo, Palermo
UNICT: 3715; 3716; 3717; 3719; 3720; 3722; 3723; 3725; 3727; 3728; 3729; 3735; 3748; 3749; 3750; 3751; 3752; 3753; 3754; 3756; 3757; 3759; 3761; 3763; 3764; 3769; 3786; 3844
3. Sclafani Scl Sclafani Bagni, inside the castle UNICT: 3677; 3683; 3687; 3689; 3691; 3693; 3695; 3697; 3699; 3700; 3701; 3712; 3713; 3825; 3829; 3834; 3835; 3836; 3842; 3845
4. Between Caltavuturo and Sclafani
Btw cliffs between Caltavuturo and Sclafani
UNICT: 3679; 3698; 3706; 3711; 3833
Hybrids Sicily 1. Hybrid
CaltavuturoHyb slope above Via Ricossa, 5 m up the
hill, CaltavuturoUNICT: 3987; 3988; 3989
Table 1. Continued.
Fig. 1 . Collecting sites in Calabria and Sicily.
DNA containing phase (approx. 450 μ l) to clean tubes, 5 μ l RNase (10 mg ml �1 ) was added. Samples were shaken and centrifuged briefl y before being incubated at 37 ° C for 30 min. DNA was precipitated with cold isopropanol (1:1), gently mixed and placed at – 20 ° C for at least a couple of hours. Samples were centrifuged for 20 min at 4 ° C (3700 rpm). The supernatants were removed, and the
pellets were washed in 70% ethanol followed by centrifu-gation for 20 minutes at 4 ° C (3700 rpm). Discarding the supernatants, the pellets were left to dry at room tem-perature. Pellets were resuspended in 50 μ l 1 � TE buffer (10 mM Tris-HCl, 1 mM EDTA). The amounts of DNA were determined using spectrophotometer analysis (PowerWave X, � http://biotek.com/ � ).
Hereditas 151 (2014) Kale diversity in south Italy 149
Fig. 2. Agro-ecosystems in Calabria (abbreviations are referenced in Table 1).
Fig. 3. Agro-ecosystems in Sicily (abbreviations are referenced in Table 1).
AFLP reactions
The template preparation and AFLP reactions were done according to VOS et al. (1995) with the following modifi cations:
The genomic DNA (200 ng) was incubated with 1.2 U Eco RI and 3.1 U Mse I in 25 μ l 5 � RL buffer (10 mM Tris-HAc pH 7.5, 10 mM MgAc, 50 mM KAc, 5 mM DTT), 50 ng μ l �1 BSA for 2 h at 37 ° C. The adaptors
(sequence as described by VOS et al. 1995) were prepared by adding equimolar amounts of both strands, after which they were heated to 96 ° C for 5 min and left to cool to room temperature. Then 5 μ l of the ligation solution con-taining 2.5 pMol Eco RI-adaptors, 25 pMol Mse I-adaptors, 0.5 U T4DNA-ligase, 1 mM ATP, 0.2 μ g μ l �1 BSA in 5 � RL buffer was added to each digested sample and the incubation was continued for 16 h. The reaction mixture

150 L. Maggioni et al. Hereditas 151 (2014)
Table 2. Analyzed populations and genetic diversity data. (NI � number of individuals analyzed, NMP � number of mother plants). SE � standard error.
Populations/accessions NI NMP
Mean Nei’s genetic diversity (H) Private bands
(within groups)% polymorphic
lociMean SE
Kales Calabria Latassa 27 10 0.345 0.019 0 90%Pistininzi 39 1 0.325 0.019 0 93%Taverniti 26 14 0.306 0.020 0 88%Gallo 29 mixture 0.273 0.020 0 80%Arparano 27 4 0.271 0.021 0 79%Drago 7 1 0.105 0.020 0 28%Total 155 Mean: 76%
Wild Calabria Pazzano Stella 30 18 0.263 0.021 1 85%Pazzano West 27 1 0.226 0.022 1 77%Stilo 29 15 0.222 0.020 0 85%Pazzano East 26 7 0.202 0.018 0 81%Total 112 Mean: 82%
Kales Sicily De Baudo’s neighbour 29 4 0.361 0.016 0 98%Romano 26 17 0.313 0.019 0 90%Trompello 28 5 0.302 0.020 0 83%Like macrocarpa 29 3 0.284 0.022 0 78%Vacante 30 9 0.267 0.022 0 72%Tudia 44 5 0.252 0.021 0 73%Siragusa 22 2 0.249 0.023 0 67%500 m 30 6 0.247 0.021 0 69%N-E side 30 4 0.246 0.021 0 73%De Baudo 30 10 0.237 0.022 0 72%Second garden 30 3 0.236 0.023 0 62%D’Anna 8 1 0.219 0.021 0 70%Fascist fountain 28 1 0.200 0.023 0 59%Under rock 28 3 0.200 0.021 0 68%Dubolino 29 mixture 0.199 0.023 0 53%Curly 5 1 0.130 0.021 0 37%Total 426 Mean: 70%
Wild Sicily Vacante slope 30 22 0.239 0.022 3 78%Above Romano 28 28 0.230 0.022 4 78%Sclafani 30 20 0.179 0.021 4 57%Between Caltavuturo and Sclafani 30 5 0.124 0.018 1 49%Total 118 Mean: 65%
Hybrids Sicily Hybrid Caltavuturo 48 3 0.316 0.018 94%
Commercial cultivars Caulifl ower ‘ Romanesco natalino ’ - Sgaravatti 34 mixture 0.330 0.020 1 91%Caulifl ower ‘ Violetto di Sicilia natalino ’ - Fuscello 30 mixture 0.299 0.019 0 91%Unknown caulifl ower from Romano garden 28 mixture 0.253 0.021 0 78%Calabrese broccoli ‘ Ramoso calabrese tardivo ’ - Fuscello 19 mixture 0.222 0.022 0 67%Total 111
Totals Total wild 230 Mean: 70%Total kales 581 Mean: 72%Total hybrids 48 Mean: 94%Total collected material 859Total commercial cultivars 111 Mean: 82%
Grand total 970 Mean: 71%

Hereditas 151 (2014) Kale diversity in south Italy 151
each population to calculate the mean genetic diversity per population (H). It was averaged over loci for all indi-viduals of a group of populations to calculate the total genetic diversity of the group (H T ) . It was also averaged over loci and populations to calculate the mean genetic diversity of a population group (H A ). Student ’ s t -test was performed to determine the level of signifi cance of the dif-ferences obtained. Identifi cation of the presence of private alleles was obtained through comparison of populations in various combinations. A distance matrix was generated from Nei ’ s genetic distance ( NEI 1972) between pairs of populations and between pairs of individuals. Based on this distance matrix, a principal coordinate analysis (PCoA) was used to visualize the differences between populations or between individuals. Total genetic varia-tion was partitioned by an analysis of molecular variance (AMOVA) into three relative variance components, between regions, between populations and within popula-tions, here presented as ‘ variance ’ percentages. The sig-nifi cance was tested using 1000 permutations. All tests were computed in GenAlEx 6.41 ( PEAKALL and SMOUSE 2006), calibrated for binary diploid data.
RESULTS
A total of 81 polymorphic markers were scored, with sizes ranging between 50 bp and 700 bp. The mean values of genetic diversity per population (H) are reported in Table 2, together with percentages of polymorphic loci. Mean (H A ) and Total (H T ) genetic diversity of population groups are given in Table 3, with populations grouped by type and by geographic area. The number of private bands of each population analyzed within its respective popula-tion group is given in Table 2. Table 4 compares the means of Nei’s genetic diversity of groups of populations or accessions, based on AFLPs, from existing literature. AMOVA values are reported in Table 5.
Genetic diversity
The total genetic diversity (H T ) contained in the collected material (811 kale and wild individuals, excluding the hybrids) was 0.386. The average genetic diversity (H A ) over 30 populations was 0.242, compared to 0.253 over the 22 kale and to 0.211 over the eight wild populations.
The total diversity of kales (H T � 0.374) resulted sig-nifi cantly higher than that of wild individuals (H T � 0.314) at P � 0.01 level. At the same level of probability, also the average diversity of 22 kale populations (H A � 0.253) resulted signifi cantly higher than that of eight wild popu-lations (H A � 0.211).
The total diversity of four commercial cultivars (H T � 0.339, SE � 0.016) was signifi cantly lower than in the kales (H T � 0.374) at P � 0.01 level, but not signifi cantly
was then diluted 1:10 with 0.1 � TE (10 mM Tris-HCl, 0.1 mM EDTA). Preamplifi cation with 45 ng of primers ( Eco RI � C/ Mse I � A) having a single selective nucle-otide was carried out with 2 μ l template-DNA, 0.6 U Taq polymerase, 5 � GoTaq buffer (Promega), 2 mM MgCl 2
and 0.2 mM dNTP. The PCR conditions were as follows: an initial step of 72 ° C for 2 min, followed by 20 cycles of: 94 ° C for 1 s, 56 ° C for 30 s, 72 ° C for 2 min. The reaction products were diluted 20-fold with 0.1 � TE buffer and 5 μ l were used as template for the selective amplifi cation step. Two primer pairs with three selective nucleotides were used ( Eco RI � CAG/ Mse I � AGG and Eco RI � CAC/ Mse I � AAC). The Eco RI primers were labeled with fl uorescent near-infrared dyes (IRD 700 or IRD 800). For the selective amplifi cation solution, 37.5 ng of the Eco RI primers and 45 ng of the Mse I primers were used. Other-wise, it was identical to the preamplifi cation solution. The PCR conditions were as follows: 94 ° C for 2 min and 65 ° C for 2 min. Then eight cycles of 94 ° C for 1s, 64 ° C for 30s ( – 1 ° C per cycle), 72 ° C for 2 min, and fi nally 23 cycles of 94 ° C for 1s, 56 ° C for 30s, 72 ° C for 2 min. The amplifi ed DNA samples were mixed with 98% formamide loading buffer, heated to 94 ° C for 5 minutes and cooled on ice. They were loaded and run on 6% polyacrylamid-e gels on a LI-COR DNA sequencer (model Long Reader 4200). Two standard samples and size standards (50 – 700 bp Sizing Standard, Licor) were included on all gels to ensure the quality of the individual gel runs and reproducibility of the AFLP markers.
Data analysis
Only clear and reproducible bands were manually scored as either present (1) or absent (0) and recorded in a binary data matrix. The number of individuals analyzed per population is listed in Table 2. Diversity analysis was performed comparing populations or groups of popula-tions in different combinations. The groups were: kales from Calabria, kales from Sicily, wild populations from Calabria, wild populations from Sicily, kale and wild populations from Calabria, kale and wild populations from Sicily, kale and wild populations from Calabria and Sicily, hybrid population, commercial cultivars.
As an indicator of genetic diversity, we measured Nei ’ s gene diversity (H � 2 � p � q) ( NEI 1973), where p is the frequency of bands that are present at each studied locus in the offspring group and q � 1 – p. We have therefore used p as a proxy for allele frequency in all the following analysis. The Shannon index (I) was also measured, but it is not reported here since the relation between Nei and Shannon was rather constant, on average I � 1.5H (standard deviation � 0.03), and therefore I could be derived from H with a very close approximation. Nei ’ s gene diversity was averaged over loci and individuals for
152 L. Maggioni et al. Hereditas 151 (2014)
Table 3. Mean Nei’s genetic diversity of population groups ( H A ) (NP � number of populations) and total Nei’s genetic diversity of population groups ( H T ) (NI � number of individuals). SE � standard error .
Population group
Kales Wild Kales and Wild
H A H T H A H T H A H T
Geographic area Mean SE NP Mean SE NI Mean SE NP Mean SE NI Mean SE NP Mean SE NI
Calabria 0.271 0.009 6 0.357 0.015 155 0.228 0.010 4 0.324 0.018 112 0.254 0.007 10 0.371 0.015 267Sicily 0.246 0.006 16 0.369 0.012 426 0.193 0.011 4 0.279 0.019 118 0.236 0.005 20 0.382 0.013 544Calabria and Sicily 0.253 0.005 22 0.374 0.012 581 0.211 0.007 8 0.314 0.018 230 0.242 0.004 30 0.386 0.013 811
Table 4. Mean Nei’s genetic diversity of groups of accessions or populations, based on AFLPs, from published studies.
Species/crop OriginNo. of accessions
or populations Markers H A Reference
White cabbages the Netherlands 9 AFLP 0.12 Hintum et al. 2007White cabbages Worldwide 9 AFLP 0.15 Hintum et al. 2007Leafy kales Europe wide 12 AFLP 0.20 Christensen et al. 2011 Brassica rupestris Calabria and Sicily 10 AFLP 0.21 this paperLeafy kales Calabria and Sicily 22 AFLP 0.25 this paperWild Brassica oleracea Britain 8 AFLP 0.26 Watson-Jones et al. 2006Commercial broccoli and caulifl ower Italy 4 AFLP 0.28 this paper
different from that of wild material (H T � 0.314). The average diversity of the commercial cultivars (H A � 0.276, SE � 0.010) was however not signifi cantly different from the average kale populations diversity (H A � 0.253), but for both commercial cultivars and kale populations, the average diversity was signifi cantly higher than the average of the wild populations (H A � 0.211) at P � 0.01 level.
Comparing Calabria and Sicily, we noted that the average diversity of the Calabrian populations (both kale and wild) was higher than in the Sicilian populations, with a P � 0.05 level. In terms of total diversity, the same was true for wild material (Calabrian H T � 0.324 versus Sicilian H T � 0.279), but no signifi cant difference was recorded regarding the kales diversity.
The total diversity of the hybrid population (H T � 0.316, SE � 0.018) was in the same range of the diversity of wild material.
The search for private bands revealed that no band was exclusively present in the wild material that was not also present among the kales. Similarly, no private bands were recorded for Calabria or Sicily. However, Sicilian kales contained one private band that was not present in any of the Calabrian kales. This band had molecular weight 693 (700 marker), and was present in three Sicilian kale populations. The most diverse population, the Sicilian ‘ De Baudo ’ s neighbour ’ contained all the bands that were present in all Sicilian and Calabrian kales and wild popu-lations together. Conversely, Calabrian wild populations showed fi ve private bands that were not present in any
Sicilian wild population. These fi ve bands were all present in the Calabrian ‘ Pazzano Stella ’ population. They were however also present in both Sicilian and Calabrian kales (and may actually have been transferred from these into the wild Calabrian populations, as discussed in MAGGIONI et al. 2013). The two populations ‘ Pazzano Stella ’ and ‘ Pazzano West ’ contained all the polymorphic bands detected in the B. rupestris samples analyzed in this study.
The interval of variation of H was rather limited among the wild samples, ranging from 0.124 ( ‘ Between Caltavu-turo and Sclafani ’ ) to 0.263 ( ‘ Pazzano Stella ’ ). In the case of kales, it was much wider, ranging from 0.105 ( ‘ Drago ’ ) to 0.361 ( ‘ De Baudo ’ s neighbour ’ ).
Although the sample size of the populations was gener-ally close to 30 individuals, in a few cases it remained below 10 individuals. These low sample size populations ( ‘ Curly ’ , ‘ Drago ’ and ‘ D ’ Anna ’ ) remained at the lower edge of the genetic diversity ranking and therefore their respective data should be considered with some caution.
Population structure
PCoA of all populations (22 kales, eight wild and one hybrid) showed (Fig. 4) a clear separation of wild from kale populations, with the putative hybrid popula-tion plotting in between. Some populations stood out for their difference ( ‘ Pazzano East ’ among the wild and ‘ Curly ’ and ‘ D ’ Anna ’ among the cultivated). There was no separation between Calabrian and Sicilian populations.

Hereditas 151 (2014) Kale diversity in south Italy 153
Table 5. Analysis of molecular variance (AMOVA). (NP � number of populations, NI � number of individuals).
Populations/accessions NP NI PhiPTVariance within populations (%)
Variance between populations (%)
Variance between regions (%)
Kales Calabria 6 155 0.172 83% 17%Kales Sicily 16 426 0.286 71% 29%All kales 22 581 0.296 70% 24% 5%Wild Calabria 4 112 0.424 58% 42%Wild Sicily 4 118 0.438 56% 44%All wild 8 230 0.440 56% 42% 2%All Sicilian populations (without hybrids) 20 544 0.401 60% 40%All Calabrian populations 10 267 0.361 64% 36%All populations (with hybrids) 31 859 0.397 60% 37% 3%Commercial cultivars 4 111 0.165 84% 16%All kales vs All wild 2 811 0.254 75% 25%All Sicilian vs All Calabrian 2 859 0.058 94% 6%Kales, wild and commercial cultivars 3 922 0.220 78% 22%Kales vs Commercial cultivars 2 692 0.105 89% 11%
Fig. 4. PCoA of all kale and wild populations. Symbols represent the average position of individuals of each population. Cumulated percentage of variation explained by the fi rst 2 axes � 68%. For number of individuals in each population see Table 2.
This was also confi rmed by the AMOVA (Table 5), indi-cating a very small (3%) variance among regions. Vari-ance within populations was higher (60%) than variance between populations (37%).
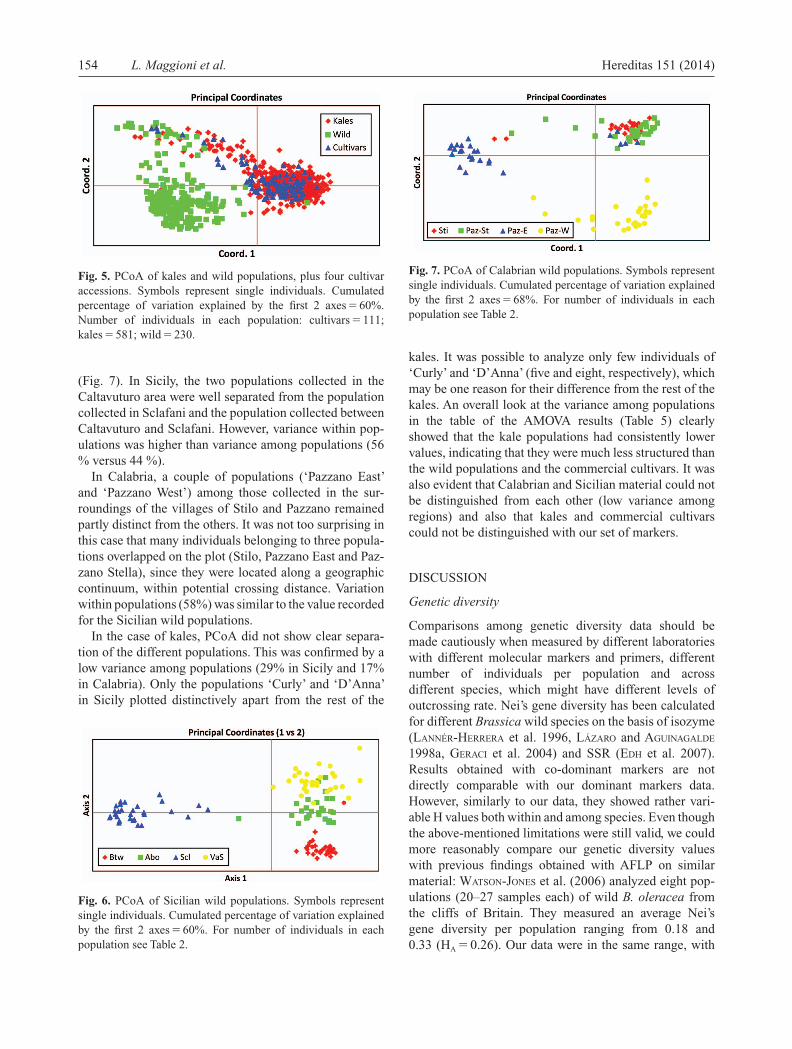
When all samples were analyzed as if they belonged to three populations (wild, kales and commercial cultivars), the PCoA confi rmed a distinct separation between wild and cultivated crops (Fig. 5). Some areas of overlap might indicate gene fl ow events (discussed in MAGGIONI et al.
2013). The AMOVA indicated a high variance within populations (78%).
It might be noted that commercial cultivars plotted together with the kales. Variance among the three groups was low (22%) and it decreased to 11% when the cultivars were compared to the kales (Table 5).
PCoA at the level of single individuals showed a clear geographic separation between both the wild populations collected in Sicily (Fig. 6) and those collected in Calabria
154 L. Maggioni et al. Hereditas 151 (2014)
Fig. 7. PCoA of Calabrian wild populations. Symbols represent single individuals. Cumulated percentage of variation explained by the fi rst 2 axes � 68%. For number of individuals in each population see Table 2.
Fig. 6. PCoA of Sicilian wild populations. Symbols represent single individuals. Cumulated percentage of variation explained by the fi rst 2 axes � 60%. For number of individuals in each population see Table 2.
Fig. 5 . PCoA of kales and wild populations, plus four cultivar accessions. Symbols represent single individuals. Cumulated percentage of variation explained by the fi rst 2 axes � 60%. Number of individuals in each population: cultivars � 111; kales � 581; wild � 230.
(Fig. 7). In Sicily, the two populations collected in the Caltavuturo area were well separated from the population collected in Sclafani and the population collected between Caltavuturo and Sclafani. However, variance within pop-ulations was higher than variance among populations (56 % versus 44 %).
In Calabria, a couple of populations ( ‘ Pazzano East ’ and ‘ Pazzano West ’ ) among those collected in the sur-roundings of the villages of Stilo and Pazzano remained partly distinct from the others. It was not too surprising in this case that many individuals belonging to three popula-tions overlapped on the plot (Stilo, Pazzano East and Paz-zano Stella), since they were located along a geographic continuum, within potential crossing distance. Variation within populations (58%) was similar to the value recorded for the Sicilian wild populations.
In the case of kales, PCoA did not show clear separa-tion of the different populations. This was confi rmed by a low variance among populations (29% in Sicily and 17% in Calabria). Only the populations ‘ Curly ’ and ‘ D ’ Anna ’ in Sicily plotted distinctively apart from the rest of the
kales. It was possible to analyze only few individuals of ‘ Curly ’ and ‘ D ’ Anna ’ (fi ve and eight, respectively), which may be one reason for their difference from the rest of the kales. An overall look at the variance among populations in the table of the AMOVA results (Table 5) clearly showed that the kale populations had consistently lower values, indicating that they were much less structured than the wild populations and the commercial cultivars. It was also evident that Calabrian and Sicilian material could not be distinguished from each other (low variance among regions) and also that kales and commercial cultivars could not be distinguished with our set of markers.
DISCUSSION
Genetic diversity
Comparisons among genetic diversity data should be made cautiously when measured by different laboratories with different molecular markers and primers, different number of individuals per population and across different species, which might have different levels of outcrossing rate. Nei ’ s gene diversity has been calculated for different Brassica wild species on the basis of isozyme ( LANN É R-HERRERA et al. 1996, L Á ZARO and AGUINAGALDE 1998a, GERACI et al. 2004) and SSR ( EDH et al. 2007). Results obtained with co-dominant markers are not directly comparable with our dominant markers data. However, similarly to our data, they showed rather vari-able H values both within and among species. Even though the above-mentioned limitations were still valid, we could more reasonably compare our genetic diversity values with previous fi ndings obtained with AFLP on similar material: WATSON-JONES et al. (2006) analyzed eight pop-ulations (20 – 27 samples each) of wild B. oleracea from the cliffs of Britain. They measured an average Nei ’ s gene diversity per population ranging from 0.18 and 0.33 (H A � 0.26). Our data were in the same range, with

Hereditas 151 (2014) Kale diversity in south Italy 155
different nature, including wild populations. The lower level of diversity shown by the wild populations can also be understood, if we consider that these populations are often confi ned to limited areas and therefore may likely be subject to genetic drift effects. The sharper structure of the wild populations is also in line with these considerations.
The relatively high level of diversity of the commercial cultivars was not expected and we cannot fully explain this result, since these materials presumably have gone through a selection process which should reduce their variability. One possible explanation is that these cultivars were only subject to a mild selection process. Moreover, we should consider that the level of variation that is measured by the AFLP is largely neutral and there-fore some functional traits, such as those that determine the different types of brassica crops, are possibly not detected by a relatively low number of markers as we have used.
The absence of private bands in the wild samples, compared to leafy kales, is also contrasting with the clear qualitative difference between cultivated and wild material, as shown by the pattern of Fig. 4. We should therefore accept, as indicated above, that the pattern revealed by AFLPs here gives a general indication of the level of diversity, without the possibility to capture all the morphological, biochemical or other functional differences.
A possible explanation of the very different levels of diversity recorded for the kale populations (variation interval of H was much wider in the kale than in the wild samples) is that each farmer behaves independently regarding the choice of brassica crop type that is planted each year, as well as regarding the procurement of seeds or plantlets. Therefore, the range of variability that is available as pollen at any location at the time of fl owering can be very high and unpredictable. The close distance among several home gardens might also enhance the potential gene fl ow.
Population structure
According to the literature, the population structure of wild Section Brassica populations (2n � 18) showed high variation within populations, as well as a signifi cant degree of gene differentiation among populations. Spe-cifi cally, using isozymes, LANN É R-HERRERA et al. (1996) detected a high intra-population variation in most popula-tions, regardless of their size, with a G st value of 0.37 over eighteen populations of B. oleracea from Spain, France and UK. High diversity within and signifi cant differentia-tion among UK populations was also confi rmed by RAYBOULD et al. (1999) with microsatellites and by WATSON-JONES et al. (2006) with AFLPs (average F st � 0.234 and 0.226, respectively).
average H per population ranging between 0.12 – 0.26 (H A � 0.21) for eight wild populations, between 0.10 – 0.36 (H A � 0.25) for twenty-two kale populations and between 0.22 – 0.33 (H A � 0.28) for four commercial cultivars. It seemed that the diversity of the British wild samples was more in line with the level of diversity of our cultivated Italian kales, while B. rupestris in our case showed a lower level of diversity. CHRISTENSEN et al. (2011) analyzed sev-enteen B. oleracea populations, twelve of which were leafy kale landraces from all over Europe, two cultivars and three wild samples. Average Nei ’ s genetic diversity per accession was ranging between 0.11 and 0.27 (total diversity H T � 0.32 and H A � 0.20 over twelve kale acces-sions). Again, our values were in the same range. How-ever, the average value of the Calabrian kales had the same value (H � 0.27) of the most diverse accession ana-lyzed by Christensen et al. The total diversity of both Calabrian (H T � 0.36) and Sicilian (H T � 0.37) kales (respectively six and sixteen accessions) was higher than the total diversity of seventeen European accessions. This may be an indication, all limitations considered, that the kales collected by us in south Italy represent an impor-tant value in terms of genetic diversity. Since other B. oleracea varieties (broccoli, caulifl ower and Savoy cabbage) are also grown in the same area in South Italy, including both local self-reproduced populations and modern cultivars, these might have contributed to increased diversity through exchange of genes with the leafy kales.
Considering the average Nei ’ s genetic diversity (H A � 0.15) of a collection of nine accessions representing world-wide white cabbage diversity in the Dutch gene-bank ( HINTUM et al. 2007), our data showed higher diver-sity in B. rupestris , in leafy kale and in the commercial cultivars.
Table 4 summarizes the Nei ’ s genetic diversity data derived from AFLPs and obtained from the published studies. The trend emerging from these data showed that white cabbages had lower diversity, which might be due to selection. Leafy kales had rather variable values and B. rupestris , which is an endemic wild species with relatively narrow distribution, showed a genetic diversity which was close to the lower edge of the diversity of leafy kales. The British wild B. oleracea populations showed a diversity which was close to the upper tail of the leafy kales ’ diver-sity. Other B. oleracea crop types available as small pack-ets in the Italian market remained in the same range of high values of genetic diversity.
Our results indicated that cultivated kales in south Italy hold higher levels of total and average diversity compared to B. rupestris . This is not surprising if it is kept in mind that farmers often grow different types of B. oleracea crops together and their saved seed has a high chance of being the result of inter-crosses by material of very

156 L. Maggioni et al. Hereditas 151 (2014)
groups tested (cabbage, broccoli, kohlrabi, caulifl ower, kale and kai-lan was obtained by IZZAH et al. (2003) only by using a very high number of markers (69 SSRs provid-ing 359 alleles). AFLPs are known to reveal a high degree of polymorphism dispersed over the genome, unsurpassed by most other marker systems, therefore they are often indicated as very suitable for estimating and monitoring genetic diversity, including for conservation purposes ( MARIETTE et al. 2002; VARSHNEY et al. 2007). The inter-esting pattern shown by our study might, therefore, not have been revealed by many other marker systems, which disclose less polymorphism. It will however be important not to rely solely on the diversity pattern shown by the AFLPs to take conservation strategy decisions, especially if using limited numbers of markers.
The domestication issue
Regarding the issue of the domestication of B. oleracea , SNOGERUP (1980) hypothesized a probable primary origin of the ‘ stem kales ’ (i.e. the kales of var. acephala , used mainly for their edible foliage) from forms of the rupes-tris – incana complex, since they have in common a strong dominating main stem in combination with hairs at least on the seedling. Our data indicated a clear molecular dis-tinction between B. rupestris and both the cultivated local kales and other B. oleracea crop types. The genetic diver-sity of the Calabrian and Sicilian kales is larger than that shown by B. rupestris , therefore we tend to believe that B. rupestris is not the most likely candidate as a progenitor of the B. oleracea crops. Although we cannot rule out the possibility of genetic erosion of B. rupestris since domes-tication, our conclusion is in line with the fi ndings from MEI et al. (2010) that B. rupestris and other Sicilian spe-cies showed such a high comparable genetic distance from B. oleracea (based on AFLPs and SSR), that there is a low possibility that current B. oleracea crops originated in Sicily. Even though the locations that we studied in South Italy may not correspond to the original sites of domesti-cation of B. oleracea , we wish to highlight that the agro-ecosystems under study represented a model scenario for the conditions that could have led to domestication of leafy kales in antiquity, albeit in a different location and starting from a different wild species. In fact in our model study we saw that the wild plants grew around or inside the villages where farmers tended their home gardens. The wild species is still consumed by humans in special occasions. Some people like their pungent taste, although generally the ‘ sweeter ’ taste of the domesticated leafy kale is preferred. This trait has possibly been the fi rst cri-terion of selection towards domestication. The observed agro-ecological and ethno-botanical elements that might have had an infl uence at the time of domestication were the following: 1) occasional use of the wild relative for
With the use of allozymes, HURTREZ-BOUSS È S (1996) found a defi ciency of heterozygotes and high G st values (0.11) in seven B. insularis populations in Corsica, indi-cating their isolation. Seven populations of B. cretica in Crete were analyzed with nuclear SSRs and showed an exceptional degree of gene differentiation with an overall F st � 0.63 ( EDH et al. 2007). In the attempt to understand the reciprocal relationships of ten wild species from the Mediterranean and Atlantic coast, L Á ZARO and AGUINAGALDE (1998a) used isozymes to detect an average G st � 0.33. A similar study by GERACI et al. (2004) with isozymes on fi ve Sicilian species obtained high G st values between 0.30 – 0.38.
In our study, which was analyzing for the fi rst time wild and cultivated populations growing in close proximity, the population structures, as revealed by the PCoA and AMOVA analysis, indicated that wild B. rupestris and leafy kale B. oleracea could be distinguished by AFLPs, since the two species were generally well separated, with a few exceptional individuals that we might assume to be the result of intercrossing between species in areas of overlapping geographic distribution.
On the other hand, germplasm collected in Sicily (whether wild or leafy kale) could not be molecularly dis-tinguished from germplasm collected in Calabria. Wild populations collected in isolated locations showed a dis-tinct molecular pattern, since they separated in distinct clusters, both in Calabria and in Sicily. On the other hand, kales grown in different home gardens could not be molecularly distinguished from each other. Indeed, no cultivar names for leafy kales, that were generically named ‘ cauli ’ (i.e. coles) were used by the local farmers that we met throughout Calabria and Sicily. Even though we noticed some differences in leaf shapes, leaf color and plant habit, these were not so outstanding as to character-ize any given local variety. Therefore, the AFLP pattern was not unexpected in this case, but confi rms the absence of a genetic structure for the leafy kales investigated. Morphological differences might be explained if few genes (not evidenced by the AFLP pattern) were involved in determining morphological characters mentioned above. Some of these characters, such as fruit length, are also thought to be highly dependent on environmental effects ( SNOGERUP et al. 1990). The inability of our set of markers to distinguish different types of B. oleracea from each other should also not be too disconcerting, consider-ing that we used only two primers and a limited number of markers. For example, distinction of broccoli from cauli-fl ower was not fully realized by TONGU Ç and GRIFFITHS (2004) even using 13 SSRs. Also LOUARN et al. (2007), using 11 SSRs, did not obtain a fully resolved clustering of various brassica types, since for example broccoli cul-tivars clustered together with some Brussel sprout and white cabbage cultivars. A full separation of all cultivar

Hereditas 151 (2014) Kale diversity in south Italy 157
(Maggioni), went back to monitor the Calabrian popula-tions in September 2014 and he found a severe reduction of the ‘ Pazzano Stella ’ population due to a recent fi re, while the ‘ Stilo ’ population had been reduced by ‘ clean-ing ’ of the slopes around the Byzantine church.
Considering that scenarios similar to the agro-ecosystems described here are not known for the Atlantic locations of wild B. oleracea , we think that this point adds some weight to the hypothesis of a Mediterranean domes-tication of the B. oleracea crops, as we have indicated in a previous paper ( MAGGIONI et al. 2010) on the basis of lin-guistic and literary considerations.We also note that recent chloroplast phylogeny studies ( ARIAS et al. 2014) support a Mediterranean origin for ancestors of B. oleracea and B. rapa , as well as indicating that B. incana , B. cretica and B. montana are phylogenetically closer to B. oleracea than B. rupestris is ( ARIAS and PIRES 2012). We agree with these authors that further population sampling and molec-ular analysis will be necessary to assess the diversity and track down the origin of the B. oleracea crops.
Acknowledgements – This work was supported by grants from The Nilsson-Ehle Foundation at The Royal Physiographics Society of Lund, Sweden. The help of Michele Bozzano for the creation of the maps is acknowledged with thanks. Special thanks go to all farmers who kindly shared their seed and knowl-edge, in particular: Attilio Arparano, Giuseppe De Baudo, Domenico and Giuseppe Drago, Giacomo and Vincenza Dubolino, Salvatore Gallo, Raffaele Latassa, Cosimo Pistininzi, Giuseppe Romano, Giuseppe Siragusa, Nicola Taverniti, Mr Trompello and Francesco Vacante.
REFERENCES
Allender, C. J., Allainguillaume, J., Lynn, J. et al. 2007. Simple sequence repeats reveal uneven distribution of genetic diversity in chloroplast genome of Brassica oleracea L. and (n � 9) wild relatives. – Theor. Appl. Genet. 114: 118 – 609.
Arias, T. and Pires, J. C. 2012. A fully resolved chloroplast phylogeny of the brassica crops and wild relatives (Brassicaceae: Brassiceae): novel clades and potential taxonomic implications. – Taxon 61: 980 – 988.
Arias, T., Beilstein, M. A., Tang, M. et al. 2014. Diversifi cation times among Brassica (Brassicaceae) crops suggest hybrid formation after 20 million years of divergence. – Am. J. Bot. 101: 86 – 91.
BBSRC 2011. The story behind ‘ super broccoli ’ . – � www.bbsrc.ac.uk/news/health/2011/111123-f-super-broccoli.aspx � .
Bothmer, R. von, Gustafsson, M. and Snogerup, S. 1995. Brassica sect. Brassica (Brassicaceae). II. Inter- and intraspecifi c crosses with cultivars of B. oleracea . – Gen. Res. Crop Evol. 42: 165 – 178.
Branca, F. and Iapichino G. 1997. Some wild and cultivated Brassicaceae exploited in Sicily as vegetables. – Plant Genet. Resour. Newslett. 110: 22 – 28.
Christensen, S., von Bothmer, R., Poulsen, G. et al. 2011. AFLP analysis of genetic diversity in leafy kale ( Brassica oleracea L. convar. Acephala (DC.) Alef.) kales, cultivars and wild populations in Europe. – Genet. Res. Crop Evol. 58: 657 – 666.
human consumption; 2) co-existence of cultivated (domes-ticated) and wild plants in close proximity; 3) conscious selection made by farmers that eliminate ‘ off type ’ plants bearing wild traits from their fi elds (Maggioni et al. unpubl.); 4) ongoing intercrossing between wild and cul-tivated plants with possible bi-directional introgression ( MAGGIONI et al. 2013).We have consistently registered the above elements both in Calabria and in Sicily and we assume that the same scenario can be found in several other locations in the Mediterranean area and that it can be representative of the original steps leading to domestica-tion of B. oleracea . Indeed, it is known that other Mediter-ranean wild relative species are still used for human consumption, such as B. cretica in Greece ( SNOGERUP et al. 1990), B. incana in Sicily ( BRANCA and IAPICHINO 1997) and B. insularis in Sardinia (Mascia pers. comm.).
Conclusion
The present study indicated that the surveyed agro-ecosystems were effectively conserving a large variability in situ and on-farm. In particular, the total genetic diver-sity was higher in leafy kales grown in home gardens than in wild B. rupestris growing nearby. Sicilian material did not differentiate from Calabrian material, wild popula-tions showed a genetic structure that enabled to differenti-ate them from each other, while home gardens ’ kales could not be distinguished one from one another.
Currently there is no risk of replacement of the local varieties with commercial varieties, since the leafy kale crop is only grown from self-produced seed (no commer-cial cultivars are locally available for this type of Brassica ). It can be assumed that this crop will continue to be grown as long as family-owned small properties with home gardens and few farm animals that are fed with kale leaves continue to exist. However, as a safety mea-sure for the future, ex situ conservation is a recommended complementary action. Considering that variation within populations was always higher than among populations, it should be suffi cient to preserve samples from a few home gardens to ensure that most of the variability is main-tained. Our data allowed us to identify those specifi c home gardens that hosted the highest genetic diversity. Further studies should be carried out to analyze the genetic basis of the morphological differences. In the case of wild pop-ulations, it has been shown that isolated populations had a distinct pattern, but this could be assumed to be derived from genetic drift. Therefore, collection of several distinct populations will not add too much in terms of total vari-ability, but each population with a distinct pattern should be collected if we wished to preserve differentiation among populations. An additional reason to carefully col-lect the different wild populations for long-term conserva-tion is their sometimes threatened status. In fact one of us

158 L. Maggioni et al. Hereditas 151 (2014)
microsatellite markers within and among mixed Q. petraea (Matt.) Liebl. And Q. robur L. stands. – Silvae Genet. 51: 72 – 79.
Mei, J., Li, Q., Yang, X. et al. 2010. Genomic relationships between wild and cultivated Brassica oleracea L. with emphasis on the origination of cultivated crops. – Gen. Res. Crop Evol. 57: 687 – 692.
Mithen, R. F. 2014. Development and commercialisation of ‘ Benefort é ’ broccoli and potential health benefi ts. – In: Branca, F. and Tribulato, A. (eds), Acta Hort. Proc. VIth IS on Brassicas and XVIIIth Crucifer Genetics Workshop. F. Acta Hort. 1005, ISHS, pp. 67 – 70.
Nei, M. 1972. Genetic distance between populations. – Am. Nat. 106: 283 – 292.
Nei, M. 1973. Analysis of gene diversity in subdivided populations. – Proc. Natl Acad. Sci. USA 70: 3321 – 3323.
Peakall, R. and Smouse, P. E. 2006. GENALEX 6: genetic analysis in Excel. Population genetic software for teaching and research. – Mol. Ecol. Notes 6: 288 – 295.
Raybould, A. F., Mogg, R. J., Clarke, R. T. et al. 1999. Variation and population structure at microsatellite and isozyme loci in wild cabbage ( Brassica oleracea L.) in Dorset (UK). – Gen. Res. Crop Evol. 46: 351 – 360.
Song, K., Osborn, T. C. and Williams, P. H. 1990. Brassica taxonomy based on nuclear restriction fragment length polymorphisms (RFLPs). 3. Genome relationship in Brassica and related genera and the origin of B. oleracea and B. rapa (syn. campestris ). – Theor. Appl. Gen. 79: 497 – 506.
Snogerup, S. 1980. The wild forms of the Brassica oleracea Group (2n � 18) and their possible relations to the cultivated ones. – In: Tsunoda, S., Hinata, K and G ó mez-Campo, C. (eds). Brassica crops and wild allies, biology and breeding. Scientifi c Society Press, Tokyo, Japan, pp. 121 – 132.
Snogerup, S., Gustafsson, M. and Bothmer, R. v. 1990. Brassica sect. Brassica (Brussicaceae). I. Taxonomy and variation. – Willdenowia. 19: 271 – 365.
Tongu ç , M. and Griffi ths, P. D. 2004. Genetic relationships of Brassica vegetables determined using database derived simple sequence repeats. – Euphytica 137: 193 – 201.
Varshney, R. K., Chabane, K., Hendre, P. S. et al. 2007. Comparative assessment of EST-SSR, EST-SNP and AFLP markers for evaluation of genetic diversity and conservation of genetic resources using wild, cultivated and elite barleys. – Plant Sci. 173: 638 – 649.
Vos, P., Hogers, R., Bleeker, M. et al. 1995. AFLP – a New Technique for DNA-Fingerprinting. – Nucleic Acids Res. 23: 4407 – 4414.
Watson-Jones, S., J., Maxted, N. and Ford-Lloyd, B.V. 2006. Population baseline data for monitoring genetic diversity loss for 2010: a case study for Brassica species in the UK. – Biol. Conserv. 132: 490 – 499.
Zohary, D., Hopf, M. and Weiss, E. 2012. Domestication of plants in the old world, 4th edn. – Oxford Univ. Press.
Doyle, J. J. and Doyle, J. L. 1987. A rapid DNA isolation procedure for small quantities of fresh leaf tissue. – Phytochem. Bull. 19: 11 – 15.
Edh, K., Wid é n, B. and Ceplitis, A. 2007. Nuclear and chloroplast microsatellites reveal extreme population differentiation and limited gene fl ow in the Aegean endemic Brassica cretica (Brassicaceae). – Mol. Ecol. 16: 4972 – 4983.
FAOSTAT 2013. FAO Statistics online database. – � http://faostat3.fao.org/ � accessed 15 September 2013.
Geraci, A., Ch è vre, A.-M., Divaret, I. et al. 2004. Isozyme analysis of genetic diversity in wild Sicilian populations of Brassica sect. Brassica in view of genetic resources management. – Gen. Res. Crop Evol. 51: 137 – 146.
Hanelt, P. and Institute of Plant Genetics and Crop Plant Research (eds.) 2001. Mansfeld’s Encyclopedia of Agricultural and Horticultural Crops. 1 – 6. – Springer.
Hintum, Th. J. L. van, Wiel, C. C. M. van de, Visser, D. L. et al. 2007. The distribution of genetic diversity in a Brassica oleracea gene bank collection related to the effects on diversity of regeneration, as measured with AFLPs. – Theor. Appl. Genet. 114: 777 – 786.
Hurtrez-Bouss è s, S. 1996. Genetic differentiation among natural populations of the rare Corsican endemic Brassica insularis : implications for conservation guidelines. – Biol. Conserv. 76: 25 – 30.
Izzah, N. K., Lee, J., Perumal, S. et al. 2013. Microsatellite-based analysis of genetic diversity in 91 commercial Brassica oleracea L. cultivars belonging to six varietal groups. – Genet. Res. Crop Evol. 60: 1967 – 1986.
L á zaro, A. and Aguinagalde, I. 1998a. Genetic diversity in Brassica oleracea L. (Cruciferae) and wild relatives (2n � 18) using isozymes. – Ann. Bot. 82: 821 – 828.
L á zaro, A. and Aguinagalde, I. 1998b. Genetic diversity in Brassica oleracea L. (Cruciferae) and wild relatives (2n � 18) using RAPD markers. – Ann. Bot. 82: 829 – 833.
Lann é r-Herrera, C., Gustafsson, M., F ä lt, A.-S et al. 1996. Diversity in natural populations of wild Brassica oleracea as estimated by isozyme and RAPD analysis. – Gen. Res. Crop Evol. 43: 13 – 23.
Louarn, S., Torp, A. M., Andersen, S. B. et al. 2007. Database derived microsatellite markers (SSRs) for cultivar differentiation in Brassica oleracea . – Gen. Res. Crop Evol. 54: 1717 – 1725.
Maggioni, L., von Bothmer, R., Poulsen, G. et al. 2010. Origin and domestication of cole crops ( Brassica oleracea L.): linguistic and literary considerations. – Econ. Bot. 64: 109 – 123.
Maggioni, L., Bagger J ø rgensen, R., von Bothmer, R. et al. 2013. Signs of inter-crossing between leafy kale landraces and Brassica rupestris in southern Italy. – In: Branca, F. and Tribulato, A. (eds), Acta Hort. Proc. VIth IS on Brassicas and XVIIIth Crucifer Genetics Workshop. F. Acta Hort. 1005, ISHS, pp. 165 – 172
Mariette, S., Cottrell, J., Csaikl, U. M. et al. 2002. Comparison of levels of genetic diversity detected with AFLP and