genetic divergence for yield, physiological and quality .... shruthi, et al.pdf · a b s t r a c t...
TRANSCRIPT

Int.J.Curr.Microbiol.App.Sci (2020) 9(1): 2422-2433
2422
Original Research Article https://doi.org/10.20546/ijcmas.2020.901.276
Genetic Divergence for Yield, Physiological and Quality Traits in
Super-Early Pigeon pea (Cajanus cajan. (L.) Millsp.)
H.B. Shruthi1, 2
, A.J. Hingane1*
, M. Reddi Sekhar2, C.V. Sameer Kumar
3,
L. Prashanthi2, B .V. Bhaskar Reddy
2, P. Sudhakar
2, J. Srivarsha
1,
T.M. Bhosle1, Anil Kumar. V
1 and A. Rathore
1
1Pigeonpea Breeding, International Crops Research Institute for Semi-arid Tropics
Patancheru, Telangana, 502324, India 2Department of Genetics and Plant Breeding, S.V.Agricultural College, ANGRAU, Tirupati,
Andhra Pradesh, 517501, India 3Pulses Breeding Division, Regional Agricultural Research Station, Palem, PJTSAU,
Hyderabad, Telangana,
*Corresponding author
A B S T R A C T
Introduction
Pigeonpea is pro-farmer crop grown in the
tropical and sub-tropical regions of Asia,
Africa, and the Caribbean. Globally cultivated
in 7 Mha with production and productivity of
6.8 MT and 969 kgha-1
respectively
(FAOSTAT, 2019).Consumed as dal in India,
International Journal of Current Microbiology and Applied Sciences ISSN: 2319-7706 Volume 9 Number 1 (2020) Journal homepage: http://www.ijcmas.com
The present investigation aimed to study genetic divergence and clustering
pattern of 37super-early pigeon pea genotypes. Analysis of variance and
hierarchical cluster analysis of tocher’s method revealed significant
differences among the genotypes for all the traits under study. Based on
genetic distance (D2 value), the 37 genotypes were grouped into 9
distinctive clusters, of which cluster I and II formed the largest clusters
with 10 genotypes in each. Among all the characters understudy, leaf area
index(LAI) at 60 DAS contributed more to the divergence followed by leaf
area (17.02) and leaf area index (12.71) at maturity. Based on the average
inter-cluster distance, the cluster III and IX (66.93) tailed by cluster III and
VIII (64.86) and cluster VI and VIII (64.06) showed higher inter-cluster
distance depicting the wider divergence. Trait-wise selection of diverse
parents from the above clusters aids in exploitation of heterosis in super-
early pigeon pea.
K e y w o r d s
Super-early,
pigeonpea, genetic
divergence,
Cajanus cajan
Accepted:
22 December 2019
Available Online:
20 January 2020
Article Info

Int.J.Curr.Microbiol.App.Sci (2020) 9(1): 2422-2433
2423
also known for fodder, fuelwood, soil
amelioration, fencing and thatching purposes
(Mula and Saxena, 2010). Under a changing
climate scenario, water is a limiting factor in
current day agriculture. Since a great scale of
maturity is now available in pigeonpea, the
development of genotypes with the early-
maturity is the first line of defence in counter
to terminal drought stress (Chauhan et al.,
1992). Efforts are made at ICRISAT,
Patancheru to develop a novel ‘super-early’
maturity group of pigeonpea.
Super-early pigeonpea maturing in 90-100
days opens the avenue to explore pigeonpea
in off-season and non-traditional niches,
aiming the upsurge in national production.
Photo-insensitivity is reported to be linked to
earliness (Wallis et al., 1981) is an add-on in
super-early pigeonpea along with semi-dwarf
stature. Being hardy and early fits in rice
fallows, wheat-pulses and sugarcane-pulses
intercropping system using residual moisture
for growth and development (Hingane et al.,
2018). Early genes, aids in rapid generation
turnover, cutting the drudgery of longer
breeding cycles.
Synchrony in maturity and attractive stature
opens the prospect of mechanization in
pigeonpea (Ranjani et al., 2018). With these
wider opportunities in pigeonpea, an attempt
to explore the genetic diversity in 37
genotypes of super-early pigeonpea for yield,
yield attributes, physiological and quality
traits was made to foresee the future breeding
scope.
Materials and Methods
The experimental material comprised of 37
super-early pigeonpea genotypes laid out at
pigeonpea breeding fields, ICRISAT,
Patancheru during Kharif 2016. The study
material consisted of 13 determinate types
(DT) and 21 non-determinate types (NDT)
with two DT checks MN1, MN5, and one
NDT check ICPL 20325. Each genotype was
sown in 4 rows of 4 m length with a spacing
of 30×10 cm in Randomized Complete Block
Design (RCBD) with 2 replications. The
experimental plot was located at 17.51°N
latitude, 78.27° E longitude, an altitude of 545
meters above MSL, with an annual rainfall of
877.8mm and alfisol being soil type. Field
observations for traits viz., plant height (cm),
number of primary branches plant-1
, pods
plant-1
, seeds pod-1
, grain weight plant-
1(g),100 seed weight(g) and harvest index (%)
were recorded, on five randomly selected
plants whereas days to 50% flowering, days
to maturity and yield hectare-1
(kg) was
calculated on plot basis.
Dry matter content(g) at 30DAS, 60DAS and
maturity, leaf area (cm2) at 30DAS, 60DAS,
and maturity were recorded on five randomly
uprooted plants at (30 days interval) whereas
canopy volume (cm3): Rodríguez, et al., 2008,
leaf area index (LAI):Watson (1952) at 30DAS,
60DAS and maturity, crop growth rate
(CGR)(gm-2
d-1
):Radford (1967), net
assimilation rate (NAR) (gm-2
d-1
):Williams
(1946), leaf area duration (LAD) (m2 days)
between 30-60DAS and 60DAS-maturity ;Hunt
(1978), protein content (%):Sahrawat et al.,
(2002), phenol content (mg GAE 100-
1g):Singleton and Rossi (1965), dal cooking
time (min): Sethi et al., (2014): Singh et al.,
(1984): Akinoso and Oladeji (2017)and dal
recovery (%): Sawargaonkar (2010)were
calculated methodically. Standard cultural
practices were followed to maintain good crop
stand.
Data collected were subjected to analysis of
variance using SAS v. 9.4 program (SAS,
2017).Genetic divergence was computed by
multivariate analysis using Mahalanobis D2
statistics. The entries were congregated into
clusters following Euclidean method as
described by (Rao, 1952).

Int.J.Curr.Microbiol.App.Sci (2020) 9(1): 2422-2433
2424
Results and Discussion
The analysis of variance for all the thirty traits
depicted significant differences (Table 1).The
hierarchical cluster analysis of tocher’s
method classified 37 super-early pigeonpea
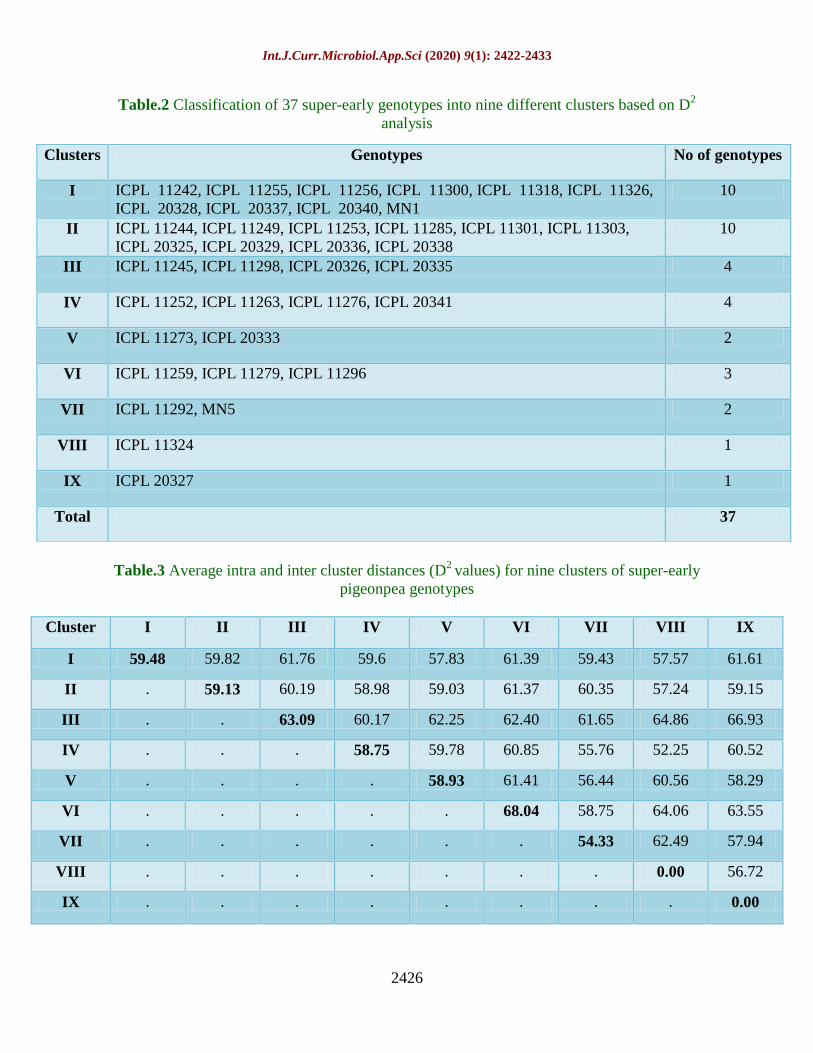
genotypes into 9 distinctive clusters (Table 3).
Among the nine clusters formed, cluster I and
II turnedout to be the biggest cluster housing
10 genotypes each whereas cluster VIII and
IX housed single genotype each (Table 2). A
close relationship was witnessed in the
genotypes grouped under the same cluster
than diverse clusters. The intra and inter
cluster D2 values among 9 clusters are
presented in Table 3.
The dendrogram of 37 super-early pigeonpea
genotypes depiciting the spatial position of
each cluster in relation to others is presented
in Fig.1. The intra-cluster distances ranged
from 54.33 to 68.04. The maximum intra-
cluster distance was observed in cluster VI
(68.04) followed by cluster III (63.09) and
cluster I (59.48) portraying less genetic
variability within the group making selection
ineffective (Sreelakshmi and Shivani, 2015).
The higher inter-cluster distance was
observed between cluster III and IX (66.93)
followed by cluster III and VIII (64.86) and in
cluster VI and VIII(64.06) suggesting wider
genetic diversity (Table 2, Fig:1). The
genotypes in these clusters can be utilized as
potential parents and crossing between these
genotypes would result in high heterotic
expression for yield attributes, physiological
and quality traits.
Thus deployment of genotypes from the
above clusters in hybridization programme
would reapnovel segregants (Dhubey et al.,
2018). On the contrary, cluster IV and VIII
(52.25) followed by cluster IV and VII
(55.76) and cluster V and VII (56.44) showed
the least inter-cluster distance, signifying a
close relationship between the genotypes.
Selection of such genotypes results in
unproductive breeding. Similar reports were
observed by Thombre et al., (2000),
Sreelakshmi and Shivani (2015) and Ramya
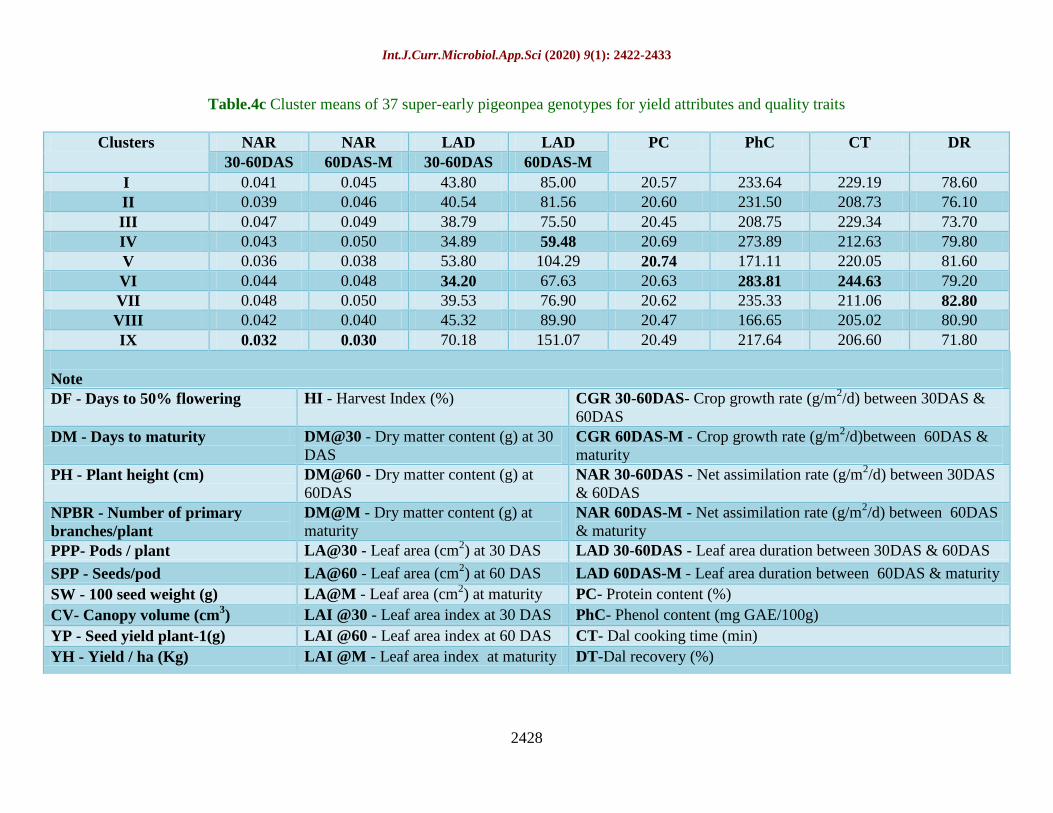
et al., (2018). Cluster means for yield, yield
attributes, physiological and quality traits are
given in Table 4a, b and c respectively.
A significant amount of variation among the
cluster means for traits under study was also
portrayed in the present study. Cluster IX
revealed highest cluster mean for days to 50%
flowering, days to maturity, plant height,
canopy volume, yield hectare-1
, dry mater
content, leaf area and leaf area index at
30DAS, 60 DAS and at maturity, crop growth
rate and leaf area duration between (30DAS-
60 DAS) and (60 DAS- Maturity). Cluster I
testified highest cluster mean for number of
primary branches plant-1
, seeds pod-1
,seed
yield plant-1
and harvest index respectively.
Cluster II topped for 100 seed weight whereas
cluster VII crowned for net assimilation rate
between (30DAS-60 DAS) and (60 DAS-
maturity) and dal recovery. Cluster V and VI
reported highest mean for protien and phenol
content respectively (Table 4c).Trait wise
coherent selection of genotypes from above
clusters, yields desirable improvement in
novel super-early pigeonpea. These findings
are in agreement with Sreelakshmi and
Shivani (2015), Patel et al., (2018), Rajamani
et al., (2014) and Kumara et al., (2013).
Among 30 traits under study, the highest
contribution towards genetic diversity was by
leaf area index at 60 DAS (26.71%) followed
by leaf area (17.02) and leaf area index
(12.71) at maturity. Least contribution was
from protein content and dal recovery
(0%).Figure 2, illustrates the contribution of
each trait towards diversity.

Int.J.Curr.Microbiol.App.Sci (2020) 9(1): 2422-2433
2425
Table.1 Analysis of Variance for yield, yield attributes and quality traits in 37 super-early
pigeonpea genotypes
Sl.No Traits Mean sum of squares
Replication
(1)
Genotypes
(36)
Error
(36)
1 Days to 50% flowering 2.61 10.44** 0.83
2 Days to maturity 1.68 13.69** 3.05
3 Plant height (cm) 0.01 857.62** 4.63
4 Number of primary branches plant-1
2.30 0.83** 0.45
5 Pods plant-1
0.41 86.67** 8.00
6 Seeds pod-1
0.16 0.02** 0.00
7 100 seed weight (g) 0.47 0.28** 0.01
8 Canopy volume (cm3) 0.04 211510** 954.27
9 Seed yield plant-1
(g) 2.29 4.45** 0.53
10 Yield ha-1
(Kg) 2.37 140687** 46302.00
11 Harvest Index (%) 0.04 50.76** 4.30
12 Dry matter content (g) at 30 DAS 0.81 13.9** 0.39
13 Dry matter content (g) at 60 DAS 1.19 50.31** 1.40
14 Dry matter content (g) at maturity 2.27 200.06** 4.08
15 Leaf area (cm2) at 30 DAS 1.77 4458.05** 6.90
16 Leaf area (cm2) at 60 DAS 1.40 43076** 18.64
17 Leaf area (cm2) at maturity 0.55 42761** 21.07
18 Leaf area index at 30 DAS 0.78 0.04** 0.00
19 Leaf area index at 60 DAS 1.36 0.46** 0.00
20 Leaf area index at maturity 0.47 0.46** 0.00
21 Crop growth rate (gm-2
d-1
) between 30
DAS & 60 DAS
0.51 15.85** 1.09
22 Crop growth rate (gm-2
d-1
) between 60
DAS & maturity
3.50 26.799** 1.96
23 Net assimilation rate (gm-2
d-1
) between
30 DAS & 60 DAS
0.74 0.0001581** 0.00
24 Net assimilation rate (gm-2
d-1
) between
60 DAS & maturity
1.21 0.000268** 0.00
25 Leaf area duration between 30 DAS &
60 DAS
1.80 184.14** 0.10
26 Leaf area duration between 60 DAS &
maturity
2.86 1135.11** 8.21
27 Protein content (%) 16.98 0.15* 1.13
28 Phenol content (mg GAE100g-1
) 2.08 2580.88** 783.63
29 Dal cooking time (min) 70.09 527.69** 0.29
30 Dal recovery (%) 2.91 40.22** 1.50
Note:* and **Significant at 0.05, 0.01levels of probability.
Int.J.Curr.Microbiol.App.Sci (2020) 9(1): 2422-2433
2426
Table.2 Classification of 37 super-early genotypes into nine different clusters based on D2
analysis
Table.3 Average intra and inter cluster distances (D2
values) for nine clusters of super-early
pigeonpea genotypes
Cluster I II III IV V VI VII VIII IX
I 59.48 59.82 61.76 59.6 57.83 61.39 59.43 57.57 61.61
II . 59.13 60.19 58.98 59.03 61.37 60.35 57.24 59.15
III . . 63.09 60.17 62.25 62.40 61.65 64.86 66.93
IV . . . 58.75 59.78 60.85 55.76 52.25 60.52
V . . . . 58.93 61.41 56.44 60.56 58.29
VI . . . . . 68.04 58.75 64.06 63.55
VII . . . . . . 54.33 62.49 57.94
VIII . . . . . . . 0.00 56.72
IX . . . . . . . . 0.00
Clusters Genotypes No of genotypes
I ICPL 11242, ICPL 11255, ICPL 11256, ICPL 11300, ICPL 11318, ICPL 11326,
ICPL 20328, ICPL 20337, ICPL 20340, MN1
10
II ICPL 11244, ICPL 11249, ICPL 11253, ICPL 11285, ICPL 11301, ICPL 11303,
ICPL 20325, ICPL 20329, ICPL 20336, ICPL 20338
10
III ICPL 11245, ICPL 11298, ICPL 20326, ICPL 20335 4
IV ICPL 11252, ICPL 11263, ICPL 11276, ICPL 20341 4
V ICPL 11273, ICPL 20333 2
VI ICPL 11259, ICPL 11279, ICPL 11296 3
VII ICPL 11292, MN5 2
VIII ICPL 11324 1
IX ICPL 20327 1
Total 37

Int.J.Curr.Microbiol.App.Sci (2020) 9(1): 2422-2433
2427
Table.4a Cluster means of 37 super-early pigeonpea genotypes for eight quantitative traits
Clusters DF DM PH NPB PPP SPP SW CV YP YH HI
I 50.00 82.00 90.00 10.20 45.00 3.82 7.60 1431.00 14.80 1733.98 28.70
II 51.00 82.00 91.00 9.10 44.00 3.79 8.00 1492.10 13.90 1528.10 26.30
III 52.00 83.00 112.00 9.40 55.00 3.82 7.30 1706.70 14.40 1648.21 26.00
IV 47.00 79.00 58.00 8.80 31.00 3.63 7.50 910.90 12.20 1732.57 25.80
V 49.00 82.00 78.00 8.40 44.00 3.75 7.90 1251.20 14.00 1640.61 27.30
VI 52.00 84.00 87.00 8.70 37.00 3.78 7.40 1360.90 14.10 1473.85 28.40
VII 52.00 83.00 114.00 9.10 55.00 3.70 7.80 1867.40 14.50 1758.64 23.20
VIII 51.00 84.00 114.00 8.20 54.00 3.47 7.40 1745.80 13.30 1564.95 20.30
IX 54.00 84.00 129.00 7.80 44.00 3.66 7.30 1974.60 13.30 1943.28 17.80
Table.4b Cluster means of 37 super-early pigeonpea genotypes for yield attributes
Clusters DM DM DM LA LA LA LAI LAI LAI CGR CGR
@30 @ 60 @ M @30 @ 60 @ M @30 @ 60 @ M 30-60DAS 60DAS-M
I 12.62 26.64 56.56 220.63 664.17 545.14 0.73 2.19 1.80 15.41 23.49
II 11.71 24.37 53.39 204.07 615.01 495.94 0.67 2.03 1.64 13.96 22.29
III 13.79 28.59 61.15 195.19 588.39 468.75 0.64 1.94 1.55 16.24 24.98
IV 8.07 20.33 46.88 176.33 528.45 410.95 0.58 1.74 1.36 13.50 23.25
V 9.66 23.31 51.32 271.48 815.31 697.80 0.89 2.69 2.30 14.99 23.19
VI 12.64 25.19 54.55 172.10 518.76 399.93 0.57 1.71 1.32 13.85 22.23
VII 14.42 29.87 63.74 194.17 604.38 464.42 0.64 1.99 1.53 16.93 25.69
VIII 15.01 31.03 66.05 227.64 687.89 564.89 0.75 2.27 1.87 17.55 26.51
IX 17.42 35.91 75.85 327.76 1090.10 970.59 1.08 3.60 3.20 20.19 29.46
Int.J.Curr.Microbiol.App.Sci (2020) 9(1): 2422-2433
2428
Table.4c Cluster means of 37 super-early pigeonpea genotypes for yield attributes and quality traits
Clusters NAR NAR LAD LAD PC PhC CT DR
30-60DAS 60DAS-M 30-60DAS 60DAS-M
I 0.041 0.045 43.80 85.00 20.57 233.64 229.19 78.60
II 0.039 0.046 40.54 81.56 20.60 231.50 208.73 76.10
III 0.047 0.049 38.79 75.50 20.45 208.75 229.34 73.70
IV 0.043 0.050 34.89 59.48 20.69 273.89 212.63 79.80
V 0.036 0.038 53.80 104.29 20.74 171.11 220.05 81.60
VI 0.044 0.048 34.20 67.63 20.63 283.81 244.63 79.20
VII 0.048 0.050 39.53 76.90 20.62 235.33 211.06 82.80
VIII 0.042 0.040 45.32 89.90 20.47 166.65 205.02 80.90
IX 0.032 0.030 70.18 151.07 20.49 217.64 206.60 71.80
Note
DF - Days to 50% flowering HI - Harvest Index (%) CGR 30-60DAS- Crop growth rate (g/m2/d) between 30DAS &
60DAS
DM - Days to maturity DM@30 - Dry matter content (g) at 30
DAS
CGR 60DAS-M - Crop growth rate (g/m2/d)between 60DAS &
maturity
PH - Plant height (cm) DM@60 - Dry matter content (g) at
60DAS
NAR 30-60DAS - Net assimilation rate (g/m2/d) between 30DAS
& 60DAS
NPBR - Number of primary
branches/plant
DM@M - Dry matter content (g) at
maturity
NAR 60DAS-M - Net assimilation rate (g/m2/d) between 60DAS
& maturity
PPP- Pods / plant LA@30 - Leaf area (cm2) at 30 DAS LAD 30-60DAS - Leaf area duration between 30DAS & 60DAS
SPP - Seeds/pod LA@60 - Leaf area (cm2) at 60 DAS LAD 60DAS-M - Leaf area duration between 60DAS & maturity
SW - 100 seed weight (g) LA@M - Leaf area (cm2) at maturity PC- Protein content (%)
CV- Canopy volume (cm3) LAI @30 - Leaf area index at 30 DAS PhC- Phenol content (mg GAE/100g)
YP - Seed yield plant-1(g) LAI @60 - Leaf area index at 60 DAS CT- Dal cooking time (min)
YH - Yield / ha (Kg) LAI @M - Leaf area index at maturity DT-Dal recovery (%)

Int.J.Curr.Microbiol.App.Sci (2020) 9(1): 2422-2433
2429
Figure.1 Dendrogram on clustering of super-early genotypes

Int.J.Curr.Microbiol.App.Sci (2020) 9(1): 2422-2433
2430
26.71
17.02
12.71
9.83 8.66
6.04 5.57
3.15 3.13 1.80 1.55 1.23 0.85 0.52 0.19 0.18 0.14 0.14 0.13 0.12 0.10 0.07 0.05 0.05 0.02 0.01 0.01 0.01 0.00 0.00
0.00
5.00
10.00
15.00
20.00
25.00
30.00
Proportion(%)
Figure.2 Percent contribution of different characters towards genetic divergence in super-early pigeonpea genotypes
Int.J.Curr.Microbiol.App.Sci (2020) 9(1): 2422-2433
2431
The traits with maximum contribution
towards divergence should also be considered
for selection of genotype in hybridization
program for genetic improvement of
pigeonpea. Sreelakshmi & Shivani (2015)
reported days to 50% flowering, pods plant-
1and plant height contributing more to
diversity whereas Patel et al., (2018)
summarized plant height, days to 50%
flowering, days to maturity and number of
pods plant-1
as traits owing to genetic
diversity.
Genetic diversity studies in super-early
genotypes of pigeonpea aid the planning of
crosses to exploit higher heterosis. The 37
super-early pigeonpea genotypes in the
present study were classified into nine
distinctive clusters.Cluster III and IX (66.93)
followed bycluster III and VIII (64.86) and
cluster VI and VIII (64.06) depicted higher
inter-cluster distance affirming wider
divergence.
Choice of genotypes from these clusters as
potential parents in crop improvement would
result in heterotic offsprings. Leaf area index
at 60 DAS (26.71%) followed by leaf area
(17.02) and leaf area index (12.71) at maturity
contributed maximum to the diversity
accentuating the role of physiological trait in
addition to yield traits in pigeonpea
improvement.
Ackowledgements
It is to acknowledge and heart-fully thank
Department of Science and Technology,
Government of India, for funding my Ph.D.
research by the INSPIRE fellowship
programme. The services rendered by Jyothi
and Rajesh, field technicians, Pigeonpea
Breeding, ICRISAT in field operations are
greatly acknowledged.
References
Akinoso, R. and Oladeji, O. D. 2017.
Determination of energy and time
requirement for cooking pigeonpea
(Cajanus cajan). Journal of Biosystems
Engineering.42(1): 56–61.
Dubey, N., Avinashe, A. H. and Srivastava,
A.N. 2018.Evaluation of genetic
diversity among soybean [Glycine max
(l.)] genotypes using multivariate
analysis. Plant Archives.18(1):908-912
FAOSTAT. 2019. Retrieved
fromhttp://www.fao.org/faostat/en/#data
/QC.
Hingane, A.J., Kute, N. S., Singh, I., Kumar,
N., Singh, S. J., Raje, R. S., Singh, I. P.,
Belliappa, S. H., Sadayappan, R. M,
Rathore, A. R and Kumar, C. V. S.
2018.Prospects of Super-early
Pigeonpea in the Pigeonpea Workshop
at International Food Legumes Research
Conference VII (IFLRC-VII) held at
Marrakesh during 5-9 May, 2018.
Hunt, R 1978. Demography vs Plant growth
analysis, New Phytologist, Edward
Arnold, London. 8(1), 269-272.
Kumara, B. N., Santoshagowda, G. B.,
Nishanth, G. K. and Dharmaraj, P. S.
2013. Genetic diversity, variability and
correlation studies in advanced
genotypes of Pigeonpea [Cajanus cajan
( L .) Millsp .]. Acta Biologica Indica.
2(2): 406–411.
Mula, M. G. and Saxena, K. B. 2010.Lifting
the level of awareness on pigeonpea- A
global perspective. International Crops
Research Institute for semi-arid tropics,
540. ISBN: 978-92-9066-55-9.
Nadarajan, N., Manivannan, N and
Gunasekaran, M. 2016. Quantitative
genetics and biometrical techniques in
plant Breeding. 75-80. ISBN: 978-9-
272-5827-1.
Pandey, V. R., Tiwari, D. K., Yadav, S. K.
and Pandey, P. 2015. Studies on direct
selection parameters for seed yield and
its components traits in pigeonpea
(Cajanus cajan (L.) Millsp.). African
Int.J.Curr.Microbiol.App.Sci (2020) 9(1): 2422-2433
2432
Journal of Agricultural Research. 10(6),
485-490.
Patel, H. N., Patel, A. M. and Patel, J. M.
2018. Genetic divergence study through
D2 analysis in pigeonpea (Cajanus
cajan L . Millspaugh ).International
journal of chemical studies.6(5):1947–
1950.
Radford, P. J. (1967). Growth analysis
formulae. Their use and abuse. Crop
Sciences. 7: 171-175.
Rajamani, S., Sreekanth, M., Rao, Y. K. 2014.
Genetic diversity studies for yield and
yield attributing traits in pigeonpea
[Cajanus cajan (L.) Millsp.]. Journal of
Research ANGRAU.42: 21–26.
Ramya, K. R., Magudeeswari, P.,
Vanniyarajan, C., Gowthami, R., Indhu,
S. M. and Monisha, K. 2018. Genetic
divergence among pigeonpea genotypes
using mahalonobis D2 statistics.
International Journal of Current
Microbiology and Applied
Sciences.7(06): 510–514.
Ranjani, M. S., Vanniarajan, C. Kumar, C. V.
S., Saxena, R. K., Sudhagar, R. and
Hingane, A. J. 2018. Genetic variability
and association studies for yield and its
attributes in super-early pigeonpea (
Cajanus cajan (l.) Millsp.) genotypes.
Electronic Journal of Plant
Breeding.9(2): 682-691.
Rao, C. R. 1952. Advanced statistical
methods in biometrical research. John
Wiley and Sons,Inc. New York.
Rodríguez, S. B., Urrutia, V. M. M., Robles-
gonzález, M. M. and Timothy, W. 2008.
Performance of various grapefruit
(Citrus paradisiMacf .) and pummelo
(C . maximaMerr.) cultivars under the
dry tropic conditions of Mexico.
Euphytica.164: 27–36.
Sahrawat, K. L., Ravi Kumar, G. and Murthy,
K. V. 2002. Sulfuric acid-Selenium
digestion for multi-element analysis in a
single plant digests. Communications in
Soil Science and Plant Analysis.33:
3757–3765.
Sawargaonkar, S. L. 2010. Study of heterosis,
combining ability, stability and quality
parameters in CGMSbased pigeonpea
[Cajanus cajan (L.) Millsp.] hybrids.
Thesis, Marathwada Agricultural
University, Parbhani. 56-57.
Sethi, S., Samuel, D. V. K., Khan, I. 2014.
Development and quality evaluation of
quick-cooking dhal - A convenience
product. Journal of Food Science and
Technology.51:595–600.
Shinde, Y. H., V, A., Joshi, J. B. and Pandit,
A. B. 2017. Kinetics of cooking of
unsoaked and presoaked split peas (
Cajanus cajan ). Journal of Food
Process Engineering. 1–7.
Singh, U., Jain, R. C., Jambunathan, R. J. and
Faris, P. G. 1984. Nutritive value of
vegetable pigeonpea, mineral trace
elements, Journal of Food Science. 49:
645.
Singleton, V.L. and Rossi, J.A. (1965).
Colorimetry of total phenolics with
phosphomolybdic- phospho-tungstic
acid reagents. American Journal of
Enology and Viticulture. 16: 144-158.
Sreelakshmi, C and Shivani, D. 2015.
Germplasm evalution in pigeonpea ,
Cajanus cajan MILLSP . Using
Mahalanobis D2 statistics. Journal of
Global Biosciences. 4(7): 2828–2832.
Thombre, B. B., Aher, R.P. and Dahat, D.V.
2000. Genetic divergence in Pigeonpea
[Cajanus cajan (L.) Millsp.].Indian
journal of Agricultural Research. 34:
126-129.
Wallis E. S., Byth D. E. and Saxena K. B.
1981. Flowering responses of thirty-
seven early maturing lines of pigeonpea.
In: Nene Y. L, Kumble V. (ed)
Proceedings of the international
workshop on pigeonpea, International
Crops Research Institute for the Semi-
arid Tropics (ICRISAT), Patancheru.2:

Int.J.Curr.Microbiol.App.Sci (2020) 9(1): 2422-2433
2433
143–159.
Watson, D. J. 1952. The physiological basis
of variation in yield. Advances in
Agronomy.4: 101-145.
Williams, R. F. 1946. The physiology of plant
growth with special reference to the
concept of net assimilation rate. Annals
of Botany.10: 41-72.
How to cite this article:
Shruthi, H.B., A.J. Hingane, M. Reddi Sekhar, C.V. Sameer Kumar, L. Prashanthi, B .V.
Bhaskar Reddy, P. Sudhakar, J. Srivarsha, T.M. Bhosle, Anil Kumar. V and Rathore. A. 2020.
Genetic Divergence for Yield, Physiological and Quality Traits in Super-Early Pigeonpea
(Cajanus cajan. (L.) Millsp.). Int.J.Curr.Microbiol.App.Sci. 9(01): 2422-2433.
doi: https://doi.org/10.20546/ijcmas.2020.901.276