genetic algorithms and vascular graft...
TRANSCRIPT
EngOpt 2012 – 3rd International Conference on Engineering Optimization Rio de Janeiro, Brazil, 01 - 05 July 2012.
Genetic Algorithms and Vascular Graft Optimization
Catarina F. Castro, Carlos C. António, Luísa C. Sousa
IDMEC, Faculdade de Engenharia, Universidade do Porto Rua Dr. Roberto Frias s/n, 4200-465 PORTO, Portugal
Email: [email protected] 1. Abstract The optimization of graft and anastomotic configurations with regard to blood dynamics is the major target of this study. A developed multi-objective genetic algorithm is considered in order to reach optimal graft geometries for idealized arterial bypass systems of fully occluded host arteries. An artificial neural network simulating hemodynamic specific conditions is introduced in order to reduce the genetic algorithm computational time. Input data values are constrained within pre-defined boundaries for graft geometric parameters and the correspondent target values are solutions for blood velocity and shear stress functions calculated with a finite element simulator. Optimal solutions are within a family of design points reached at the end of the optimization process. 2. Keywords: Shape optimization, Genetic algorithms, Artificial neural networks, Medical engineering 3. Introduction In the cardiovascular system development of atherosclerosis disease is mainly observed in regions of transient flow reversal, typically near bifurcations and along curved vessels [1, 2]. Vessel stenosis disease is due to thickening of the tunica intima caused by the development of intimal hyperplasia, a response of the vessel to wall injury. In order to overcome severe vessel stenosis a surgical intervention using bypass grafts is usually considered. Researchers have developed artificial graft tissue by combining man-made materials with human cells to make it elastic and durable and so it can be attached to host tissue. The geometry configuration of vascular bypass grafts has profound influence on flow patterns, pressure distribution and shear stress which are correlated with occlusion pathogenesis [3]. Several studies have proven that the development of intimal hyperplasia in bypasses is a consequence of physiological response to abnormal conditions of local hemodynamics leading to poor performance and failure of the surgery [4, 5]. So, improving blood flow dynamics in the artery/graft system is an important element for long-term success of bypass surgeries.
Computational approaches have been used simulating blood flow through idealized bypass models. They exhibit particular patterns characterized by the presence of recirculation zones and secondary flows in certain regions [6-8]. The optimization of graft and anastomotic configurations with regard to fluid dynamics is the major target of this study. The problem is related with both optimal shape design and flow control that are involved in the simulation of the bypass system with cost functions associated to quantities such as vorticity or wall shear stress.
A developed multi-objective genetic algorithm is considered in order to reach optimal graft geometries for idealized arterial bypass systems of fully occluded host arteries [6, 9-10]. Genetic Algorithms are based on Darwin’s theory of survival of the fittest [10-13]. Once an initial population is created, new populations are generated following the previous one according to principles of reproduction, mutation and “survival of the fittest”. Then the method follows a sequence of generations, where the best design points in the population are considered to be the most fitted ones and being allowed to survive and reproduce. The considered genetic algorithm (GA) supported by an elitist strategy seeks to increase fitness as it operates [6, 10]. Ultimately, the method identifies optimal solutions as a family of design points that are non-dominated till the end of a predefined number of generations.
Genetic algorithms require a large number of computer simulations. So, an artificial neural network (ANN) is developed to efficiently simulate blood flow for specific graft geometries. Input, hidden and output layers model the topology of the ANN. The weights of the synapses and the biases for hidden and output nodes are used as design variables in the ANN learning process. Considering a set of input and target data, the mean relative error between target and output results is used to monitor the learning process obtaining the completeness of the modeling. Input and target data have been acquired using a finite element simulator previously developed and tested [6, 9-10] considering fully unsteady incompressible Navier-Stokes equations and a three-dimensional geometry.
Numerical results show the benefits of numerical shape optimization in achieving design improvements before a bypass surgery, minimizing blood recirculation zones as well as low-velocity zones at the toe and heel of the distal anastomosis leading to minimization of the development of anastomotic intimal hyperplasia. 4. Graft Geometry
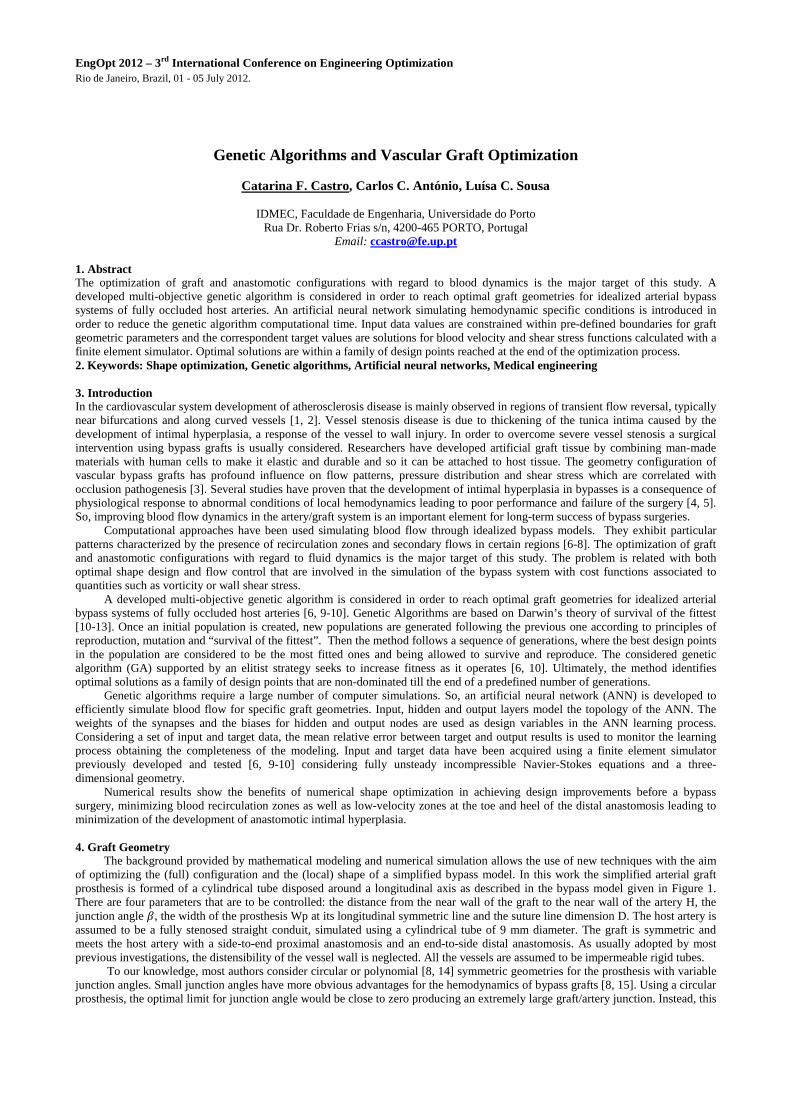
The background provided by mathematical modeling and numerical simulation allows the use of new techniques with the aim of optimizing the (full) configuration and the (local) shape of a simplified bypass model. In this work the simplified arterial graft prosthesis is formed of a cylindrical tube disposed around a longitudinal axis as described in the bypass model given in Figure 1. There are four parameters that are to be controlled: the distance from the near wall of the graft to the near wall of the artery H, the junction angle �, the width of the prosthesis Wp at its longitudinal symmetric line and the suture line dimension D. The host artery is assumed to be a fully stenosed straight conduit, simulated using a cylindrical tube of 9 mm diameter. The graft is symmetric and meets the host artery with a side-to-end proximal anastomosis and an end-to-side distal anastomosis. As usually adopted by most previous investigations, the distensibility of the vessel wall is neglected. All the vessels are assumed to be impermeable rigid tubes.
To our knowledge, most authors consider circular or polynomial [8, 14] symmetric geometries for the prosthesis with variable junction angles. Small junction angles have more obvious advantages for the hemodynamics of bypass grafts [8, 15]. Using a circular prosthesis, the optimal limit for junction angle would be close to zero producing an extremely large graft/artery junction. Instead, this
investigation will address sinusoidal geometries graft with walls being drawn by sine curves.
Figure 1. Anastomotic configuration and nomenclature of the geometric model two paragraphs
5. Bypass Hemodynamics When an artery is affected by a stenosis, a bypass surgery allows restore the required blood flow. Mathematical modeling and numerical simulation of physiological flows allow a better understanding of phenomena involved in artery diseases. Improvement in the understanding of the genesis of diseases is very important as it allows the reduction of surgical and post-surgical failures. It may also suggest new means in bypass surgical procedures as well as with less invasive methods to devise new shapes in bypass configuration [16].
The background provided by mathematical modeling and numerical simulation of blood flow has led to the application of numerical techniques for the optimization of the (full) configuration and the (local) shape of a simplified bypass model. In support to this aim at macro-geometrical level, efficient schemes are being used to provide useful and quick indications (outputs) in a repetitive design environment as shape design requires. A study of important geometrical quantities in bypass can be obtained using a finite element methodology (FEM) and a previously developed and tested simulator is considered [9]. Blood flow is pulsatile by nature. Blood can be considered as incompressible and the non-Newtonian rheology is accounted for through the Casson non-Newtonian model [17]. The hemodynamics problem is considered laminar since the anastomotic flow typically reaches a maximum Reynolds number less than 1000. The governing equations for this problem are the Navier–Stokes set equations that consist of the continuity and the momentum equations. The dynamic viscosity varies spatially due to its dependence on the shear rate. The non-linear expression for the viscosity is given by the Casson law [17]. The arterial wall is assumed to be rigid, a pulsatile waveform is prescribed at the inlet and a no-slip condition (zero velocity) is prescribed at the walls. At the artery inlet, the velocity profile is assumed parabolic. Details on the mathematical formulation and finite element approximation are given in Sousa et al. [9].
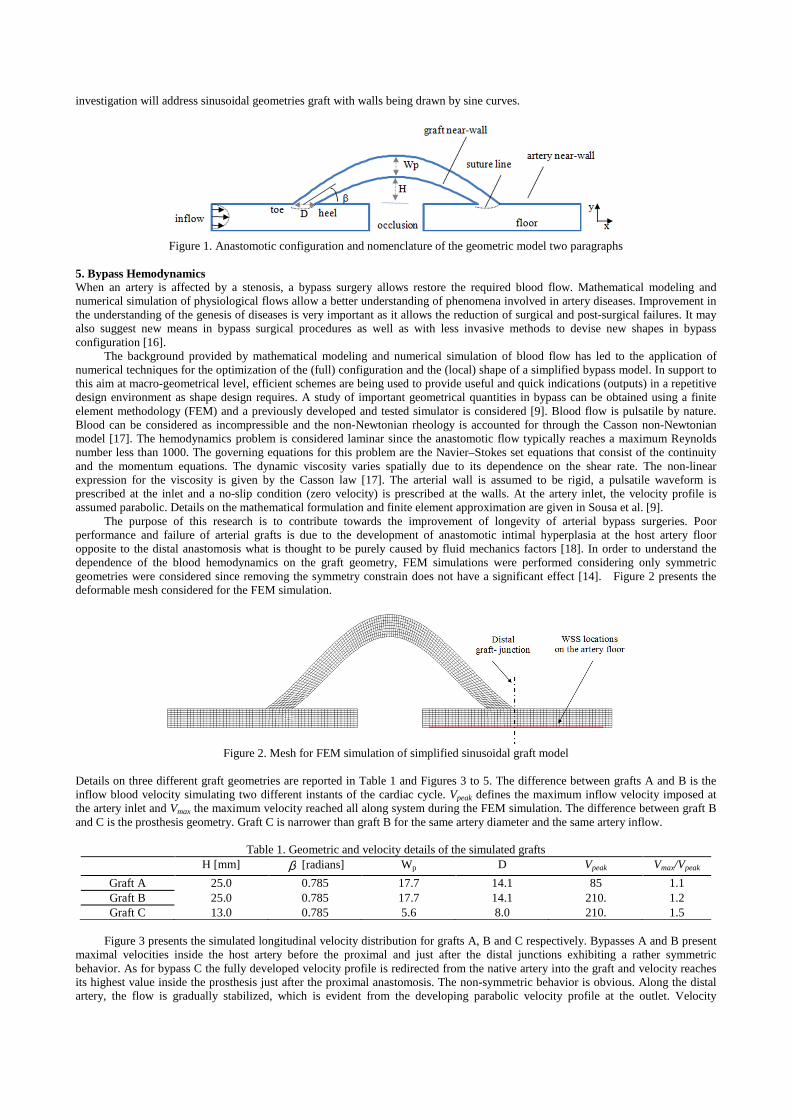
The purpose of this research is to contribute towards the improvement of longevity of arterial bypass surgeries. Poor performance and failure of arterial grafts is due to the development of anastomotic intimal hyperplasia at the host artery floor opposite to the distal anastomosis what is thought to be purely caused by fluid mechanics factors [18]. In order to understand the dependence of the blood hemodynamics on the graft geometry, FEM simulations were performed considering only symmetric geometries were considered since removing the symmetry constrain does not have a significant effect [14]. Figure 2 presents the deformable mesh considered for the FEM simulation.
Figure 2. Mesh for FEM simulation of simplified sinusoidal graft model
Details on three different graft geometries are reported in Table 1 and Figures 3 to 5. The difference between grafts A and B is the inflow blood velocity simulating two different instants of the cardiac cycle. Vpeak defines the maximum inflow velocity imposed at the artery inlet and Vmax the maximum velocity reached all along system during the FEM simulation. The difference between graft B and C is the prosthesis geometry. Graft C is narrower than graft B for the same artery diameter and the same artery inflow.
Table 1. Geometric and velocity details of the simulated grafts H [mm] β [radians] Wp D Vpeak Vmax/Vpeak
Graft A 25.0 0.785 17.7 14.1 85 1.1 Graft B 25.0 0.785 17.7 14.1 210. 1.2 Graft C 13.0 0.785 5.6 8.0 210. 1.5
Figure 3 presents the simulated longitudinal velocity distribution for grafts A, B and C respectively. Bypasses A and B present
maximal velocities inside the host artery before the proximal and just after the distal junctions exhibiting a rather symmetric behavior. As for bypass C the fully developed velocity profile is redirected from the native artery into the graft and velocity reaches its highest value inside the prosthesis just after the proximal anastomosis. The non-symmetric behavior is obvious. Along the distal artery, the flow is gradually stabilized, which is evident from the developing parabolic velocity profile at the outlet. Velocity
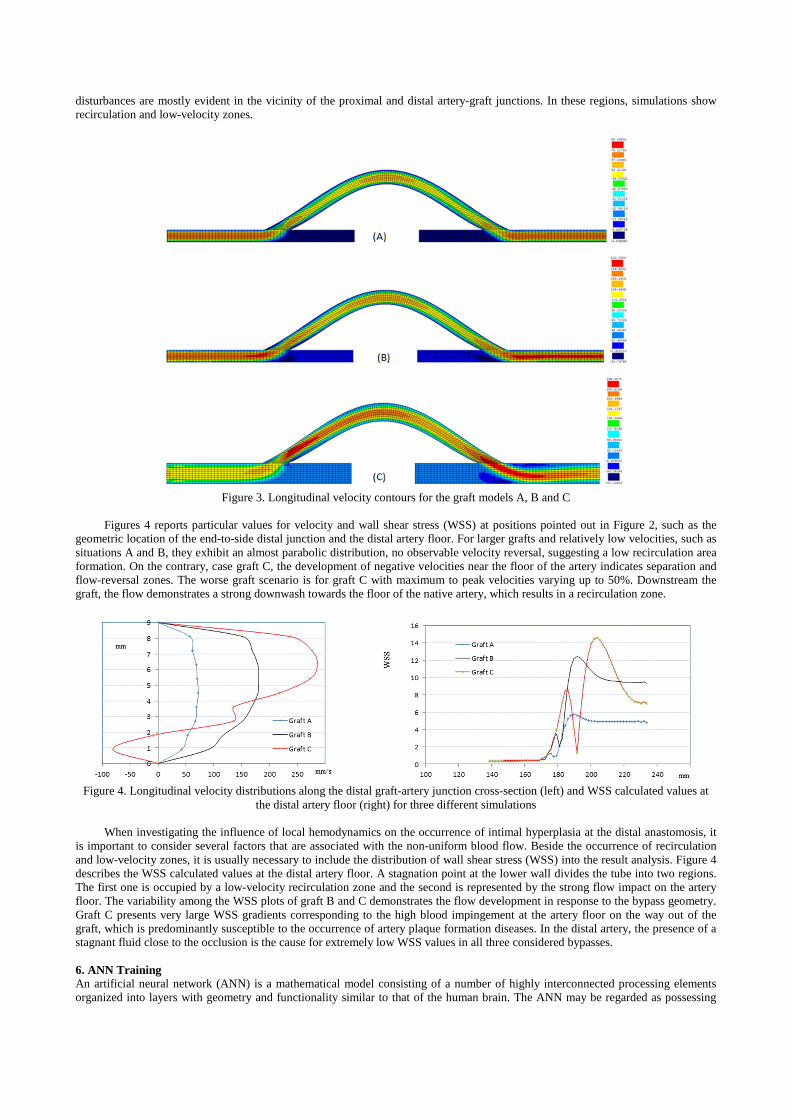
disturbances are mostly evident in the vicinity of the proximal and distal artery-graft junctions. In these regions, simulations show recirculation and low-velocity zones.
Figure 3. Longitudinal velocity contours for the graft models A, B and C
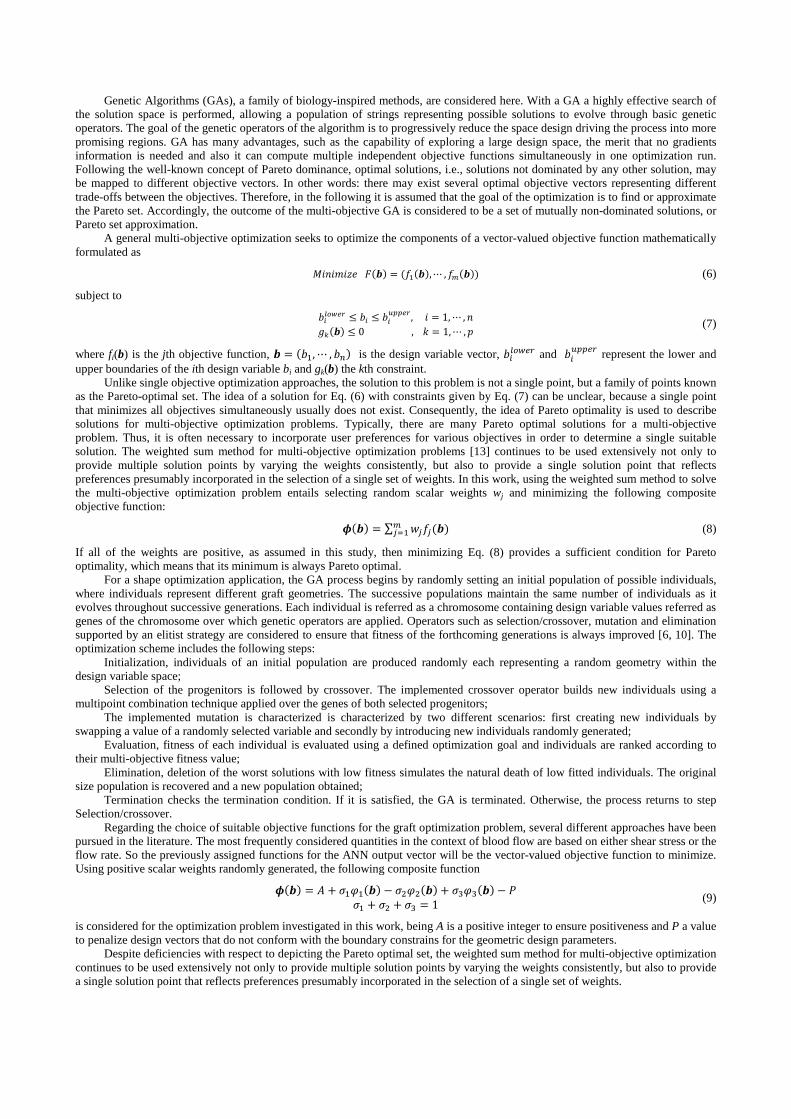
Figures 4 reports particular values for velocity and wall shear stress (WSS) at positions pointed out in Figure 2, such as the
geometric location of the end-to-side distal junction and the distal artery floor. For larger grafts and relatively low velocities, such as situations A and B, they exhibit an almost parabolic distribution, no observable velocity reversal, suggesting a low recirculation area formation. On the contrary, case graft C, the development of negative velocities near the floor of the artery indicates separation and flow-reversal zones. The worse graft scenario is for graft C with maximum to peak velocities varying up to 50%. Downstream the graft, the flow demonstrates a strong downwash towards the floor of the native artery, which results in a recirculation zone.
Figure 4. Longitudinal velocity distributions along the distal graft-artery junction cross-section (left) and WSS calculated values at
the distal artery floor (right) for three different simulations
When investigating the influence of local hemodynamics on the occurrence of intimal hyperplasia at the distal anastomosis, it is important to consider several factors that are associated with the non-uniform blood flow. Beside the occurrence of recirculation and low-velocity zones, it is usually necessary to include the distribution of wall shear stress (WSS) into the result analysis. Figure 4 describes the WSS calculated values at the distal artery floor. A stagnation point at the lower wall divides the tube into two regions. The first one is occupied by a low-velocity recirculation zone and the second is represented by the strong flow impact on the artery floor. The variability among the WSS plots of graft B and C demonstrates the flow development in response to the bypass geometry. Graft C presents very large WSS gradients corresponding to the high blood impingement at the artery floor on the way out of the graft, which is predominantly susceptible to the occurrence of artery plaque formation diseases. In the distal artery, the presence of a stagnant fluid close to the occlusion is the cause for extremely low WSS values in all three considered bypasses. 6. ANN Training An artificial neural network (ANN) is a mathematical model consisting of a number of highly interconnected processing elements organized into layers with geometry and functionality similar to that of the human brain. The ANN may be regarded as possessing

learning capabilities and making it available for later use [19-22]. By virtue of its parallel distribution, an ANN is generally robust, tolerant of faults and noise, able to generalize well and capable of solving nonlinear problems. During supervised learning, the ANN is trained on input and target vectors with which it is required to associate an acquired knowledge; thus, with sufficient training, the ANN should be able to perform correctly with previously unseen input vectors.
This project performs an ANN analysis using MATLAB with the Neural Network Application Toolbox (The MathWorks Inc., Natick, MA, USA). The multilayer feed-forward neural network of the software is well suited for function fitting problems. Before beginning the network design process, a sample data set needs to be collected and prepared. Since, it is generally difficult to incorporate prior knowledge into a neural network it can only be as accurate as the used data to train the network. It is important that the data cover the range of inputs for which the network will be used. Multilayer networks can be trained to generalize well within the range of inputs for which they have been trained and it is important that the training data span the full range of the input space. Future developments will consider the uniform design methodology. In the project reported here, a set of 500 input and target vectors has been collected using the FEM simulator [9] within the design space of the four parameters given as follows:
10 ≤ � ≤ 40��
0.15 ≤ � ≤ 0.785 ������
8 ≤ �� ≤ 14��
10 ≤ � ≤ 20��
(1)
This was achieved by randomly generating input vectors from the design space established in Eq. set (1) and running the FEM simulator [9] obtaining the associated target vectors. For the study presented here the simulation was performed using always the same boundary conditions prescribed at the inlet, a parabolic velocity profile of maximum velocity 210 mm/s. Blood flow is considered steady, since the purpose of this study is only to analyze the geometry influence on the flow uniformity inside the bypass model.
Each input vector b has four geometric components � = (�, �,��, �) as defined in Figure 1. Among the simulated results given by the FEM simulator, three functional values qualifying and quantifying the graft local hemodynamics were considered. Each output target vector � = (��, ��, � ) has been defined with the following components:
��(�) = ∑ ‖�##‖�$%
� (2)
where &' is the number of finite element mesh nodes at the floor of the distal artery-graft junction and WSS is the smoothed wall shear stress values given by simulation at the corresponding nodes. The other two components of the output vector are associated with domains of reversed flows. Whenever negative longitudinal velocities are detected in a significant area individual critical domains are assigned contributing to
��(�) = ∑ ()*+∗(�) (3)
being () the elementary longitudinal velocity obtained by using the FEM simulator and Ω.∗(�) is the reunion of every critical domain
of the entire graft artery system. The third component is associated with the particular cross-section Ω/01∗ (�) of the distal graft-artery
junction:
� (�) = ∑ ()2
*345∗ (�) (4)
For the same inlet velocity profile, values of this function � (�)will be larger for disturbed longitudinal velocity distributions along the distal graft-artery junction Ω/01
∗ (�) and smaller for smooth and parabolic distributions as easily seen by comparing results for grafts B and C shown in Figure 4.
After the data have been collected, there are two steps that need to be performed before the data are used to train the network, the data need to be preprocessed, and they need to be divided into subsets. A normalization step has been applied to both the input vectors and target vectors of the data set. When training multilayer networks, the general practice is to divide the data into three subsets for training, testing and validation. The considered ratios for training, testing and validation are 0.7, 0.15 and 0.15, respectively. All subsets have been randomly selected within the 500 FEM simulations. The first subset is the training set, which is used for computing the gradient and updating the network weights and biases. The second subset is the validation set. The error on the validation set is monitored during the training process. The validation error normally decreases during the initial phase of training, as does the training set error. However, when the network begins to over-fit the data, the error on the validation set typically begins to rise. The network weights and biases are saved at the minimum of the validation set error.
The feedforwardnet MATLAB call creates a two-layer network with one hidden layer and 10 neurons in the hidden layer. During the configuration step, the number of neurons in the output layer is set to one, which is the number of elements in each vector of targets. The transfer function for hidden layers was the tan-sigmoid transfer function and for the output layer the linear transfer function, often used for function fitting problems.
The weights and biases of the network have been initialized with random values and all the training inputs are applied to the network before the weights are updated. The performance function is mean square error that is the average squared error between the network outputs a and the target outputs t. It is defined as follows:
��6 =�
$∑ (78 − �8)
�$8:� (5)
Either the magnitude of the gradient or the number of validation checks are used to terminate the training. The gradient will become very small as the training reaches a minimum of the performance function. If the magnitude of the gradient is less than 1e-5, the training stops. The number of validation checks represents the number of successive iterations that the validation performance fails to decrease. If this number reaches 6, the training will stop. Since the initial weights and biases are randomly set more than one trial was done. Figure 5 shows a typical example of how the network error converged to the desired one as the network is trained. This figure gives the value of the training, validation and test performances versus the iteration number and doesn’t indicate any

major problems with the training. The validation and test curves are very similar. If the test curve had increased significantly before the validation curve increased, then it is possible that some over fitting might have occurred.
Figure 5. Diagram of the mean-squared error as the ANN converges
The regression plot given in Figure 6 shows a regression between network outputs and network targets. The three axes represent the training, validation and testing data. The dashed line in each axis represents the perfect result, outputs equal targets. The solid line represents the best fit linear regression line between outputs and targets. The R value is an indication of the relationship between the outputs and targets. If R = 1, this indicates that there is an exact linear relationship between outputs and targets. If R is close to zero, then there is no linear relationship between outputs and targets. For this example, the training data indicates a good fit. The validation and test results also show R values greater than 0.99. The scatter plot is helpful in showing that certain data points have poor fits. For example, there is a data point in the training set whose network output is close to 0.5, while the corresponding target value is about 0.2. Once the ANN has demonstrated acceptable pattern recognition skills, its creation is complete and it is ready for use.
Figure 6. Training, validation and testing regression between network outputs and network targets
7. Multi-objective GA Multiple, often conflicting objectives arise naturally in most real-world optimization scenarios. As evolutionary algorithms possess several characteristics that are desirable for this type of problem, this class of search strategies has been used for multi-objective optimization for more than a decade.
Genetic Algorithms (GAs), a family of biology-inspired methods, are considered here. With a GA a highly effective search of the solution space is performed, allowing a population of strings representing possible solutions to evolve through basic genetic operators. The goal of the genetic operators of the algorithm is to progressively reduce the space design driving the process into more promising regions. GA has many advantages, such as the capability of exploring a large design space, the merit that no gradients information is needed and also it can compute multiple independent objective functions simultaneously in one optimization run. Following the well-known concept of Pareto dominance, optimal solutions, i.e., solutions not dominated by any other solution, may be mapped to different objective vectors. In other words: there may exist several optimal objective vectors representing different trade-offs between the objectives. Therefore, in the following it is assumed that the goal of the optimization is to find or approximate the Pareto set. Accordingly, the outcome of the multi-objective GA is considered to be a set of mutually non-dominated solutions, or Pareto set approximation.
A general multi-objective optimization seeks to optimize the components of a vector-valued objective function mathematically formulated as
;�����<6=(�) = (>�(�),⋯ , >@(�)) (6)
subject to
A8BCD.E ≤ A8 ≤ A8
FGG.E,� = 1,⋯ , �
HI(�) ≤ 0,J = 1,⋯ , � (7)
where fi(b) is the jth objective function, � = (A�, ⋯ , AK) is the design variable vector, A8BCD.E and A8
FGG.E represent the lower and upper boundaries of the ith design variable bi and gk(b) the kth constraint.
Unlike single objective optimization approaches, the solution to this problem is not a single point, but a family of points known as the Pareto-optimal set. The idea of a solution for Eq. (6) with constraints given by Eq. (7) can be unclear, because a single point that minimizes all objectives simultaneously usually does not exist. Consequently, the idea of Pareto optimality is used to describe solutions for multi-objective optimization problems. Typically, there are many Pareto optimal solutions for a multi-objective problem. Thus, it is often necessary to incorporate user preferences for various objectives in order to determine a single suitable solution. The weighted sum method for multi-objective optimization problems [13] continues to be used extensively not only to provide multiple solution points by varying the weights consistently, but also to provide a single solution point that reflects preferences presumably incorporated in the selection of a single set of weights. In this work, using the weighted sum method to solve the multi-objective optimization problem entails selecting random scalar weights wj and minimizing the following composite objective function:
L(�) = ∑ MN>N(�)@N:� (8)
If all of the weights are positive, as assumed in this study, then minimizing Eq. (8) provides a sufficient condition for Pareto optimality, which means that its minimum is always Pareto optimal.
For a shape optimization application, the GA process begins by randomly setting an initial population of possible individuals, where individuals represent different graft geometries. The successive populations maintain the same number of individuals as it evolves throughout successive generations. Each individual is referred as a chromosome containing design variable values referred as genes of the chromosome over which genetic operators are applied. Operators such as selection/crossover, mutation and elimination supported by an elitist strategy are considered to ensure that fitness of the forthcoming generations is always improved [6, 10]. The optimization scheme includes the following steps:
Initialization, individuals of an initial population are produced randomly each representing a random geometry within the design variable space;
Selection of the progenitors is followed by crossover. The implemented crossover operator builds new individuals using a multipoint combination technique applied over the genes of both selected progenitors;
The implemented mutation is characterized is characterized by two different scenarios: first creating new individuals by swapping a value of a randomly selected variable and secondly by introducing new individuals randomly generated;
Evaluation, fitness of each individual is evaluated using a defined optimization goal and individuals are ranked according to their multi-objective fitness value;
Elimination, deletion of the worst solutions with low fitness simulates the natural death of low fitted individuals. The original size population is recovered and a new population obtained;
Termination checks the termination condition. If it is satisfied, the GA is terminated. Otherwise, the process returns to step Selection/crossover.
Regarding the choice of suitable objective functions for the graft optimization problem, several different approaches have been pursued in the literature. The most frequently considered quantities in the context of blood flow are based on either shear stress or the flow rate. So the previously assigned functions for the ANN output vector will be the vector-valued objective function to minimize. Using positive scalar weights randomly generated, the following composite function
L(�) = O + Q���(�) − Q���(�) + Q � (�) − R
Q� + Q� + Q = 1 (9)
is considered for the optimization problem investigated in this work, being A is a positive integer to ensure positiveness and P a value to penalize design vectors that do not conform with the boundary constrains for the geometric design parameters.
Despite deficiencies with respect to depicting the Pareto optimal set, the weighted sum method for multi-objective optimization continues to be used extensively not only to provide multiple solution points by varying the weights consistently, but also to provide a single solution point that reflects preferences presumably incorporated in the selection of a single set of weights.

8. Shape Optimization Results and Discussion Generating the Pareto set can be computationally expensive and is often infeasible, because the complexity of the underlying application prevents exact methods from being applicable. For this reason, there is usually no guarantee to identify optimal trade-offs but instead try to find a good approximation, i.e., a set of solutions whose objective vectors are not too far away from the optimal objective vectors.
Table 2. Optimization graft constraints and solutions Boundary Conditions Optimized Solutions S@1T
SG.1I
Graft Opt1
10 ≤ � ≤ 40��
0.15 ≤ � ≤ 0.785 ������
8 ≤ �� ≤ 14��
10 ≤ � ≤ 20��
SG.1I = 210��/�
�CGV� = 39.8939��
�CGV� = 0.7792 ������
��CGV� = 8.0214��
�CGV� = 17.0840��
1.09
Graft Opt2
10 ≤ � ≤ 40��
0.15 ≤ � ≤ 0.785 ������
9 ≤ �� ≤ 12��
9 ≤ � ≤ 12��
SG.1I = 210��/�
�CGV� = 39.7083��
�CGV� = 0.7818 ������
��CGV� = 9.0114��
�CGV� = 11.9708��
1.12
Graft Opt3
10 ≤ � ≤ 20��
0.15 ≤ � ≤ 0.785 ������
9 ≤ �� ≤ 12��
9 ≤ � ≤ 12��
SG.1I = 210��/�
�CGV = 19.9835��
�CGV = 11.9930 ������
��CGV = 0.7840��
�CGV = 11.7858��
1.24
Graft Opt4
10 ≤ � ≤ 20��
0.15 ≤ � ≤ 0.25 ������
9 ≤ �� ≤ 12��
9 ≤ � ≤ 12��
SG.1I = 210��/�
�CGVY = 19.8760��
�CGVY = 11.9796 ������
��CGVY = 0.2495��
�CGVY = 11.8810��
2.29
Figure 7. Velocity contours for selected optimized grafts
Four different runs of the GA, considering different boundary conditions are reported in Table 2. As a compromise between
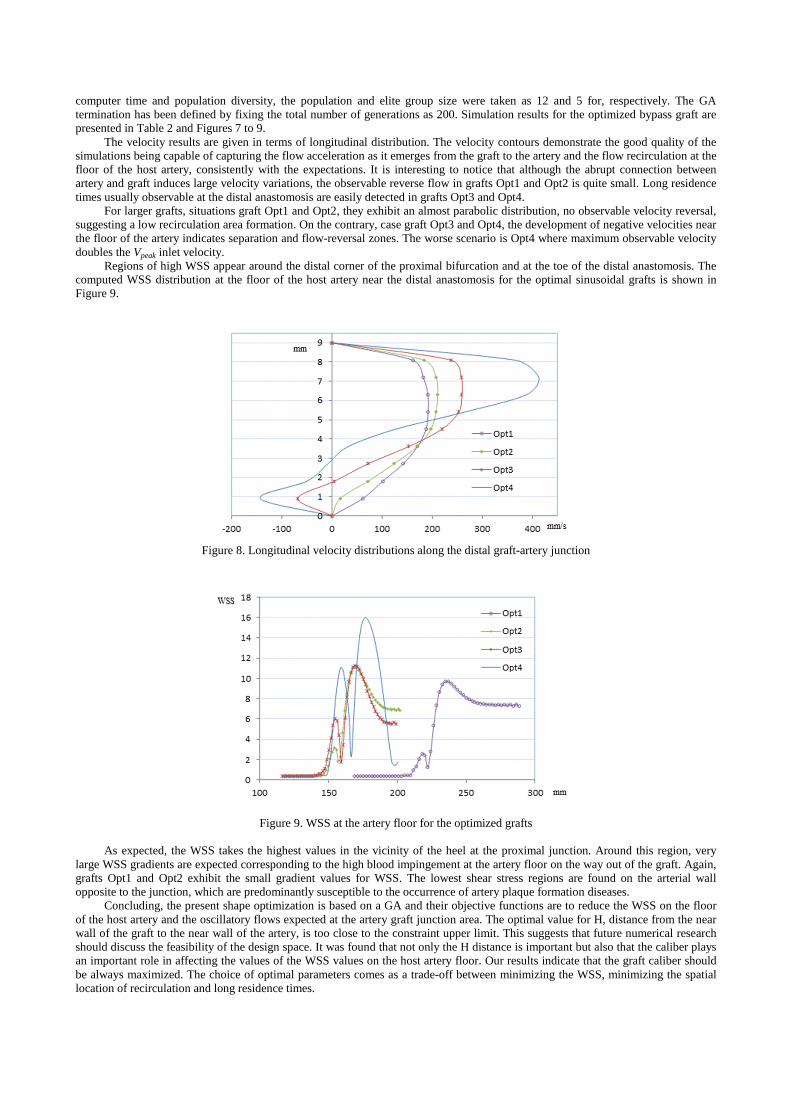
computer time and population diversity, the population and elite group size were taken as 12 and 5 for, respectively. The GA termination has been defined by fixing the total number of generations as 200. Simulation results for the optimized bypass graft are presented in Table 2 and Figures 7 to 9.
The velocity results are given in terms of longitudinal distribution. The velocity contours demonstrate the good quality of the simulations being capable of capturing the flow acceleration as it emerges from the graft to the artery and the flow recirculation at the floor of the host artery, consistently with the expectations. It is interesting to notice that although the abrupt connection between artery and graft induces large velocity variations, the observable reverse flow in grafts Opt1 and Opt2 is quite small. Long residence times usually observable at the distal anastomosis are easily detected in grafts Opt3 and Opt4.
For larger grafts, situations graft Opt1 and Opt2, they exhibit an almost parabolic distribution, no observable velocity reversal, suggesting a low recirculation area formation. On the contrary, case graft Opt3 and Opt4, the development of negative velocities near the floor of the artery indicates separation and flow-reversal zones. The worse scenario is Opt4 where maximum observable velocity doubles the Vpeak inlet velocity.
Regions of high WSS appear around the distal corner of the proximal bifurcation and at the toe of the distal anastomosis. The computed WSS distribution at the floor of the host artery near the distal anastomosis for the optimal sinusoidal grafts is shown in Figure 9.
Figure 8. Longitudinal velocity distributions along the distal graft-artery junction
Figure 9. WSS at the artery floor for the optimized grafts
As expected, the WSS takes the highest values in the vicinity of the heel at the proximal junction. Around this region, very
large WSS gradients are expected corresponding to the high blood impingement at the artery floor on the way out of the graft. Again, grafts Opt1 and Opt2 exhibit the small gradient values for WSS. The lowest shear stress regions are found on the arterial wall opposite to the junction, which are predominantly susceptible to the occurrence of artery plaque formation diseases.
Concluding, the present shape optimization is based on a GA and their objective functions are to reduce the WSS on the floor of the host artery and the oscillatory flows expected at the artery graft junction area. The optimal value for H, distance from the near wall of the graft to the near wall of the artery, is too close to the constraint upper limit. This suggests that future numerical research should discuss the feasibility of the design space. It was found that not only the H distance is important but also that the caliber plays an important role in affecting the values of the WSS values on the host artery floor. Our results indicate that the graft caliber should be always maximized. The choice of optimal parameters comes as a trade-off between minimizing the WSS, minimizing the spatial location of recirculation and long residence times.

Peripheral arterial disease is estimated to affect millions individuals in the world. Arterial duplex imaging provides direct anatomic and physiologic information, but it does not provide information regarding the overall hemodynamics. Duplex imaging distinguishes between a stenosis and an occlusion, determines the length of the disease segment and patency of the distal vessels, evaluates the results of intervention (angioplasty, stent placement, bypasses), diagnoses aneurysms and pseudo-aneurysms of peripheral vessels such as the carotid arteries. From this study recommendations to vascular surgeons on how to consider their arterial anastomoses cannot be expected; however future recommendations will be potentially made once, among others, the blood transient nature is accounted for in the optimization process. The study reported herein establishes the methodology as a viable means of achieving optimal artificial graft shapes. Acknowledgments The authors thank the financial support of FCT – Fundação para a Ciência e a Tecnologia from Portugal, through Unidade de Investigação: 10/225 - Unit for Numerical Methods in Mechanics and Structural Engineering, IDMEC – Pólo FEUP. This work was partially done in the scope of project PTDC/SAU-BEB/102547/2008, “Blood flow simulation in arterial networks towards application at hospital” , financially supported by FCT – Fundação para a Ciência e a Tecnologia from Portugal. 9. References 1. Giddens D P, Zarins C K and Glagov S. The role of fluid mechanics in the localization and detection of atherosclerosis, J.
Biomech. Eng., 1993,115, 588-594. 2. Ku D N, Giddens D P, Zarins C K and Glagov S. Pulsatile flow and atherosclerosis in the human carotid bifurcation: Positive
correlation between plaque location and low oscillating shear stress, Arteriosclerosis, 1985, 5(3), 293-302. 3. Trubel W, Schima H, Moritz A, Raderer F, Windisch A, Ullrich R, Windberger U, Losert U and Polterauer P. Compliance
mismatch and formation of distal anastomotic intimal hyperplasia in externally stiffened and lumen-adapted venous grafts, Eur J Vasc Endovasc Surg, 1995, 10, 415-423.
4. Imparato A M, Bracco A, Kim G E and Zeff R. Intimal and neointimal fibrous proliferation causing failure of arterial reconstruction. Surgery, 1972, 72, 1007-1017.
5. Sottiurai V S, Yao J S T, Batson R C, Sue S L, Jones R and Nakamura Y A. Distal anastomotic intimal hyperplasia: histopathological character and biogenesis, Annals of Vascular Surgery, 1989, 1, 26-33.
6. Castro C F, António C C and Sousa L C. Multi-objective optimization of bypass grafts in arteries, TMSi - Sixth International Conference on Technology and Medical Sciences, Porto, Portugal, 2010, 191-196.
7. Su C M, Lee D, Tran-Son-Tay R and Shyy W. Fluid flow structure in arterial bypass anastomosis, Journal of Biomechanical Eng., 2005, 127, 611-618.
8. Qiao A and Liu Y. Medical application oriented blood flow simulation, Clinical Biomechanics, 2008, 23, S130-S136. 9. Sousa L C, Castro C F, Antonio C A and Chaves R. Computational Techniques and Validation of Blood Flow Simulation,
WEAS Transactions on biology and biomedicine, ISI/SCI Web of Science and Web of Knowledge, 2011, 4-8, 145-155. 10. Castro C F, António C C, Sousa L C, Optimização da geometria do “bypass” arterial, Actas do 6º Congresso Luso-Moçambicano
de Engenharia, Maputo, Moçambique, 2011, 1055-1056. 11. Schaffer J D. Multi-objective optimization with vector evaluated genetic algorithms, Proceedings of the 1st International
Conference of Genetic Algorithms, 1985, 93–100. 12. Kim I Y and de Weck O L. Adaptive weighted sum method for multiobjective optimization: a new method for Pareto, Structural
and Multidisciplinary Optimization, 2006, 31, 105-116. 13. Marler R T and Arora J S. The weighted sum method for multi-objective optimization: new insights, Struct. Multidisc. Optim.,
2010, 41(6), 853-862. 14. Probst M, Lülfesmann M, Nicolai M, Bücker H M, Behr M and Bischof C H. Sensitivity of optimal shapes of artificial grafts
with respect to flow parameters, Comput. Methods Appl. Mech. Engrg., 2010, 199, 997-1005. 15. Fei D, Thomas J D and Rittgers S E. The effect of angle and flow rate upon hemodynamics in distal vascular graft anastomoses:
A numerical model study. ASME Journal of Biomedical Engineering, 1994, 116, 331-336. 16. Perktold K, Hofer M, Karner G, Trubel W and Schima W. Computer simulation of vascular fluid dynamics and mass transport:
Optimal design of arterial bypass anastomoses. ECCOMAS 1998, 1-6. 17. Perktold K, Resch M and Florian H. Pulsatile Non-Newtonian Flow Characteristics in a Three- Dimensional Human Carotid
Bifurcation Model, ASME J. Biomech. Eng., 1991, 113, 463-475. 18. Bassiouny H S,White S, Glagov S, Choi E, Giddens D P and Zarins C K. Anastomotic intimal hyperplasia: mechanical injury or
flow induced, J. Vas. Surg., 1992, 15, 708-716. 19. Beale R and Jackson T. Neural Computing: An Introduction (1990) IOP Publishing Ltd., Bristol, U.K. 20. Cross S S, Harrison R F and Kennedy R L. Introduction to neural networks, Lancet, 1995, 346, 1075-1079. 21. Haykin S. Neural networks: A comprehensive foundation (1994) New York: Macmillan. 22. Hush D R and Horne B G. Progress in supervised neural networks, IEEE Signal Proc. Magazine January 1993, 10, 8-39.