generic bolt hole eddy current testing probability of detection study
TRANSCRIPT

Generic Bolt Hole Eddy Current Testing Probability of Detection Study
NRC-IAR, DND, TRI/Austin
Catalin MandacheNDE Group, Structures and Materials Performance Laboratory

Outline
• Background– Project objectives– Design of experiments– Experimental results
• Numerical-based PoD– Approach– Considered variables– Example: Implementation of modelling results into the PoD

Project Objectives
- Generate generic PoD data that could be used for future estimates of PoD for a range of similar constructions
- Validate the currently used 90-95% discontinuity size in fastener bolt holes of aircraft wing box structures when using a DND eddy current inspection procedure
- Use of numerical modelling to estimate PoD for similar structures and assess variability

Design of Experiments
- A large number of inspectors and trainees was used for this study (following the same calibration, inspection, and recording procedures)
- 1,434 coupons made of 7075-T6 aluminum alloy- 306 coupons contained laboratory-grown fatigue cracks- 180 coupons contained EDM notches- 948 coupons were kept blank
- Four defect configurations – each configurations contained 468 inspection sets (72 fatigue cracks and 45 EDM notches)
- Real aircraft specimens containing EDM notches and overload cracks (Wing Splices: 35 cracked holes in 78 bolt holes and Web Stiffeners: 40 EDM notches in 151 bolt holes) – fatigue cracks were not available

Design of Experiments
a
0.313”
0.090”
c
c
a
0.313”
0.090”
a
0.313”
0.090”
c
a
0.090”
0.090”
c
Configuration #5
Configuration #1 Configuration #7
Configuration #12

Design of Experiments

Summary of results
a90/95 PoD results (‘hit-miss’ data) using the log-logistic method (MIL-HDBK-1823-2007):
• Configuration #1: average 0.017” / maximum 0.031” (0.43mm/0.77mm) • Configuration #5: average 0.012” / maximum 0.022” (0.30mm/0.55mm)• Configuration #7: average 0.016” / maximum 0.035” (0.40mm/0.87mm)• Configuration #12: average 0.025” / maximum 0.033” (0.63mm/0.83mm)
• For actual aircraft specimen: average 0.102” / maximum 0.177” (2.59mm/4.50mm)

Summary of results
Mid-bore cracks (configuration # 12) were used for the modelling example. Averaged results over 7 inspectors.
0.0
1.0
2.0
3.0
4.0
5.0
6.0
0.000 0.020 0.040 0.060 0.080 0.100 0.120 0.140 0.160
Predicted depth 'c' (inches)
avg.
a-h
at

Summary of results
Mid-bore cracks (configuration # 12) were used for the modelling example.

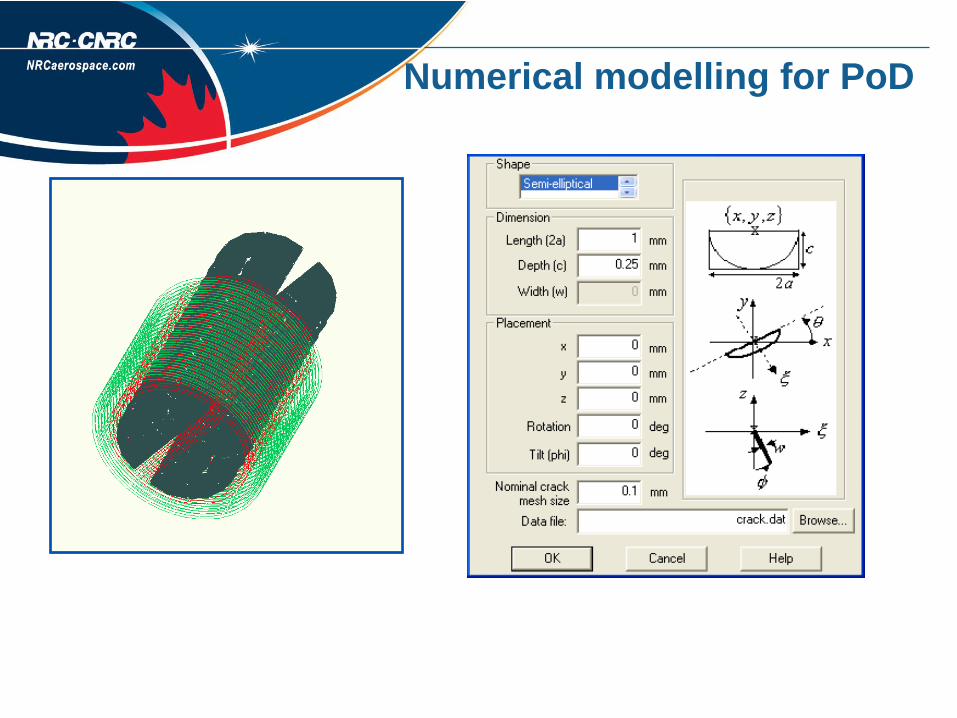
Numerical modelling for PoD
- Represents an inexpensive alternative to costly experimental PoD studies
- Has the potential to partially substitute and complement experimental PoD data
- Reduces cost, effort, resources- Assures portability of PoD information across similar structures- Helps in damage tolerance calculations and increases platform
availability
Conditions:- Validate model on a reduced set of specimens- Use the same variables as the experimental study- Simulate the same signal features of interest

Numerical modelling for PoD
Modelling software:- ECISM by CNDE and NDE Technologies- based on boundary element method- single layer- planar geometries- no crack width
Input parameters:- probe geometry- crack dimensions- material properties- eddy current instrument settings
Numerical modelling for PoD

Evaluated variables
Name of variableProbe frequency
lift-offtiltoff-centre
Crack lengthdepthlength and depthrectangular versus elliptical shape
Material electrical conductivity

Examples

Numerical-based approach
General principles of using numerical-based approach for estimating PoD

Example
Consider only a change in the driving frequency:

Example

Example
Summary
Numerical modelling:- Insight into inspectability / detectability factors
- inspection optimization- interpretation of results
- Cost-reduction tool for extensive PoD studies- PoD studies based on a limited number of inspections- transportability of known PoD results to similar inspection
situations
Future work:- Validation of the predicted results- Establish new noise levels and threshold limits- Inclusion of the results in the PoD analysis

Contact info
If you have questions regarding the overall project, please address them to:
Dr. Abbas Fahr (NRC-IAR):[email protected]
Capt. DJ Butcher (DND-ATESS):[email protected]
Final Results – to be presented at ASIP 2007, December 4-6