generating spatial and nonspatial attentional control:...
TRANSCRIPT

Generating spatial and nonspatial attentional control:
An ERP study
HELEEN A. SLAGTER,a ALBERT KOK,a NISAN MOL,b DURK TALSMA,c andJ. LEON KENEMANSb
aDepartment of Psychonomics, University of Amsterdam, Amsterdam, The NetherlandsbDepartments of Psychonomics and Psychopharmacology, Utrecht University, Utrecht, The NetherlandscDepartment of Clinical Neuropsychology, Vrije Universiteit, Amsterdam, The Netherlands
Abstract
The present study used event-related potentials and dipole source modeling to investigate dimension specificity in
attentional control. Subjects performed cued attention tasks in which the task-relevant information (a) was always the
same, (b) varied between features within the same dimension, or (c) varied between features of two different dimen-
sions. Thus, both demands on control processes involved in generating an attentional set and the dimension (color or
location) of the task-relevant feature were varied. Attentional control was associated with a dorsal posterior positivity
starting at 260 ms postcue, which was stronger over left posterior scalp regions from 580 ms onward, especially when
color was task relevant. This positivity likely reflects generic processes involved in the generation of an attentional set
that were followed in time by dimension-specific processes related to the persistence of the task-relevant information in
working memory.
Descriptors: Spatial, Nonspatial, Attentional control, Attentional selection, Event-related potentials, Dipole modeling
Attention can be dynamically allocated to aspects of the outside
world that are relevant to our immediate goals. In this way, task-
relevant information can be processed selectively and we can
respond faster and more accurately to behaviorally important
events (e.g., Posner, 1980). In the past, event-related potential
(ERP) studies investigating how the brain mediates selective
processing of task-relevant information have shown that that
spatial attention yields earlier and qualitatively different ERP
effects than nonspatial attention. Whereas visuospatial attention
results in enhanced amplitudes of the exogenous P1 and N1
components as early as 80–90 ms post stimulus (e.g., Eason,
1981; Mangun, Hansen, & Hillyard, 1986), selection based on
nonspatial visual stimulus features, such as color or shape, is
reflected by effects starting at around 150ms after stimulus onset,
which are superimposed on the evoked components and have a
very different morphology (e.g., Harter & Previc, 1978). These
electrophysiological findings indicate that the mechanisms un-
derlying the selective processing of task-relevant information
differ between spatial and nonspatial attention. They are also
in line with models of attention that, based upon results from
behavioral studies, have assigned a special role for spatial atten-
tion in visual processing (Treisman, 1993; van der Heijden,
1993).
More recent work has begun to address the question of how
spatial and nonspatial attention afford selective processing of
task-relevant information by studying the top-down control
mechanisms that specify what information should be attended
(Driver & Frith, 2000; Nobre, 2001; Yantis & Serences, 2003).
This line of research may provide insight into the mechanisms
that actually produce the observed differences in modulatory
effects between spatial and nonspatial attention. A task that is
typically employed to study top-down attentional control is the
cued attention task. Here, subjects are first presented with a cue
that instructs them to direct attention to a certain stimulus at-
tribute, which is then followed by a test stimulus thatmay ormay
not possess the cued attribute. By evaluating what is happening
in the brain in the period between the attention-directing cue and
the test stimulus, processes involved in controlling attention can
be examined. Because ERPs provide precise information on
the timing of neural events, they are ideally suited to identify the
different processes involved in attentional control, such as the
generation of an attentional set and the biasing of feature-specific
visual areas (Posner, Inhoff, Friedrich, & Cohen, 1987). Yet,
attention-directing cues not only elicit activity in brain systems
that control the focus of attention, but also in brain systems
involved in other stages of information processing, such as cue
identification and motor preparation. To isolate attentional
control processes, the attention-directing condition should there-
We thankGiuseppeCipriani for assistance in collecting the data of the
behavioral experiment. This research was supported by Dutch NWO
grant 42520206 to A.K and J.L.K.
Heleen Slagter is now at the University of Wisconsin.Address reprint requests to: Heleen A. Slagter, Waisman Center,
University of Wisconsin, Laboratory for Brain Imaging & Behavior,T139, 1500 Highland Avenue, Madison, WI 53705-2280, USA. E-mail:[email protected].
Psychophysiology, 42 (2005), 428–439. Blackwell Publishing Inc. Printed in the USA.Copyright r 2005 Society for Psychophysiological ResearchDOI: 10.1111/j.1469-8986.2005.00304.x
428

fore be compared with a reference condition that controls for
these nonspecific processes.
Several ERP studies have previously investigated the proc-
esses involved in directing attention to spatial position (Eimer,
1993; Eimer, Van Velzen, & Driver, 2002; Harter & Anllo-Vento,
1991; Harter, Miller, Price, LaLonde, & Keyes, 1989; Hopf &
Mangun, 2000; Mangun, 1994; Nobre, Sebestian, & Miniussi,
2000; Yamaguchi, Tsuchiya, & Kobayashi, 1994, 1995) or non-
spatial visual stimulus attributes (Kenemans, Grent-’t-Jong, et
al., 2002; Yamaguchi, Yamagata, &Kobayashi, 2000) using cued
attention tasks. Most of the studies of spatial attentional control
compared ERP responses elicited by cues directing attention to
the left and right hemifields (Eimer, 1993; Eimer et al., 2002;
Harter et al., 1989; Hopf & Mangun, 2000; Nobre et al., 2000;
Yamaguchi et al., 1994, 1995; but see Harter & Anllo-Vento,
1991; Mangun, 1994; Wright, Geffen, & Geffen, 1995). This
contrast reveals all processes that are specific to the task-relevant
hemifield and eliminates all processes not related to attention,
such as the sensory processing of the cue. However, this ap-
proach is not ideal for isolating the full temporal pattern of at-
tentional control, as it may cancel out nonlateralized attentional
control processes that may be mandatory for the establishment of
an attentional bias. In addition, results from studies using this
approach cannot easily be compared to results from studies of
nonspatial attentional control (Kenemans, Grent-’t-Jong, et al.,
2002; Yamaguchi et al., 2000) in which such an attend-left versus
attend-right comparison is obviously not possible. On the basis of
these studies, it is therefore unclear to what extent spatial and
nonspatial attentional control rely on common mental operations.
To gain more insight into the extent to which the processes
involved in attentional control are specific to the dimension (i.e.,
spatial or nonspatial) of the behaviorally relevant information,
we recently conducted an ERP study employing a cued attention
task in which both the number and type of task-relevant fea-
ture(s) were varied (Slagter, Kok, Mol, & Kenemans, 2005).
Cues instructing subjects to direct attention to a color, a location,
a conjunction of a color and location, or informing subjects that
no specific color or location was task relevant on that trial (i.e.,
so-called no-feature cue) were presented randomly mixed in a
trial block. Comparison of ERPs elicited by color and location
attention-directing cues and by no-feature cues revealed three
principal attentional control-related effects: (1) a parieto-occip-
ital positivity around 340 ms post cue, which was related to
linking the cued symbol to its associated stimulus feature. This
effect was localized to the ventral posterior compartment of cor-
tex. (2) A negativity over fronto-central scalp regions that was
maximal around 540 ms post cue. This effect was related to ge-
neric processes involved in directing attention. (3) Late in the
cue-target interval, differences in ERP were observed between
directing attention to color and location. The latter effects orig-
inated from anterior and ventral posterior areas and may rep-
resent differences in, respectively, maintenance and perceptual
biasing processes. Thus, in general, similar ERP patterns were
observed for directing attention to color and location, suggesting
that spatial and nonspatial attention rely to a great extent on
similar control mechanisms.
It has been argued, however, that when tasks occur in amixed
design, subjects may adopt a more generalized task strategy be-
cause they have to be prepared for all the different possibilities
(e.g., Strayer & Kramer, 1994). The previously observed overlap
in color and location cue-related ERPs may hence reflect activity
related to the use of generalized task-preparation strategies rath-
er than mechanisms that are common to spatial and nonspatial
top-down control. In addition, the no-feature reference cue
condition used in our previous study differed from the attention-
directing cue condition in demands on preparatory processes re-
lated to both the specification of the task-relevant information
and the maintenance of this information, making it difficult to
distinguish between these two operations.
The present study sought to address these issues and com-
plement the findings from our previous study using ERPs and
dipole source modeling. In particular, we employed additional
controls for maintenance processes, while varying demands on
processes involved in the specification of the behaviorally rele-
vant information. In addition, color and location cues were pre-
sented both randomly mixed in a block and in separate blocks.
Three types of task blocks were used: blocks in which the cued
attribute (a specific color [blue or yellow] or a specific location
[left or right]) (1) was always the same (‘‘repeated’’ task), (2)
varied between features within the same dimension (either color
or location; ‘‘transient’’ task), or (3) varied between features of
both dimensions (color and location) within a block of trials
(‘‘mixed’’ task). Sensory and motor demands were equal across
tasks and there was always only one relevant feature. Yet, de-
mands on processes involved in specifying the task-relevant in-
formation increased progressively from the repeated to the
transient to the mixed task. Therefore, by contrasting cue-related
activity in the transient and mixed tasks with cue-related activity
in the repeated task, for the location and color attention-direct-
ing conditions separately, we couldmore specifically examine the
nature and dynamics of top-down attentional control.
We predicted that if spatial and nonspatial attention rely on
common control operations, the two types of attention should
show no differences in brain activity when comparing ERPs
elicited by transient and mixed cues with ERPs elicited by re-
peated cues. This would be reflected by a main effect of task
(repeated, transient, mixed). On the other hand, if attentional
control operations are to some extent dimension specific, this
would be revealed by an interaction between dimension (loca-
tion, color), task, and recording site. To be better able to compare
results from this study with our previous study (Slagter et al.,
2005) in terms of global location, the neural generators of the
most pronounced effects of task and dimension were estimated
using dipole source modeling. We furthermore expected that if
the intermixed presentation of location and color cues led sub-
jects to adopt more generalized task-preparation strategies, the
effects of dimension on attentional control processes should be
less prominent in the mixed than the transient task, as expressed
by a task by dimension interaction. Also, to ensure that subjects
had indeed directed their attention, we examined the presence of
the commonly reported modulatory effects of spatial attention
(i.e., P1 and N1) and nonspatial attention (i.e., frontal selection
positivity [FSP] and occipital selection negativity [OSN]) on test
stimulus processing (Hillyard & Munte, 1984; Lange, Wijers,
Mulder, & Mulder, 1998). In addition, we investigated whether
the size of these modulatory effects was affected by our attent-
ional control manipulation.
To establish that demands on control processes were indeed
higher in the mixed versus the transient versus the repeated task,
we conducted a separate behavioral study in which the duration
of the interval between cue onset and test stimulus was varied
between 200 and 600 ms. Increased processing demands would
be reflected by an increase in interval time needed for the reaction
time function to reach asymptote in the mixed relative to the
Dimension specificity in attentional control 429

transient relative to the repeated task. In the ERP experiment,
the cue–test stimulus interval was always minimally 800 ms to
ensure that we could investigate the full temporal pattern of at-
tentional control.
Methods
Participants
Eighteen volunteers participated in Experiment 1, the behavioral
study (5 men; aged 18–30 years; mean age of 21.9 years), and 16
volunteers participated in Experiment 2, the ERP study. The
data of 2 subjects were discarded from the ERP analysis due to
ocular artifacts. Thus, 14 subjects (7 men; aged 19–25 years,
mean age of 20.7 years) remained in the ERP sample. All par-
ticipants were students at the University of Amsterdam and were
right-handed. They reported having no history of mental or sus-
tained physical illness and normal or corrected-to-normal vision.
Participants received credits as part of an introductory course
requirement at the University of Amsterdam.
Stimuli
Experiment 1. Behavioral study. Each trial began with a 100-
ms presentation of a cue (0.921 in width and 2.81 in height) that
was located at fixation. Then, with SOAs of 200, 300, 400, 500,
or 600 ms, this cue was followed by a test stimulus (31 in height,
31 in width). This test stimulus was a blue or yellow square and
appeared 7.131 to center from fixation in either the left or the
right visual field and 1.731 to center above the horizontal me-
ridian. The next trial started randomly after 1400 to 2100 ms.
During the entire trial, a fixation cross (0.311 in width and 0.201
in height) was shown at the center of the screen. All stimuli were
presented on a black background.
Each cue consisted of four white uppercase letters (all equal in
width [0.361] and height [0.511]) presented around the fixation
cross in a vertical array: ‘‘B,’’ ‘‘G,’’ ‘‘L,’’ and ‘‘R.’’ Each letter
corresponded to a stimulus feature: ‘‘B’’ to blue, ‘‘G’’ to yellow
(‘‘geel’’ inDutch), ‘‘L’’ to left, and ‘‘R’’ to right. Letter order was
counterbalanced across subjects with the restriction that the lo-
cation coding letters (L andR) and color coding letters (B andG)
were always grouped together, resulting in eight possible com-
binations of letters. There were five different cues, four attention-
directing cues (i.e., blue, yellow, left, and right cues) and one
so-called ‘‘catch cue.’’ These were defined by the position of two
small horizontal bars (0.201 in width, 0.081 in height) that either
flanked one of the four letters (attention-directing cue) or the
fixation cross (catch cue). In case of an attention-directing cue,
the letter flanked by the two bars indicated the feature to which
attention was to be directed (e.g., when presented next to L,
attention had to be directed to the left).
When presented with an attention-directing cue, subjects were
instructed to respond as fast and accurately as possible to test
stimuli presented at the cued location or of the cued color. On
50% of all trials, the test stimulus possessed the cued attribute.
Upon presentation of a catch cue, subjects were required to press
a button as fast as possible. On these catch cue trials, subject did
not have to direct attention and could ignore the subsequent test
stimulus. Catch cue trials were randomized into the stimulus
sequence to ensure that subjects identified and interpreted the cue
to a similar extent in all types of tasks. Subjects used their right
index finger to respond both to target test stimuli and catch cues.
Subjects performed three types of cueing tasks: (1) a repeated
task: Subjects were repeatedly cued to direct attention to the
same stimulus feature (a color [blue or yellow] or a location [left
or right]) during an entire run, (2) a transient task: Subjects were
cued on a trial-by-trial basis to direct attention to one of two
features of the same dimension (either color [blue and yellow] or
location [left and right]), and (3) amixed task: Subjects were cued
on a trial-by-trial basis to direct attention to either a color (blue,
yellow) or a location (left, right). On a given trial, subjects were
thus cued to attend to a particular stimulus feature of a given
dimension. In all tasks, catch cues were presented on 13.5% of all
trials and all possible attention-directing cues were presented
with equal probability in the remainder of trials.
Each task run started with a 10-s presentation of a warning
screen, which indicated to subjectswhich taskwould be presented
next. A task run consisted of 74 trials and lasted approximately 3
min. In the repeated task, trial categories were varied randomly
per run. In the transient and mixed tasks, the cue-test stimulus
sequence was randomized similarly per run with the restriction
that the same cue could not be presented for more than five
successive trials in a row. Subjects practiced one run of each task
first. Then, subjects performedone run of each repeated task, two
runs of each transient task, and four runs of the mixed task. The
order of tasks was counterbalanced across subjects with the re-
striction that the repeated and transient color tasks, the repeated
and transient location tasks, and the mixed tasks were each al-
ways presented together. Subjects sat at 80 cm in front of the
computer screen.
Experiment 2: ERP study. The same stimuli and tasks were
used as in Experiment 1 with the exception that the cue–test stim-
ulus interval was now randomly varied between 800 and 1500 ms
(rectangular distribution), so that we could examine the full tem-
poral pattern of attentional control and to mitigate the possibility
of overlapping ERP waves. As noted by one of the reviewers, one
should keep inmind that a possible disadvantage of using long cue–
test stimulus intervals is that the neural operations of attentional
orienting may become invoked in a less tight manner, possibly
smearing the ERP signature. A second difference between the ERP
and the behavioral experiment was that test stimuli were divided
into targets (150ms) and standards (50ms). Targets were presented
on 25% of trials, and subjects were instructed to respond only to
target test stimuli with the cued feature.
The ERP study consisted of three sessions: a practice session
and two EEG sessions. During the practice session, subjects
practiced each task twice, to become familiar with the specific
task requirements. In addition, it was made sure that subjects did
not show excessive eyeblink activity while performing the task. In
total, subjects performed 4 runs of each condition of the repeated
task (i.e., left, right, blue, yellow), 8 runs of each condition of the
transient task (i.e., color, location), and 16 runs of themixed task
during the EEG sessions. During one EEG session, subjects
performed all runs of the repeated and transient tasks of one
dimension (e.g., location) and half the runs of the mixed task.
During the other EEG session, they performed all runs of the
repeated and transient tasks of the other dimension (e.g., color)
plus the other half of the runs of the mixed task. The order of
these two sessions was counterbalanced. Repeated and transient
task runs were presented intermixed and their order was ran-
domized across subjects. Subjects were allowed to pause between
the runs if they wished to do so. Subjects practiced each task used
430 H.A. Slagter et al.

in a given EEG session once more after placement of the elec-
trode cap, right before the EEG recordings started.
ERP Recordings
Recordings were made with 60 Ag/AgCl electrodes mounted in
an elastic cap (Quick Cap) according to the International 10–20
system. All scalp channels were referenced to the right mastoid.
Horizontal eye movements were monitored with two bipolar
electrodes placed on the left and right of the external canthi.
Vertical eye movements and blinks were measured bipolarly with
two electrodes placed above and below the left eye. EEG was
recorded inDCmodewith a low-pass filter of 60Hz and digitized
at 250 Hz. Impedances were kept below 5 kO.The raw data were filtered off-line with a noncausal 40-Hz
low-pass filter (24 dB/oct). Epochs were created starting 100 ms
before and ending 500 and 800 ms after, respectively, each test
stimulus and cue of interest, re-referenced to the mean of both
mastoids, and averaged according to category type. Trials con-
taining artifacts (VEOG 4 � 60 mV, HEOG 4 � 30 mV, andEEG 4 � 60 mV), and behavioral errors were excluded from
further analysis. About 15% of trials (standard deviation: 2.2%)
were rejected from the cue analyses based upon our artifact re-
jection criterion. This number did not differ appreciably between
conditions and tasks. For each task (i.e., repeated, transient,
mixed), four test stimulus-locked ERPswere created: (1) location
attended, (2) location unattended, (3) color attended, and (4)
color unattended. In addition, six types of ERPs were construct-
ed for the cue stimuli, according to the two types of cues (color
[blue and yellow] and location [left and right]) and the three types
of tasks (repeated, transient, and mixed). If residual horizontal
(42 mV) or vertical eye movement-related activity (greater volt-
age at VEOG than FP1 or FP2) was present in the individual
average ERP waveforms, the individual trials were visually in-
spected and manually excluded from the average process when
contaminated with EOG activity.
Analysis
Experiment 1: Behavioral Study
To investigate the time course of attentional orienting, re-
peated-measures analyses of variance (ANOVAs) with the with-
in-subject factors dimension (color, location), task (repeated,
transient, mixed), and interval (200, 300, 400, 500, 600 ms [with
respect to cue onset]) were performed on (1) response latencies of
correct responses to attended test stimuli, (2) arc sin-transformed
omitted response rates, and (3) arc sin-transformed false alarm
rates to attended test stimuli. In case of a significant interaction
of dimension or task with the factor interval, separate repeated-
measures ANOVAs were run for each interval with the factors
dimension and task.
Experiment 2: ERP Study
Behavioral analysis. Repeated-measures ANOVAs with the
within-subject factors dimension (color, location) and task (re-
peated, transient, mixed) were performed on (1) response
latencies of correct responses to target test stimuli, (2) arc sin-
transformed omitted response rates, and (3) arc sin-transformed
false alarm rates to (a) attended test stimuli, which were pre-
sented briefly, (b) unattended test stimuli, which were presented
slightly longer, and (c) unattended test stimuli, which were pre-
sented briefly. These analyses were performed to test for differ-
ences in behavioral performance between task conditions. In
addition, to investigate whether or not subjects kept identifying
the cue symbol in the repeated task, response times to and arc-sin
transformed omitted response rates for catch cues were entered
into repeated-measurements ANOVAs with the within-subject
factor task (repeated, transient, mixed).
Test stimulus-locked ERP analyses. P1 and N1 attention ef-
fects were investigated at electrodes P7 and P8, between 80 and
140 ms and 140 and 200 ms poststimulus, respectively, for the
location condition. P1 andN1 attention effects are generally most
pronounced over lateral occipito-temporal areas (Hillyard, Vogel,
& Luck, 1998), as also confirmed by inspection of the current
data. Voltage values, sampled every 4 ms within these intervals,
were submitted to repeated-measures ANOVAs, which tested for
the effects of task (repeated, transient, mixed; task), attention
(attended, unattended; location-attention), hemisphere (left,
right; hemisphere), and stimulus feature (left, right; location).
The presence of FSP and OSN effects was examined, respec-
tively, at electrodes F3 and F4 between 100 and 248 ms post-
stimulus, and at electrode Oz between 148 and 300 ms for the
color condition. Selection of the F3 and F4 electrodes was mo-
tivated by the current data and findings from prior studies (e.g.,
Anllo-Vento, Luck, & Hillyard, 1998), while selection of the Oz
electrode was motivated based on findings from prior studies
alone, as we did not observe an OSN (see below). Voltage values,
sampled every 4 ms within these intervals, were submitted to
repeated-measures ANOVAs, which tested for the effects of task
(repeated, transient, mixed; task), attention (attended, unattend-
ed; color-attention), and stimulus feature (blue, yellow; color). In
the FSP analyses, the additional factor hemisphere (left, right;
hemisphere) was tested. Because of multiple interrelated com-
parisons, and hence the likelihood of false-positive spurious sig-
nificant effects, for all analyses performed, effects were only
considered reliable if they persisted for at least six successive time
bins (4 ms each, p valueo.05).
Cue-locked ERP analyses. The 800-ms cue–test stimulus in-
terval was divided into 40 time bins of 20 ms (five sample points),
and for each time bin, the average voltage was computed for each
electrode and task condition of interest. To detect ERP differ-
ences between the different task conditions, these mean voltage
values were subjected as dependent variables to separate regional
repeated-measures ANOVAs (anterior analysis [F7/F8, F3/F4,
FC5/FC6], central analysis [T7/T8, C3/C4, CP5/CP6], and pos-
terior analysis [P7/P8, P3/P4, PO5/PO6]) for each time bin sep-
arately. In these analyses, the following four factors were tested
within subjects: task (repeated, transient, mixed), dimension
(color, location), electrode position within hemisphere (e.g., P7/
8, P3/4, PO5/6; site), and hemisphere (left, right). In case of
statistical effects including the factor task, post hoc contrasts
were used to determine which tasks specifically differed from one
another. The following two orthogonal contrasts were specified
for the factor task: repeated versus the average of the transient
and mixed tasks and transient versus mixed task. For topo-
graphical analysis, the data were normalized according to the
scaling procedure described by McCarthy and Wood (1985).
These normalized data were analyzed with the same ANOVAs
described above. If interaction effects between the factors task
and/or dimension with the factor site identified using the non-
normalized data were still present after normalization, this was
taken as evidence for a difference in scalp topography between
conditions. Given our relatively small sample size, only
results from ‘‘mixed-model’’ tests were examined for all the
Dimension specificity in attentional control 431

repeated-measurements analyses performed. The Huynh–Feldt
or Greenhouse–Geisser epsilon correction factor (whenever the
Huynh–Feldt epsilon was smaller than .75) was applied where
appropriate, to compensate for possible effects of nonsphericity
in the measurements compared. Only the corrected F and prob-
ability values and the uncorrected degrees of freedom are re-
ported. Because of multiple interrelated comparisons, and hence
the likelihood of false-positive spurious significant effects, effects
were only considered reliable if they persisted for at least three
successive time bins (20 ms each, (corrected) p valueo.05).
Source localization. To investigate the neural generators of
themost pronounced effects of task and dimension, a subtraction
logic and source modeling were applied (cf. Kenemans, Lijffijt,
Camfferman, & Verbaten, 2002). For each electrode, four cue-
locked grand average average-reference difference waves were
calculated: (1) location transient – repeated, (2) color transient –
repeated, (3) location mixed – transient, and (4) color mixed –
transient. Then, for each sample point, the global field power was
calculated as the square root of the sumof squares of the average-
referenced activity over all channels. Peaks in the time-varying
global field power function thus indicate latencies where the un-
derlying brain activity is maximal, taking into account all elec-
trode channels (Lehman & Skrandies, 1984). Next, dipole fitting
was conducted, using one or two bilateral dipole pairs with mir-
ror-symmetric locations, at a 20-ms window around global field
power peak latencies of interest. Source models were determined
using the BESA program (version 4.2), using the default four-
shell model. An energy constraint (weighted 20% in the com-
pound cost function, as opposed to 80% for the residual variance
criterion; see Berg & Scherg, 1994) was used to reduce the prob-
ability of interacting dipoles and to favor solutionswith relatively
low dipole moments. To evaluate apparent similarities/differenc-
es in equivalent dipole locations and orientations across the dif-
ferent conditions, individual source parameters (dipole location
and orientation) were estimated for global field power latencies
of most interest. Then, the resulting x-, y-, and z-coordinates
were entered into one multivariate test with the within-subjects
factors dimension (color, location) and contrast (transient-re-
peated, mixed-transient), separately for each type of parameter
and global field power latency of interest.
Results
Experiment 1: Behavioral Study
In line with the hypothesis that task demands were greater in the
mixed versus the transient versus the repeated tasks, it took sig-
nificantly longer for the reaction time function to reach asymp-
tote in themixed versus the transient versus the repeated tasks, as
expressed by a significant interaction between task and interval,
F(8,136)5 17.5; po.001 (see Figure 1). Only when subjects were
allowed 600 ms to direct attention (i.e., during the longest cue-
test stimulus interval) were subjects equally fast in responding to
target stimuli in all tasks. In addition, not shown inFigure 1, with
longer cue–test stimulus intervals, subjects were faster in re-
sponding to test stimuli presented at the cued location than to test
stimuli of the attended color (interaction between dimension and
interval, F[4,68]5 3.2, p5 .019). When investigating differences
in response time between the location and color conditions for
each cue–test stimulus interval separately, however, no signifi-
cant differences were observed. In addition, with shorter cue–test
stimulus intervals, subjects made more false alarms to unattend-
ed test stimuli in the mixed and transient tasks compared to the
repeated task, as reflected by a significant interaction between
task and interval, F(8,136)5 3.7, p5 .001. No differences in the
number of missed attended test stimuli were observed between
any of the tasks or between the color and location condition
across intervals.
Experiment 2: ERP Study
Behavior
Table 1 lists the average response times, percentage of false
alarms, and percentage of omitted responses in the color and
location attention-directing conditions for the repeated, tran-
sient, and mixed tasks. There were no significant differences be-
tween the different task conditions in response latency, any of the
false alarm rates, or omitted response rates to target test stimuli.
Subjects responded faster to catch cues in the repeated (560 ms)
compared to the transient (571 ms) and mixed (579 ms) tasks as
expressed by a main effect of task, F(2,26)5 6.57, p5 .001. This
indicates that subjects identified the cue symbol more quickly in
the repeated tasks. Moreover, although relatively few catch cues
were missed, a greater number of omitted responses to catch cues
was found for the mixed (1.47%) compared to the repeated
(0.67%) and transient (0.80%) tasks (main effect of task,
F[2,26]5 8.40, p5 .002).
Test Stimulus-Locked ERP Effects
Both P1 and N1 amplitudes were modulated by spatial at-
tention, confirming that subjects had indeed directed their at-
tention to the cued location (see Figure 2A). P1 amplitudes were
larger for stimuli presented at attended compared to unattended
locations between 112 and 148 ms post test stimulus,
F(1,13)5 5.4–14.7, po.05. This attention-related effect did not
depend on the type of task performed, and was greater in size
over contralateral scalp regions as indicated by an interaction
between the factors location-attention, hemisphere, and location
between 104 and 124 ms poststimulus at electrodes P7 and P8,
F(1,13)5 4.7–17.1, po.05. Interestingly, this P1 effect appeared
to be preceded by an effect that was dependent on the type of task
performed (see Figure 2A). Close inspection of the test stimulus-
locked ERPs revealed that this unexpected effect represented an
early attentional modulation of the P1 in the mixed task, which
was not lateralized with respect to the cued location. This was
confirmed by additional analyses at electrodes P7 and P8, show-
ing that stimuli presented at attended locations elicited greater
positivity over lateral posterior scalp regions than stimuli pre-
sented at unattended locations in the mixed task compared to the
432 H.A. Slagter et al.
Figure 1. Mean reaction time (1 standard error) obtained in Experiment
1 displayed as a function of cue–target interval duration for the mixed,
transient, and repeated tasks.
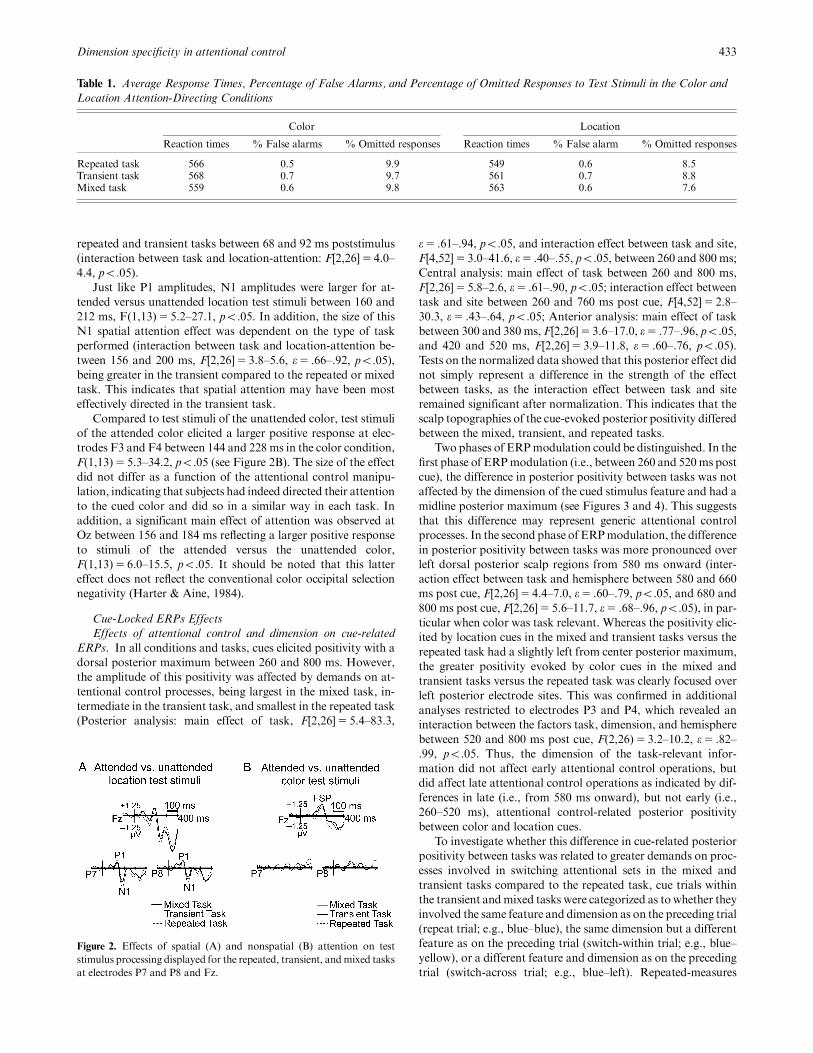
repeated and transient tasks between 68 and 92 ms poststimulus
(interaction between task and location-attention: F[2,26]5 4.0–
4.4, po.05).
Just like P1 amplitudes, N1 amplitudes were larger for at-
tended versus unattended location test stimuli between 160 and
212 ms, F(1,13)5 5.2–27.1, po.05. In addition, the size of this
N1 spatial attention effect was dependent on the type of task
performed (interaction between task and location-attention be-
tween 156 and 200 ms, F[2,26]5 3.8–5.6, e5 .66–.92, po.05),
being greater in the transient compared to the repeated or mixed
task. This indicates that spatial attention may have been most
effectively directed in the transient task.
Compared to test stimuli of the unattended color, test stimuli
of the attended color elicited a larger positive response at elec-
trodes F3 and F4 between 144 and 228 ms in the color condition,
F(1,13)5 5.3–34.2, po.05 (see Figure 2B). The size of the effect
did not differ as a function of the attentional control manipu-
lation, indicating that subjects had indeed directed their attention
to the cued color and did so in a similar way in each task. In
addition, a significant main effect of attention was observed at
Oz between 156 and 184 ms reflecting a larger positive response
to stimuli of the attended versus the unattended color,
F(1,13)5 6.0–15.5, po.05. It should be noted that this latter
effect does not reflect the conventional color occipital selection
negativity (Harter & Aine, 1984).
Cue-Locked ERPs Effects
Effects of attentional control and dimension on cue-related
ERPs. In all conditions and tasks, cues elicited positivity with a
dorsal posterior maximum between 260 and 800 ms. However,
the amplitude of this positivity was affected by demands on at-
tentional control processes, being largest in the mixed task, in-
termediate in the transient task, and smallest in the repeated task
(Posterior analysis: main effect of task, F[2,26]5 5.4–83.3,
e5 .61–.94, po.05, and interaction effect between task and site,
F[4,52]5 3.0–41.6, e5 .40–.55, po.05, between 260 and 800 ms;
Central analysis: main effect of task between 260 and 800 ms,
F[2,26]5 5.8–2.6, e5 .61–.90, po.05; interaction effect between
task and site between 260 and 760 ms post cue, F[4,52]5 2.8–
30.3, e5 .43–.64, po.05; Anterior analysis: main effect of task
between 300 and 380 ms, F[2,26]5 3.6–17.0, e5 .77–.96, po.05,
and 420 and 520 ms, F[2,26]5 3.9–11.8, e5 .60–.76, po.05).
Tests on the normalized data showed that this posterior effect did
not simply represent a difference in the strength of the effect
between tasks, as the interaction effect between task and site
remained significant after normalization. This indicates that the
scalp topographies of the cue-evoked posterior positivity differed
between the mixed, transient, and repeated tasks.
Two phases of ERPmodulation could be distinguished. In the
first phase of ERPmodulation (i.e., between 260 and 520ms post
cue), the difference in posterior positivity between tasks was not
affected by the dimension of the cued stimulus feature and had a
midline posterior maximum (see Figures 3 and 4). This suggests
that this difference may represent generic attentional control
processes. In the second phase of ERPmodulation, the difference
in posterior positivity between tasks was more pronounced over
left dorsal posterior scalp regions from 580 ms onward (inter-
action effect between task and hemisphere between 580 and 660
ms post cue, F[2,26]5 4.4–7.0, e5 .60–.79, po.05, and 680 and
800 ms post cue, F[2,26]5 5.6–11.7, e5 .68–.96, po.05), in par-
ticular when color was task relevant. Whereas the positivity elic-
ited by location cues in the mixed and transient tasks versus the
repeated task had a slightly left from center posterior maximum,
the greater positivity evoked by color cues in the mixed and
transient tasks versus the repeated task was clearly focused over
left posterior electrode sites. This was confirmed in additional
analyses restricted to electrodes P3 and P4, which revealed an
interaction between the factors task, dimension, and hemisphere
between 520 and 800 ms post cue, F(2,26)5 3.2–10.2, e5 .82–
.99, po.05. Thus, the dimension of the task-relevant infor-
mation did not affect early attentional control operations, but
did affect late attentional control operations as indicated by dif-
ferences in late (i.e., from 580 ms onward), but not early (i.e.,
260–520 ms), attentional control-related posterior positivity
between color and location cues.
To investigate whether this difference in cue-related posterior
positivity between tasks was related to greater demands on proc-
esses involved in switching attentional sets in the mixed and
transient tasks compared to the repeated task, cue trials within
the transient andmixed tasks were categorized as towhether they
involved the same feature and dimension as on the preceding trial
(repeat trial; e.g., blue–blue), the same dimension but a different
feature as on the preceding trial (switch-within trial; e.g., blue–
yellow), or a different feature and dimension as on the preceding
trial (switch-across trial; e.g., blue–left). Repeated-measures
Dimension specificity in attentional control 433
Figure 2. Effects of spatial (A) and nonspatial (B) attention on test
stimulus processing displayed for the repeated, transient, andmixed tasks
at electrodes P7 and P8 and Fz.
Table 1. Average Response Times, Percentage of False Alarms, and Percentage of Omitted Responses to Test Stimuli in the Color and
Location Attention-Directing Conditions
Color Location
Reaction times % False alarms % Omitted responses Reaction times % False alarm % Omitted responses
Repeated task 566 0.5 9.9 549 0.6 8.5Transient task 568 0.7 9.7 561 0.7 8.8Mixed task 559 0.6 9.8 563 0.6 7.6

ANOVAs revealed that switch cues (i.e, switch-within and/or
switch-across cues) elicited greater positivity over dorsal poste-
rior scalp regions than repeat cues from 300 ms onward in both
the transient, F(1,13)5 4.8–62.5, po.05 (see Figure 5A) and
mixed task, F(2,26)5 4.4–53.4, e5 .75–1.0, po.05 (see Figure
5B). This within-tasks effect strongly resembled the posterior
positivity observed when comparing cue-related responses across
tasks (i.e., mixed vs. transient vs. repeated) both in terms of scalp
topography and latency. Notably, these within-task differences
in posterior positivity between switch and repeat cues were
smaller than the across-task differences in posterior positivity.
These additional findings thus indicate that the posterior
positivity reflects processes common to switch and repeat trials,
which are called upon more strongly when a new stimulus
feature is cued and are affected by the number of possible cues in a
block. Importantly, the cue-related posterior positivity was larger
on repeat trials in the mixed and transient tasks than in the re-
peated task between 260 and 680ms, F(2,26)5 3.5–61.7, e5 .65–
.82, po.05, arguing against the possibility that the differences
in posterior positivity observed across tasks were driven by a
difference in the proportion of switch and repeat trials (see
Figure 5C).
434 H.A. Slagter et al.
Figure 3. A,B: Grand average ERP waveforms to location (A) and color (B) cues in the repeated, transient, and mixed tasks at
selected electrodes. C: Grand average ERP waveforms to location and color cues and their ERP difference waveform (location –
color) at selected electrodes.
Figure 4. Grand average average-reference spline-interpolated isopotential maps for the different contrasts between cue conditions
at several latencies post cue. The spacing between isopotentials is 0.2 mV. White: areas of positive amplitude. Shaded: areas of
negative amplitude.

The amplitude of the cue-related positivity was, in addition,
affected by the dimension of the cued stimulus feature (i.e., color
or location), independently of demands on attentional control
processes. This indicates that the dimension of the task-relevant
information not only affected processes related to attentional
control, but also affected processes not involved in attentional
control. As can be seen in Figure 3C, from 480 ms onward,
location cues elicited greater positivity than color cues over fron-
to-central electrodes, bilaterally, and posterior electrodes, par-
ticularly those located over the left posterior scalp regions
(Frontal analysis: main effect dimension between 480 and 540
ms, F[1,13]5 5.7–10.8, po.05, and between 560 and 720 ms,
F[1,13]5 4.8–7.5, po.05; Central analysis: main effect of di-
mension between 680 and 720 ms, F[1,13]5 4.7–5.6, po.05, and
interaction effect between dimension and site between 480 and
800 ms, F(2,26)5 6.0–12.1, e5 .57–.81, po.05; Posterior anal-
ysis: interaction between dimension and site between 580 and 660
ms, F[2,26]5 3.8–5.3, e5 .76–.90, po.05, and interaction be-
tween dimension, hemisphere, and site between 700 and 760 ms,
F[2,26]5 3.4–3.7, e5 .74–.85, po.05).
Strategy effects. Next to examining the nature and temporal
dynamics of attentional control, the present study investigated
the effects of presenting spatial and nonspatial attention-direct-
ing conditions intermixed in a block versus in separate blocks.We
predicted that if the intermixed presentation of color and location
cues in the same block led subjects to a generalized task prep-
aration strategy, differences in cue-related ERP between the col-
or and location attention-directing conditions should be smaller
in themixed task compared to the transient task. Contrary to this
prediction, we observed that location cues elicited greater pos-
itivity over dorsal posterior scalp locations than color cues in the
mixed task between 460 and 520 ms, whereas both types of cues
elicited similar amounts of positivity over these scalp locations in
the transient task (see Table 2). Thus, the difference in posterior
positivity between the color and location attention-directing
conditions was actually more pronounced in the mixed rather
than the transient task in this time interval. This effect was related
to a greater increase in posterior positivity in themixed relative to
the transient task when location compared to color was task
relevant, as expressed by a significant interaction between task
and dimension between 480 and 520 ms post cue, F(2,26)5 3.5–
3.5, e5 .95–.99, po.05. Results from additional analyses con-
fined to electrodes P3 and P4 showed that this effect began at 460
ms post cue and disappeared after 520 ms post cue,
F(2,26)5 3.4–3.7, e5 .78–.97, po.05. This finding suggests that
the type of task performed (i.e., mixed or transient) may affect
the way the brain controls attention to spatial position or color.
Source localization results. In the time window in which the
main effect of task was most significant at posterior electrodes
sites, the most pronounced peaks in global field power were ob-
served for the contrasts transient versus repeated location cues
(440 ms), transient versus repeated color cues (428 ms), mixed
versus transient location cues (468 ms), and mixed versus tran-
sient color cues (464 ms). The neural generators underlying these
effects were therefore estimated, first for the grand average dif-
ference waveform, and then for the individual subject difference
waveforms, where the grand average solution parameters were
used as a starting point (cf. Kenemans, Lijffijt, et al., 2002).
Modeling these effects with one symmetric dipole pair localized
all effects to the posterior compartment of the cortex with low
residual variance (RV; see Figure 6; RV5 2.4% [transient vs.
repeated location cues], 1.7% [transient vs. repeated color cues],
2.9% [mixed vs. transient location cues], and 4.9% [mixed vs.
transient color cues]). The different dipole solutions were stable
across different starting positions. Adding a second dipole pair to
the model did not substantially change the location of the first
dipole pair for any of the contrasts. Therefore, all effects were
modeled with one symmetric dipole pair.
Statistical analysis revealed no differences in dipole locations
between any of the modeled contrasts. However, when dipole
orientations were compared, significant main effects of contrast
Dimension specificity in attentional control 435
Figure 5. A, B: Grand average cue-related ERP waveforms on repeat
trials, switch-within trials, and switch-across trials in the transient task
(A) and in the mixed task (B), separately for location (left column) and
color (right column) cues. C: Grand average cue-related ERP waveforms
on repeat trials elicited in the repeated, transient, and mixed tasks,
separately for location (left column) and color (right column) cues.
Table 2. Mean (Averaged across 460–520 ms) Voltage
Differences (Plus Standard Error) for Transient versus Repeated
Cues and Mixed versus Transient Cues Coding for Location or
Color at Electrodes P3 en P4
Transient-repeated Mixed-transient
P3 P4 P3 P4
Location cues 2.7 (0.4) 2.4 (0.5) 2.5 (0.5) 2.6 (0.6)Color cues 2.7 (0.5) 2.6 (0.5) 1.6 (0.5) 1.0 (0.5)
The difference in voltage elicited bymixed compared to transient cues waslarger when location compared to color was task relevant.
Figure 6. Grand average dipole source solutions for the four contrasts
modeled at around 450 ms post cue.

(left dipole, F[3,11]5 5.6, po.05; right dipole, F[3,11]5 4.9,
po.05) and interaction effects between contrast and dimension
(left dipole, F[3,11]5 4.7, po.05; right dipole, F[3,11]5 6.3,
po.01) were found. Univariate tests and visual inspection of the
dipole solutions revealed that the dipoles obtained for the mixed
versus transient contrasts were oriented to slightly more ventral
posterior areas than those obtained for the transient versus re-
peated contrasts, especially when locationwas task relevant. This
indicates that slightly different brain areas or more extended
patches of cortex may have been activated depending on the type
of task performed.
Discussion
The goals of the present study were (1) to examine dimension
specificity in attentional control, and (2) to determine the effects
of the intermixed versus blocked presentation of color and lo-
cation cues on dimension-specific attentional control-related ac-
tivity, using high-density ERP recordings, dipole source
modeling, and cued attention tasks in which both demands on
attentional control processes and the dimension of the behavi-
orally relevant information were varied. The results from the
behavioral study confirmed our hypothesis that the mixed and
transient tasks imposed a higher load on attentional control op-
erations than the repeated task: The interval time between cue
and test stimulus was longer before the reaction time function
reached asymptote in the mixed relative to the transient relative
to the repeated task (see Figure 1). Also, false alarm rates were
higher for short cue–test stimulus intervals in the mixed and
transient tasks compared to the repeated task.
Attentional Control-Related Posterior Positivity: Early Phase
Themost pronounced attentional control-related effect observed
for both the location and color attention-directing conditions
was a dorsal posterior positivity starting at 260 ms post cue (see
Figures 3 and 4). Between 260 and 520 ms, this effect was max-
imal over midline dorsal posterior scalp regions and not sensitive
to the dimension of the cued feature (i.e., color vs. location). This
suggests the attentional control operations represented by this
early difference in posterior positivity are generic, that is, they
can code for both spatial and nonspatial tasks. One clear can-
didate process is the updating of the attentional set. On each trial,
it was necessary to specify which feature and, thus, dimension
should be selectively attended. Yet, in the mixed task, this task-
relevant information had to be updated on a trial-by-trial basis at
both the feature and dimension levels; in the transient task, this
only had to be done at the feature level, and in the repeated task,
the task-relevant information could be tonically maintained at
both levels. Thus, demands placed on processes involved in gen-
erating an attentional set increased from the repeated to the
transient to the mixed task. This may in turn have affected the
amplitude of the posterior positivity.
The posterior positivity elicited by attention-directing cues
displayed characteristics of the widely studied P3, being maximal
over midline parietal electrodes and displaying latency in the ap-
propriate time range (Pritchard, 1981). Although the P3 has been
argued to reflect a number of related processes (Kok, 2001), the
weight of evidence supports an interpretation in terms of updating
a cognitive model of the environment in working memory stores
(Donchin & Coles, 1988). This advocates an interpretation of the
observed differences in posterior positivity in the P3 latency win-
dow in terms of differences across tasks in the demands placed on
processes involved in updating an attentional set.
This conclusion if further supported by results from addi-
tional analyses that showed that in the transient andmixed tasks,
cues directing attention to a different stimulus feature as on the
preceding trial (i.e., switch trial) and cues directing attention to
the same stimulus feature as on the preceding trial (i.e., repeat
trial) both elicited dorsal posterior positivity. However, this pos-
terior positivity was larger when the cue indicated a new task (see
Figure 5). This indicates, first of all, that the differences in cue-
related posterior postivity observed between tasks (i.e., collapsed
across switch and repeat trials) were not simply due to the
number of possible cues that were presented in a block. In that
case, one would have expected no difference in cue-related pos-
terior positivity between switch and repeat trials in the transient
and mixed tasks. Second, these findings indicate that the cogni-
tive processes reflected by the dorsal posterior positivity occurred
on both repeat trials and switch trials, but worked harder when
the cued feature changed, rather than remained the same with
respect to the preceding trial. Critically, this implies that having
to switch attention called more strongly on basic preparatory
processes that occur whenever the current attentional set needs to
be activated, not only when a switch is indicated. It is also im-
portant to note that the dorsal posterior positivity was larger on
repeat trials in the mixed and transient tasks than on repeat trials
in the repeated task, arguing against the possibility that the dif-
ferences in posterior positivity observed across tasks were driven
by a difference in the proportion of switch and repeat trials. It is
likely that demands on processes involved in updating the at-
tentional set were higher when the cued feature changed with
respect to the preceding trial, and also when having multiple
possibilities in mind, as in the mixed (four) versus the transient
(two) versus the repeated (one) tasks. These results are consistent
with current models of set switching, in which basic processes
related to updating of rules for upcoming task demands are
considered a crucial aspect of task preparation (Altmann, 2004;
Mayr & Kliegl, 2003).
The fact that similar dipole source solutions were obtained at
around 450 ms post cue, when differences in posterior positivity
were largest between tasks, for effects of shifting attention within
a dimension and of shifting attention between dimensions (see
Figure 6), is in line with the idea that the same control processes
were activated by all tasks, albeit more strongly in the more
demanding tasks. The relative posterior location of these sources
suggests a relatively strong contribution from posterior brain
areas to these effects. This would be in line with findings from
recent event-related fMRI studies that support a crucial role for
the parietal cortex, rather than the frontal cortex, in top-down
attentional control (Corbetta & Shulman, 2002).
The story may, however, be somewhat more complex, as al-
though the location of the dipoles did not differ between the
different contrasts, their orientations did. This indicated that the
scalp distribution of the posterior positivity differed between
tasks, as was also confirmed by analysis of the normalized cue-
related ERPs. These data therefore suggest that switching at-
tentional sets may not just have increased activity in brain areas
involved in repeated attentional control, but may also have ac-
tivated additional brain areas. These brain areas may have been
involved in similar control processes as those called upon in the
repeated task, but may have been recruited extra, because of
increased demands on these processes under shifting conditions.
Alternatively, however, these areas may have been involved in
436 H.A. Slagter et al.

additional control processes, specific to the transient and/or
mixed task, such as processes related to inhibition of the previ-
ously relevant stimulus feature.
Previous ERP studies also observed increased activation over
posterior scalp regions in the P3 timewindow in conditionswhere
attention was directed to location (Harter & Anllo-Vento, 1991;
Mangun, 1994; Wright et al., 1995) compared to a reference
condition in which attention did not have to be directed to a
specific peripheral location. In our previous study (Slagter et al.,
2005), differences in posterior positivity were found for both
location and color cues relative to the no-feature cues, but these
effects peaked slightly earlier (around 340 ms after cue presen-
tation), were maximal over lateral parieto-occipital recording
sites, and were localized to more lateral ventral posterior areas
than in the present study. These effects were related to processes
involved in linking the cue symbol to its associated stimulus fea-
ture. Differences between this and the current study in the spe-
cific comparison used to isolate attentional control processes
might explain these differences in posterior positivity. In our
previous study, no specific color or location was task relevant on
reference cue trials, whereas in the reference task (i.e., the re-
peated task) used in the present study, subjects always had to
direct attention to a specific color or location, albeit always to the
same stimulus feature. As some directing of attention also oc-
curred on repeat cue trials, this may explain why the posterior
effect peaked somewhat later in time in the present study (i.e.,
after processes that link the cue symbol to its associated feature).
In addition, in our earlier study, all types of cues (i.e., attention-
directing and reference cues) were presented intermixed within
the same run, whereas in the present study, tasks differed in the
number of stimulus features that could be cued within a run. This
might explain why the posterior effect had a different, more
dorsal posterior scalp distribution in the present study (i.e., re-
flecting a greater contribution from areas involved in updating
the attentional set). Importantly, together these results may sug-
gest that attentional control is initiated by processes that link the
attention-directing cue to its associated stimulus feature, which
are followed in time by processes that use this information to
update the attentional set.
Late (580 ms) Left-Lateralized Attentional Control-Related
Posterior Positivity
The initial increase in posterior positivity was followed by en-
hanced parietal slow wave positivity in the mixed versus the
transient versus the repeated task from 580 ms onward (see Fig-
ures 3 and 4). This late sustained positivity strongly resembles the
ERP slow-wave pattern observed in the retention periods of vis-
ual and nonvisual working memory tasks (Bosch, Mecklinger, &
Friederici, 2001; Ruchkin, Grafman, Cameron, & Berndt, 2003).
Ruchkin and colleagues have suggested that this slow-wave pos-
terior positivity may index operations that support recoding
from visual to phonological format and/or initiation of retention
processes (Ruchkin, Johnson, Grafman, Canoune, & Ritter,
1992; Ruchkin et al., 1997).
It is interesting to note in this respect that results from the
separately conducted behavioral experiment indicated that at-
tentionwas fully directedwithin 600ms in all tasks (see Figure 1).
This estimate is similar to previous estimates of the time course of
attentional orienting (Duncan, Ward, & Saphiro, 1994; Muller,
Teder-Salejarvi, & Hillyard, 1998) and supports an interpreta-
tion of the late slow wave positivity in terms of processes that
occur after information is specified as task relevant, such as
processes related to the persistence of information in working
memory. These processes may have been more prominent in the
transient and mixed tasks than in the repeated task because of
interference from other stimulus features that were possibly task
relevant in these tasks.
Notably, the attentional control-related activity was more
pronounced over left dorsal posterior scalp regions when color
compared to location was behaviorally relevant from 520 ms
onward (see Figure 4). The left hemisphere specifically has been
implicated in verbal working memory (e.g., Smith & Jonides,
1999) and this effect may accordingly reflect the use of verbal
rather than more analog strategies related to the persistence of
information in working memory, which may have been more
prominent when color was task relevant. This left hemisphere
focus is consistent with results from fMRI studies showing ac-
tivation of a left-lateralized network of frontal and parietal re-
gions in the period between attention-directing cue and test
stimulus (Giesbrecht, Woldorff, Song, & Mangun, 2003; Hop-
finger, Buenocore, &Mangun, 2000; Shulman, d’Avossa, Tansy,
& Corbetta, 2002; Weissman, Mangun, & Woldorff, 2002).
It should be noted that in all tasks (i.e., the repeated, tran-
sient, and mixed tasks), one item had to be held on-line until test
stimulus presentation. It thus seems not likely that the late slow-
wave positivity reflects processes related to pure storage of the
task-relevant information. Interestingly, as in our previous study
(Slagter et al., 2005), a difference in frontal activity was observed
between location and color cues late in the cue–target interval
(see Figure 3C). In the present study, however, the amplitude of
this effect was not affected by demands on attentional control
processes, indicating that this late anterior effect should be at-
tributed to differences in dimension-specific functions that are
not related to attentional control, such as storage of the task-
relevant information.
Common Attentional Control Mechanisms or Generalized Task-
Preparation Strategies?
Next to examining the nature and temporal dynamics of attent-
ional control, the present study also investigatedwhether subjects
may adopt more general task-preparation strategies when color
and location attention-directing cues are presented intermixed in
a block compared to in separate blocks. Between 460 and 520 ms
post cue, location cues elicited greater positivity over midline
posterior scalp locations than color cues in the mixed task,
whereas both types of cues elicited similar amounts of positivity
in the transient task, as was confirmed by a significant task by
dimension interaction (see Figure 3 and Table 2). Hence, con-
trary to expectation, ERP differences between color and location
cues in this timewindowwere actually greater when the two types
of cues were presented intermixed within the same block. It
should also be noted that interaction effects between task and
dimension were not observed at any other time point after cue
presentation. All in all, the present data thus indicate that, over-
all, the intermixed presentation of color and location cues did not
lead subjects to adopt generalized task-preparation strategies.
The observed overlap in ERPs between color and location cues in
the current and our previous studies (Slagter et al., 2005) can
therefore genuinely be ascribed to mechanisms that are common
to spatial and nonspatial top-down attentional control.
Effect of Attention on Test Stimulus Processing
As expected, spatial attention modulated the early P1 and N1
components elicited by test stimuli, whereas a frontal selection
Dimension specificity in attentional control 437

positivity was observed in relation to nonspatial attention. These
findings confirm that subjects indeed used the cue to direct their
attention. Interestingly, the type of task performed affected ef-
fects of spatial attention on test stimulus processing in two ways
(see Figure 2A). First of all, between 68 and 92 ms post test
stimulus, P1 amplitude was modulated more strongly in the
mixed task than in the transient and repeated tasks. Secondly, the
amplitude of the N1 component elicited by test stimuli was
modulated more strongly by spatial attention in the transient
task than in the mixed and repeated tasks. These results are in-
dicative of interactions between attentional control processes and
modulatory processes that may depend on the number of pos-
sibly relevant stimulus features and/or dimensions in a task
block. As was shown in the behavioral experiment, the different
tasks (i.e., repeated, transient, mixed) differed in the time needed
to fully direct attention. It is therefore possible that at the time of
test stimulus presentation, the tasks differed in the relative
strength of engagement of attention to the task-relevant location
and/or suppression of attention to the task-irrelevant location.
This may have resulted in the observed differences inmodulatory
effects of spatial attention on test stimulus processing between
tasks. Indeed, it has previously been shown that different attent-
ional selectionmechanismsmay be operative under transient and
sustained spatial attention conditions (Eimer, 1996). It is also
possible that differences in the number of possibly relevant stim-
ulus dimensions in a block (i.e., one in the repeated and transient
tasks [either color or location] and two in the mixed task [color
and location]) affected the feature selection process. In the mixed
task, for example, interference from the other possibly relevant
stimulus dimension (i.e., color) may have affected attentional
orienting to the cued location. Future studies need to replicate
these findings and determine in what way the number of possibly
relevant test stimulus features and/or dimension in a task-block
can affect the location selection process.
Summary and Conclusions
The guiding question to our study was to what extent the proc-
esses that direct the focus of attention are dependent on the na-
ture of the feature that is selected. To this aim, both demands on
attentional control-related processes and the dimension of the
task-relevant feature were varied. This approach proved very
useful in isolating both attentional control-related processes that
generalize over the dimension of the task-relevant information
and attentional-control-related processes that are specific to one
dimension relative to the other. Generic processes, likely reflect-
ing the generation of an attentional set, were followed in time by
dimension-specific processes, possibly related to the persistence
of the task-relevant information in working memory. In addi-
tion, the current approach permitted investigation of the effects
of the intermixed rather than blocked presentation of color
and location attention-directing cues on dimension specificity
in attentional control. Effects of dimension on attentional con-
trol-related processes were generally not smaller in the mixed
task, suggesting that the intermixed presentation of color
and location cues did not lead subjects to use generalized task-
preparation strategies.
REFERENCES
Altmann, E. M. (2004). Advance preparation in task switching. Psycho-logical Science, 15, 616–622.
Anllo-Vento, L., Luck, S. J., & Hillyard, S. A. (1998). Spatio-temporaldynamics of attention to color: Evidence from human electrophys-iology. Human Brain Mapping, 6, 216–238.
Berg, P., & Scherg, M. (1994). BESA version 2.0 Handbook. Munich:Megis.
Bosch, V., Mecklinger, A., & Friederici, A. D. (2001). Slow corticalpotentials during retention of object, spatial, and verbal information.Cognitive Brain Research, 10, 219–237.
Corbetta, M., & Shulman, G. L. (2002). Control of goal-directed andstimulus-driven attention in the brain. Nature Neuroscience Reviews,3, 201–215.
Donchin, E., & Coles, M. G. H. (1988). Is the P300 component a man-ifestation of context updating? Behavioral and Brain Science, 11,357–374.
Driver, J., & Frith, C. (2000). Shifting baselines in attentional control.Nature Neuroscience Reviews, 1, 147–148.
Duncan, J., Ward, R., & Saphiro, K. (1994). Direct measurement ofattentional dwell time in human vision. Nature, 369, 313–315.
Eason, R. G. (1981). Visual evoked potential correlates of early neuralfiltering during selective attention. Bulletin of the PsychonomicSociety, 18, 203–206.
Eimer, M. (1993). Spatial cueing, sensory gating and selective responsepreparation: An ERP study on visuo-spatial orienting. Electroen-cephalography and Clinical Neurophysiology, 88, 408–420.
Eimer, M. (1996). ERP modulations indicate the selective processing ofvisual stimuli as a result of transient and sustained spatial attention.Psychophysiology, 33, 13–21.
Eimer, M., Van Velzen, J., & Driver, J. (2002). Crossmodal interactionsbetween audition, touch and vision in endogenous spatial attention:ERP evidence on preparatory states and sensory modulations.Journal of Cognitive Neuroscience, 19, 254–271.
Giesbrecht, B., Woldorff, M. G., Song, A. W., &Mangun, G. R. (2003).Neural mechanisms of top-down control during spatial and featureattention. NeuroImage, 19, 496–512.
Harter, M. R., & Aine, C. (1984). Brain mechanisms of visual selectiveattention. In P. Parasuraman & D. R. Davis (Eds.), Varieties ofattention (pp. 293–321). New York: Academic Press.
Harter, M. R., & Anllo-Vento, L. (1991). Visual-spatial attention: Prep-aration and selection in children and adults. In C. H. M. Brunia &M. N. Verbaten (Eds.), Event-related brain research (pp. 183–194).Amsterdam: Elsevier.
Harter,M.R.,Miller, S. L., Price, N. J., LaLonde,M. E., &Keyes, A. L.(1989). Neural processes involved in directing attention. Journalof Cognitive Neuroscience, 1, 223–237.
Harter, M. R., & Previc, F. H. (1978). Size-specific information channelsand selective attention: Visual evoked potential and behavioral meas-ures. Electroencephalography and Clinical Neurophysiology, 45,628–640.
Hillyard, S. A., & Munte, T. F. (1984). Selective attention to color andlocation: An analysis with event-related brain potentials. Perceptionand Psychophysics, 36, 185–198.
Hillyard, S. A., Vogel, E. K., & Luck, S. J. (1998). Sensory gain control(amplification) as a mechanism of selective attention: Electrophysi-ological and neuroimaging evidence. Philosophical Transactions ofthe Royal Society of London. Series B, Biological Sciences, 353,1257–1270.
Hopf, J. M., &Mangun, G. R. (2000). Shifting visual attention in space:An electrophysiological analysis using high spatial resolution map-ping. Clinical Neurophysiology, 111, 1241–1257.
Hopfinger, J. B., Buonocore, M. H., & Mangun, G. R. (2000). Theneural mechanisms of top-down attentional control. Nature Neuro-science, 3, 284–291.
Kenemans, J. L., Grent-’t-Jong, T., Giesbrecht, B., Weissman, D. H.,Woldorff, M. G., & Mangun, G. R. (2002). A sequence of brain-activity patterns in the control of visual attention. Psychophysiology,39, S77.
Kenemans, J. L., Lijffijt, M., Camfferman, G., & Verbaten, M. N.(2002). Split-second sequential selective activation in humansecondary visual cortex. Journal of Cognitive Neuroscience, 14,48–61.
438 H.A. Slagter et al.

Kok, A. (2001). On the utility of the P3 amplitude as a measure ofprocessing capacity. Psychophysiology, 38, 557–577.
Lange, J. J.,Wijers, A. A.,Mulder, L. J., &Mulder,G. (1998). Color andlocation selection in ERPs: Differences, similarities and ‘‘neuralspecificity. Biological Psychology, 48, 153–182.
Lehman, D., & Skrandies, W. (1984). Spatial analysis of evoked poten-tials in manFA review. Progress in Neurobiology, 23, 227–250.
Mangun, G. R. (1994). Orienting attenton in the visual fields: An elect-rophysiological analysis. In H. J. Heinze, T. F. Munte, & G. R.Mangun (Eds.), Cognitive electrophysiology (pp. 81–101). Boston,MA: Birkhauser.
Mangun, G. R., Hansen, J. C., & Hillyard, S. A. (1986). The spatialorienting of attention: Sensory facilitation or response bias? In R.Johnson Jr., J. W. Rohrbaugh, & R. Parasuraman (Eds.), Currenttrends in event-related-potential research (pp. 118–124). New York:Elsevier.
Mayr,U., &Kliegl, R. (2003). Differential effects of cue changes and taskchanges on task-set selection costs. Journal of Experimental Psychol-ogy: Learning, Memory, and Cognition, 29, 362–372.
McCarthy, G., & Wood, C. C. (1985). Scalp distributions of event-related potentials: An ambiguity associated with analysis of variancemodels. Electroencephalography and Clinical Neurophysiology, 62,203–208.
Muller, M. M., Teder-Salejarvi, W., & Hillyard, S. A. (1998). The timecourse of cortical facilitation during cued shifts of spatial attention.Nature, 1, 631–634.
Nobre, A. C. (2001). The attentive homunculus: Now you see it, now youdon’t. Neuroscience and Biobehavioral Reviews, 25, 477–496.
Nobre, A. C., Sebestyan, G. N., & Miniussi, C. (2000). The dynamics ofshifting visuospatial attention revealed by event-related potentials.Neuropsychologia, 38, 964–974.
Posner, M. I. (1980). Orienting of attention. Quarterly Journal of Ex-perimental Psychology, 32, 3–25.
Posner, M. I., Inhoff, A. W., Friedrich, F. J., & Cohen, A. (1987).Isolating attentional systems: A cognitive-anatomical analysis. Psy-chobiology, 15, 107–121.
Pritchard, W. S. (1981). Psychophysiology of P300. Psychological Bul-letin, 89, 506–540.
Ruchkin, D. S., Berndt, R. S., Johnson, R. Jr., Ritter, W., Grafman, J.,& Canoune, H. (1997).Modality-specific processing streams in work-ing memory: Evidence from spatio-temporal patterns of brain activ-ity. Cognitive Brain Research, 6, 95–113.
Ruchkin, D. S., Grafman, J., Cameron, K., & Berndt, R. S. (2003).Working memory retention systems: A state of activated long-termmemory. Behavioral and Brain Sciences, 26, 709–777.
Ruchkin, D. S., Johnson, R. Jr., Grafman, J., Canoune, H., & Ritter,W.(1992). Distinctions and similarities among working memory proc-esses: An event-related potential study. Cognitive Brain Research, 1,53–66.
Shulman, G. L., d’Avossa, G., Tansy, A. P., & Corbetta, M. (2002).Two attentional processes in the parietal lobe. Cerebral Cortex, 12,1124–1131.
Slagter, H. A., Kok, A., Mol, N., & Kenemans, J. L. (2005). Spatio-temporal dynamics of top-down control: Directing attention tolocation and/or color as revealed by ERPs and source modeling.Cognitive Brain Research, 22, 333–348.
Smith, E. E., & Jonides, J. (1999). Storage and executive processes in thefrontal lobes. Science, 283, 1657–1661.
Strayer, D. L., & Kramer, A. F. (1994). Strategies and automaticity: I.Basic findings and conceptual framework. Journal of ExperimentalPsychology: Learning, Memory, and Cognition, 20, 318–341.
Treisman, A. (1993). The perception of features and objects. In A. Bad-deley & L. Weiskranz (Eds.), Attention: Selection, awareness and con-trol: A tribute to Donald Broadbent (pp. 5–35). Oxford, UK:Clarendon Press.
van der Heijden, A. C. H. (1993). The role of position in object selectionin vision. Psychological Research, 56, 44–58.
Weissman, D. H., Mangun, G. R., & Woldorff, M. G. (2002). A role fortop-down attentional orienting during interference between globaland local aspects of hierarchical stimuli.NeuroImage, 17, 1266–1276.
Wright, M. J., Geffen, G. M., & Geffen, L. B. (1995). Event-relatedpotentials during covert orientation of visual-attention: Effects of cuevalidity and directionality. Biological Psychology, 41, 183–202.
Yamaguchi, S., Tsuchiya, H., & Kobayashi, S. (1994). Electroencephalo-graphic activity associated with shifts of visuospatial attention. Brain,117, 553–562.
Yamaguchi, S., Tsuchiya, H., & Kobayashi, S. (1995). Electrophysio-logical correlates of age effects on visuospatial attention shift. Cog-nitive Brain Research, 3, 41–49.
Yamaguchi, S., Yamagata, S., & Kobayashi, S. (2000). Cerebral asym-metry of the ‘‘top-down’’ allocation of attention to global and localfeatures. Journal of Neuroscience, 20, RC72.
Yantis, S., & Serences, J. T. (2003). Cortical mechanisms of space-basedand object-based attentional control. Current Opinion in Neurobiol-ogy, 13, 187–193.
(Received September 8, 2004; Accepted March 23, 2005)
Dimension specificity in attentional control 439