generating outlines of generic shapes by mining … outlines of generic shapes by mining feature...
TRANSCRIPT

Generating Outlines of Generic Shapes by mining Feature Points
MUHAMMAD SARFRAZ
Department of Information Science Kuwait University
Adailiya Campus, P.O. Box 5969, Safat 13060 KUWAIT
[email protected] Abstract: - An approach, based on conic splines, is proposed here for capturing image outlines of generic shapes. It has various phases including extracting outlines of images, mining feature points from the detected outlines, and curve fitting. The idea of particle swarm optimization has been incorporated to optimize the shape parameters in the description of the conic spline. The method ultimately produces optimal results for the approximate vectorization of the digital contours obtained from the generic shapes. Demonstrations also make the essential part of the paper. Keywords:Imaging; optimization; particle swarm optimization; generic shapes; curve fitting 1 Introduction Capturingand vectorizing outlines of images is one of the important problems of computer graphics, vision, and imaging. Various mathematical and computational phases are involved in the whole process. This is usually done by computing a curve close to the data point set [3-5, 23-25]. Computationally economical and optimally good solution is an ultimate objective to achieve the vectorized outlines of images for planar objects.
The representation of planar objects in terms of curves has many advantages. For example, scaling, shearing, translation, rotation and clipping operations can be performed without any difficulty. Although a good amount of work has been done in the area [10-16, 35], it is still desired to proceed further to explore more advanced and interactive strategies. Most of the up-to-date research has tackled this kind of problem by curve subdivision or curve segmentation. Curve segmentation is advantageous in a way that it gives a rough geometry of the shape. Approaches used to achieve this task, in the literature, are polygonal approximations [8, 13], circular arc approximations [10, 15, 17, 18, 22] and approximations using cubics or higher order spline functions [2,14, 24-25].
A non-parametric dominant point detection algorithm was proposed in [8], it used the dominant points for polygonization of digital curves. The problem with polygonal approximation is that these approaches are rarely used for shape analysis. A combination of line segments and circular arcs for
object approximation is used in [17, 18]. A scheme to construct a curvature continuous conic spline is proposed in [15]. This approach presented the conic spline curve fitting and fairing algorithm using conic arc scaling. The smoothing is done by removing unwanted curvature extrema. Similar algorithms for data fitting by arc spline curves are presented in [22]. A method for segmentation of curves into line segments and circular arcs by using types of breakpoints is proposed in [10]. Advantage of this technique is that it is threshold free and transformation invariant. Five categories of breakpoints have been defined. The line and conic segmentation and merging is based on these breakpoints.
Least square fitting is mostly adopted in approximations, which uses splines and higher order polynomials. Some approaches are based on active contour models known as snakes. These techniques are also based on parameterization. Enhancement to the scheme by adjusting both number and positions of control points of the active spline curve is shown in [14]. This scheme is based on curve approximation using iterative optimization with B-spline curve by squared distance minimization.
Another way, other than parametric form, is to use implicit form of the polynomial. Curve reconstruction problem is solved by approximating the point clouds using implicit B-spline curve [12]. The authors have used trust region algorithm in optimization theory as minimization heuristics. Techniques described for fitting implicitly defined algebraic spline curves and surfaces to scattered
WSEAS TRANSACTIONS on SYSTEMS Muhammad Sarfraz
E-ISSN: 2224-2678 584 Volume 13, 2014
data by simultaneously approximating points and associated normal vectors are proposed in [19, 20, 21].
The proposed work, in this paper, is inspired by the fast growing area of soft computing. A good amount of literature has been produced on various heuristics [30-33] for optimization problems. This work is inspired by an optimization algorithm based on particle swarm optimization (PSO) [36-38]. It motivates the author to an optimization technique proposed for the outline capture of planar images. It is an extension of the work in [35]. In this paper, the data point set represents any generic shape whose outline is required to be captured. We present an iterative process to achieve our objectives. The algorithm comprises of various phases to achieve the target. First of all, it finds the contour of the gray scaled bitmap image. The next phase detects the corner points on the digital contour of the generic shape under consideration. The idea of PSO is then used to fit a generalized cubic spline which passes through the corner points. It globally optimizes the shape parameters in the description of conic spline to provide a good approximation to the digital curve.
In most of the cases, corner points are not enough to approximate the digital object and hence some more points are also needed. These points are known as break points as they are used to break a segment for better approximation. For onwards discussion, the set of corner points together with the break points will be called as the set of significant points. In the fourth phase of the proposed algorithm, for each iteration, we will insert a point as knot in every piece (if needed) in a manner that the distance, d, of the computed point on the spline curve and its corresponding contour point is greater than a threshold ε. This process increases the set of significant points and hence needs multilevel coordinate search to be employed again for the updated set of significant points to fit an optimal spline curve. This process continues until it rectifies the solution and helps towards the objective optimization in a global fashion. We stop the iterative process when all d’s are less than ε. The proposed spline method, using multilevel coordinate search, ultimately produces optimal results for vectorizing the digital contour of the generic shapes. It provides an optimal fit as far as curve fitting is concerned.
The organization of the paper is as follows, Section 2 discusses about pre-processing step which includes finding the boundary of planar object and corner detection algorithm for finding the significant points. Section 3 is about the
interpolant form of conic spline curves and computation of its associated tangents. The process of Particle Swarm Optimization (PSO) is explained in Section 4. Overall methodology of curve fitting is explained in Section 5. Demonstration of the proposed scheme is presented in Section 6. Finally, the paper is concluded in Section 7.
2 Preprocessing The proposed scheme starts with first finding the
boundary of the generic shape and then using the output to find the corner points or the significant points. Forthcoming Sections 2.1 and 2.2 will explain these phases. 2.1 Finding Boundary of Generic Shapes The image of the generic shape can be acquired either by scanning or by some other mean. The quality of scanned images is dependent upon factors such as paper quality and scanning resolution. For a better resolution and paper quality, one can achieve a better image.
The aim of boundary detection is to produce an object’s shape in graphical or non-scalar representation. Chain codes [12-16] are the most widely used representations. Other well-known representations are syntactic techniques, boundary approximations and scale-space techniques. The benefit of using chain code is that it gives the direction of edges. The boundary points are selected as contour points based on their corner strength and fluctuations.
Chain codes were initially proposed by Freeman [12-16]. The methodology adopted to detect the boundary is by encoding the shape boundary as a sequence of connected line segments of specified length and direction. The direction of a segment is coded using either 4-connected or 8-connected schemes. In both schemes, initially a point is selected using either horizontal or vertical scan. After this, the 4-connected or 8-connected component algorithm is applied. Both algorithms work in intensive stack formulation. In case of 4-connected, four neighboring points are analyzed. These points are pixel positions that are right, left, above and below the current pixel. The second method is a little more complex. In this method the set of neighboring positions to be tested include the four diagonal pixels as well. The point set obtained after this step is known as contour of the object.
We simply convert a grayscale image to binary after normalizing the intensity in the range [0, 1].
WSEAS TRANSACTIONS on SYSTEMS Muhammad Sarfraz
E-ISSN: 2224-2678 585 Volume 13, 2014

The image is then converted to binary at a specified threshold. If the threshold is 0.4, pixel intensity with less than 0.4 is white pixel and others are black pixels. Outline extraction from a binary image is a simple procedure. Any pixel with a pixel value 0 (black) is a boundary point if any of its four neighbors has a pixel value 1 (white). The four neighboring pixels are upper, lower, left and right pixels. This procedure will extract all boundary points (inner or outer boundary points) from the binary image. At this point it is difficult to distinguish that which boundary point belongs to which boundary loop (in case of more than one boundary loops) and also the sequence of boundary points (clockwise) around a loop is unknown.
Fig. 1.Freeman’s chain code.
To arrange the extracted boundary points in a sequence (clockwise direction), a boundary tracing is performed, starting from the left-top boundary pixel. The algorithm [25] for boundary tracing is as follows:
1. Search the top left boundary point; this point P0 has the minimum column and row value of all the boundary points. Point P0 is the starting point of the boundary tracing. Define a variable dir using Freeman’s chain code [7] as shown in Fig. 1. It stores the direction of the previous move along the boundary from previous point to the current point. Assign dir = 3.
2. Search the 3x3 neighborhood of the current point in an anti-clockwise direction as shown in Fig. 2, Starting the neighborhood search in the direction given below:
a. (dir + 7) mod 8 if dir is even. b. (dir + 6) mod 8 if dir is odd.
Update the dir value as per new point found.
3. If the current boundary point Pn is equal to the point P0 then stop. Otherwise repeat step 2.
4. The detected boundary points are represented by points P0 . . . . Pn-1. This makes a one loop of boundary points.
5. Delete the detected boundary points P0 . . . . Pn-1 from the list of extracted boundary points and repeat Steps 1 to 4 for other boundary loops till all boundary loops have been traced.
Demonstration of the method can be seen in Fig.
3(b) which is the contour of the bitmap image shown in Fig. 3(a).
Fig. 2. Neighborhood search sequence. 2.2 Detecting Corner Points Corners in digital images give important clues for the shape representation and analysis. Generally objects information can be represented in terms of its corners, which play a very vital role in object recognition, shape representation and image interpretation [1, 16, 22-25, 39]. These are the points that partition the boundary into various segments. In this paper, the strategy of getting these points is based on the method proposed in [39]. The proposed corner detector detects corners by using combination of one rectangle and two ellipses (REE) with different parameter settings in their descriptions. REE combination slides along the boundary of the shape and records number of boundary points in each rectangle and ellipses. REE setup represents both local and global views of the image outline. The proposed technique presents a natural corners detection methodology to detect all true corners accurately. This technique is consistent with human vision system. The details of this procedure are explained in the following paragraphs.
Proposed technique of detecting feature (corner) points is based on rectangle R1 and two ellipses E1,1 and E1,2 sliding along the given curve. The ellipses E1,1 and E1,2 are embedded in R1 such that
0
7 6
5
4
3 2
1
WSEAS TRANSACTIONS on SYSTEMS Muhammad Sarfraz
E-ISSN: 2224-2678 586 Volume 13, 2014

1,21,11 EER ⊃⊃ . The geometry of the rectangle and two ellipses is shown in Fig. 4. To gather information about the locality of neighboring curve points, proposed technique uses rectangle and ellipses shown having common centre at pi.
(a)
(b)
(c)
Fig. 3. Pre-processing Steps: (a) Original Image, (b) Outline of the image, (c) Feature points mined.
The mathematical relations of R1 and two
ellipses E1,1 and E1,2 is described in Equation (1). The geometric structure of Fig. 4 has been adopted as follows:
• The length and width of the rectangle R1 are considered to be the lengths 2A1 and 2B1 respectively.
• The semi minor axis and semi major axis of the ellipse E1,1 are considered to be the lengths 3A1/4 and B1 respectively.
• The semi minor axis and semi major axis of the ellipse E1,2 are considered to be the lengths 3A1/4 and B1/2 respectively.
''2/4/3
4/322
112,1
111,1
111
SslopeBAEBAE
BAR
=
××=
××=×=
θ
π
π (1)
Fig. 4. Geometrical Structure of the Feature (Corner) point detection algorithm.
The length of rectangle and semi-major axes of
ellipses lie in the direction of slope ‘S’. Hence the width of rectangle and semi minor axes of ellipses lie at right angle to the slope ‘S’ of the contour with center at curve point pi, 1 ≤ i ≤ n, where n is the total number of contour points. Slope of curve point at pi is determined along the line drawn by calculating mean of five points (including pi) on both sides of pi.
By taking boundary point pi as center, the direction of rectangle R1 is adjusted along major axes of the Ellipses. Similarly, ellipses E1,1 and E1,2 having same center at pi are configured with same procedure. Thus .
Fig. 5. Snapshot of the Algorithm in action.
1,21,11 EER ⊃⊃
WSEAS TRANSACTIONS on SYSTEMS Muhammad Sarfraz
E-ISSN: 2224-2678 587 Volume 13, 2014
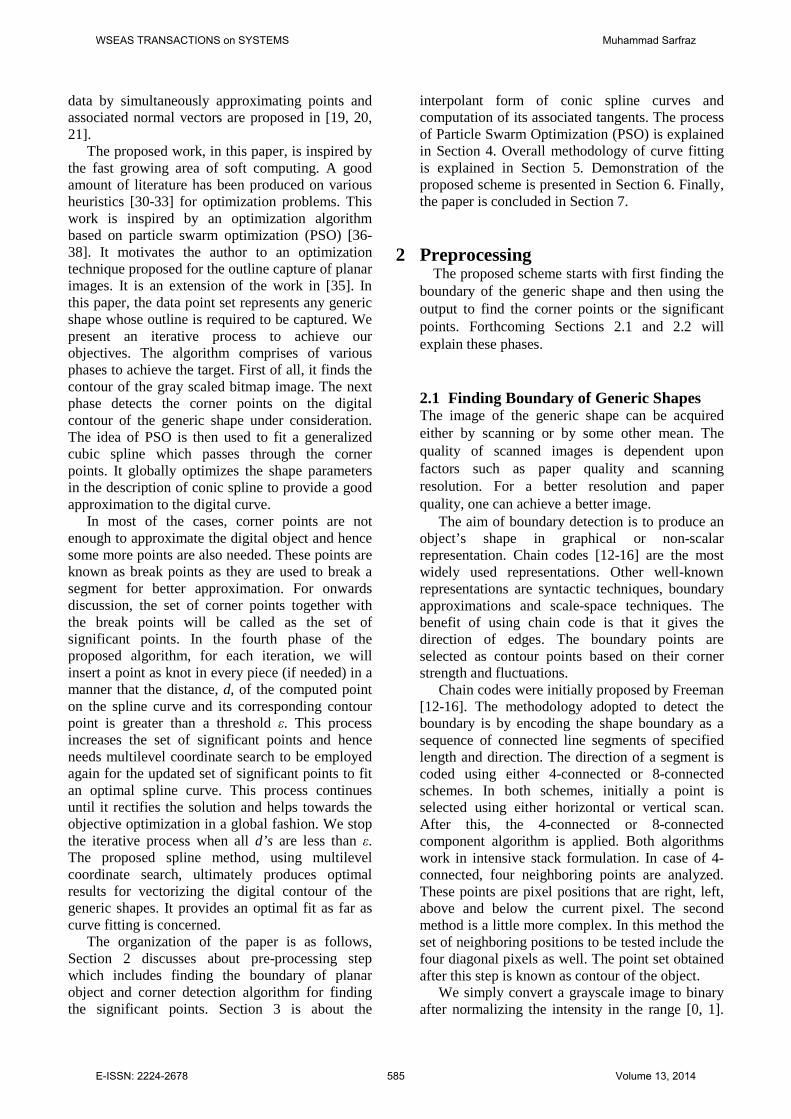
Combination of rectangle and ellipses slides on given curve and number of adjacent points for rectangle and each ellipse. It is recorded from Aip − to Aip + which lie in the area R1, E1,1, and E1,2. Let nR1,i, nE1,1,i and nE1,2,i describe the total number of curve points in rectangle R1, ellipses E1,1, and E1,2 respectively, with centers at ith boundary point. For example in Fig. 5, nR1,i = 23, nE1,1,i = 18, and nE1,2,i = 15. Values of nR1,i, nE1,1,i and nE1,2,i, for each boundary point, are finally used while marking the absolute positions of corner points.
(a) (b)
(c) (d)
Fig. 6.Some snapshots of the Algorithm for irregular boundary. (a), (b) are not qualified by G, and (c) is rejected due threshold ‘η’, and (d) qualifies.
Proposed algorithm adopts natural corner detection methodology by combining three levels of views. Combination of one rectangle and two ellipses represents three special views of curve points. It traces number of counts nR1,i, nE1,1,i and nE1,2,i, for each boundary point. It calculates sufficient information to mark the absolute corners. Rectangle 1R represents global view of boundary points and allowing only those boundary points for which 01,11 =− ER . These contour points are represented by the set G1 as follows:
{ }
{ }
−=
=−=
iii
iii
nEnRPG
nEnRPG
,1,1,1,11
,1,11
:Or
0: (2)
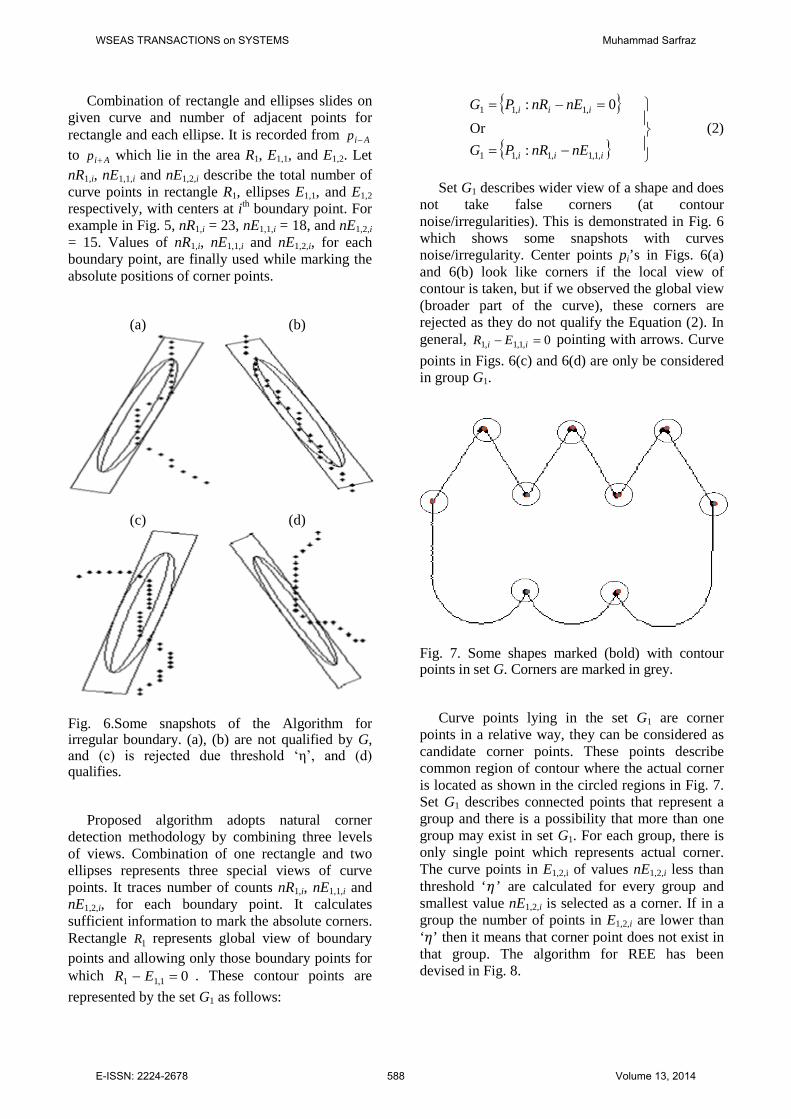
Set G1 describes wider view of a shape and does
not take false corners (at contour noise/irregularities). This is demonstrated in Fig. 6 which shows some snapshots with curves noise/irregularity. Center points pi’s in Figs. 6(a) and 6(b) look like corners if the local view of contour is taken, but if we observed the global view (broader part of the curve), these corners are rejected as they do not qualify the Equation (2). In general, 0,1,1,1 =− ii ER pointing with arrows. Curve points in Figs. 6(c) and 6(d) are only be considered in group G1.
Fig. 7. Some shapes marked (bold) with contour points in set G. Corners are marked in grey.
Curve points lying in the set G1 are corner points in a relative way, they can be considered as candidate corner points. These points describe common region of contour where the actual corner is located as shown in the circled regions in Fig. 7. Set G1 describes connected points that represent a group and there is a possibility that more than one group may exist in set G1. For each group, there is only single point which represents actual corner. The curve points in E1,2,i of values nE1,2,i less than threshold ‘ ’ are calculated for every group and smallest value nE1,2,i is selected as a corner. If in a group the number of points in E1,2,i are lower than ‘ ’ then it means that corner point does not exist in that group. The algorithm for REE has been devised in Fig. 8.
WSEAS TRANSACTIONS on SYSTEMS Muhammad Sarfraz
E-ISSN: 2224-2678 588 Volume 13, 2014

For each contour point Pi Count ,i,ii , nE, nEnR 2,11,1,1 End For G = Make groups of connected points in G For each group Gk
End For
Fig. 8. Algorithm for REE.
2.3. Experimental Results The demonstration of the algorithm is made on Fig. 3(b). The corner points of the image are shown in Fig. 3(c). Some more experiments can be seen in Figs. 10 and 11. 3 Curve Fitting and Spline The curve fitted, to the corner points, by a conic spline is a candidate of best fit, but it may not be a desired fit. This leads to the need of introducing some shape parameters in the description of the conic spline. This section deals with a form of conic spline. It introduces shape parameters u’s in the description of conic spline defined as follows:
22
21
2
)1(2)1()1(2)1(
)(θθθθ
θθθθ+−+−+−+−
= +
i
iiii
uPUuP
tP ,
where
i
itt h
ttt
ii
)()(),[ 1
−=
+θ , iii tth −= +1 ,
( )2
iii
WVU
+= ,
and
i
iiii u
DhPV += ,
i
iiii u
DhPW 1
1+
+ −= .
Here Pi and Pi+1 are feature corner points of the ith piece of the digital contour. Di and Di+1 are the corresponding tangents at feature corner points.
Obviously, the parameters ui's, when equal to 1, provide the special case of quadratic spline. Otherwise, these parameters can be used to loose or tight the curve. This paper proposes an evolutionary technique, namely particle swarm optimization (PSO), to optimize these parameters so that the curve fitted is optimal.
To construct the parametric conic spline interpolant on the interval ],[ 0 ntt , we have
mi RF ∈ , ni ,......,1,0= , as interpolation data, at
knots ti , ni ,......,1,0= . The tangent vectors Di’s
can be calculated using some appropriate method like the one of arithmetic means [33].
Since, the objective of the paper is to come up with an optimal technique which can provide a decent curve fit to the digital data. Therefore, the interest would be to compute the curve in such a way that the sum square error of the computed curve with the actual curve (digitized contour) is minimized.
(a)
(b)
Fig. 9. Results of conic scheme for ellipses: (a) Fitted Outline of the image, (b) Fitted Outline of the image with intermediate points.
WSEAS TRANSACTIONS on SYSTEMS Muhammad Sarfraz
E-ISSN: 2224-2678 589 Volume 13, 2014

4 Particle Swarm Optimization A novel population based optimization approach, called Particle Swarm Optimization (PSO) approach, has been used in this paper. PSO was introduced first in 1995 by Eberhart and Kennedy [36-38]. This new approach features many advantages; it is simple, fast and can be coded in few lines. Also, its storage requirement is minimal. Our interest is to optimize the values of curve parameters u such that the defined curve fits as close to the original contour segments as possible. Note that we apply PSO independently for each segment of a contour that we have identified using corner points. PSO is applied sequentially on each of the segments, generating an optimized fitted curve for each segment. The algorithm is run until the maximum allowed time is reached, or an optimal curve fitting is attained. Derivation of the PSO algorithm and underlying theory can be found in [36-38]. 5 Proposed Approach Once we have the bitmap image of a generic shape, the boundary of the image can be extracted using the method described in Section 2. After the boundary points of the image are found, the next step is to detect corner points as explained in Section 2. This corner detection technique assigns a measure of ‘corner strength’ to each of the points on the boundary of the image. This step helps to divide the boundary of the image into n segments. Each of these segments is then approximated by interpolating spline described in Section 3. The initial solution of spline parameters (u) are randomly selected within the range [-1, 1].
After an initial approximation for the segment is obtained, better approximations are obtained through PSO to reach the optimal solution. We experiment with our system by approximating each segment of the boundary using the generalized conic spline of Section 3. Each boundary segment is approximated by the spline. The shape parameters (u) in the conic spline provide greater flexibility over the shape of the curve. These parameters are adjusted using PSO to get the optimal fit.
For some segments, the best fit obtained through iterative improvement may not be satisfactory. In that case, we subdivide the segment into smaller segments at points where the distance between the boundary and parametric curve exceeds some predefined threshold. Such points are
termed as intermediate points. A new parametric curve is fitted for each new segment.
(a)
(b)
(c)
Fig. 10. Pre-processing Steps: (a) Original Image, (b) Outline of the image, (c) Corner points achieved, (d) Fitted Outline of the image.
WSEAS TRANSACTIONS on SYSTEMS Muhammad Sarfraz
E-ISSN: 2224-2678 590 Volume 13, 2014
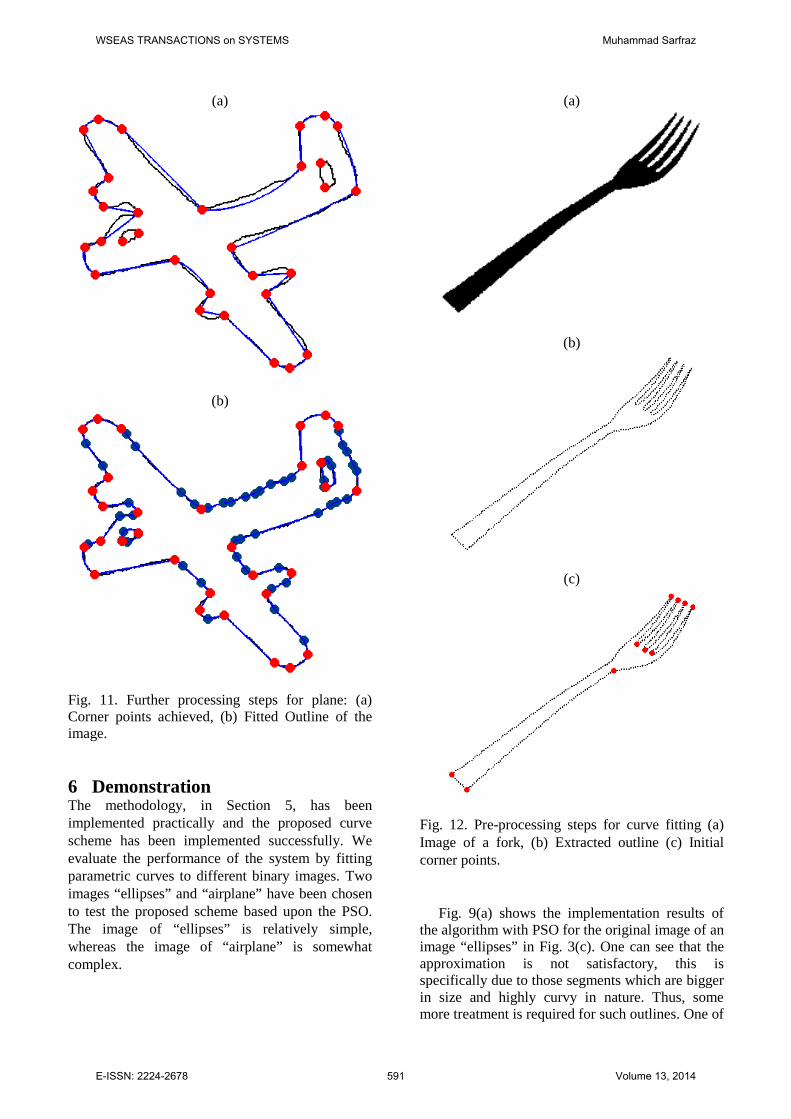
(a)
(b)
Fig. 11. Further processing steps for plane: (a) Corner points achieved, (b) Fitted Outline of the image. 6 Demonstration The methodology, in Section 5, has been implemented practically and the proposed curve scheme has been implemented successfully. We evaluate the performance of the system by fitting parametric curves to different binary images. Two images “ellipses” and “airplane” have been chosen to test the proposed scheme based upon the PSO. The image of “ellipses” is relatively simple, whereas the image of “airplane” is somewhat complex.
(a)
(b)
(c)
Fig. 12. Pre-processing steps for curve fitting (a) Image of a fork, (b) Extracted outline (c) Initial corner points.
Fig. 9(a) shows the implementation results of the algorithm with PSO for the original image of an image “ellipses” in Fig. 3(c). One can see that the approximation is not satisfactory, this is specifically due to those segments which are bigger in size and highly curvy in nature. Thus, some more treatment is required for such outlines. One of
WSEAS TRANSACTIONS on SYSTEMS Muhammad Sarfraz
E-ISSN: 2224-2678 591 Volume 13, 2014
the ideas is to insert some intermediate points, this is demonstrated in Fig. 9(b) where excellent result has been achieved. The idea of how to insert intermediate points is not explained here due to limitation of space. It will be explained in a subsequent paper.
Fig. 10(a) shows another image of an airplane. Its outline is shown in Fig. 10(b). Fig. 11(a) demonstrates the corner detection of feature points. The implementation result of the algorithm with PSO can be seen in Fig. 11(b), this is the fitted outline at the final iteration.
(a)
(b)
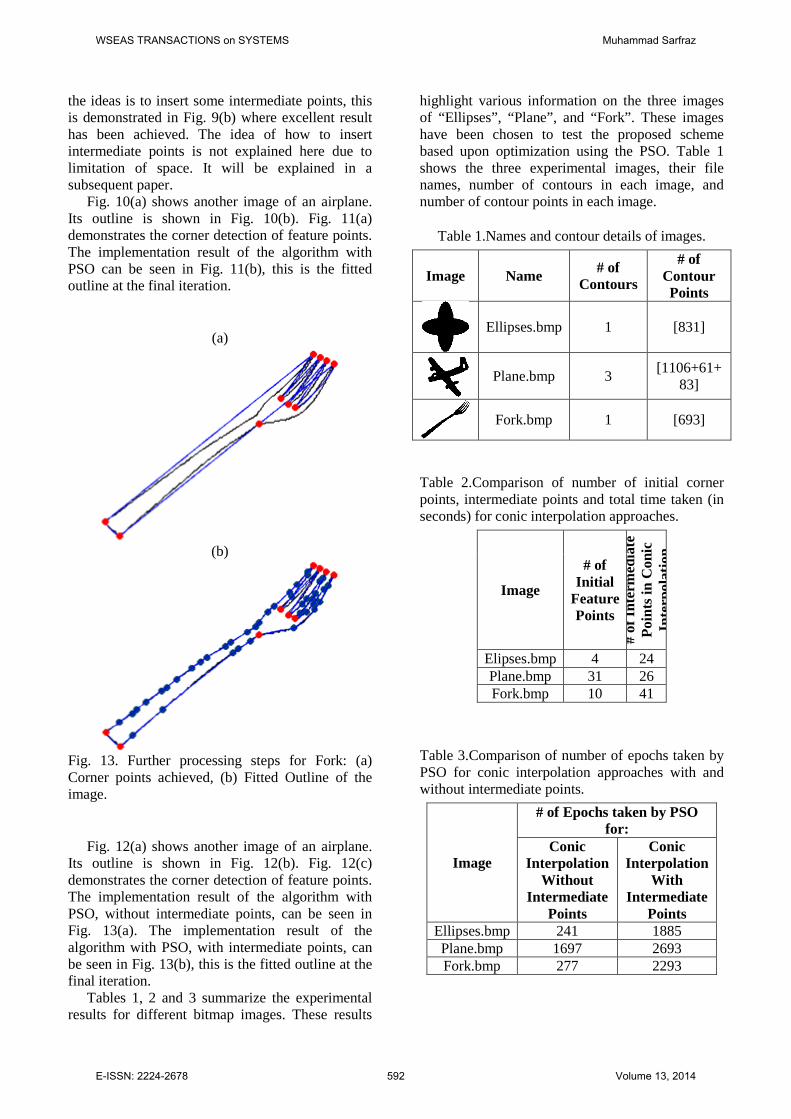
Fig. 13. Further processing steps for Fork: (a) Corner points achieved, (b) Fitted Outline of the image.
Fig. 12(a) shows another image of an airplane. Its outline is shown in Fig. 12(b). Fig. 12(c) demonstrates the corner detection of feature points. The implementation result of the algorithm with PSO, without intermediate points, can be seen in Fig. 13(a). The implementation result of the algorithm with PSO, with intermediate points, can be seen in Fig. 13(b), this is the fitted outline at the final iteration.
Tables 1, 2 and 3 summarize the experimental results for different bitmap images. These results
highlight various information on the three images of “Ellipses”, “Plane”, and “Fork”. These images have been chosen to test the proposed scheme based upon optimization using the PSO. Table 1 shows the three experimental images, their file names, number of contours in each image, and number of contour points in each image.
Table 1.Names and contour details of images.
Image Name # of Contours
# of Contour Points
Ellipses.bmp 1 [831]
Plane.bmp 3 [1106+61+
83]
Fork.bmp 1 [693]
Table 2.Comparison of number of initial corner points, intermediate points and total time taken (in seconds) for conic interpolation approaches.
Image
# of Initial
Feature Points
# of
Inte
rmed
iate
Po
ints
in C
onic
In
terp
olat
ion
Elipses.bmp 4 24 Plane.bmp 31 26 Fork.bmp 10 41
Table 3.Comparison of number of epochs taken by PSO for conic interpolation approaches with and without intermediate points.
Image
# of Epochs taken by PSO for:
Conic Interpolation
Without Intermediate
Points
Conic Interpolation
With Intermediate
Points Ellipses.bmp 241 1885 Plane.bmp 1697 2693 Fork.bmp 277 2293
WSEAS TRANSACTIONS on SYSTEMS Muhammad Sarfraz
E-ISSN: 2224-2678 592 Volume 13, 2014
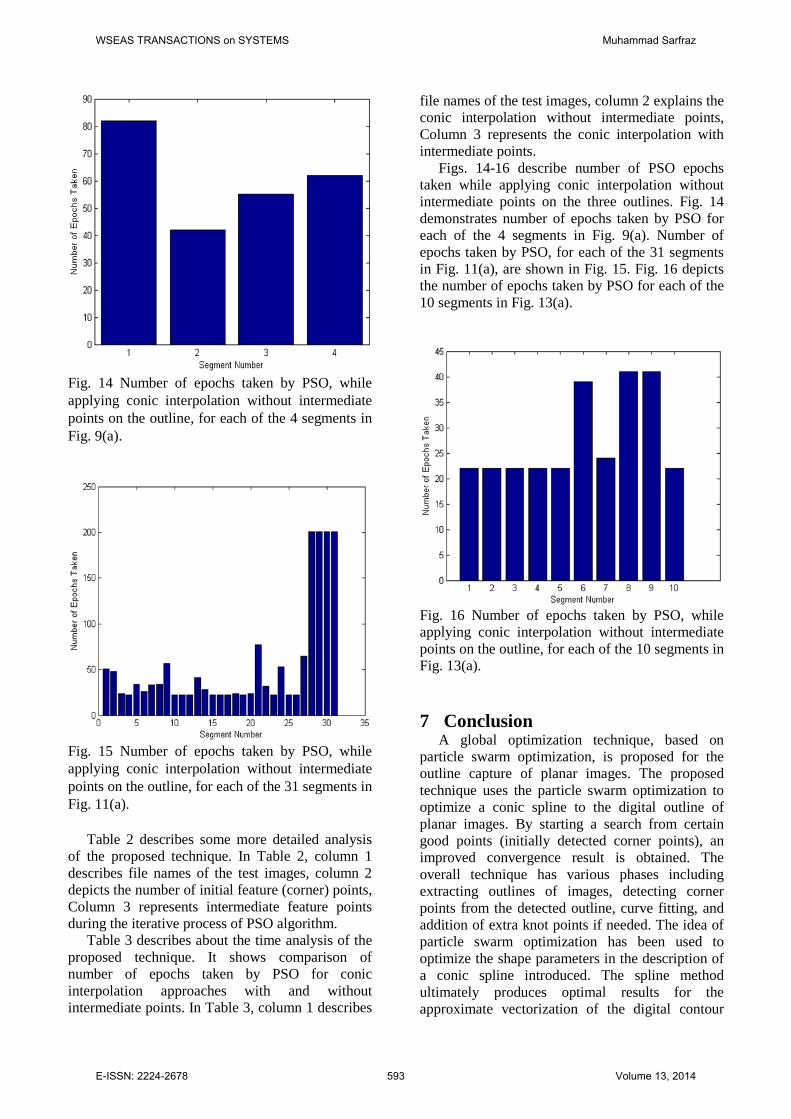
Fig. 14 Number of epochs taken by PSO, while applying conic interpolation without intermediate points on the outline, for each of the 4 segments in Fig. 9(a).
Fig. 15 Number of epochs taken by PSO, while applying conic interpolation without intermediate points on the outline, for each of the 31 segments in Fig. 11(a).
Table 2 describes some more detailed analysis of the proposed technique. In Table 2, column 1 describes file names of the test images, column 2 depicts the number of initial feature (corner) points, Column 3 represents intermediate feature points during the iterative process of PSO algorithm.
Table 3 describes about the time analysis of the proposed technique. It shows comparison of number of epochs taken by PSO for conic interpolation approaches with and without intermediate points. In Table 3, column 1 describes
file names of the test images, column 2 explains the conic interpolation without intermediate points, Column 3 represents the conic interpolation with intermediate points.
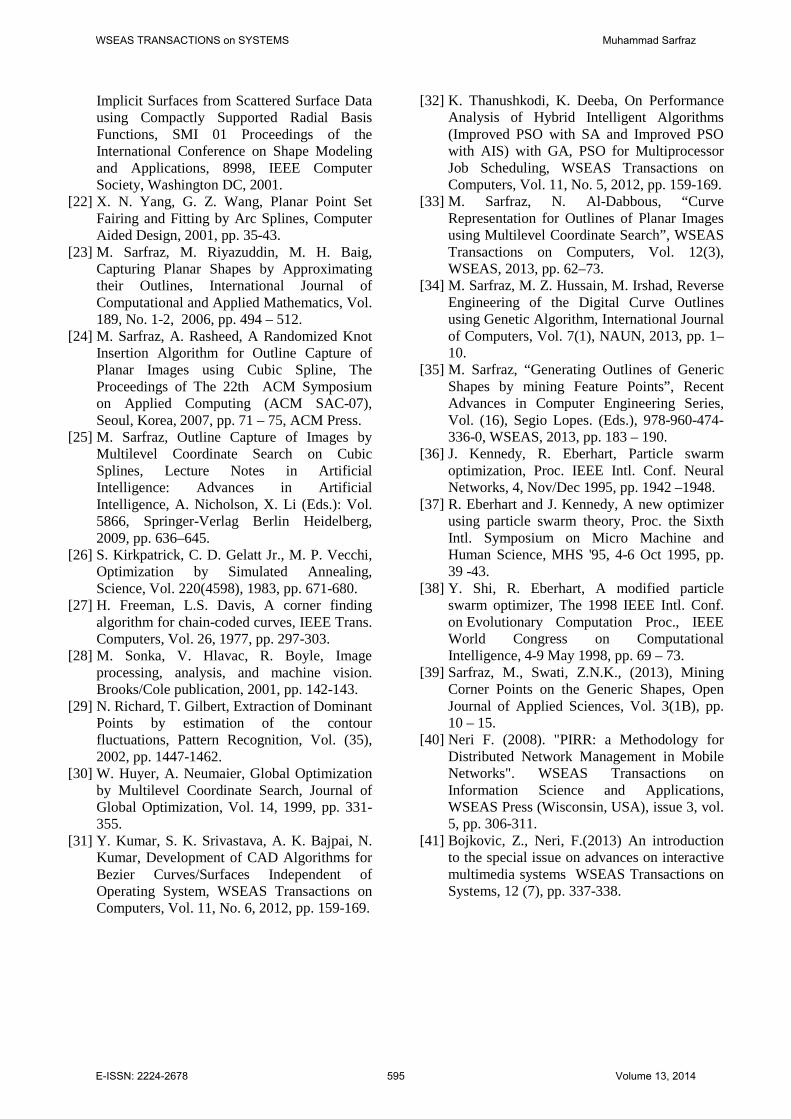
Figs. 14-16 describe number of PSO epochs taken while applying conic interpolation without intermediate points on the three outlines. Fig. 14 demonstrates number of epochs taken by PSO for each of the 4 segments in Fig. 9(a). Number of epochs taken by PSO, for each of the 31 segments in Fig. 11(a), are shown in Fig. 15. Fig. 16 depicts the number of epochs taken by PSO for each of the 10 segments in Fig. 13(a).
Fig. 16 Number of epochs taken by PSO, while applying conic interpolation without intermediate points on the outline, for each of the 10 segments in Fig. 13(a). 7 Conclusion
A global optimization technique, based on particle swarm optimization, is proposed for the outline capture of planar images. The proposed technique uses the particle swarm optimization to optimize a conic spline to the digital outline of planar images. By starting a search from certain good points (initially detected corner points), an improved convergence result is obtained. The overall technique has various phases including extracting outlines of images, detecting corner points from the detected outline, curve fitting, and addition of extra knot points if needed. The idea of particle swarm optimization has been used to optimize the shape parameters in the description of a conic spline introduced. The spline method ultimately produces optimal results for the approximate vectorization of the digital contour
WSEAS TRANSACTIONS on SYSTEMS Muhammad Sarfraz
E-ISSN: 2224-2678 593 Volume 13, 2014

obtained from the generic shapes. It provides an optimal fit with an efficient computation cost as far as curve fitting is concerned. The proposed algorithm is fully automatic and requires no human intervention. The author is also thinking to apply the proposed methodology for another model curve namely cubic. It might improve the approximation process. This work is in progress to be published as a subsequent work. Moreover, one can also think to work on the methodology from the mobile perspectives [40] and developing interactive multimedia systems [41]. Acknowledgement The author is thankful for the helpful comments of Referees. This work was supported by Kuwait University, Research Grant No. [WI 05/12]. References: [1] D. Chetrikov, S. Zsabo, A Simple and
Efficient Algorithm for Detection of High Curvature Points in Planar Curves, The Proceedings of the 23rd Workshop of the Australian Pattern Recognition Group, 1999, pp. 1751-2184.
[2] M. Sarfraz, Representing Shapes by Fitting Data using an Evolutionary Approach, International Journal of Computer-Aided Design & Applications, Vol. 1(1-4), 2004, pp 179-186.
[3] A. Goshtasby, Grouping and Parameterizing Irregularly Spaced Points for Curve Fitting, ACM Transactions on Graphics, 2000, pp. 185-203.
[4] M. Sarfraz, M. A. Khan, An Automatic Algorithm for Approximating Boundary of Bitmap Characters, Future Generation Computer Systems, 2004, pp. 1327-1336.
[5] M. Sarfraz , Some Algorithms for Curve Design and Automatic Outline Capturing of Images, International Journal of Image and Graphics, 2004, pp. 301-324.
[6] Z. J. Hou, G.W.Wei, A New Approach to Edge Detection, Pattern Recognition, 2002, pp. 1559-1570.
[7] P. Reche, C. Urdiales, A. Bandera, C. Trazegnies, F. Sandoval, Corner Detection by Means of Contour Local Vectors, Electronic Letters, Vol. 38, No. 14, 2002.
[8] M. Marji, P. Siv, A New Algorithm for Dominant Points Detection and Polygonization of Digital Curves, Pattern Recognition, 2003, pp. 2239-2251.
[9] M. Sarfraz, Designing Objects with a Spline, International Journal of Computer Mathematics, Taylor & Francis, Vol. 85, No. 7, 2008.
[10] Wu-Chih Hu, Multiprimitive Segmentation Based on Meaningful Breakpoints for Fitting Digital Planar Curves with Line Segments and Conic Arcs, Image and Vision Computing, 2005, pp. 783-789.
[11] H. Kano, H. Nakata, C. F. Martin, Optimal Curve Fitting and Smoothing using Normalized Uniform B-Splines: A Tool for Studying Complex Systems, Applied Mathematics and Computation, 2005, pp. 96-128.
[12] Z. Yang, J. Deng, F. Chen, Fitting Unorganized Point Clouds with Active Implicit B-Spline Curves, Visual Computer, 2005, pp. 831-839.
[13] G. Lavoue, F. Dupont, A. Baskurt, A New Subdivision Based Approach for Piecewise Smooth Approximation of 3D Polygonal Curves, Pattern Recognition, 2005, pp. 1139-1151.
[14] H. Yang, W. Wang, J. Sun, Control Point Adjustment for B-Spline Curve Approximation, Computer Aided Design, 2004, pp. 639-652.
[15] X. Yang, Curve Fitting and Fairing using Conic Spines, Computer Aided Design, 2004, pp. 461-472.
[16] M. Sarfraz, Computer-Aided Reverse Engineering using Simulated Evolution on NURBS, International Journal of Virtual & Physical Prototyping, Vol. 1, No. 4, 2006, pp. 243-257.
[17] J. H. Horng, An Adaptive Smooting Approach for Fitting Digital Planar Curves with Line Segments and Circular Arcs, Pattern Recognition Letters, 2003, pp. 565-577.
[18] B. Sarkar, L. K. Singh,, D. Sarkar, Approximation of Digital Curves with Line Segments and Circular Arcs using Genetic Algorithms, Pattern Recognition Letters, 2003, pp. 2585-2595.
[19] J. C. Carr, R. K. Beatson, J. B. Cherrie, T. J. Mitchell, W. R. Fright, B. C. McCallum, T. R. Evans, Reconstruction and Representation of 3D Objects with Radial Basis Functions, Proceedings of SIGGRAPH 01, 6776, 2001.
[20] B. Juttler, A. Felis, A Least Square Fitting of Algebraic Spline Surfaces, Advance Computer Mathematics, 2002, pp. 135-152.
[21] B. S. Morse, T. S. Yoo, D. T. Chen, P. Rheingans, K. R. Subramanian, Interpolating
WSEAS TRANSACTIONS on SYSTEMS Muhammad Sarfraz
E-ISSN: 2224-2678 594 Volume 13, 2014
Implicit Surfaces from Scattered Surface Data using Compactly Supported Radial Basis Functions, SMI 01 Proceedings of the International Conference on Shape Modeling and Applications, 8998, IEEE Computer Society, Washington DC, 2001.
[22] X. N. Yang, G. Z. Wang, Planar Point Set Fairing and Fitting by Arc Splines, Computer Aided Design, 2001, pp. 35-43.
[23] M. Sarfraz, M. Riyazuddin, M. H. Baig, Capturing Planar Shapes by Approximating their Outlines, International Journal of Computational and Applied Mathematics, Vol. 189, No. 1-2, 2006, pp. 494 – 512.
[24] M. Sarfraz, A. Rasheed, A Randomized Knot Insertion Algorithm for Outline Capture of Planar Images using Cubic Spline, The Proceedings of The 22th ACM Symposium on Applied Computing (ACM SAC-07), Seoul, Korea, 2007, pp. 71 – 75, ACM Press.
[25] M. Sarfraz, Outline Capture of Images by Multilevel Coordinate Search on Cubic Splines, Lecture Notes in Artificial Intelligence: Advances in Artificial Intelligence, A. Nicholson, X. Li (Eds.): Vol. 5866, Springer-Verlag Berlin Heidelberg, 2009, pp. 636–645.
[26] S. Kirkpatrick, C. D. Gelatt Jr., M. P. Vecchi, Optimization by Simulated Annealing, Science, Vol. 220(4598), 1983, pp. 671-680.
[27] H. Freeman, L.S. Davis, A corner finding algorithm for chain-coded curves, IEEE Trans. Computers, Vol. 26, 1977, pp. 297-303.
[28] M. Sonka, V. Hlavac, R. Boyle, Image processing, analysis, and machine vision. Brooks/Cole publication, 2001, pp. 142-143.
[29] N. Richard, T. Gilbert, Extraction of Dominant Points by estimation of the contour fluctuations, Pattern Recognition, Vol. (35), 2002, pp. 1447-1462.
[30] W. Huyer, A. Neumaier, Global Optimization by Multilevel Coordinate Search, Journal of Global Optimization, Vol. 14, 1999, pp. 331-355.
[31] Y. Kumar, S. K. Srivastava, A. K. Bajpai, N. Kumar, Development of CAD Algorithms for Bezier Curves/Surfaces Independent of Operating System, WSEAS Transactions on Computers, Vol. 11, No. 6, 2012, pp. 159-169.
[32] K. Thanushkodi, K. Deeba, On Performance Analysis of Hybrid Intelligent Algorithms (Improved PSO with SA and Improved PSO with AIS) with GA, PSO for Multiprocessor Job Scheduling, WSEAS Transactions on Computers, Vol. 11, No. 5, 2012, pp. 159-169.
[33] M. Sarfraz, N. Al-Dabbous, “Curve Representation for Outlines of Planar Images using Multilevel Coordinate Search”, WSEAS Transactions on Computers, Vol. 12(3), WSEAS, 2013, pp. 62–73.
[34] M. Sarfraz, M. Z. Hussain, M. Irshad, Reverse Engineering of the Digital Curve Outlines using Genetic Algorithm, International Journal of Computers, Vol. 7(1), NAUN, 2013, pp. 1–10.
[35] M. Sarfraz, “Generating Outlines of Generic Shapes by mining Feature Points”, Recent Advances in Computer Engineering Series, Vol. (16), Segio Lopes. (Eds.), 978-960-474-336-0, WSEAS, 2013, pp. 183 – 190.
[36] J. Kennedy, R. Eberhart, Particle swarm optimization, Proc. IEEE Intl. Conf. Neural Networks, 4, Nov/Dec 1995, pp. 1942 –1948.
[37] R. Eberhart and J. Kennedy, A new optimizer using particle swarm theory, Proc. the Sixth Intl. Symposium on Micro Machine and Human Science, MHS '95, 4-6 Oct 1995, pp. 39 -43.
[38] Y. Shi, R. Eberhart, A modified particle swarm optimizer, The 1998 IEEE Intl. Conf. on Evolutionary Computation Proc., IEEE World Congress on Computational Intelligence, 4-9 May 1998, pp. 69 – 73.
[39] Sarfraz, M., Swati, Z.N.K., (2013), Mining Corner Points on the Generic Shapes, Open Journal of Applied Sciences, Vol. 3(1B), pp. 10 – 15.
[40] Neri F. (2008). "PIRR: a Methodology for Distributed Network Management in Mobile Networks". WSEAS Transactions on Information Science and Applications, WSEAS Press (Wisconsin, USA), issue 3, vol. 5, pp. 306-311.
[41] Bojkovic, Z., Neri, F.(2013) An introduction to the special issue on advances on interactive multimedia systems WSEAS Transactions on Systems, 12 (7), pp. 337-338.
WSEAS TRANSACTIONS on SYSTEMS Muhammad Sarfraz
E-ISSN: 2224-2678 595 Volume 13, 2014