generalization schwartz social values scale 1...
TRANSCRIPT
Generalization Schwartz Social Values Scale 1
RUNNING HEAD: Generalization Schwartz Social Values Scale
Generalization and Limitation of the Schwartz Social Values Scale
Jesse M. Dostal
Cleveland States University
2004
Generalization Schwartz Social Values Scale 2
ABSTRACT
This study sought to examine the Schwartz Social Values Scale (SVS) through Classic
Multidimensional Scaling (CMDS) and Weighted Multidimensional Scaling (WMDS)
models which were to be analyzed via Multiple Discriminant Functions (MDF) and
binary logistic regression. A normal adult sample from the United States, Poland, and
Romania, composed of 98, 201, and 198 respondents respectively, was obtained. Due to
issues of potential non-representative sampling in the three countries of interest, multiple
linear regression was used to control for the effect of demographics on the individual
SVS item scores. ALSCAL could not produce a satisfactory WMDS model, but did
produce CMDS models for each country individually that were satisfactory. These
models tended to offer partial support of the Schwartz theory. The implications of the
results are that the SVS’s structure of item interrelationships differ by culture, but the
grouping of values into 10 domains and two semi-bidirectional dimensions was
supported.
Generalization Schwartz Social Values Scale 3
EXECUTIVE SUMMARY
That peoples of separate cultures differ may be seen as almost self evident in
nature. However, the quantification of these differences requires that the researcher find
an objective measure theoretically tied to culture. Since values are an integral part of
culture, this study focuses upon the quantification of cultural values. In so doing it
provides reviews of three survey based methods of quantifying values; those of Rokeach,
Hofstede, and Schwartz. Schwartz’s (1992) questionnaire and model, in the form of the
Schwartz Values Scale (SVS), were selected as the instrument of choice due to it high
level of validation and refined inclusion of previous researchers’ work.
Schwartz (1992) specifies that the 56 value statements of the SVS fall into ten
primary motivation categories. Further, he states that these ten primary motivators are
arranged into two bidirectional dimensions; Self-Transcendence versus Self-
Enhancement, and Conservation versus Openness to Change.
However, the SVS is typically analyzed via oblique factor analysis or more
commonly Smallest Space Analysis (an early form of Multidimensional Scaling (MDS)
commonly referred to as, SSA). Both of these analysis techniques rely on principal
components; as such they have several limitations. That is, these techniques can be very
resource intense due to the large number of respondents required to achieve reliability.
One of this study’s objectives is to examine the use of alternate MDS models that may
require fewer respondents and provide an alternative examination of the SVS structure of
inter-item association. As such, the hypotheses were tested that MDS solutions would be
congruent between cultures and would verify the prior description of the Schwartz model.

Generalization Schwartz Social Values Scale 4
Respondents for this study were composed of a normal adult sample of 98
Americans, 201 Poles, and 198 Romanians. This study’s sample was obtained through
convenience sampling methods. Questionnaires were put through a rigorous double back
translation process. In this case, double back translation means that each country’s
questionnaire was first composed in English and translated to its respective language.
These translations were then back translated into English and any item showing heavy
divergence from the original composition was translated again via another native speaker
of the language. These new translations repeated the process of back translation to
English through another back translator. This process was repeated until the
questionnaires provided clear, concise, versions of the original English copy.
The analysis of this study’s data was composed of four phases. Phase One
involved the alignment of demographic questions for later statistical control. That is, the
respondents having been obtained through convenience methods were potentially non-
representative of each country’s population as a whole. As such, Phase Two of this study
involved the production of linear regression models for which the independent variables
were the demographics and the dependent variable for each item of the SVS. Phase
Three of the analysis involved the production of correlation matrices composed of SVS
items for which the data were standardized residuals from the previously mentioned
multiple regression models. These correlation matrices were then used to generate a
Weighted Multidimensional Scaling (WMDS) model using the data from all three
countries and Classic Multidimensional Scaling (CMDS) models for each country
individually. The final phase of this analysis, Phase Four, involved the use of Multiple
Discriminant Functions (MDF) to test for the presence of Schwartz’s (1992) ten primary
Generalization Schwartz Social Values Scale 5
motivation types and binary logistic regression to test for the presence of the semi-
bidirectional dimensions. Finally, the distances generated for each country via CMDS
and the original indices of association for each individual country were tested for
congruence.
The Second Phase of this analysis, the demographic control of SVS items via
linear regression, indicated that the demographics rarely achieved significance. Results
of the Third Phase of this analysis indicate that the WMDS model was a poor fit to the
data. However, the CMDS models generated for each country separately offered
satisfactory solutions. The use of MDF to classify the value statement of the SVS via
Schwartz’s (1992) model received mixed support. Indices of association between the
correlation matrices and CMDS distances by country were low (under .25 in all cases).
The implication of ALSCAL failing to produce a satisfactory WMDS model for
the SVS values of all three countries and the illustration of poor congruence between the
indices of association between the countries’ CMDS distances and association
coefficients suggests that each country of interest in this study maintains unique value
structures. This suggests that the primary motivation and semi-bidirectional dimension
systems is better conceptualized as a taxonomy or classification of values. When the
various CMDS models were tested via MDF and binary logistic regression, the Schwartz
(1992) model of primary motivations appears relatively intact in the three countries.
Notably, this taxonomy was best supported within the Unites States CMDS space, with
Poland coming in second, and Romania third. Implications of these results are discussed.
Generalization Schwartz Social Values Scale 6
INTRODUCTION
In an age of increasing globalization many of the social sciences have been faced
with the impact of differing cultural backgrounds upon the particular issues being
investigated. Fortunately, methodologies and theoretical paradigms are available to
quantify and explain these differences. This study seeks to address the measurement of
culture through a commonly used method, questionnaires, and through a commonly
measured component of cultures, values. The purpose of this study is to measure the
interrelationships of values in a cross-cultural context. Specifically, the present paper
will test the use of one of these measures, the Schwartz Social Values Scale (SVS), under
a different analysis model than was originally employed.
Justification for this study’s choice of methodology and system of measurement
for culture will be considered on in the course of this discussion. First to be discussed in
this study will be the method of data collection or instrumentation and the underlying
theory of culture and its relationship to values. Specifically, the first discussion will
address the mode of data collection, questionnaires, and why they are used. The second
discussion will give an overview of available theoretic models describing the data
collected.
Data Collection and Theory
If one is to measure culture then an operational definition is needed. A common
definition would be “the values, ethics, rituals, traditions, material objects, and services
produced or valued by the members of a society (Solomon, 1999).” This definition
suggests that one could measure a variety of subjects. For example, one could count the
number of, material objects, such as cars possessed by members of a culture, amount of a
Generalization Schwartz Social Values Scale 7
given behavior, as in the amount of time driving cars, or rate the importance of a given
object or behavior, as in rating the importance of automobiles or the importance of
driving, or one does when driving a car could be recorded. The methodologies that could
be used to collect these data, raw counting, ethnography, or content analysis, are
unimportant in this discussion as there is fundamental flaw associated with information
collected: lack of generalizability.
The concept of generalizability could be defined as whether the outside research
is applicable to a new user’s situation (Guion, 1998). In and of themselves these
behavioral data are situation specific. How does one know that behavior as measured in
one situation takes on the same meaning in another with regard to overall cultural
influence? These behaviors may be bound to the situation. Furthermore, problems are
incurred researching these behaviors. If respondent recall is used as a measure reliability
tends to be a problem (Hurt, Joseph, & Cook, 1977; Goldsmith & Hofacker, 1991).
Further, from an intercultural standpoint values take on meaning only if they maintain the
same definition by way of content. That is, a value is only meaningful if it maintains the
same definition across several cultures (Bardi & Schwartz, 2001; Sverko, 1995).
However, how can the researcher be assured that the definitions of each value within the
context of a behavioral measure will maintain the same meaning across cultures? This
problem of generalizability of measures is very similar to the one faced by innovativeness
and opinion leadership research at a time when a similar debate raged in consumer
psychology. The solution in this case is the same: a higher level of abstraction is needed.
This abstraction might be obtained by using questionnaires in which respondents
rate the overall importance of a given value. Remember that values are integral to the

Generalization Schwartz Social Values Scale 8
definition of culture and therefore serve as a proxy for it. From this viewpoint, values are
presumed to encapsulate the aspirations of individuals and societies: they pertain to what
is desirable, to deeply engrained standards that determine future directions and justify
past actions (Braithwaite & Scott, 1991; Bardi & Schwartz, 2001). The end result is that
quantified values can be seen as a distillation of culture. Further, differences in the rated
importance of values between two cultures allow researchers to identify the unique
influences of social structure and culture.
What Are Values?
There are two competing views with regard to values. The first is that a value is
an attribute of the person “doing the valuing.” The second is that a value is an attribute
of an “object receiving the valuing.” To clarify, the first statement assumes that a value
is based in the world of the individual or consensus of individuals and exists as a sort of
conceptual definition. The second statement assumes that a value is an inherent feature
of an object or class of objects. This study, like most other studies of social values, takes
the former as opposed to the latter assumption (Braithwaite & Scott, 1991). From this
viewpoint, values are defined as desirable transituational goals that vary in importance by
individual (Braithwaite & Scott, 1991; Schwartz & Bardi, 2001). Further, values serve as
guiding principles in people’s lives (Schwartz & Bardi, 2001). Under this methodology
the assumption is made that by aggregating the values espoused by individuals, one may
understand values within a given society. Note that this is a common assumption made
by most cross-cultural researchers when studying values with relation to cultures
(Braithwaite & Scott, 1991).
Generalization Schwartz Social Values Scale 9
The Quantification of Values
Now that values have been defined, a discussion of how they are quantified is
presented. This discussion will present the theoretical justification for the choice of
instruments to measure values and the selection of cultures to be studied. In the past
three measures of values, those of Rokeach, Hofstede, and Schwartz, have been used in
the study of values within Poland and the United States. Each of these measures compare
the importance of values for these cultures. Note that at the date of this study no known
research has been performed on the quantification of values for the third country of
interest, Romania.
The Rokeach Approach.
Rokeach is seen as dominating values research due to his contributions to
clarifying and integrating the initial concepts of this area (Braithwaite & Scott, 1991;
Kelly, Silverman, & Cochrane, 1972). The Rokeach Value Survey relies on the rank
ordering of 18 terminal values and 18 instrumental values (Solomon 2002; Braithwaite &
Scott, 1991). A terminal value relates to a desirable end state of existence and its
worthiness of attainment. An instrumental value relates to an enduring belief regarding a
certain mode of conduct or manner of behaving. Both are viewed as necessary in the
assessment of a single value. The theoretic rationale supporting the use of two types of
statements revolves around the idea that while desirable end states are important so are
the means of getting to these end states (Waters 1999; Schwartz, 1992).
The values of Rokeach’s Values Survey are found in column one of Table 1. All
values presented therein are rated on a mono-dimensional four-point scale. An
incomplete sentence stem was, “It is now or will be important for me to (value

Generalization Schwartz Social Values Scale 10
iteration).” Note that value iterations were used for instrumental values in a different
form; examples are presented in the second column of Table 1. Rokeach’s Values
Survey is composed of fifty-four items (Ferreir-Marques & Miranda, 1995). Finally, a
four-point scale is used to measure the importance of each value iteration. These four
points are anchored as follows:
1. Of little or no importance
2. Of some importance
3. Important
4. Very Important
There are two criticisms of Rokeach’s Values Survey. The first concern is that
this particular instrument is not considered to explain all of the values present in a
culture. Second, Rokeach’s Values Survey is considered to be biased towards Western
values (Spini, 2003; Braithwaite & Scott, 1991). That is, this instrument views values
from a Western viewpoint alone, with only limited influences from Eastern viewpoints.
The Hofstede Approach.
Another values researcher that has looked at both Poland and the United States is
Hofstede. The Hofstede Values Survey relies on five independent value dimensions
(International Business Center, 2003; Middleton & Jones, 2000; Randall, Hwo, &
Pawelk, 1993). Unlike the values measures of Schwartz and Rokeach, Hofstede’s values
survey relies on bi-directional dimensions1. These five value dimensions are Power
Distance, Uncertainty Avoidance, Individualism versus Collectivism, Masculinity versus
1 To clarify the concept of bi-directionality, Hofstede’s measure assumes that, Individualism is the opposite of Collectivism. Further, this measure presupposes that, as one values Individualism less, one must value Collectivism more.

Generalization Schwartz Social Values Scale 11
Femininity, and Long versus Short Term Time Orientation. For the purposes of later
discussion each of these dimensions is defined in the following paragraphs
Power Distance is the extent to which a society accepts unequal distribution of
power in institutions and organizations. Although inequality may exist within any culture
the degree to which it is accepted varies considerably between cultures. Power Distance
measures how subordinates respond to power and authority. In high-Power Distance
countries, subordinates tend to be afraid of their bosses, and bosses tend to be
paternalistic and autocratic. In low-power distance countries, subordinates are more
likely to challenge bosses and bosses tend to use a consultative style.
The index of Uncertainty Avoidance focuses on the level of tolerance for
uncertainty and ambiguity within a society for unstructured situations. When Uncertainty
Avoidance is strong, a culture tends to perceive unknown situations as threatening and
people tend to avoid them. This creates a rule-oriented society that institutes laws, rules,
regulations, and controls in order to reduce the amount of ambiguity. A low Uncertainty
Avoidance rating indicates the country has less concern about ambiguity and uncertainty
and has more tolerance for a variety of opinions. Societies that are less rule-oriented,
more readily accept change, take more, and greater risks are archetypal of a low rating on
the Uncertainty Avoidance index.
The next index in the Hofstede Values Survey is Individualism versus
Collectivism. In Individualistic cultures, people are expected to look out for themselves.
Everyone contributes to a common goal, but with little mutual pressure. The typical
attributes endorsed in cultures associated with a high score on this index are personal
time, freedom, and challenge. In Collectivistic countries, people are bound together
Generalization Schwartz Social Values Scale 12
through strong personal and protective ties based on loyalty to the group during one’s
lifetime and often beyond. Further, in Collectivistic cultures the typical attributes of
importance are training, physical condition, and the use of skills.
Masculinity versus Femininity is the fourth index in Hofstede’s model. Where
the masculine index is high people tend to value having a high opportunity for earnings,
getting the recognition they deserve when doing a good job, having an opportunity for
advancement to higher-level jobs, and having challenging work to do in order to derive a
sense of accomplishment. In cultures where feminine values are more important, people
tend to value good working relationships with their supervisors. Feminine values under
this framework involve working with people, cooperating well with one another, living in
an area desirable to themselves and to their families, and having the security of working
for their company as long as they want.
The final index in Hofstede’s model is Long-Term versus Short-Term Time
Orientation. A Long-Term Time Orientation is characterized by persistence and
perseverance, a respect for hierarchical status based relationships (how status is assigned
is not addressed in the available literature), thrift, and a sense of shame. A short-term
time orientation is marked by a sense of security and stability, protection of one’s
reputation, a respect for tradition, and a reciprocation of greetings; favors and gifts. As a
side note, this final index was added later on to the Hofstede framework.
Like Rokeach’s Value’s Survey, limitations to Hofstede’s system also exist.
Hofstede’s values system was produced only within modernized Western nations. As
such, it remains unclear how Eastern cultures would fare under this system. The next
criticism revolves around whether each value maintains the same definition between
Generalization Schwartz Social Values Scale 13
individual cultures and if the overall structure of the values holds up between cultures
(Schwartz, 1992). To elucidate, it is unknown whether each culture defines each value
the same way, or if these values maintain the same relationship between the individual
dimensions. A further criticism of Hofstede’s measure is that when constructing his
values survey Hofstede relied on a single multinational corporation. The validation of a
values measure on one set of people cross-nationally limits the generalizability through
selection bias. That is, no evidence has been presented explaining whether these values
as developed, measured, and originally normed by Hofstede reflect those of only that
multi-national corporation, or the cultures in which they were measured as a whole.
Additional criticisms revolve around the measure’s age, the data used to generate
Hofstede’s schema are from 1967 through 1973. Thus, there is the danger that these
values reflect only the thinking of that period alone (Schwartz, 1994). This system of
values also makes a rather large assumption that bi-directional scales are appropriate with
regard to individualism versus collectivism and masculinity versus femininity. No
validation of the bi-directionality assumption of these scales can be found within the
literature at hand. As such, this instrument is only as good as this assumption (Schwartz,
1992). A final factor that is not addressed is the independence of each dimension with
regard to the other dimensions. Are these dimensions interrelated? If these dimensions
are interrelated then to what degree are they interrelated? Further, what would be the
impact of these intercorrelations (Schwartz, 1992)?
Schwartz.
For Schwartz and many cross-cultural researchers, cultural values are measured
on two levels: individual and cultural. The individual level variables in values research
Generalization Schwartz Social Values Scale 14
measure the psychological dynamics from the framework of the lowest unit of culture,
one person. Cultural level variables measure the solutions societies produce for
regulating human activities (Schwartz, 1994). Note that this study will be measuring
values at the individual level and not at the cultural level. While the interrelationships of
the SVS values for Poland and the United States at the individual level are present in
Schwartz (1992) in the form of an SSA perceptual space map, the need to justify the
countries used in this study (addressed later) via aggregate value profiles are only
available at the cultural level. As such, this distinction is presented here not only to
clarify what level of measurement is being used, but also to inform the reader for a later
portion of this introduction.
The results of the cultural and individual levels of measurement on the SVS share
a multitude of similarities. The same questionnaires are used to measure values at both
levels. Further, the same analysis is used to observe the grouping of values for each
level, smallest space multiple dimensional scaling based on Pearson correlation
coefficients, also known as Smallest Space Analysis. This allows a graphical
presentation of the intercorrelations of each scale as well as raw coefficients. Further, it
solves the problem of assumed bi-directionality found in The Hofstede Values Scale by
allowing all of the values to intercorrelate freely.
Unlike the measures of Rokeach and Hofstede, the SVS was validated with data
from two groups, schoolteachers and college undergraduates. Further, the SVS’s
validation took place in a multitude of cultures. While convenience in obtaining a
sample, on the part of the primary researchers, was an issue in the selection of the two
validation groups other factors also played a role in this decision. First, teachers are one

Generalization Schwartz Social Values Scale 15
of the primary groups to communicate values and students are typically seen as the target
of this communication. Second, both populations are easily accessible to researchers. As
such, secondary researchers would be able to easily be able to find respondents when
comparing results (Schwartz, 1994; 1992).
The SVS is composed of 56 single values that represent 10 overarching primary
motivation types. Their descriptions are present in Table 2 of this study. Each item is
measured on a scale composed of nine points varying from negative one to seven. Seven
represents “supreme importance”, zero represents “not important”, finally, negative one
represents “opposed to my values.” Note that two through six remain unlabelled through
this instrument. The SVS is provided in its English form is provided in Appendix A.
At a higher level of abstraction, the primary motivation types may be distilled into
two basic value dimensions (Schwartz, 1992). These dimensions are Self-Transcendence
versus Self-Enhancement and Openness to Change versus Conservation. The
relationship of these value dimensions to the individual level motivation types is
illustrated along with the position of each primary motivation type showing their inter-
associations in Figure 1. Self-Transcendence is akin to Hofstede’s Collectivism, while
Self-Enhancement is similar to Collectivism. Openness to Change is just that, it relates
how accepting an individual is to new ideas and viewpoints as well as how likely he or
she is to change their viewpoint. Conservation is the degree of how steadfast a person is
with regard to her beliefs.
Note that these semi-bipolar value dimensions are not fully orthogonal in terms of
their inter-associations (hence the term, “semi-bipolar”). Primary motivation types and
the values that define them, found at the edges of these value dimensions may share
Generalization Schwartz Social Values Scale 16
commonalities in their interpretation. That is, primary motivation types are not purely
liberal or conservative with regard to Openness to change. For example, from Figure 1,
the primary motivation type “Universalism” is not fully open with regard to Openness to
change; rather it would appear to have a strong relationship to Conservation as well,
especially when one moves progressively more clockwise through the motivation types2.
When evaluating cultures at the aggregate level another set of values is used.
These values are Mastery, Hierarchy, Conservation, Harmony, Egalitarian Commitment,
Intellectual Autonomy, and Affective Autonomy. The meanings of each of these values
are taken from the 1994 study by Schwartz.
Mastery emphasizes active mastery of the social environment through self-
assertion. Mastery promotes active efforts to modify one’s surroundings, and get ahead
of people.
Hierarchy is the recognition of a legitimate social ladder and related resource
allocation. Concepts related to Hierarchy would be humbleness and accepting ones place
within society.
Conservation revolves around maintenance of the status quo, propriety, and
avoiding any actions that might disturb the traditional order. Under the rubric of
Conservation falls the idea that the needs of the individual are inseparable from the needs
of the group.
Harmony emphasizes harmony with nature. Nature, in this case does not
necessarily imply the natural world of plants and animals. Rather, Nature means a world
at peace and social justice. This value stands as the antithesis of value types that promote
2 This is not covered by Schwartz directly in his 1992 or 1994 studies; rather it is an inference drawn from his works for the purposes of discussion.

Generalization Schwartz Social Values Scale 17
actively changing the world through exploitation of people or resources and through self-
assertation. Harmony is further refined through its neutral stance with regard to
individualism as opposed to collectivism.
Egalitarian Commitment is typified by benevolence on a voluntary level for other
people. Note that this denotes a commitment that can occur among equals and not the
commitment that is represented by the value type Hierarchy.
Intellectual Autonomy is typified by freedom of intellectual choice and self-
direction. This value type, like Affective Autonomy, which is described later, represents
the degree to which a society views the individual to be entitled to pursue his or her own
individual cerebral interests or desires.
Affective Autonomy relates directly to hedonic pleasure and stimulation. As
previously mentioned it also represents the degree of importance a society puts on the
individual pursuing his or her own physical and emotional desires.
The use of a single questionnaire to explain values at two levels of measurement
could be seen as to beg the question of equivalence between the cultural and individual
level values. Schwartz (1994) does not go so far as to explain how the two structures
relate to each other at the empirical level. However, in both cases the same questionnaire
is used to generate an analysis. Further, Schwartz does allude to the use of correlation
between the two sets of primary motivations’ distances as empirical proof that the two
relate to one another. Unfortunately, he does not elucidate on this point, as such the
available literature is somewhat wanting in defining what the exact relationship between
the two levels of measurement is.
Generalization Schwartz Social Values Scale 18
There are really only two major criticisms of the SVS. The first involves the use
of only two groups in its development. It remains unclear if using only undergraduate
students and teachers provides a representative sample of each society. However, in a
world of limited resources the coordination of two different populations across 21
different nations would probably be enough in and of itself to exhaust innumerable
research teams that have studied this scale.
Further, the SVS relies on two relatively complex forms of statistical analysis,
SSA and Oblique Factor analysis. Both SSA and Factor analysis rely on the same core
analytic technique; principle components analysis (Astill, 1998). Principle components
analysis relies on a tremendous number of respondents. Ratios of 5 or 10 respondents to
each question suggest that sample ranges must not fall lower than 280 subjects for the
SVS and really should exceed 570 for the purposes of generalizability of the factor
structure to the population as a whole (Hair et al., 1998). While the acquisition of 570
respondents does not seem unreasonable, when one considers that comparable numbers
of respondents must be acquired in two or more countries it becomes increasingly
difficult to put together a meaningful study.
Justification of Instrumentation
The prior arguments against the SVS not withstanding, several reasons to use this
instrument exist. Specifically, these arguments are that the SVS has shown itself to build
on while overcome the failings of the systems developed by Rokeach and Hofstede and
that this measure has been shown more stable in terms of its values maintaining the same
definition across cultures.

Generalization Schwartz Social Values Scale 19
Further, the ten value types of the SVS have been shown to be nearly identical in
terms of meaning both across and within cultures. Note that this classification system
pertains to both Eastern and Western societies (Bardi & Schwartz, 2001; Schwartz, 1992;
Schwartz, 1994). This means that the internal definitions may in fact reflect the universal
values associated with the human condition and that their levels of importance vary by
the culture being measured. Evidence of this type has not been reported for Rokeach or
Hofstede’s systems.
Schwartz (1992) addresses the issue of value definitions remaining constant
among cultures through two methods: double back translation and constant interrelations
of each value regardless of the culture studied. First, Schwartz employed a rigorous
process of back translation in the process of implementing his study in each culture.
While this does not show that the definitions are necessarily the same it does show that
each culture was guaranteed to be exposed to the comparable instruments. Second, the
relationships of each value as measured through SSA remained relatively constant. That
is, each value with regard to its interrelationship with each other value remained in
largely the same position. This rigorous study of interrelationships has given the SVS the
distinction of being called the most heavily studied values scale to date (Todd & Lawson,
2003; Bilsky, 2002). When both of the factor of rigorous back translation and the factor
of a constant structure of values are taken into consideration, this tends to indicate that
each culture when exposed to the same instrument produced a highly similar profile.
The Values Scale as developed by Rokeach, Hofstede’s Values Scale, and the
SVS are to some degree interrelated. Two pieces of evidence will be given that draw
these instruments together. The first type of evidence is conceptual and relates to

Generalization Schwartz Social Values Scale 20
Rokeach’s Values Scale. The second piece of evidence is empirical and relates to
Hofstede’s scale.
At a very basic level these scales are interrelated in that they are meant to measure
the same construct: values. However, at a more refined level these three value scales
may be seen as interrelated through their development. As previously stated, Rokeach is
seen as the father of modern values research (Braithwaite & Scott, 1991; Kelly et al.,
1972). The SVS is based on Rokeach’s work and is viewed as an extension and
refinement thereof (Braithwaite & Scott, 1991). Additionally, the SVS does not exclude
the prior research of Rokeach and Hofstede; instead it tends to build on it. The use of the
levels of abstraction with Openness to Change versus Conservation and Self-
Transcendence versus Self-Enhancement allows compatibility with Rokeach. Further, in
the validation process that Schwartz employed (1994) he compared his measure to
Hofstede’s, thus allowing both theoretical and empirical comparisons.
Empirical evidence tends to bind the Hofstede Values Scale and SVS too.
Schwartz (1994) provides correlation coefficients for his scale to that of Hofstede.
Conservatism from Hofstede’s scale is correlated with Schwartz’s Autonomy at .70.
Transcendence from Hofstede’s scale is correlated with Schwartz’s Hierarchy and
Mastery at .90. Hofstede’s individuality dimension is positively correlated with
Autonomy (both Affective and Intellectual) and negatively correlated with Conservation.
Unfortunately, Schwartz does not provide the exact level of correlation for the latter two
dimensions and does not give correlations for the remaining indices and dimensions.
However, all of the correlations reported by Schwartz are significant (p < .01).
Generalization Schwartz Social Values Scale 21
Schwartz (1994) goes further to state the relationship between Hofstede’s Values
Survey and the SVS at the individual level. He indicated that the individual level values
for Femininity are akin to Benevolence and Universalism, Masculinity is akin to Power,
Hierarchy, and Achievement with a broad concern for self-advancement, Autonomy
versus Conformity (parallel to Individual Openness to change and Conservation) from the
Schwartz scale is equivalent to Individualism vs. Collectivism from the Hofstede scale.
Conceptual and empirical evidence has been offered that the values measures of
Rokeach and Hofstede are related to the SVS. Two conclusions may be drawn from this;
one involves the choice of instrument and the other expectations regarding what that
instrument will find. First, no answers can be found regarding the criticism of the value
scales developed by Rokeach and Hofstede. The SVS however, has been shown to not
only overcome the bulk of these criticisms but to extend prior researchers’ work. Second,
as the SVS extends both the work of Rokeach and Hofstede it can be expected that
measurements made through these two instruments will most likely lead to differences on
the SVS. Further discussion of the shortcomings of the SVS, specifically regarding its
analysis, will be withheld until later in this study as they are to be addressed in the
hypothesis section. The remainder of this introduction, leading up to the hypotheses, will
revolve around the selection of cultures to be the subject of this study.
The Difference between American, Polish, and Romanian Culture
“It is widely believed that there are marked national differences in a number of
psychological characteristics. This holds in particular for values, because the existence of
national value patterns is considered almost self-evident (Sverko, 1995).” However, such
an assumption without empirical proof could not only be considered arrogant but also

Generalization Schwartz Social Values Scale 22
dangerous in the area of values research. That countries differ in many ways is simply a
matter of everyday observation. To be more precise, these differences seem to explain
the existence of the entities known as countries. This is particularly true of the
‘mentality’ of respective peoples, a complex set of beliefs, habits, attitudes, values, norms
and specific behavioral patterns that are attributed to them (Trentini & Muzuio, 1995).
Specifically, this section will address why it is expected that the SVS will detect
differences in Polish and U.S. culture.
Note that Romania was excluded from the prior paragraph involving cultures to
be used in this study. At the time of this study no known research has been performed on
Romanian culture with regard to values. As such, no direct evidence will be presented
regarding differences between Romania and the United States or Poland. The
justification for the use of Romania in this study is to provide contrast to measure of
values in U.S. and Poland, and to further the use of social values research.
Sverko (1995) measured the values of Australia, Belgium, English speaking
Canadians, French speaking Canadians, Croatia, Italy, Japan, Portugal, Poland, English
speaking South Africans, Afrikaans speaking South Africans, native language speaking
South Africans, and the United States using the Rokeach Values Survey. The results
were initially analyzed via hierarchical cluster analysis for which the cultures of interest
(nationality in this case was synonymous with culture; however, different languages
within the same country were considered as possibly representing different cultures) were
clustered by their value scores3. Within this analysis, Poland and the United States
3 Note that Hierarchical Cluster Analysis is an iterative (that is, step by step) process by which objects that are similar, as measured by attribute or action, in this case values, are grouped together. The sooner an object, or set of objects, falls within the same group the more likely they are to be similar in terms of the attributes that measured them.

Generalization Schwartz Social Values Scale 23
clustered at the last of 25 steps. The stability of this cluster solution was also tested. It
was found that the agglomerative schedule was considered stable as the use of alternate
hierarchical cluster methods revealed largely the same results.4 When an F-test was used
on the resulting value scores by cluster, they ranged from 35 to 334 (all at, p < 0.0001
level) indicating broad differences in the samples on each value.
This study also examined the alternative hypothesis that clustering was occurring
based on language alone as opposed to differences based on larger cultural issues. This
alternative hypothesis was not supported as English speaking and French Canadians
clustered within three steps while the various language speakers of South Africa clustered
within eight steps (one step for English and Afrikaans speaking South Africans, eight for
Native speaking and the English-Afrikaans speakers). Further, double back translations
were used to insure that the survey was properly translated, thus eliminating or at least
reducing bias associated with the language in which the survey was delivered. This study
offers evidence that differences will be found between Poland and U.S. on the SVS. As
previously discussed Schwartz based the SVS on Rokeach’s research. If the relationship
between Rokeach’s Values Survey and the SVS hold then one reasonably expect the SVS
to reproduce these results.
Scores from Hofstede’s Values Survey for Poland and the United States are
summarized in Table 3 of this study as obtained from a study by Braithwaite and Scott
(1991). Note that the values obtained for Poland are based on estimates derived from a
student sample while the sample from the United States was derived from the same
international corporation as the majority of the validation procedure. Poland was normed
4 Sverko (1995) did not present the alternate solutions in this case. As such, they are not discussed in this literature review.

Generalization Schwartz Social Values Scale 24
against the Canadian sample through equivalent sampling techniques. The largest
differences are found in the realm of Individualism versus Collectivism and Uncertainty
Avoidance. Not enough information is present from the existing sources to perform
significance testing (Middleton & Jones, 2000). However, evidence has been given
showing strong correlations between the SVS and Hofstede’s Values Survey, suggesting,
again, differing values profiles for the two nations. If statistical testing were available for
this one could no doubt be more certain; however, none are available for this particular
study.
A stronger set of evidence is presented by Robert, Probst, Martocchi, Drasgow, &
Lawler (2000). In their study, Hofstede’s Values Scale was used along with the statistical
testing in the form of structural equation modeling. Note that the Individuality versus
Collectivism scale was mixed with the Power Distance scale to form Horizontal
Collectivism, Horizontal Individualism, Vertical Individualism, and Vertical
Collectivism. High Power Distance represents vertical societies while low Power
Distance Represent horizontal societies in this case. Individualism versus Collectivism
retained their original meaning. The results of this study are summarized in Table 4.
Further, Hofstede’s Individualism versus Collectivism scale has been shown to
correlate with Gross National Product on a per capita basis at .87 for teachers and .81 for
students at the p < .01 level (Schwartz, 1994). At the time of this writing, the Gross
National Product, per capita, for the United States is $36,300 (Central Intelligence
Agency, 2003b), for Poland this figure is $9,500 (Central Intelligence Agency, 2003a)
and within Romania this figure is $7,600 (Central Intelligence Agency, 2004). This
means that if the relationship between per capita Gross National Product and

Generalization Schwartz Social Values Scale 25
Collectivism versus Individualism remains intact, that levels of Collectivism in the
United States, Poland, and Romania would be projected to be different. This should lead
to differences on the semi-bipolar dimensions of Self-Transcendence versus Self-
Enhancement on the SVS.
Perhaps the strongest piece of evidence that a differential in the values profiles
exists between the U.S. and Poland is offered by Schwartz himself. The United States
has been found to be high in Mastery under Schwartz’s framework and not especially
high on Affective Autonomy and Conservation. By contrast, Poland has been found to be
higher in Affective Autonomy than the United States and high overall in Conservation
(Schwartz, 1994). A full listing of the cultural level values profiles for Poland and the
United States under the framework of the SVS is presented in Table 5 of this study. Note
that these measurements were performed at the cultural level using the SVS. However,
recall that regardless of level of measurement the same questionnaire is used to measure
values under Schwartz’s model.
Hypotheses
So far this study has suggested that values are an integral part of culture.
Additionally, it has been suggested that despite some shortcomings, the SVS is the
instrument of choice in measuring values. Further, a variety of evidence indicates that
Poland and the United States are different with regard to their values profiles. Romania
remains unexplored in any study. This study seeks to address the shortcomings of SVS,
specifically its reliance on principal component based analyses. Fortunately, other
methods exist to analyze this data outside of SSA and oblique factor analysis.
Generalization Schwartz Social Values Scale 26
For instance, Todd & Lawson (2003) measured the values of frugal consumers
with the SVS and the interrelationships of its items via PROXSCAL. The findings of this
study supported a refinement the model in which the primary motivations of Conformity
and Tradition were merged into one classification. Unfortunately, this study did not use
all the items present in the full SVS. Additionally, only respondents from one culture,
citizens of New Zealand, were used. It remains to be seen if the interrelationships of the
items that compose the SVS as measured through MDS remain constant across cultures.
Smallest Space Analysis and oblique factor analysis rely on correlational analysis;
MDS is based upon dissimilarity between stimuli and is different. Specifically, MDS
relies on a structure of interrelationships between items while factor analysis relies on
covariation. It remains unclear if the primary motivations as specified by Schwartz
(1992, 1994) can be measured via dissimilarity based MDS.
From here a hypothesis may be formed:
Hypothesis 1: Values as measured by the SVS will maintain the same structure as
measured in prior studies regarding their primary motivations in the United States,
Poland, and Romania when using dissimilarity based MDS methodology.
Hypothesis 2: Values as measured by the SVS will maintain the same structure as
measured in prior studies with regard to the semi-bipolar dimension of Conservation
versus Openness to Change in the United States, Poland, and Romania when using
dissimilarity based MDS methodology.
Hypothesis 3: Values as measured by the SVS will maintain the same structure as
measured in prior studies with regard to the semi-bipolar dimension of Self-

Generalization Schwartz Social Values Scale 27
Transcendence versus Self-Enhancement in the United States, Poland, and Romania
when using dissimilarity based MDS methodology.
Generalization Schwartz Social Values Scale 28
Method
Respondents were recruited from three countries: the United States, Poland, and
Romania. Note that all respondents were obtained through convenience methods. That
is, friends, family, and contacts of friends and family groups were contacted and asked to
fill out each country’s survey. A total of 136 United States respondents, 266 Polish
respondents, and 258 Romanian respondents were recruited through this method. The
primary thrust of the data collection process was to obtain as many respondents as
possible regardless of subgroups with the caveats of not recruiting children, the
imprisoned, or the mentally ill. Specifically, as long as a respondent was 18 or older he
or she could be of any age, occupation, level of education, income level, or race. Note
that for reasons which will be discussed in the analysis portion of this study, listwise
deletion of respondents was imposed on the resultant data set. By listwise deletion, it is
meant that if a respondent failed to answer one question within the variables of interest
(for the purposes of this analysis the demographics sections and the SVS) he or she was
eliminated from the data set as a whole. This resulted in a final data set with 98 United
States respondents, 201 Polish respondents, and 128 Romanian respondents.
The surveys used in this study contained not only the SVS but also other
questions not directly related to measurement of values5. Outside of the SVS, the surveys
contained different items by country. This means that three separate instruments were
used. For instance, the Polish and Romanian survey contained the Marlowe-Crowne
5 It should be noted that one of the sections of the Polish survey contained the Marlowe-Crowne Social Desirability Scale (MCSDS) and the Social Desirability Scale-17 (SDS-17). The original intent of including these scales was the validation of social desirability measures outside the countries of their origin. However, the manipulation failed. The results of a MANCOVA, Multiple One-Way ANOVAs, and Logistic Regression showed no, or minimal differences between the fake good and normal groups on not only the MCSDS and SDS-17 but also the SVS. As such both of these groups were combined to form the Polish sample.
Generalization Schwartz Social Values Scale 29
Social Desirability Scale and Social Desirability Scale-17 while the American survey did
not. Copies of the full questionnaires, in English, may be found in Appendices B, C, and
D of this study. Demographics were also included in both studies. The use of these
demographics will be addressed in the Analysis portion of this study, as they will be used
as statistical controls for non-representative samples.
Originally, all three of the instruments for this study were composed in standard
United States English. Once final versions of these instruments were completed, a
rigorous double back translation process was implemented. Specifically, the respective
questionnaires were translated into Polish and Romanian and back into English. Items
differing significantly in their content upon back translation were then taken from their
original English and translated again. This process was repeated until all of the items
were translated with the appropriate content. Different translators were used at each step
of the process to avoid memorization or learning of the items. Side by side comparisons
of the Polish and Romanian versions of the SVS and demographics along in their
respective languages as well as their original English versions and English back
translations may be found in Appendices E and F of this study.
Note that this study does not use the full 57 item SVS. The 57th item pertaining to
Self-Indulgence was excluded as it was not present in the original study that Schwartz
(1992) used to validate his instrument.
Analysis
For the purposes of discussion, the analysis of the questionnaires’ results may be
separated into four phases. The first phase involves the alignment of demographic
questions for later statistical control, the elimination of respondents who provided

Generalization Schwartz Social Values Scale 30
incomplete data, and the selection of variables for demographic control. Phase Two
involved the statistical control of demographics. The third phase centers around the
production of Multidimensional Scaling Models (MDS). Phase Four involved the
analysis of the primary motivation types within the MDS space as described previously
by the Schwartz model through Multiple Discriminant Functions (MDF) and binary
logistic regression.
Phase One
Demographic questions from all three countries were first standardized in terms
of their name and coding within the data set. The next portion of this phase involved the
elimination of respondents who did not answer all of the SVS or the needed demographic
questions. At two points in this analysis statistical techniques were used that necessitated
listwise deletion, controlling for demographics and the measure of association used in the
production of the MDS models (covered in Phases Two and Three of this study
respectively). The results of the demographic questions common to all three surveys
were then compared with the purpose of selecting the variables which would offer the
broadest span of statistical control yet also leave the largest group of surviving
respondents with regard to missing data.
Phase Two
As previously stated the recruitment phase of this study involved finding as many
respondents as possible, regardless of demographic background, to fill out this study’s
questionnaires. This resulted in samples that were large enough for complex statistical
testing but not necessarily representative of the populations of the countries of interest.
As such, a statistical control was needed to eliminate the effects of these differing

Generalization Schwartz Social Values Scale 31
backgrounds with regard to the results of the SVS. While the SVS was produced with the
intent of the showing a universal values structure not only within but also between
nations, studies have shown differences associated with demographics (Lee, 2003; Na &
Duckitt, 2003; Feather, 1979). The decision was therefore made to control for
demographics within each sample.
The technique used to control influence of demographics was Multiple Linear
Regression. Specifically, the dependent or predicted variables would be each of the 56
items of the SVS. The independent or predictor variables would be the demographics.
Standardized residuals from this process would then be used in place of each item.
Note that in the case of this study the impact of demographics on the SVS’s scores within
cultures was not of interest. Rather this study’s thrust was the measurement of values and
their differences in importance between cultures. Previous studies have used this
technique under similar circumstances (Blake & Neuendorf, in press).
The theoretical underpinnings of this process are detailed as follows. When
plotting a linear regression line a line of best fit is placed within the plot of the data.
Each predictor variable adjusts the slope of this line and in so doing accounts for the
predicted variable’s variance. The space remaining between each data point and this line
is called the residual. This distance represents the variance unaccounted for by the
regression analysis. Therefore, in this study demographics were used as independent
variables and SVS scores as dependent variables; the residuals were SVS scores with the
influence of demographics subtracted. Specifically, in the case of this study, “controlled”
means that the residual scores of this regression are adjusted for linear effects assuming
Generalization Schwartz Social Values Scale 32
that there are no interactions among the demographics. The residuals from this portion of
the analysis were used in place of the raw data for the remainder of the analysis.
The regression models used the SPSS algorithm. Residuals may be produced
only for subjects with data for the independent variables (demographics in this case) in
SPSS. This along with analysis hurdles discussed in Phase 3 of this study necessitated
listwise deletion of respondents with missing data.
Specifics of the models used are as follows. The demographics (the independent
variables) were entered in a block at single step. This ensured all of the demographics,
regardless of their strength of association with a particular SVS score (the dependent
variable), were entered into the equation. Note that the variables used did not vary by
country. That is, if age were to be used in the United States model it would be used in the
Polish and Romanian models too.
A separate series of regressions were calculated for each national sample. Hence,
the regression coefficients for a given predictor could vary from country to country.
Phase Three
The next phase of this analysis involved the production of a Weighted
Multidimensional Scaling Model (WMDS) that would produce a common space based on
all of the variance from all of the countries used. Classic Multidimensional Scaling
(CMDS) models were also to be constructed for each country individually. As two forms
of MDS are used in this analysis, two separate designations are employed for the
different techniques. CMDS refers to Multidimensional Scaling it’s most basic form,
scaling of a single data matrix. WMDS refers to the technique that combines multiple
data matrices to produce a common space that attempts to amalgamate all of the data
Generalization Schwartz Social Values Scale 33
therein. Note that one of the intents of this study is to allow the interpretation of the SVS
through SPSS as the data analysis platform. ALSCAL is the software that is used in
SPSS to produce many of the types of MDS models. As such, from time to time
allusions to ALSCAL as a software platform will be made. A brief description of both
CMDS and WMDS is given here to insure that readers have the common background to
understand these analyses as applied to the current study. However, if the reader is
foreign to these statistics two good sources to begin familiarizing oneself would be Hair,
Tatham, and Anderson (1998) and Myers (1996).
CMDS is a statistical process by which the interrelationships between multiple
variables may be examined. Specifically, measures of similarity or dissimilarity are
employed for each unique pair of variables that the researcher wishes to examine. That
is, if four variables are to be examined then six pairings of variables would be required; if
five variables are to be examined ten pairings of variables would be required; and so
forth. Typically, this measure is a rating of perceived similarity. The only restrictions to
these measures of similarity are that they are at least ordinal in nature. For some cases
Pearson Correlation Coefficients (r) are used; however, this study employs the use of
different coefficient of similarity for reasons to be discussed later.
These indicators of similarity produce a matrix of intervariable similarities.
Drawing from the previous examples, if four variables are to be studied via MDS a four
by four matrix of dissimilarity scores is produced is produced. This produces 16
distances in a matrix that are symmetrical about a dividing line of perfect similarity
(perfect similarity in this case is signified through zero distance). This matrix is then
used to determine a set of coordinates on a number of dimensions specified by the

Generalization Schwartz Social Values Scale 34
researcher. These dimensions are for a hypothetical space and often produced as a
graphical readout. The researcher then examines these coordinates, or the resulting plot
of interpoint distances, if the results to be in the form of a graphical readout, hoping to
discern the variables similarities. Typically, CMDS is performed through an iterative
process by which a measure of variance relating both the original measure of
dissimilarity and the locations of the variables on the new set of dimensions is produced.
(Iterative in this case means a series of steps that are repeated. Each singular iteration, or
pass through the instruction set, is one step.) In fact, one of the outputs of the CMDS
algorithm is variance shared between to two sets of scores. Generally, this variance
coefficient is similar to r2 with modifications for the specific algorithm. The
interpretation of the variance coefficient produced by most CMDS software is the same
as it would be for correlation squared. That is, a variation shared coefficient between a
matrix of distances and the resulting CMDS output of .8211 would mean that 82.11% of
the variance recorded in the scaled dissimilarity matrix may be found within the
generated interpoint distances.
Another measure that is also generally employed measures the level of distortion
within this hypothetical space: Stress. A basic thought exercise explains the use of stress.
Pretend that there are distances for three points that are known and coordinates for these
three points are to be generated in two dimensions. Points one and two are ten inches
apart. Point three is four inches away from point one and two. The results of these
distances cannot be mapped in standard Euclidean space. Stress is the level of distortion
existing in the space by the algorithm attempts to accommodate these distances. Note
that standard Euclidean space is sometimes used; however other rules are sometimes used
Generalization Schwartz Social Values Scale 35
to define these spaces. The CMDS algorithm works through various configurations of
these points to minimize the stress of resulting coordinate set. Stress, like variance
shared, varies between zero and one. With zero indicating no distortion within standard
Euclidean space, or whichever other metric is being used, and one indicating complete
and utter distortion.
In most algorithms, there is an indirect relationship between variance shared and
stress. Stated another way, by repeating the steps CMDS are typically iterative processes.
The default maximum iterations available for these algorithms are 30 in SPSS. This
limitation is arbitrary. The main reason for this limitation is to conserve processor time
and is an artifact of the days when computing was performed on relatively slow
mainframe computers. For the purposes of this study all MDS algorithms were set to the
maximum number of allowed iterations, 999.
Other measures that are used in MDS are S-stress convergence and minimum S-
stress value. S-stress is squared stress, which is computed under a slightly different
formula than stress though its interpretation remains largely the same. S-stress is
calculated to gauge the minimum change in S-stress necessary to terminate the algorithm.
That is, when a change between iterations of S-stress is encountered lower than the set
level the algorithm will stop and deliver the derived coordinates. The default value for
convergent S-stress in SPSS is .001. Like the maximum iterations allowed this number is
arbitrary and was changed to .0001 (the minimum allowed through SPSS) to generate
solutions with lesser degrees of stress.
Minimum S-Stress is the lowest amount of stress that will be measured in the
iterative MDS process. This is a way of measuring the level of precision involved in the

Generalization Schwartz Social Values Scale 36
analysis. The Minimum S-Stress measure, like convergent S-Stress and Maximum
iterations, are set to arbitrary levels. The default for Minimum S-stress in SPSS is 0.005.
For this study, Minimum S-Stress will be set to a lower level to increase the precision of
the findings. This study will use .0001, the lowest value allowed by SPSS.
WMDS is used when two or more data sets are used to generate coordinates in a
hypothetical space where this set of coordinates is meant to represent a model that fits
these data sets as a whole. WMDS uses largely the same process described for CMDS.
However, instead of fitting the data from a single matrix to a hypothetical space, multiple
matrices are used. The hypothetical space that WMDS finally produces is referred to as
“common space.” The term common space is used as this space demonstrates the
variation present in all the data matrices used to develop it. Several measures are used in
WMDS that are relevant to only this process. Specifically WMDS makes use of
weirdness, importance, and subset weights. Note that r2 and stress are still produced for
each individual matrix and still fall under the same rubric of interpretation as with
CMDS.
Weirdness is named relatively intuitively. This measure shows how divergent a
given matrix is from an arbitrary midpoint of normalcy. Note that Weirdness varies
between 0 and 1. A Weirdness score of 0.00 between two data sets means that they are
effectively in total agreement or geometric congruence. A Weirdness score of 1.00
means that the two data matrices are in total disagreement.
Another measure specific to WMDS is Importance. The Importance measure is
intuitively named too. This measure shows the relative importance of a given dimension
with regard to explaining interpoint dissimilarities. Like the weirdness measure, the
Generalization Schwartz Social Values Scale 37
importance measure varies between 0 and 1. An importance score of 1 means that a
given dimension explains all or nearly all of the given data sets’ variance. An importance
score of 0 means that a given dimension is irrelevant or nearly irrelevant when evaluating
a given dimension.
Subject weights provide the basis for converting the common space to an
individual space for each subject (that is, data matrix, here the nation sample). A weight
is generated for each dimension for each “subject”; these weights are combined with the
coordinates of each stimuli multiplicatively (more specifically, the square root of the
weight) to obtain coordinates of a stimuli’s value on the dimension in question in the
subject (in this case, nation sample) space.
Note that solutions will be generated for one to six dimensions using CMDS and
two to five dimensions using WMDS (these are the full range of solutions available
through SPSS). Selection of which models will be used will be addressed after
descriptions of each model are discussed.
Many variations exist on the basic theme of developing these hypothetical spaces,
such that differing algorithms may produce different levels of variance shared, stress, and
hypothetical coordinates. However, the algorithms employed are generally stable in that
they will always produce the same levels of variance shared, stress, and hypothetical
coordinates for each individual data set.
The data input to MDS is a matrix of inter-value dissimilarities (or similarities).
In this study, the similarity is gauged by correlations between ratings of the perceived
importance of the stimuli (value statements). Very often when one speaks of correlation
in the social sciences he or she is referring to Pearson’s Correlation Coefficient (r).
Generalization Schwartz Social Values Scale 38
Pearson’s r has enjoyed an incredible amount of use in the social sciences. However, the
coefficient of choice for this study was Lin’s Concordance Coefficient, which will be
referred to as rlc. The formula for rlc may be found in Figure 2. An introductory
discussion of rlc may be found in The Content Analysis Guide Book (Neuendorf, 2002)
while a more technical discussion is contained in Lin (1989). This study will give a brief
discussion of and justification of its use within the performed CMDS and WMDS
analyses.
Specifically, consider the data sets presented in Table 6. Additionally, consider
the scatterplots provided for this data in Chart 1. As indexed by r, the association for
variables X and Y would be 1.00 (p < 0.001). Next consider the correlation between X
and Z. Again, the correlation when calculated through r is 1.00 (p < 0.001). That is,
through the use of r there appears to be no difference in the linear associations of these
two pairs of variables. However, when examining this data it becomes clear that there is
a constant associated with variable Z that tends to elevate its scores two units (in this case
the unites are arbitrary but common to all three variables and assumed to be
interval/ratio). Lin’s Concordance Coefficient considers this distortion but still has many
of the same properties as r. Specifically, the same levels of significance are used for rlc
as r. Additionally, just as r varies between -1.00 and 1.00 so does rlc. The interpretation
of the two coefficients are largely the same with anchors occurring at -1.00, a strong
negative relationship, 0, no relationship whatsoever, and 1.00 a strong positive
relationship. Finally, rlc and r require the use of minimally interval level data. As such,
rlc, for the hypothetical variables mentioned earlier, X and Y, would still be 1.00 (p <
0.001). However, rlc for variables X and Z would be 0.805 (p < .01).

Generalization Schwartz Social Values Scale 39
This exercise is important when considering the use of correlation coefficients as
a measure of similarity between two stimuli. Two items can be very different (as in X
and Z in Chart 1), but still show a high r. Lin’s Concordance Coefficient is not prey to
this problem to the same degree as it (unlike r) adjusts for elevation differences.
In this case, which may be generalized to other situations involving the linear
association between variables, rlc takes into account the issue of elevation. That is, X and
Z’s relationship is perfect but is elevated two units by comparison to X and Y. As such,
rlc is superior to r as it does not produce a figure that indicates a perfect correspondence
when one does not exist.
Unfortunately, programs that calculate rlc were not easily available at the time of
this analysis. As such, this formula for rlc was programmed into Microsoft Excel as a
formula and the association matrix needed for the later CMDS and WMDS models was
generated there (Figure 3 shows the Excel formula used for this computation).
Unfortunately, Excel does not support pairwise elimination of subjects with missing data.
This hurdle, as well as the previously mentioned use of residuals, necessitated the use of
a listwise elimination paradigm for subjects with missing data.
Whether r or rlc is used a basic transform is need to convert the measure of
association to dissimilarity. That is, both of these coefficients revolve around the
assumption that 1 is shows perfect agreement, 0 no association, -1 perfect disagreement.
If two objects are extremely similar, closer to 1 when interpreted through r or rlc, one
would expect them to be closer together than two objects which are extremely different
closer to -1 when interpreted through r or rlc, under the rubric of MDS in general.
Therefore, a transform is needed to convert rlc to dissimilarity where 0 is no dissimilarity,
Generalization Schwartz Social Values Scale 40
1 is a fairly large dissimilarity, and 2 is the maximum dissimilarity possible. The
transform used in this study is shown in Figure 4, while its Excel equivalent is shown in
Figure 5. Note that this transform is in line with typical transforms used to change
coefficients of similarity to distances representing dissimilarity when using an MDS
algorithm presented in Cox and Cox’s Multidimensional Scaling (2001).
Phase Four
Schwartz’s theory as demonstrated in Figure 1 assumes that arbitrary lines
separate the primary motivation types by the values, which populate them. Neither
CMDS nor WMDS are able to generate these artificial borders. An objective measure is
needed to judge whether the maps produced through CMDS and WMDS can be separated
into realms based on variance demonstrated through these models. Further, to maximize
the amount of variance represented by the CMDS and WMDS models hyperspace
dimensions will most likely be used. Hyperspace refers to dimensionalities, which
exceed the standard three dimensions used by people in everyday life. While exceeding
three dimensions will most likely account for a larger portion of the variance available in
the original matrices of relationship discussed earlier, a limitation is encountered, as
analysis via straight viewing is no longer possible. Again, an objective process or
processes are needed that analyzes the relationships of the values in a space that cannot
be typically comprehended by simple human observation. As such, the final phase of the
analysis involves the use of a Multiple Discriminant Functions (MDF) and binary logistic
regression to look into the resulting hypothetical space. MDF will be used in this study
to determine how well the Schwartz model is maintained regarding the ten overarching
value types for each country. Binary logistic regression will be used to evaluate how well
Generalization Schwartz Social Values Scale 41
the dichotomies of Self-Enhancement versus Self-Transcendence and Openness to
Change versus Conservation are predicted by the Schwartz models. This study will
provide a brief discussion of MDF and binary logistic regression as several unique issues
are presented in the case of this study. However, if the reader is unfamiliar with this form
of analysis he or she should seek out an introductory multivariate text for a more
complete description of these statistics (again, Hair et. al., 1998) is indispensable in this
regard).
MDF is a statistical analysis that uses a determinance model to predict categorical
group membership from parametric data by use of canonical functions. To clarify, a
determinance model is a model that uses a series of variables to predict another variable.
Examples of determinance-based models include multiple regression and binary logistic
regression. The essential attribute of determinance-based models is that commonalities
between the independent variables (whether standardized in the case of variance or
unstandardized in the form of variation) are entered in series to predict the dependent
variable. Second, the independent variables used in this analysis can be continuous or
categorical in nature while the dependent variable is usually categorical in nature. Third
the data is fed through a canonical correlation process to produce functions, which
differentiate between the groups as specified by the dependent variable.
MDF produces loading of each variable on the functions that are used to
discriminate between the categorical level variable. Typically, these coefficients are of
great interest to researcher as they tend to indicate the relative impact of predictor
variables in differentiating between categories of the predicted variable. However, in this
case, the predictor variables will be the dimensions from various CMDS and WMDS
Generalization Schwartz Social Values Scale 42
solutions. The composition of the CMDS or WMDS dimensions are inferred from the
distances developed from the original data set, in this case via Lin’s Concordance
Coefficient with regard to the SVS items controlled for demographic influence. This
leads to a difficult interpretation of what these loadings will mean, as the CMDS and
WMDS dimensions are developed based on the distances.
Another output of the MDF are the centroids associated with each category of the
dependent variable. These centroids are the arithmetic average of the function scores for
each category. That is, a score on each function is developed for each category. Each
category in this case is the primary motivation type that acts to classify individual values.
The implication is that these centroids are the most typical individual value for each
primary motivation type. However, whether the position of each centroid corresponds to
a value which may be interpreted as something meaningful is debatable. For instance,
what would one call a value that is two units away from clean but only one unit away
from national security? The result is that these centroids will additionally be very
difficult to interpret. Fortunately, the farther apart these centroids are from one another
the better the discrimination offered by the MDF model, and this type of data regarding
the model can be interpreted.
The next output of MDF is the level of significance offered by each function. The
practical significance level of this analysis is suspect. The input to the MDF model is an
abstraction of value measures as derived from the various CMDS and WMDS solutions
who themselves are derived of a theoretically limited population (the SVS scores). To
clarify, Schwartz (1992) states that his values measure is exhaustive or near exhaustive in
terms of the values that are measured. The question therefore becomes to what are

Generalization Schwartz Social Values Scale 43
models to be generalized? Is this a generalization to a finite, relatively small set of
values? Is this a generalization to an abstraction, via CMDS or WMDS, of a finite,
relatively small set of values?
This study takes the view that this method of analysis presumes the latter as
opposed to the former paradigm. Specifically, the CMDS or WMDS solutions will only
generalize as well as the variance it accounts for. However, care must be put forth in
regard to which MDS solution best represents the data at hand.
The final output of MDF is a hit and miss table that measures the number of
objects (in this case values) correctly classified through the MDF formula. Typically, a
derivation of Chi-Squared ( 2) called Press’ Q is used to evaluate the overall significance
of the resultant classification scheme (Hair et al., 1998). However, this is a special
circumstance in that 10 categories will be used to classify 56 objects. This suggests that
the minimum number of objects per cell will fall below the minimum for a 2 formula.
To clarify, Press’ Q evaluates the likelihood of the MDF model is classifying the
individual values at a rate above chance. However, the assumptions on which Press’ Q
are based may be violated.
While it could be argued that data in this case are being collapsed from the full
array of subjects, it could also be argued that there are simply not enough values to make
the determination of the model’s overall divergence from chance. This study will
therefore use two measures, Press’ Q and Cohen’s Kappa. Cohen’s Kappa ( ) was
originally developed for methodologies such as ethnography and content analysis, as an
alternative to percentage agreement. Typically, it is used when one wishes to judge the
level of agreement beyond chance between two coders when coding the same variable
Generalization Schwartz Social Values Scale 44
with the same stimuli (typically behavior of a human or animal). This study seeks to use
Cohen’s Kappa to judge the percentage agreement beyond chance between Schwartz’s
(1992) theoretical model and the current data. Note that Cohen’s Kappa varies like a
normal percentage, falling between 1.00 and 0.00. That is, a Kappa value of 1.00
indicates total agreement and while a Kappa value of 0.00 indicates total disagreement
(Neuendorf, 2002). The conceptual formula along with an example data set is provided
in Figures 6 and 7 respectively; the Excel formula employed in Kappa’s calculation is
available in Figure 8. As a baseline the basic percentage agreement between Schwartz’s
(1992) theoretical model and the present data as analyzed by MDS are also provided.
Further, this analysis report will use binary logistic regression to look into the
CMDS and WMDS models. Binary logistic regression is similar to MDF in that both are
determinance based and both rely on the dependent variable being categorical in nature.
Binary logistic regression differentiates between categories of a dichotomous variable.
The variables used as predictors in binary logistic regression may all be categorical in
nature. Once again, this study will provide a brief overview of binary logistic regression
and its unique application in this case. However, as binary logistic regression is complex
in and of itself much less in this unique application, readers unfamiliar with this statistic
should familiarize themselves with its methodology and implementation via an
introductory multivariate statistics text.
Binary logistic regression relies on adjusting the position of the function of a
natural log (an S-shaped function) in differentiating between two categories of a
dichotomous variable. Each independent, or predictor variable, adjusts the position of
several S-shaped functions until an optimal solution is reached. The caveats discussed

Generalization Schwartz Social Values Scale 45
regarding MDF still apply to this statistic as the output is very similar. However, the
conceptualization of this statistic is much easier to understand with regard to how it
applies to the various hypothetical spaces developed by the CMDS and WMDS models.
Specifically, the S-shaped functions are used to differentiate between the two categories
of interest. These functions would serve as dividing wall in the hyperspace solutions.
They would be the equivalent to hyperspace barrier separating the two categories of the
MDS (CMDS and WMDS) models arrived at in Phase Three of this study.
An oddity of this study that must discussed regards prediction with regard to
MDF and binary logistic regression. MDF and binary logistic regression are usually used
to predict group membership. These predictions are then compared to the actual
classification results. In this case, these statistics are being used to interpret a
hypothetical space. As such, the results of these statistics with regard to this study
become the actual results. While the Schwartz model, the model to which these results
will be compared, become the predicted results when interpreting the resultant
classification tables. To avoid confusion this study will use the label Empirically
Expected when referring to results predicted under the Schwartz (1992) model and
Observed for the results of the statistical analyses of this study.
The final portion of this analysis seeks to measure the levels of similarity between
the interrelationships of the SVS’s value statements between each country. To this end
the raw coefficients of relationship for each value interrelationship will be measured
between the United States, Poland, and Romania. That is, the rlc value for the first item
of the SVS “Equality” will have been compared to the second item “Inner Harmony” will
be compared between each nation. Each unique pair’s concordance coefficient will be
Generalization Schwartz Social Values Scale 46
used as the data for a coefficient of relationship (this will be the values as developed from
the 56 by 56 item matrix described in Phase 2 of this analysis). The requirements of this
analysis suggest that not only could the rlc values be measured but also the distances as
developed in through the CMDS algorithm. The distances developed through CMDS are
interval/ratio in nature. As such, Pearson’s Correlations Coefficient (previously defined
as r) may be employed in this case. However, the rlc values are of an ordinal nature.
This means that Kendal’s Tau-b will be used6. Kendal’s Tau-b will also be used with the
rlc values allowing comparisons between the original set of concordance values as well as
the CMDS derived coordinate sets.
This portion of the analysis will rely on only one half of the concordance matrices
previously mentioned. That is, only a triangular matrix under the main diagonal of
perfect correlations will be measured. In the case of the dimensions generated via CMDS
an extrapolation of the Pythagorean Theorem will be used to generate interpoint
distances7. Note that this will extrapolation assumes squared Euclidean distance;
however, this analysis will use Euclidean distance.
Results
Just as in the Analysis portion of this report the Results section is divided into
four phases. The first phase involved the alignment of demographic questions for later
6 Note Kendal’s Tau-b measures the number of inversions relative to rank order while compensating for a large number of ties. This statistic measures the number of times one score occurs before another when comparing two data sets and is conceptually similar to Gamma, Spearman’s Rho, and Pearson’s r (Brewer n.d.). The other possible statistic would have been Spearman’s Rho. Spearman’s Rho was rejected as this statistic as it was unknown what the number of ties was in the data set and Kendal’s Tau-b tends to be more appropriate when the data is more cross-tab like (Emerson n.d). 7 The classic Pythagorean Theorem is meant for two dimensions and may be illustrated as A2 + B2 = C2. Where the variable A represents the position of the variable on dimension one and B represents the position of the variable on dimension two. The extrapolation in this case is for six dimensions and may be illustrated as: A2 + B2 + C2 + D2 + E2 + F2 = G2.
Generalization Schwartz Social Values Scale 47
statistical control, the elimination of respondents who provided incomplete data, and the
selection of variables for demographic control purposes. Phase Two involved the
statistical control of demographics. The third phase centers on the production of MDS
models. Phase Four involved the analysis of the primary motivation types within the
MDS spaces as described previously by the Schwartz model through Multiple
Discriminant Functions (MDF) and binary logistic regression.
Phase One
Appendix G of this study gives the SPSS Syntax used to align the demographic
questions from the three countries surveyed. Note that Syntax related to Income
questions from all three countries is included though this question was eventually
excluded. At this point in the process no screening of demographic variables had taken
place with regard to their feasibility and missing data. A summary of the demographics
for the respondents used in this study is available in the 3rd, 4th, and 5th columns of Table
9.
A series of trade offs were made with regard to which demographics were likely
to best filter out the influence of non-national background and which demographics
received such a poor response rate such that they would hinder further analysis. Details of
this process are available in Tables 9, 10, and 11 of this study.
Note that multiple models were considered with regard to the elimination of
demographics. However, the variables with most missing data were household size and
income. The choice was made to eliminate these two variables as otherwise their
inclusion when applied listwise deletion issues discussed in the analysis portion of this
study would have produced too small a set of respondents for analysis.
Generalization Schwartz Social Values Scale 48
Phase Two
Recall that Phase Two of the Analysis involved the dummy coding of a select
group of demographics to control for non-representative sampling. Categorical variables
such as level of education and occupation type were dummy coded while age due to its
ratio nature was left in its original format. A full breakdown of the dummy categories
and their univariate descriptors is given in the first two columns of Table 9 of this study
(it is suggested that the reader also view the instruments employed, in their original
English, appropriate language, and English back translations, presented in Appendices H,
I, and J for the United States, Poland, and Romania respectively). Each country had its
own regression model. That is, separate models were employed using the same variables
for each country. The use of separate models was necessary as it was unclear if each
nation would be effected differently by the demographics available (see Blake and
Neuendorf (in press) for an alternate perspective). Further, the same demographic
questions from each country were used. That is, religion was asked in Poland but not in
the United States. Therefore, as it is unclear what effect religion has in both Poland and
the United States, it was excluded from the regression model. Note that the prototypes of
the SPSS syntax employed in this analysis may be found in Appendix K.
A total of the 168 regression models were employed in this study (56 for each
country). As the inclusion of all 168 models would provide little usable information
regarding this study’s hypotheses and grossly inflate the size of this report a sample of
the regression models is available (in Tables 12 through 17). Further, certain statistics
common to all of the regression models specifically the degrees of freedom, and
Generalization Schwartz Social Values Scale 49
collinearity diagnostics, for each country’s overall model set are provided in Tables 18
and 19 respectively.
Note that the overall models rarely achieve significance. This suggests the low
variance accounted for relative to the number of variables acting as predictors indicates
little predictive power of the demographics. Differences among individuals in their
residual scores should be comparatively free of even these modest effects of respondent
demographics.
Phase Three
Recall that to implement an MDS analysis coefficients of dissimilarity must be
created for each variable to every other variable. As previously discussed the coefficient
of choice for this analysis was Lin’s Concordance Coefficient. The resultant distributions
of concordance ratios for this process are described by country in Table 20. Note that the
overall distributions are roughly normal when measured by the Skewness and Kurtosis
measures. Further, note that the ranges of Lin’s Concordance Ratio vary within a range
of 0.813 and -0.413. Considering that this statistic penalizes relationships in which the
variables are differentially elevated, it could be inferred that there are several strong
relationships between the value measures.
Note that the SPSS Syntax used in the production of the both the WMDS and
CMDS solutions is available in Appendices L and M of this study.
Initially, a WMDS solution was attempted that would consider the data from all
three countries, the United, States, Poland, and Romania. The resulting R2 and stress
coefficients may be found in Tables 21 and 22, respectively. Scatterplots of these
statistics are available in Charts 2 and 3 respectively. Weights, Weirdness, and
Generalization Schwartz Social Values Scale 50
Importance statistics may be found in Tables 23, 24 and 25, respectively. For reasons of
reproducibility, the number of iterations used by ALSCAL to produce these solutions
may be found in Table 26.
The variance shared and stress coefficients are of particular concern. Overall, the
commonality among the three data sets (matrices) is lower than anticipated. Typically,
for an MDS solution to be considered of value, variance explained would need to exceed
0.80 or 0.90 as a guideline (Myers, 1996). When averaged, none of the solutions offered
exceeds this mark. Of further concern is that the variance explained tends to be
dominated by one or two countries for each dimension of the solution. The most unusual
outcome of this analysis is that the five dimensional solution offers a lower amount of
variance explained than the four dimensional solution. Overall, it seems that the Polish
data set is dominating the analysis in terms of variance explained.
The weights for each country by dimension offer more evidence of instability.
Specifically, it appears that in all of the solutions except the five dimensional one, that
each country dominates a separate dimension. That is, for the two-dimensional solution
an even mix of dominance is held by the U.S. and Romania, while Poland dominates the
second dimension. In the three-dimensional solution, Romania holds sway over
dimension one, while the United States and Poland control dimension two. Poland, in the
three dimensional solution, holds sway over dimension two. This effect is even more
profound in the four dimensional solution, where Poland controls the first dimension,
Romania the second, the United States the fourth, and the third dimension is a somewhat
even mix.

Generalization Schwartz Social Values Scale 51
The Weirdness coefficients tell an even more interesting story. Overall, the
highest Weirdness ratings are associated with the four dimensional solution, the one with
the highest variance explained. While the three and five dimensional solutions are about
even in terms of their levels of Weirdness, the two-dimensional solution, the one with the
lowest variance explained, offers the lowest marks on this index.
Overall, these indicators could be taken to indicate that ALSCAL had trouble
arriving at a WMDS solution that could push the requirements of three data sets together.
The best solution when one considers all of the available indicators would seem to be the
five dimensional solution. This solution offers the highest mix of dominance when
comparing country to dimension, lower levels of stress overall, and lower weirdness
indicators by country. However, this solution has its pitfalls too. This solution offers the
lowest representation of the Romanian data set both in terms of variance explained and
stress.
Alternate solutions were arrived at via CMDS. Three separate models were
developed, one for each country. Note that when considering this methodology,
comparisons in terms of distance cannot be made between countries. That is, since the
models developed by CMDS consider the data of only one country, the results are
applicable only to that one country. The implication is that separate models, in terms of
multiple discriminant functions and binary logistic regressions must be considered in
Phase Four.
Variance explained and Stress by data set and dimensionality of solution are given
in Table 27. Scatterplots of these data are available in Charts 4 and 5, respectively. Once
again, for reasons of reproducibility the number of iterations used by the ALSCAL
Generalization Schwartz Social Values Scale 52
algorithm for each country’s data set is available in Table 26. These solutions follow the
guidelines of a roughly inverse relationship between variance explained and stress.
Further, the rough inverse relationship between stress and dimensionality is also
maintained. Finally, the direct relationship between dimensionality and variance
explained is seen (that is, as the number of dimensions goes up so does the level of
variance explained). Note that not much improvement is demonstrated by moving from a
five to a six dimensional solution. However, for the purposes of verifying the Schwartz
model every available amount of variance explained was taken into consideration. As
such, the six dimensional solution was tested in Phase 4 of this study.
Phase Four
Tables 28 through 43 detail the development of the MDF models as they
differentiate between primary motivation types under the Schwartz model. The SPSS
syntax used to derive these solutions is available in Appendix N. Again, it must be
emphasized that it is unclear what relation the loadings of each MDS dimension (whether
this is a CMDS or WMDS solution) have with regard to each individual multiple
discriminant function (these loadings are shown in Tables 28, 32, 36, and 40). It is
notable, however, that the number of discriminant functions equals the number of WMDS
or CMDS dimensions. This not withstanding, in most cases no one dimension dominates
the contributions of variation to a discriminant function. The previous observation could
be taken to mean that no one dimension within the MDS models is responsible for the
differentiation of an overall motivation type or overall group of motivation types. This is
given further credence when one examines the centroids for each primary motivation type
(values for the centroids are available in Tables 30, 34, 38, and 42). That is, generally
Generalization Schwartz Social Values Scale 53
speaking, no one primary motivation type comes out as more clearly classified at the
aggregate level than any other. A notable exception to this statement is that the primary
motivation type “Power” tends to have a high centroids value in the WMDS common
space, and CMDS United States and Romanian space models. Perhaps, this suggests that
this motivation type is clearly differentiated in these three models and stands out in terms
of aggregate distance when compared to the other motivation types.
Table 44 offers a summary of MDF results in the form of Press’s Q and Cohen’s
Kappa for common space developed through the WMDS algorithm and the individual
spaces developed for each CMDS algorithm by country. Notably, Press’s Q produced
extraordinarily high values. Once again, caution is recommended in the interpretation of
this statistic. One possible interpretation is that the assumptions of this statistic were
violated due to low cell counts. However, Cohen’s Kappa offers a more enlightening
look at these models viability. All of the models offer a classification rate near or above
50% even after controlling for chance. The beginnings of a trend are also notable in that
the common space model produced the highest classification rate while Romania offers
the lowest classification rate.
The observation that Romania fared the worst of the four models set forth is
apparent when one examines Tables 45 through 48. Remember when reading these
results that in the case of this study MDF and binary logistic regression are being used to
look into the MDS models that were generated in Phase 2. As such, the results of these
models are labeled the Observed results. The results that are predicted by Schwartz are
labeled Empirically Expected and are the analog to the predicted results.
Generalization Schwartz Social Values Scale 54
Again, the common space model, whose results are illustrated in Table 45,
seemed to fair the best of the set with the United States coming in second. Of great
interest is the area where the primary motivation types Benevolence, Tradition,
Conformity, and Security intersect with regard to the expected and observed statistics.
This area shows a low level of differentiation with a large number of values falling
outside of the diagonal. This is not surprising when one considers that Tradition and
Conformity tend to occupy the same piece of the SSA pie in the Schwartz model (Figure
1).
The specifics of the binary logistic regression models (detailed in Tables 49
through 56) tend to repeat the story of the MDF analysis. The SPSS syntax used to
derive these models is available in Appendix O. Each predictor variable, in this case
each dimension, from each model produces its own function. However, in this case one
or two WMDS or CMDS dimensions dominate each function. This suggests that the
differentiation of Openness to Change versus Conservation and Self-Transcendence
versus Self-Enhancement relies almost entirely on these variables. However, this may
also have to do with the simplicity of the differentiation. That is, these are simplistic
choices between two classifications and unlikely to require input from the various
dimensions. Notably, the Romanian model with regard to differentiation between
Openness to Change versus Conservation, detailed in Table 52, failed to achieve
significance.
Cross tabulations showing the hits and misses of the logistic models are given in
Tables 57 through 64. These tend to reinforce the issue of the common space and United
States model tending to more closely mimic the Schwartz model.

Generalization Schwartz Social Values Scale 55
Tables 65 and 66 are the logistic analogs to Table 44, for Openness to Change
versus Conservation and Self-Transcendence versus Self-Enhancement. The values
obtained for Press’s Q for all eight models are again extremely high (note that this
statement considers each individual space model, of which there are three, and each
common space model, for all of which there are two uses of binary logistic regression).
However, unlike the MDF results, the statistic maintains its interpretation. Again, the
trend mentioned with regard to the common space having the largest proportion of
correctly classified individual level values is maintained with the exception of Self-
Transcendence versus Self-Enhancement, in which the United States fairs the best.
Notably, the kappa values are lower for the dichotomous differentiations than for the
MDF differentiations. Further, Romania faired far worse than the United States and
Poland with regard to classification of values (Table 44, percentage agreement and
percentage agreement beyond chance).
Tables 67 through 70 give listing of each item of the SVS as classified by their
primary motivation types through MDF under the Schwartz model. Further, positions
under the semi-bipolar dimensions of Self-Transcendence versus Self-Enhancement and
Openness to Change versus Conservation, under the Schwartz model and as classified
through CMDS solutions by binary logistic regression. Table 71 give a listing of the
value statements that adhered to the expected motivation primary types and positions
under the semi-bidirectional dimensions. While Table 72 and Chart 6 show the value
statements that maintained the correct value primary motivation categories across all four
of the space developed through MDS by country.

Generalization Schwartz Social Values Scale 56
A final result of keen interest is that Romania fared the worst of the three
countries studied. Overall, Romania showed the widest fluctuations with regard to
variance shared and stress in when the WMDS solution was attempted (Charts 2 and 3)
and the lowest number of correct classifications of values under the bipolar value
dimensions (Tables 57 and 64).
Further, evidence of this is suggested when the similarities between value
distances were measured within the CMDS models through multiple uses of Kendal’s
Tau-b coefficients between countries (Table 73, Pearson’s Correlation Coefficients are
provided in Table 74). Romania has the lowest level of association when compared to
the U.S. and Poland. This is demonstrated again in Table 75 where r is used. In this
table, Romania and the United States show the lowest level of similarity while the United
States and Poland are the most similar. Note that Table 76 offers the equivalent Kendal’s
Tau-b measures of association for comparability purposes between the concordance and
CMDS distance measures. This results summarized in this table tend to suggest the same
structure of relationships between the three countries.
Discussion
The results of this study support some, but not other, aspect of the Schwartz’s
model. Several reasons for the lack of strong support may exist. This could be due to a
number of factors such as the lack of stability regarding the overall architecture of the
SVS’s interrelationships across cultures, a bias in the SVS itself towards western values
or amalgam thereof, this study’s control of demographics, or a basic incompatibility of
this study’s analysis with SSA.
Generalization Schwartz Social Values Scale 57
The results of this study suggest that the Schwartz model best fits an overall
amalgamation of United States, Poland, and Romania but has trouble when applied to
individual models. Unfortunately, the common space developed via ALSCAL’s WMDS
algorithm does not appear to be a good fit to the data. Specifically, it appears that there is
a large amount of instability in the common space solutions developed by this algorithm.
This would mean that each space developed through the CMDS process for the United
State, Poland, and Romania individually are very different in terms of their properties.
Credence is given to this observation when one considers that Tables 72 through 74 show
that the input data and corresponding CMDS distance solutions when compared between
countries are highly disparate.
This suggestion tends to be further supported by the results of the individual
CMDS solutions with regard to the classification of values into their 10 primary
motivation types via MDF. Further evidence is found in the two semi-bipolar value
dimensions (Openness to Change versus Conservation and Self-Enhancement versus
Self-Transcendence) for which Romania fared the worst and the U.S. common space
fared the best.
The pieces of evidence, disparity between the common space distances and
concordance measures, and differing results from the discriminant regressions and
logistic regressions strongly suggest that each common space is unique. First, the
common space distances and concordance measures show that the dissimilarities between
value statements when compared between countries are disparate. This means that each
matrix (whether in their original form of concordance measures or in their scaled form
via ALSCAL) simply are not comparable. This supported by the failure of ALSCAL to
Generalization Schwartz Social Values Scale 58
render a satisfactory WMDS group space. Further, the patterns of values falling within
the primary motivations of Schwartz’s model are different. This means that each space is
conforming uniquely to the overarching theory Schwartz has set forth.
The implication that each of these common spaces is unique in structure when
compared to common spaces of other nations means that the interrelationships of the
SVS’s value statements are not universal. However, the results of the MDF and binary
logistic regression analyses (illustrated via hit rate tables) suggest that the overall
classification of values retains a very high degree of predictive validity. That is, the
higher level of abstraction offered by Schwartz (1992) in the form of Primary Motivators
and two semi-bipolar dimensions of Self-Enhancement versus Self-Transcendence and
Conservation versus Openness to Change may be universals of this model.
While these constraints are important, this does not diminish the utility of the
SVS. However, this implies that the SVS may not be a scale in the traditional sense.
Rather, in light of these results it appears that the SVS represents a taxonomy of value
types. That is, a scale implies that each value statement has a specific relationship with
other value statements, with each value statement definitively falling within each primary
motivation type. A taxonomy implies that the value statements tend to fall into a given
primary motivation type. The distinction of the term taxonomy as opposed to scale
centers on the idea that the primary motivation types are more categorical in nature as
opposed to a strict continuum as described under the original model.
The overall architecture of the SVS values may be more stable across cultures
with regard to certain value statements, however. Table 71 shows the value statements
that maintain their correct classification with regard to both primary motivations as
Generalization Schwartz Social Values Scale 59
analyzed via MDF and the semi-bipolar dimensions as analyzed via binary logistic
regression. Only 19 of the 56 statements meet the criteria of being correctly classified in
the United States, Poland, and Romania. One of these value statements, item 43
“Capable,” was not correctly classified under the WMDS common space model. Note
that there appears to be no commonality to these value statements. Notably, there is no
apparent difference between whether these are end-states, such as “Sense of belonging,”
or instrumental values, such as “Creativity.” Further, the binary logistic analysis played
virtually no role in the correct classification of these values. That is, as long as any of the
56 values were classified correctly under the rubric of the ten primary motivation types,
as analyzed via MDF, they were highly unlikely to have been misclassified under the
rubrics of two semi-bipolar dimensions of Self-Enhancement versus Self-Transcendence
and Conservation versus Openness to Change, as analyzed via binary logistic regression.
Perhaps of equal concern to the issue of disparate value structures between
nations is that the CMDS United States model best supports the Schwartz model (The
common space derived from the WMDS algorithm is a better fit; however, this space has
previously been discussed and deemed a poor fit to the data). Two conclusions result
from this observation. First, it could be that the SVS was not translated properly. This
seems unlikely. The translation process was quite rigorous and the back translations
show a large amount of congruity to the original. The second option is that the Schwartz
model is biased towards American or Western European style values. That is, the better
performance of the United States could be an artifact of the scale’s original composition
in English.

Generalization Schwartz Social Values Scale 60
Another possibility is that the statistical control of demographics may have altered
the value scores. This suggests the Schwartz model is heavily correlated with
demographics. Remember that the original studies by Schwartz used a highly
homogeneous population composed of students and teachers. This may have
“controlled” for the demographic influence. This hypothesis is very unfortunate as the
logical conclusion would be that value structure, again, is not fully universal.
Specifically, the issue would be that demographics within cultures unduly pollute this
structure. However, this leads to an even more complex problem: Are the demographics
effecting the values of those studied or are the values of those studied effecting their
demographics (that is, by impacting one’s readiness to seek higher education or to engage
in activities to enhance income)? This line of logic quickly becomes akin to the classic
nature versus nurture debate. Generally speaking, it is neither nature nor nurture; rather it
is the interaction of the two that make the individual, or in this case his or her values.
The next possibility is that in using listwise deletion with regard to both
demographics and the SVS this study selected for a specific class of respondents. Again,
this leads back to the question of whether the SVS is truly universal. That is, if the SVS
does truly tap the universal values structure guiding everyone then the use of respondents
who choose to fill out an entire questionnaire as opposed to those who do not should be
irrelevant.
Another possibility is that CMDS and WMDS combined with MDF and binary
logistic regression simply do not yield results comparable to SSA. This theory seems to
be unlikely in explaining the level of divergence from Schwartz’s model. However,
Todd & Lawson (2003) performed an MDS analysis of the SVS using PROXSCAL a
Generalization Schwartz Social Values Scale 61
conceptual descendent of ALSCAL and confirmed the SVS’s structure through this
method. Unfortunately, this study used a shortened version of the SVS. Additionally,
this study did not use ALSCAL. Instead, PROXSCAL, a newer MDS algorithm, was
used in the production of this space. Further, Todd & Lawson (2003) chose to use
shortened scale8 and ipsatize9 the results by individual respondent. This would call into
question the compatibility of the current study’s results with that of Todd & Lawson’s
(2003).
The lack of universality between the value statements interrelationships also
means that countries may be classified by differential scores on SVS. That is the study
by Sverko (1995), mentioned in the introduction as using Hofstede’s Values Scale and
hierarchical clustering, could be repeated using the SVS. Specifically, this means that
cultures could be classified via this instrument.
Another research application of the previous discussion regarding SVS’s non-
universal structure is that this tends to open a window that would allow the researcher to
look into the impact of a culture’s values on various hypothetical constructs. That is,
these individual differences in scores, as represented in miss-classifications under the
various analysis models (MDF and binary logistic regression), could be correlated with
such scales as the Marlowe-Crowne Social Desirability Scale (Crowne & Marlowe, 1960)
or the Global Innovativeness Scale (Hurt, Joseph, & Cook, 1977). This could provide
new insights as the nature of these constructs as they vary by culture.
8 This scale was composed of seven instead of nine points. Negative one was anchored with opposition to the respondent’s values while the opposite end, five, was anchored as highly important to the respondent’s values. 9 In this case, the operational definition of “ipsatize” is to subtract the mean score of each respondent’s overall values score from each individual values statement rating. This procedure is often alternately termed, “centering.” Hence, if a respondent had a mean score of two for the overall questionnaire used and had rated the first item five; the “ipsatized” score would be three.

Generalization Schwartz Social Values Scale 62
A final avenue of further research that was not pursued by this study would be to
examine the dimensions of the resultant CMDS spaces. Specifically, one could look for a
discernable pattern and use this pattern (if it exists) to reorganize the scale.
Unfortunately, this would most likely require the use of more than three cultures’ data if
one wished to propose an alternative to Schwartz’s taxonomical system. The three
cultures examined in this study give but an initial glimpse into the potential diversity
offered across the world.
Generalization Schwartz Social Values Scale 63
Works Cited
Astill, B. R. (1998, July 04). Humanised statistics: An investigation of social values in a
senior secondary school milieu. Retrieved March 15, 2004, from University of
Adelaide AARE Conference Papers Publishing And Refereeing Web site:
http://www.aare.edu.au/94pap/astib94.297
Bardi, A., & Schwartz S. H. (2001). Value hierarchies across cultures: Taking a
similarities perspective. Journal of Cross-Cultural Psychology, 32(3), 268-290.
Bilsky, W. & Koch, M. (2002). On the Content and Structure of Values: Universals or
Methodological Artefacts? Retrieved April 10, 2004, From The University of
Münster, Department of Psychology Web site: http://wwwpsy.uni-
muenster.de/inst4/AEBilsky/pdf/Bilsky/Tagungsbeitraege/Koch.pdf
Blake, B. F., & Neuendorf, K. (In Press). Cross national differences in website appeal: A
framework for assessment. Journal of Computer Mediated Communication.
Braithwaite, V., & Scott, W. (1991). Values. In J. Robinson, P. Shaver, & L. Wrightsman
(Eds.), Measures of Personality and Social Psychological Attitudes (pp. 651 –
753). San Diego, CA: Harcourt, Brace, Jovanovich Publisher.
Brewer, M. (n.d.). Some useful statistics. Retrieved April 13, 2004, From Colby College
Department of Government faculty Web site:
http://www.colby.edu/~mbrewer/usefulstatistics.htm
Central Intelligence Agency. (2003a, March 19). Poland. In The World Factbook 2002.
Retrieved May 15, 2003, from
http://www.cia.gov/cia/publications/factbook/geos/pl.html
Generalization Schwartz Social Values Scale 64
Central Intelligence Agency. (2003b, March 19). United States. In The World Factbook
2002. Retrieved May 15, 2003, from
http://www.cia.gov/cia/publications/factbook/geos/us.html
Central Intelligence Agency. (2003, April 6). Romania. In The World Factbook 2003.
Retrieved April 6, 2004, from
http://www.cia.gov/cia/publications/factbook/geos/ro.html
Cox, T. F., & Cox M. A. (2001). Introduction. In Multidimensional scaling (2nd ed.). New
York: Chapman and Hall/CRC.
Crowne, D. P. & Marlowe, D. (1960). A new scale of social desirability independent of
psychopathology. Journal of Consulting Psychology, 24(4), 349-354.
Emerson, M. S. (n.d.). Masters in Public Administration (MPA) 504 Quantitative
Methods. Retrieved May 6, 2004 From California State Polytechnic University
Pomona Web site:
http://www.csupomona.edu/~smemerson/quantitative/syllabus.htm
Feather, N. T. (1979). Value correlates of Conservation. Journal of Personality & Social
Psychology, 37(9) 1617-1630.
Ferreira-Marques, J., & Miranda, M. J. (1995). Developing the Work Importance Study.
In V. Sverko & B. Super (Eds.), Life Roles, Values, and Careers (pp. 231-241).
San Francisco, CA: Jossey-Bass Publishers.
Goldsmith, R., & Hofacker, C. (1991). Measuring consumer innovativeness. Journal of
the Academy of Marketing Science, 19(3) 209-221.
Goodwin, R., & Tinker, M. (2002). Value priorities and preferences for a relationship
partner. Personality and Individual Differences, 32(8) 1339-1349.

Generalization Schwartz Social Values Scale 65
Guion, R. (1998). Assessment, measurement, and prediction for personnel decisions.
Mahway. NJ: Lawrence Erlbaum Associates.
Hair, J. F. Jr., Anderson, R. E., Tatham, R. L., & Black, W. C. (1998). Multivariate data
analysis with readings (5th ed.). Upper Saddle River, NJ: Prentice Hall.
Hurt, H., Joseph, K., & Cook, C. (1977). Scales for the measurement of innovativeness.
Human Communication Behavior, 4(1), 58-65.
International Business Center. (2003). Geert Hofstede's Cultural Dimension Scores.
Retrieved May 16, 2003 from The Web's Leading Resource for International
Business Etiquette and Manners with Geert Hofstede’s Cultural Dimensional Web
site: http://www.cyborlink.com/besite/geert_hofstede_dimensions.htm
Kelly, K., Silverman, B. I., & Cochrane, R. (1972). Social desirability and the Rokeach
Value Survey. Journal of Experimental Research in Personality, 6, 84-87.
Lee, A. R. (2003). Stability and change in Korean values. Social Indicators Research,
62(1-3), 93-117.
Lin, L. I. (1989). A concordance correlation coefficient to evaluate reproducibility.
Biometrics, 45, 255-268.
Middleton, K. L., & Jones, J. L. (2000). Socially desirable response sets: The impact of
country culture. Psychology and Marketing, 17(2), 149-163.
Myers, J. H. (1996). Segmentation and positioning for strategic marketing decisions.
Chicago, Illinois: American Marketing Association
Na, E. Y., & Duckitt, J. (2003). Value consensus and diversity between generations and
genders. Social Indicators Research, 62(1-3), 411-435.

Generalization Schwartz Social Values Scale 66
Neuendorf, K. A. (2002). The content analysis guidebook. Thousand Oaks, CA: Sage
Publications.
Randall, D. M., Hwo, Y. P., & Pawelk, P. (1993). Social desirability bias in cross-
cultural ethics research. The International Journal of Organizational Analysis,
1(2), 185-202.
Robert, C., Probst, T. M., Martocchio, J. J., Drasgow, F., & Lawler, J. L. (2000).
Empowerment and continuous improvement in the United States, Mexico, Poland,
and India: Predicting fit on the basis of the dimension of power distance and
individualism. Journal of Applied Psychology, 85(5), 643-658.
Schwartz, S. H. (1992). Universals in the content and structure of values theoretical
advances and empirical tests in 20 countries. In M. P. Zanna (Ed.), Advances in
Experimental Social Psychology: Vol. 25 (pp. 1-65). San Diego, CA: Academic
Press.
Schwartz, S. H. (1994). Beyond individualism/collectivism: New cultural dimensions of
values. In U. Kim, H. Triandis, C. Kagicbasi, S. Choi, & G. Yoon (Eds.)
Individualism and Collectivism: Theory, Methods, and Applications (pp. 85-119).
Thousand Oaks, CA: Sage Publications.
Schwartz, S. H., Verkasalo, M., Autonovsky, A., & Sagiv, L. (1997). Value priorities and
social desirability: Much substance, some style. British Journal of Social
Psychology, 23, 3-18.
Solomon, M. R. (1999). Glossary. In Consumer behavior (4th ed., p. 563). Uppersaddle
River, NJ: Prentice Hall.

Generalization Schwartz Social Values Scale 67
Spini, D. (2003). Measurement of equivalence of 10 value types from the Schwartz
Values Survey across 21 countries. Journal of Cross-Cultural Psychology, 34(1),
3-21.
Sverko, B. (1995). The structure and hierarchy of values viewed cross-nationally. In
Sverko, V. & Super, B. (Eds.), Life Roles, Values, and Careers (pp. 225-240). San
Francisco, CA: Jossey-Bass Publishers.
Todd, S., & Lawson R. (2003). Towards an understanding of frugal consumers.
Australasian Marketing Journal. 11(3), 8 -18.
Trentini, G., & Muzio, G. B. (1995). Values in a cross-cultural perspective: A further
analysis. In Sverko, V. & Super, B. (Eds.), Life Roles, Values, and Careers (pp.
241-251). San Francisco, CA: Jossey-Bass Publishers.
Waters, J. B. (1999, April 27). Fall, 2000 - Internet lecture assignment. In Performance
Appraisal and Counseling. Retrieved May 18, 2003 from California State
University, Domingez Hills faculty Web site:
http://som.csudh.edu/jbell/303assignments/303ETHIC.doc
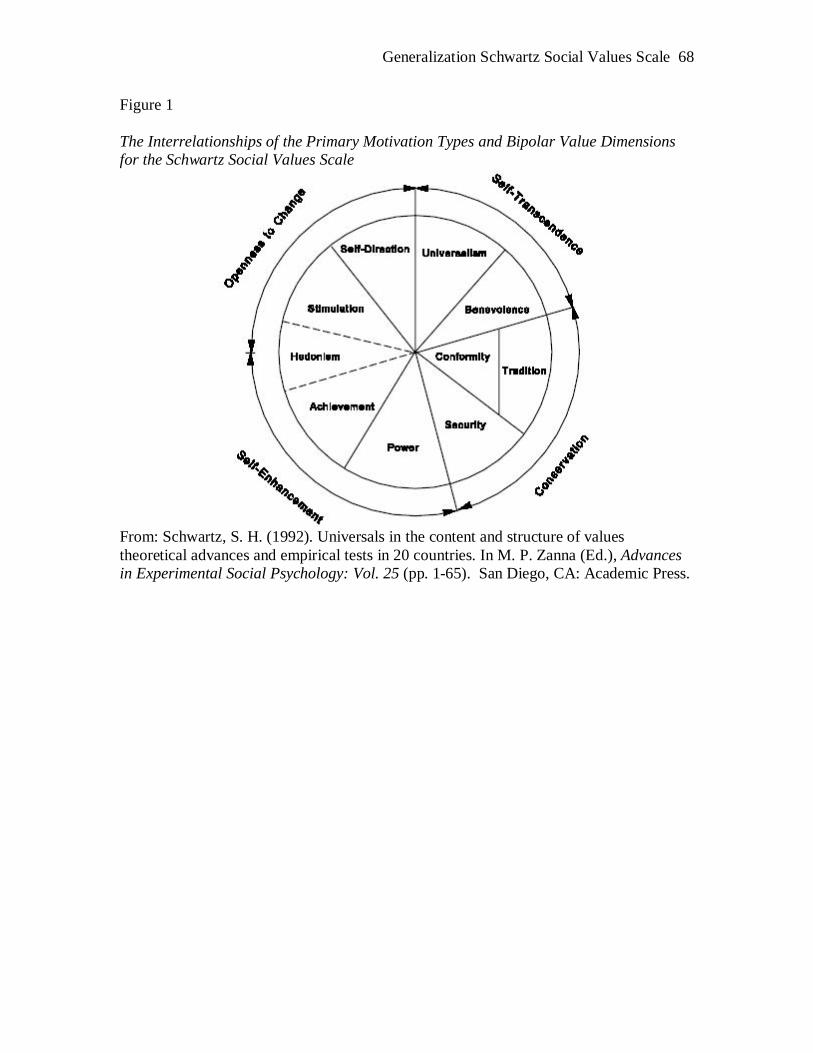
Generalization Schwartz Social Values Scale 68
Figure 1 The Interrelationships of the Primary Motivation Types and Bipolar Value Dimensions for the Schwartz Social Values Scale
From: Schwartz, S. H. (1992). Universals in the content and structure of values theoretical advances and empirical tests in 20 countries. In M. P. Zanna (Ed.), Advances in Experimental Social Psychology: Vol. 25 (pp. 1-65). San Diego, CA: Academic Press.
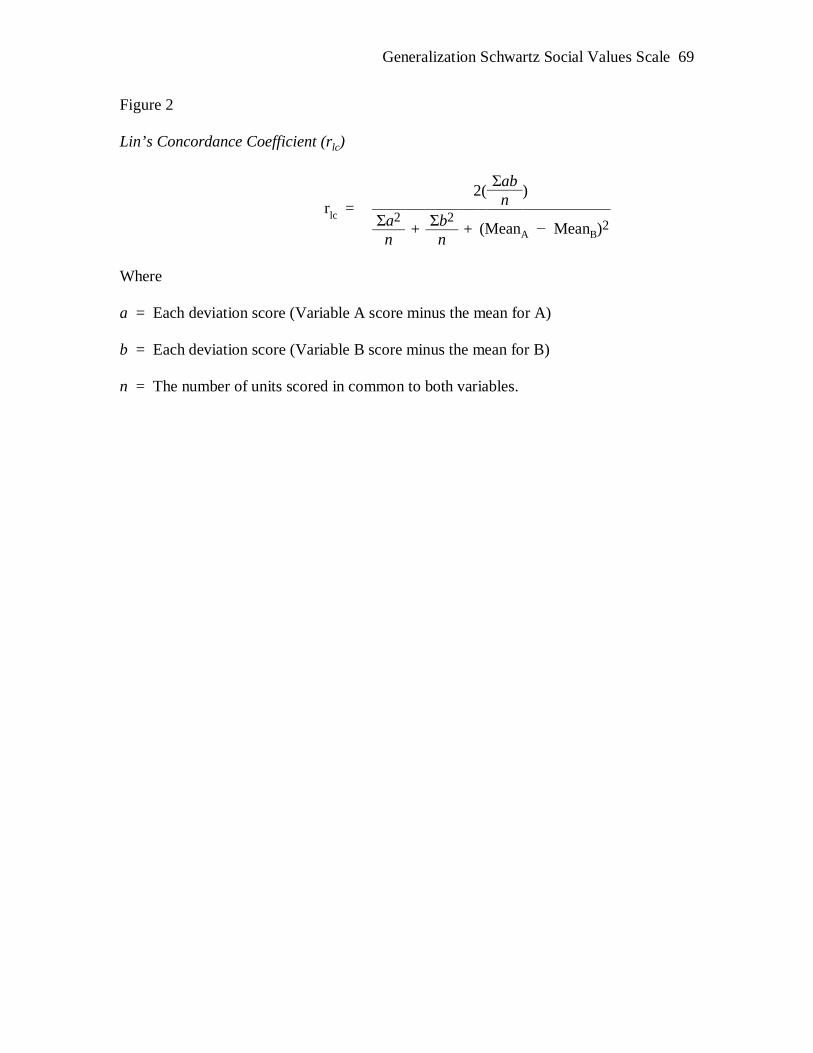
Generalization Schwartz Social Values Scale 69
Figure 2 Lin’s Concordance Coefficient (rlc)
rlc = 2( ab ) n
a2 + b2 + (MeanA MeanB)2 n n
Where
a = Each deviation score (Variable A score minus the mean for A)
b = Each deviation score (Variable B score minus the mean for B)
n = The number of units scored in common to both variables.

Generalization Schwartz Social Values Scale 70
Figure 3 Linn’s Concordance Coefficient as an Excel Formula
rlc = ( 2 * COVAR ( A2 : A99 , B2 : B99 ) ) / ( VARP ( A2 : A99 ) + VARP ( B2 : B99 ) + ( AVERAGE( A2 : A99 ) - AVERAGE( B2 : B99 ) ) * ( AVERAGE ( A2 : A99 ) - AVERAGE ( B2 : B99 ) ) )
Where: The data set in question ranges from cell A2 to B99. The cell references A2 to A99 (A2:A99) specify the first subject’s data range. The cell references B2 toB99 (B2:B99) specify the second subject’s data range. AVERAGE ( ) = The arithmetic average function. COVAR ( ) = The covariance, the average of the products of deviations for each data point pair function. VARP ( ) = The variance for the entire population function.
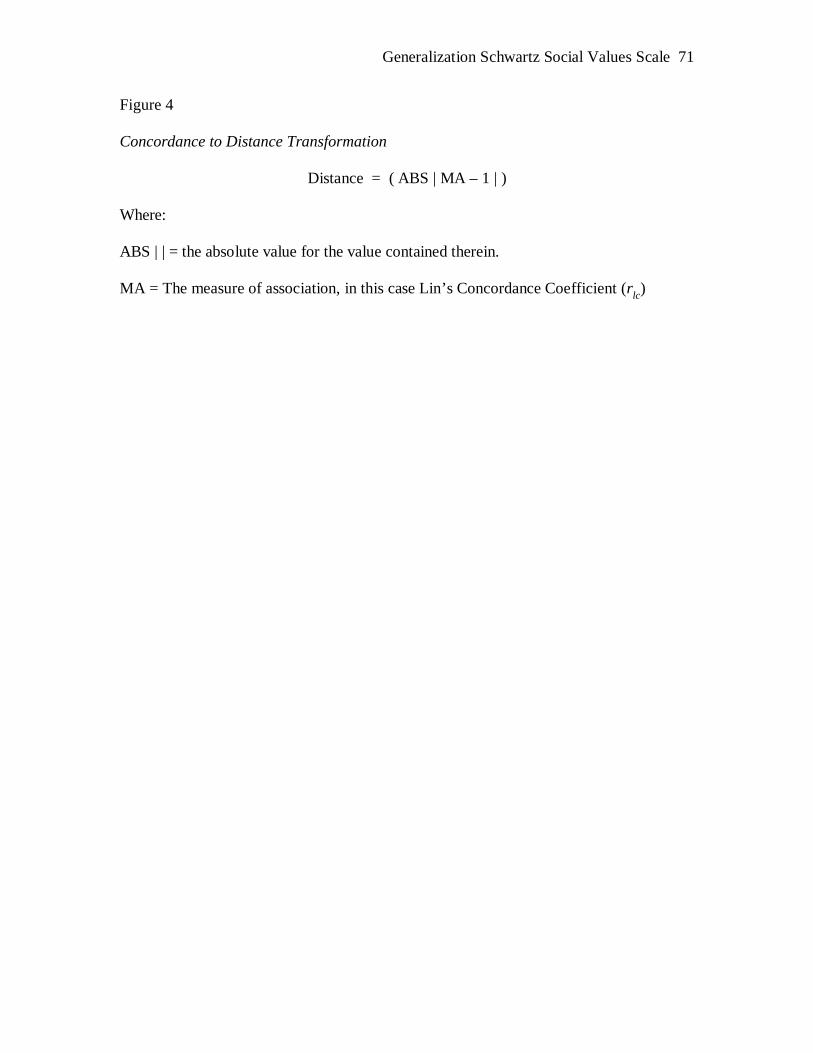
Generalization Schwartz Social Values Scale 71
Figure 4 Concordance to Distance Transformation
Distance = ( ABS | MA – 1 | )
Where: ABS | | = the absolute value for the value contained therein. MA = The measure of association, in this case Lin’s Concordance Coefficient (rlc)

Generalization Schwartz Social Values Scale 72
Figure 5 Concordance to Distance Transformation as an Excel Formula
= ( ABS ( A1 - 1 ) )
Where: A1 is the cell of reference. ABS( ) = Returns the absolute value for the value contained therein.
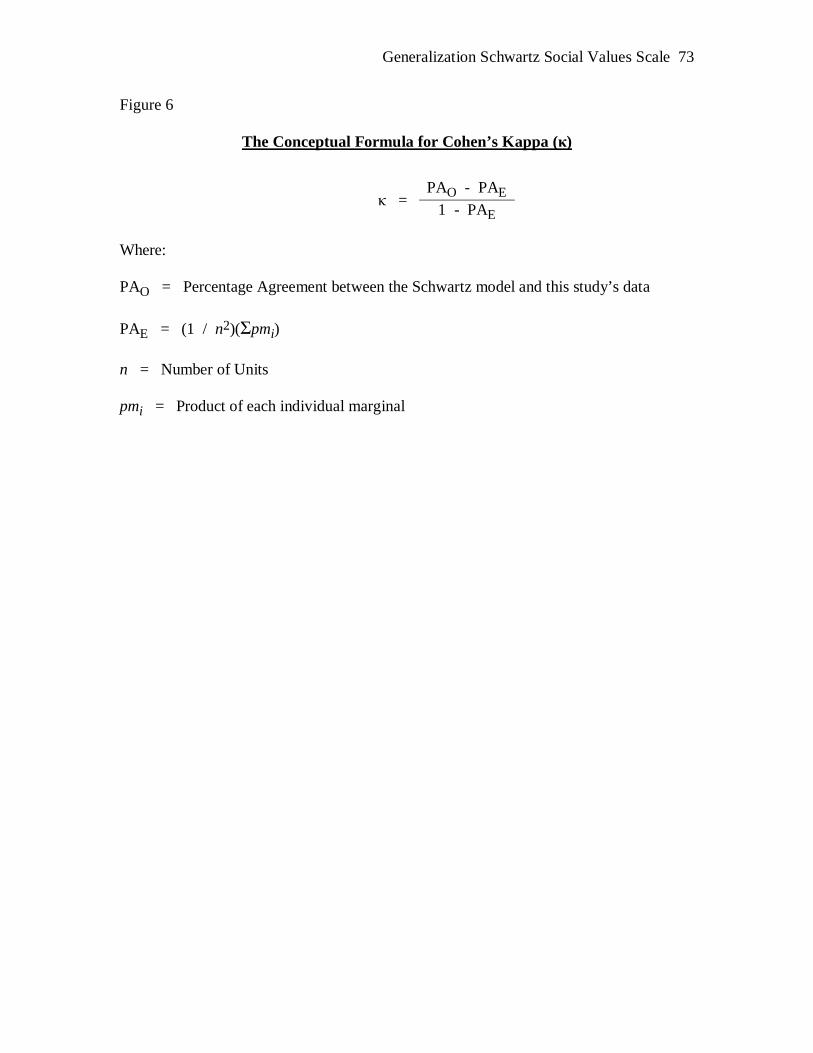
Generalization Schwartz Social Values Scale 73
Figure 6
The Conceptual Formula for Cohen’s Kappa ( )
= PAO - PAE
1 - PAE Where: PAO = Percentage Agreement between the Schwartz model and this study’s data PAE = (1 / n2)( pmi) n = Number of Units pmi = Product of each individual marginal

Generalization Schwartz Social Values Scale 74
Figure 7 An Example Computation for Cohen’s Kappa ( ) Using the example data set from Table 8 and the marginal calculations from Table 9. PAO = 2 + 3 + 2 = 7 PAE = (1 / n2) ( pmi) = (1 / 102) (9 + 15 + 8) = (1 / 100) (32) = (.32)
Cohen’s kappa = PAO - PAE
1 - PAE
= .70 - .32 1 - .32
= .38 .68
= .56
From Neuendorf, K. A. (2002). The content analysis guidebook. Thousand Oaks, CA: Sage Publications.

Generalization Schwartz Social Values Scale 75
Figure 8
Cohen’s Kappa ( ) as an Excel Formula
= ( ( ( SUM ( C60 , D61 , E62 , F63 , G64 , H65 , I66 , J67 , K68 , L69
) ) / 56 ) - ( ( 1 / ( 56 ^ 2 ) ) * ( ( C70 * M60 ) + ( D70 * M61 ) + ( E70 * M62 ) + ( F70 * M63 ) + ( G70 * M64 ) + ( H70 * M65 ) + ( I70 * M66 ) + ( J70 * M67) + ( K70 * M68 ) + ( L70 * M69 ) ) ) ) / ( 1 - * ( ( 1 / ( 56 ^ 2 ) ) * ( ( C70 * M60 ) + ( D70 * M61 ) + ( E70 * M62 ) + ( F70 * M63 ) + ( G70 * M64 ) + ( H70 * M65 ) + ( I70 * M66 ) + ( J70 * M67 ) + ( K70 * M68 ) + ( L70 * M69 ) ) ) )
Where: The cell range is a cross tabulation matrix with marginal sums ranging from C60 to M70 (including marginal sums).

Generalization Schwartz Social Values Scale 76
Table 1
Values and Example Instrumental Iterations of the Rokeach Values Survey
Value Instrumental Iteration
Ability Utilization Use my skill and knowledge
Achievement Have results which show that I have done well
Advancement Get ahead
Aesthetics Make life more beautiful
Altruism Help people with problems
Authority Tell others what to do
Autonomy Act on my own
Creativity Discover, develop, or design new things
Economics Have a high standard of living
Life-Style Living according to my ideas
Personal Development Develop as a person
Physical Activity Get a lot of exercise
Prestige Be admired for my knowledge and skills
Risk Do risky things
Social Interaction Do things with other people
Social Relations Be with friends
Variety Have every day different some way from the one
before it.
Working Conditions Have good space and light in which to work
From: Schwartz, S. H. (1992). Universals in the content and structure of values theoretical advances and empirical tests in 20 countries. In M. P. Zanna (Ed.), Advances in Experimental Social Psychology: Vol. 25 (pp. 1-65). San Diego, CA: Academic Press.

Generalization Schwartz Social Values Scale 77
Table 2 Primary Motivations, Definitions of Primary motivations and Items that Compose the
Primary Motivations for the Schwartz Social Values Scale
Primary
Motivation
Definition Items That Compose the Primary
Motivations on the Schwartz Social
Values Scale
Power Social status and prestige,
control or dominance over
people and of resources.
Social Power, Authority, Wealth,
Preserving my Public Image.
Achievement Personal success through
demonstrating competence
according to social standards.
Successful, Capable, Ambitious,
Influential.
Hedonism Pleasure and sensuous
gratification for oneself.
Pleasure, Enjoying Life.
Stimulation Excitement, novelty, and
challenge in life.
Daring, A Varied Life, An Exciting
Life.
Self-Direction Independent thought and action
choosing, creating, exploring.
Creativity, Freedom, Independent,
Curious, Choosing own Goals.
Universalism Understand appreciation,
tolerance, and protection for the
welfare of all people and for
nature.
Broad-Minded, Wisdom, Social
Justice, Equality, A World at Peace,
A World of Beauty, Unity with
Nature, Protecting the Environment.
Benevolence Preservation and enhancement of
the welfare of people with whom
one is in frequent personal
contact.
Helpful, Honest, Forgiving, Loyal,
Responsible.
Tradition Respect, commitment, and
acceptance of the customs and
ideas that traditional culture or
Humble, Accepting my Portion in
Life, Devout, Respect for Tradition,
Moderate.

Generalization Schwartz Social Values Scale 78
religion provides oneself.
Table 2 (Continued) Primary Motivations, Definitions of Primary Motivations and Items that Compose the
Primary Motivations for the Schwartz Social Values Scale
Primary
Motivation
Definition Items That Compose the
Primary Motivations on the
Schwartz Social Values Scale
Conformity Restraint of actions, inclinations, and
impulses likely to upset or harm others
and violate social expectations or
norms.
Politeness, Obedient, Self-
Discipline, Honoring Parents
and Elders.
Security Safety, harmony, and stability of
society, of relationships, and of self.
Family Security, National
Security, Social Order, Clean,
Reciprocation of Favors.
From: Schwartz, S. H. (1992). Universals in the content and structure of values theoretical advances and empirical tests in 20 countries. In M. P. Zanna (Ed.), Advances in Experimental Social Psychology: Vol. 25 (pp. 1-65). San Diego, CA: Academic Press.
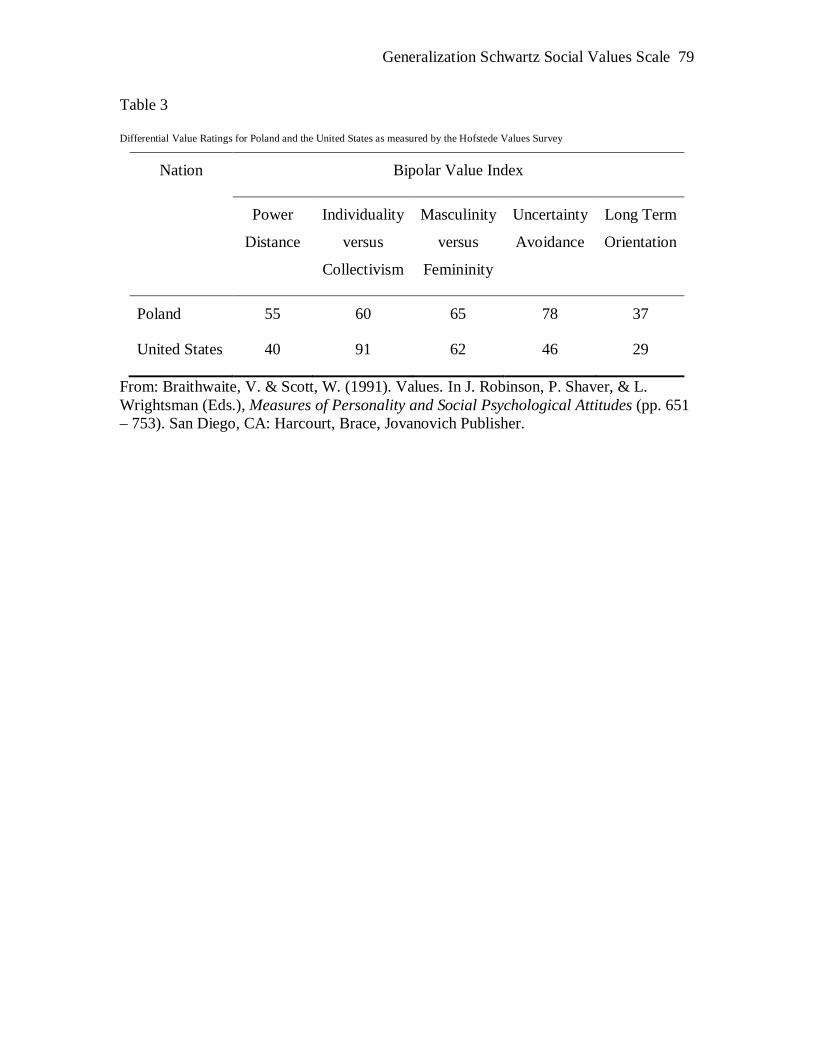
Generalization Schwartz Social Values Scale 79
Table 3
Differential Value Ratings for Poland and the United States as measured by the Hofstede Values Survey
Nation Bipolar Value Index
Power
Distance
Individuality
versus
Collectivism
Masculinity
versus
Femininity
Uncertainty
Avoidance
Long Term
Orientation
Poland 55 60 65 78 37
United States 40 91 62 46 29
From: Braithwaite, V. & Scott, W. (1991). Values. In J. Robinson, P. Shaver, & L. Wrightsman (Eds.), Measures of Personality and Social Psychological Attitudes (pp. 651 – 753). San Diego, CA: Harcourt, Brace, Jovanovich Publisher.

Generalization Schwartz Social Values Scale 80
Table 4 Differences in Vertical Versus Horizontal, Individualism and Collectivism between
Poland and the United States
Statistic
Mean Standard Deviation Alpha
Horizontal Collectivism
Poland 27.20 4.60 0.60
Untied States 25.19 4.50 0.64
Vertical Individualism
Poland 20.19 5.10 0.50
Untied States 18.26 5.60 0.68
Vertical Collectivism
Poland 40.05* 5.10 0.64
United States 37.80* 5.10 0.60
Horizontal Individualism
Poland 32.90 5.70 0.69
United States 33.75 5.70 0.77
*Significantly different as measured by ANOVA (p < 0.01).
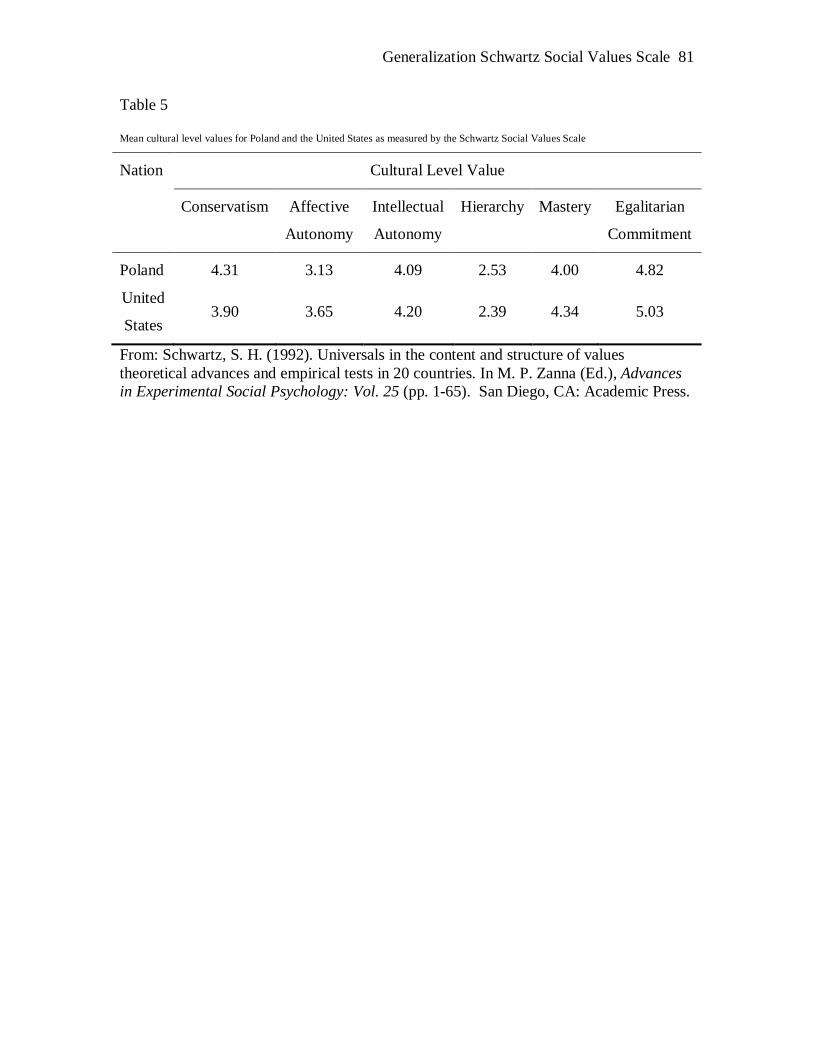
Generalization Schwartz Social Values Scale 81
Table 5 Mean cultural level values for Poland and the United States as measured by the Schwartz Social Values Scale
Nation Cultural Level Value
Conservatism Affective
Autonomy
Intellectual
Autonomy
Hierarchy Mastery Egalitarian
Commitment
Poland 4.31 3.13 4.09 2.53 4.00 4.82
United
States 3.90 3.65 4.20 2.39 4.34 5.03
From: Schwartz, S. H. (1992). Universals in the content and structure of values theoretical advances and empirical tests in 20 countries. In M. P. Zanna (Ed.), Advances in Experimental Social Psychology: Vol. 25 (pp. 1-65). San Diego, CA: Academic Press.

Generalization Schwartz Social Values Scale 82
Table 6 Hypothetical Variables for Association in Arbitrary Units
Observation
Variables
X Y Z
1
(N = 10)
1
(N = 10)
1
(N = 10)
3
2 2 2 4
3 3 3 5
4 4 4 6
5 5 5 7
6 6 6 8
7 7 7 9
8 8 8 10
9 9 9 11
10 10 10 12
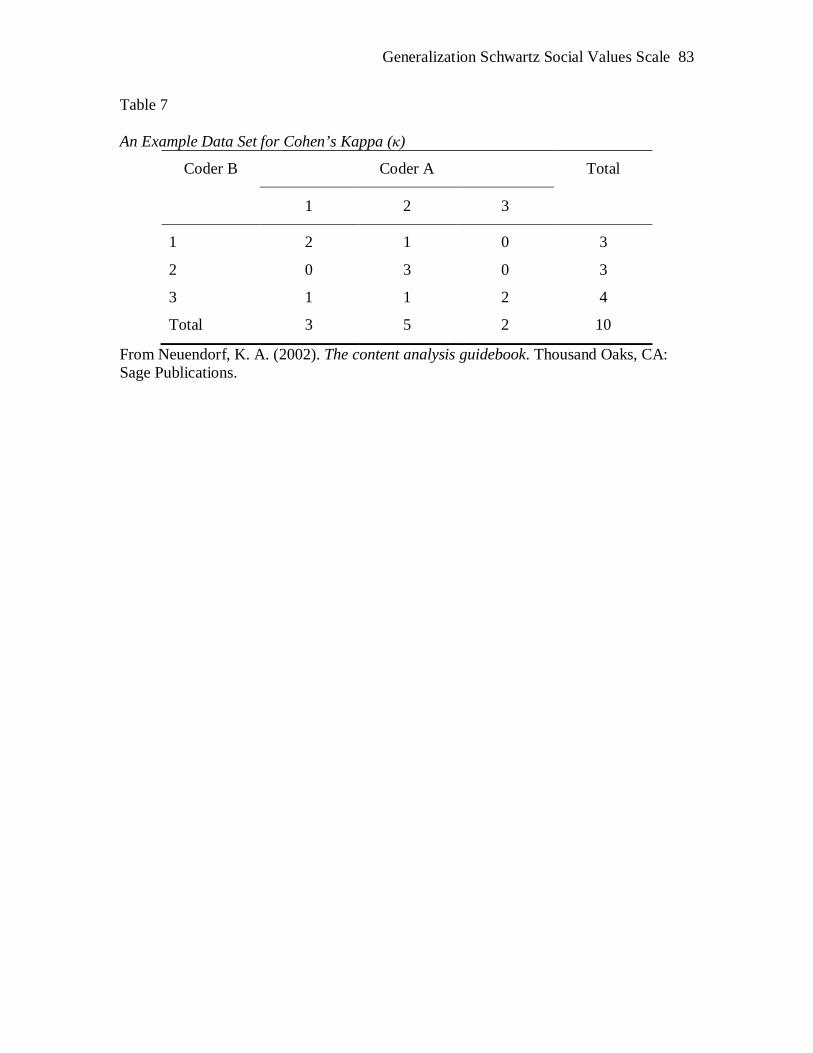
Generalization Schwartz Social Values Scale 83
Table 7 An Example Data Set for Cohen’s Kappa ( )
Coder B Coder A Total
1 2 3
1 2 1 0 3
2 0 3 0 3
3 1 1 2 4
Total 3 5 2 10
From Neuendorf, K. A. (2002). The content analysis guidebook. Thousand Oaks, CA: Sage Publications.

Generalization Schwartz Social Values Scale 84
Table 8 Example Calculation of Marginal Products for the Example Data set Illustrating Cohen’s Kappa ( )
Category Marginals Products of Marginals
A x B Coder A Coder B
1 3 3 9
2 5 3 15
3 2 4 8
Total 10 10 -
From Neuendorf, K. A. (2002). The content analysis guidebook. Thousand Oaks, CA: Sage Publications.
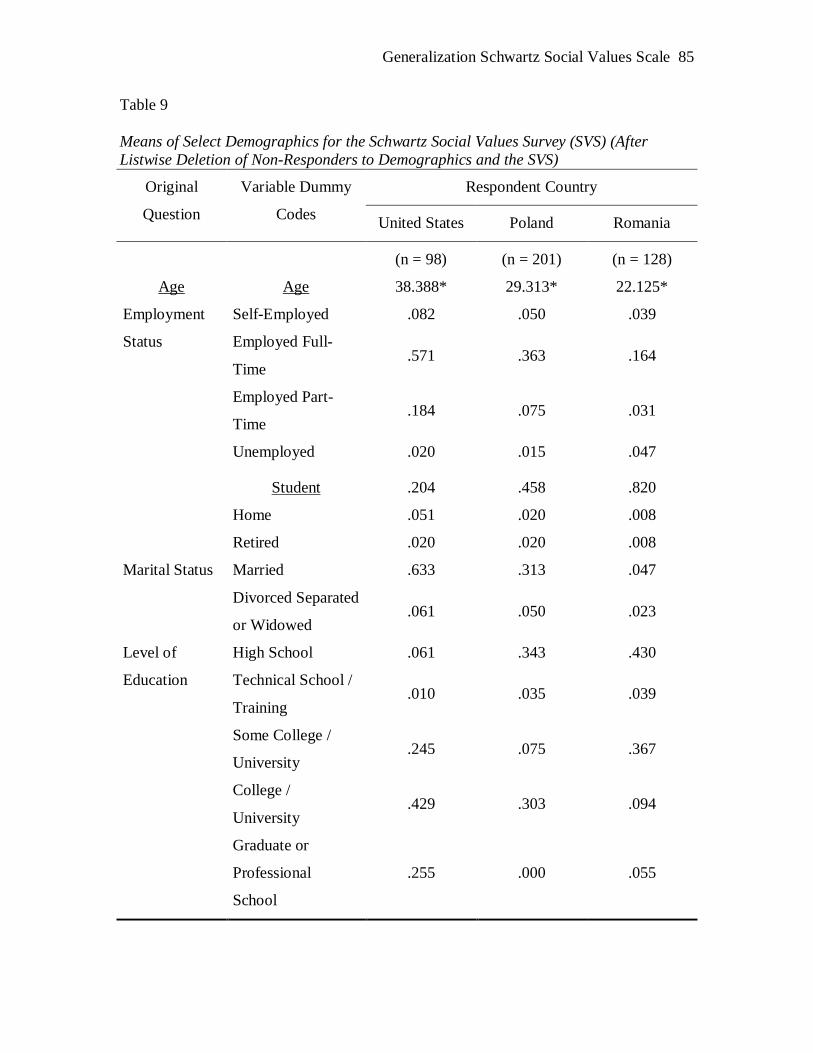
Generalization Schwartz Social Values Scale 85
Table 9 Means of Select Demographics for the Schwartz Social Values Survey (SVS) (After Listwise Deletion of Non-Responders to Demographics and the SVS)
Original
Question
Variable Dummy
Codes
Respondent Country
United States Poland Romania
Age
Age
(n = 98)
38.388*
(n = 201)
29.313*
(n = 128)
22.125*
Employment
Status
Self-Employed .082 .050 .039
Employed Full-
Time .571 .363 .164
Employed Part-
Time .184 .075 .031
Unemployed .020 .015 .047
Student .204 .458 .820
Home .051 .020 .008
Retired .020 .020 .008
Marital Status Married .633 .313 .047
Divorced Separated
or Widowed .061 .050 .023
Level of
Education
High School .061 .343 .430
Technical School /
Training .010 .035 .039
Some College /
University .245 .075 .367
College /
University .429 .303 .094
Graduate or
Professional
School
.255 .000 .055

Generalization Schwartz Social Values Scale 86
Table 9 (Continued) Means of Select Demographics for the Schwartz Social Values Survey (SVS) (After Listwise Deletion of Non-Responders to Demographics and the SVS)
Original
Question
Variable Dummy
Codes
Respondent
Country
Original
Question
Variable
Dummy Codes
Occupation Professional .439 .239 .141
Managerial
Executive .122 .060 .070
Sales .041 .025 .094
Clerical .041 .139 .016
Labor with
Technical Training .020 .020 .031
Labor without
Technical Training .000 .015 .070
Gender Gender (Female = 1) .663 .667 .547
*Standard Deviations for the United States, Poland, and Romania, were 11.717, 14.296, and 3.299, respectively.

Generalization Schwartz Social Values Scale 87
Table 10 Missing Values Summary by Country for Demographics
Variable Country
United
States
Poland Romania Total
Age
(n = 136)
3
(n = 266)
18
(n = 258)
17
(N = 660)
38
Level of Education 2 17 20 40
Household Size 1 16 29 46
Employment Status 0 17 22 39
Marital Status 1 17 16 34
Level of Education 2 17 20 39
Occupation* 0 17 21 38
Income Level 7 40 26 73
* The question regarding Occupation involved a skip pattern controlled by Employment Status.
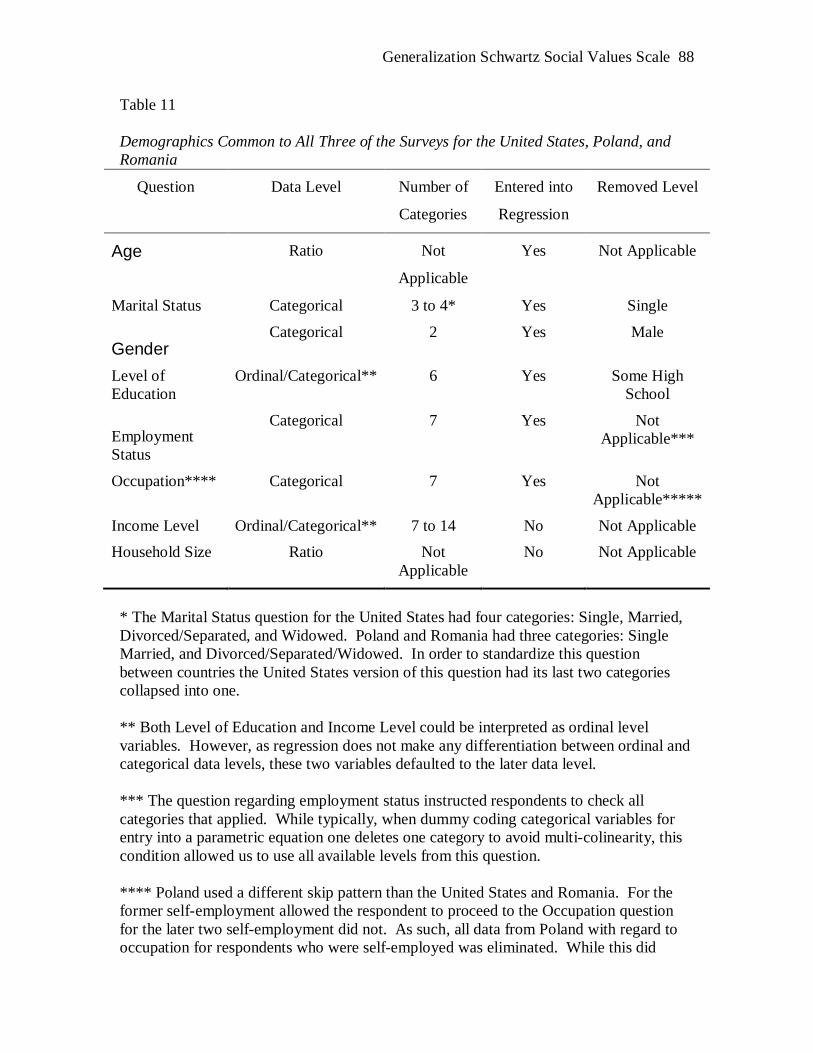
Generalization Schwartz Social Values Scale 88
Table 11 Demographics Common to All Three of the Surveys for the United States, Poland, and Romania
Question Data Level Number of
Categories
Entered into
Regression
Removed Level
Age Ratio Not
Applicable
Yes Not Applicable
Marital Status Categorical 3 to 4* Yes Single
Gender Categorical 2 Yes Male
Level of Education
Ordinal/Categorical** 6 Yes Some High School
Employment Status
Categorical 7 Yes Not Applicable***
Occupation**** Categorical 7 Yes Not Applicable*****
Income Level Ordinal/Categorical** 7 to 14 No Not Applicable Household Size Ratio Not
Applicable No Not Applicable
* The Marital Status question for the United States had four categories: Single, Married, Divorced/Separated, and Widowed. Poland and Romania had three categories: Single Married, and Divorced/Separated/Widowed. In order to standardize this question between countries the United States version of this question had its last two categories collapsed into one. ** Both Level of Education and Income Level could be interpreted as ordinal level variables. However, as regression does not make any differentiation between ordinal and categorical data levels, these two variables defaulted to the later data level. *** The question regarding employment status instructed respondents to check all categories that applied. While typically, when dummy coding categorical variables for entry into a parametric equation one deletes one category to avoid multi-colinearity, this condition allowed us to use all available levels from this question. **** Poland used a different skip pattern than the United States and Romania. For the former self-employment allowed the respondent to proceed to the Occupation question for the later two self-employment did not. As such, all data from Poland with regard to occupation for respondents who were self-employed was eliminated. While this did

Generalization Schwartz Social Values Scale 89
result in the loss of data the issue of parallel or standardized levels of analysis between countries was deemed more important at this stage of the analysis. ***** Respondents were instructed to skip this question depending on their employment level. This alleviated the restriction of deleting one category for the purposes of entry to regression.
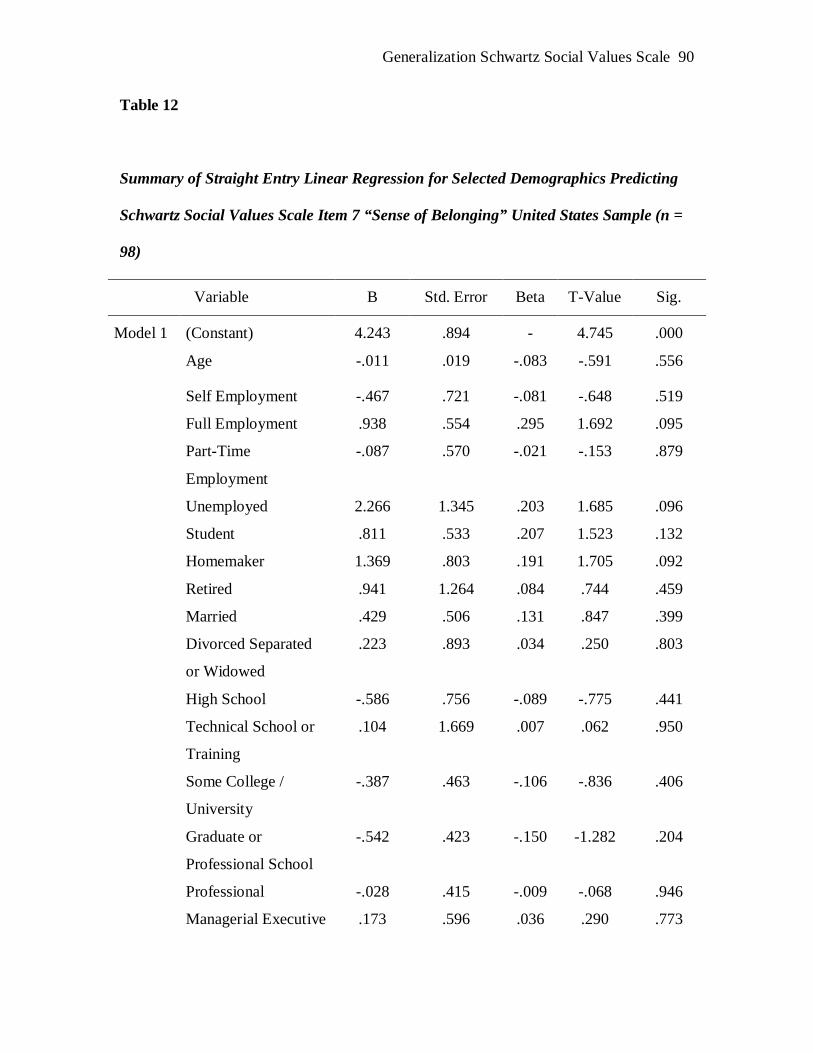
Generalization Schwartz Social Values Scale 90
Table 12
Summary of Straight Entry Linear Regression for Selected Demographics Predicting
Schwartz Social Values Scale Item 7 “Sense of Belonging” United States Sample (n =
98)
Variable B Std. Error Beta T-Value Sig.
Model 1
(Constant) 4.243 .894 - 4.745 .000
Age -.011 .019 -.083 -.591 .556
Self Employment -.467 .721 -.081 -.648 .519
Full Employment .938 .554 .295 1.692 .095
Part-Time
Employment
-.087 .570 -.021 -.153 .879
Unemployed 2.266 1.345 .203 1.685 .096
Student .811 .533 .207 1.523 .132
Homemaker 1.369 .803 .191 1.705 .092
Retired .941 1.264 .084 .744 .459
Married .429 .506 .131 .847 .399
Divorced Separated
or Widowed
.223 .893 .034 .250 .803
High School -.586 .756 -.089 -.775 .441
Technical School or
Training
.104 1.669 .007 .062 .950
Some College /
University
-.387 .463 -.106 -.836 .406
Graduate or
Professional School
-.542 .423 -.150 -1.282 .204
Professional -.028 .415 -.009 -.068 .946
Managerial Executive .173 .596 .036 .290 .773

Generalization Schwartz Social Values Scale 91
Sales .791 .878 .099 .901 .371
Clerical -.739 .910 -.093 -.812 .419
Table 12 (Continued)
Summary of Straight Entry Linear Regression for Selected Demographics Predicting
Schwartz Social Values Scale Item 7 (Sense of Belonging) United States Sample (n =
98)
Variable B Std. Error Beta T-Value Sig.
Model 1
(continued)
Labor with
Technical
Training
1.875 1.329 .168 1.412 .162
Gender 1.091 .379 .327 2.882 .005
Note: R2 = .248 (p < 0.226)
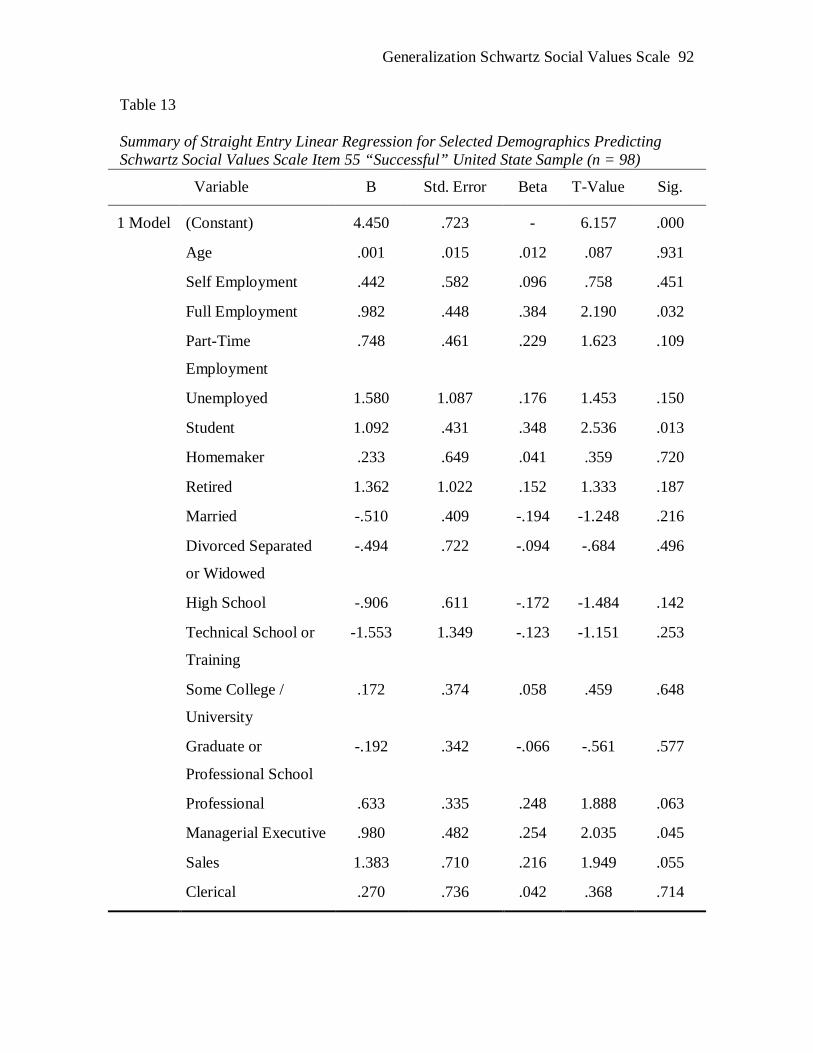
Generalization Schwartz Social Values Scale 92
Table 13 Summary of Straight Entry Linear Regression for Selected Demographics Predicting Schwartz Social Values Scale Item 55 “Successful” United State Sample (n = 98)
Variable B Std. Error Beta T-Value Sig.
1 Model (Constant) 4.450 .723 - 6.157 .000
Age .001 .015 .012 .087 .931
Self Employment .442 .582 .096 .758 .451
Full Employment .982 .448 .384 2.190 .032
Part-Time
Employment
.748 .461 .229 1.623 .109
Unemployed 1.580 1.087 .176 1.453 .150
Student 1.092 .431 .348 2.536 .013
Homemaker .233 .649 .041 .359 .720
Retired 1.362 1.022 .152 1.333 .187
Married -.510 .409 -.194 -1.248 .216
Divorced Separated
or Widowed
-.494 .722 -.094 -.684 .496
High School -.906 .611 -.172 -1.484 .142
Technical School or
Training
-1.553 1.349 -.123 -1.151 .253
Some College /
University
.172 .374 .058 .459 .648
Graduate or
Professional School
-.192 .342 -.066 -.561 .577
Professional .633 .335 .248 1.888 .063
Managerial Executive .980 .482 .254 2.035 .045
Sales 1.383 .710 .216 1.949 .055
Clerical .270 .736 .042 .368 .714
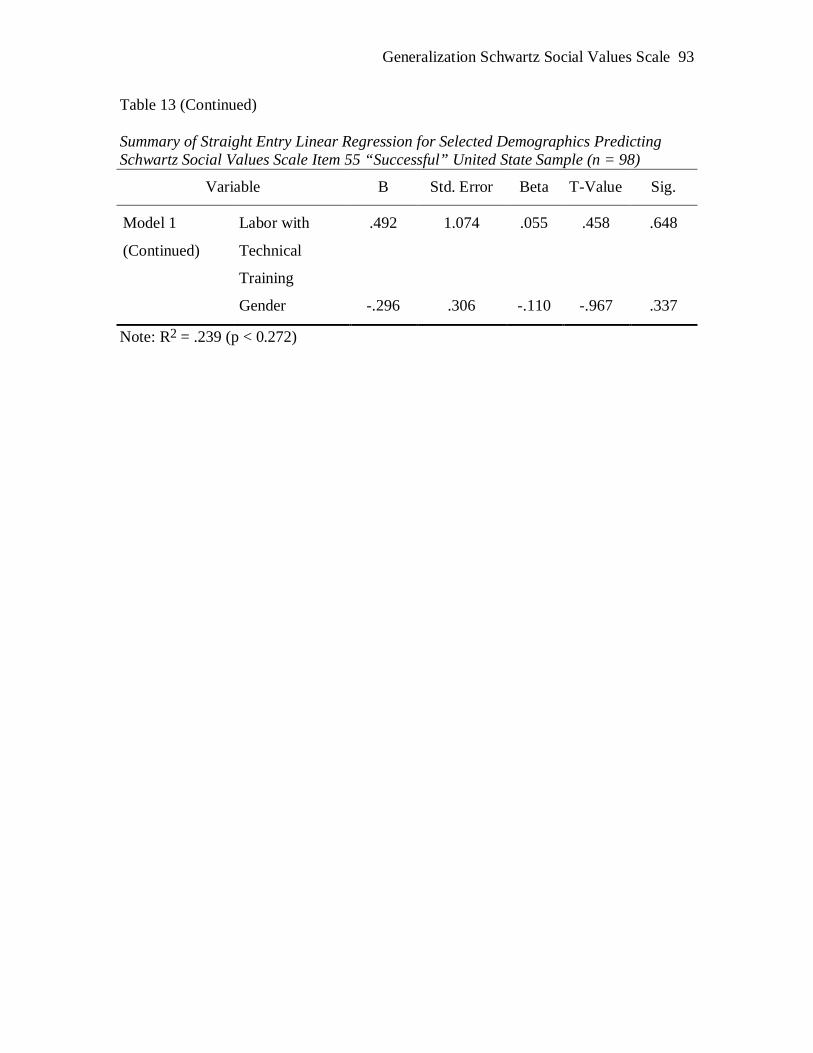
Generalization Schwartz Social Values Scale 93
Table 13 (Continued) Summary of Straight Entry Linear Regression for Selected Demographics Predicting Schwartz Social Values Scale Item 55 “Successful” United State Sample (n = 98)
Variable B Std. Error Beta T-Value Sig.
Model 1
(Continued)
Labor with
Technical
Training
.492 1.074 .055 .458 .648
Gender -.296 .306 -.110 -.967 .337
Note: R2 = .239 (p < 0.272)
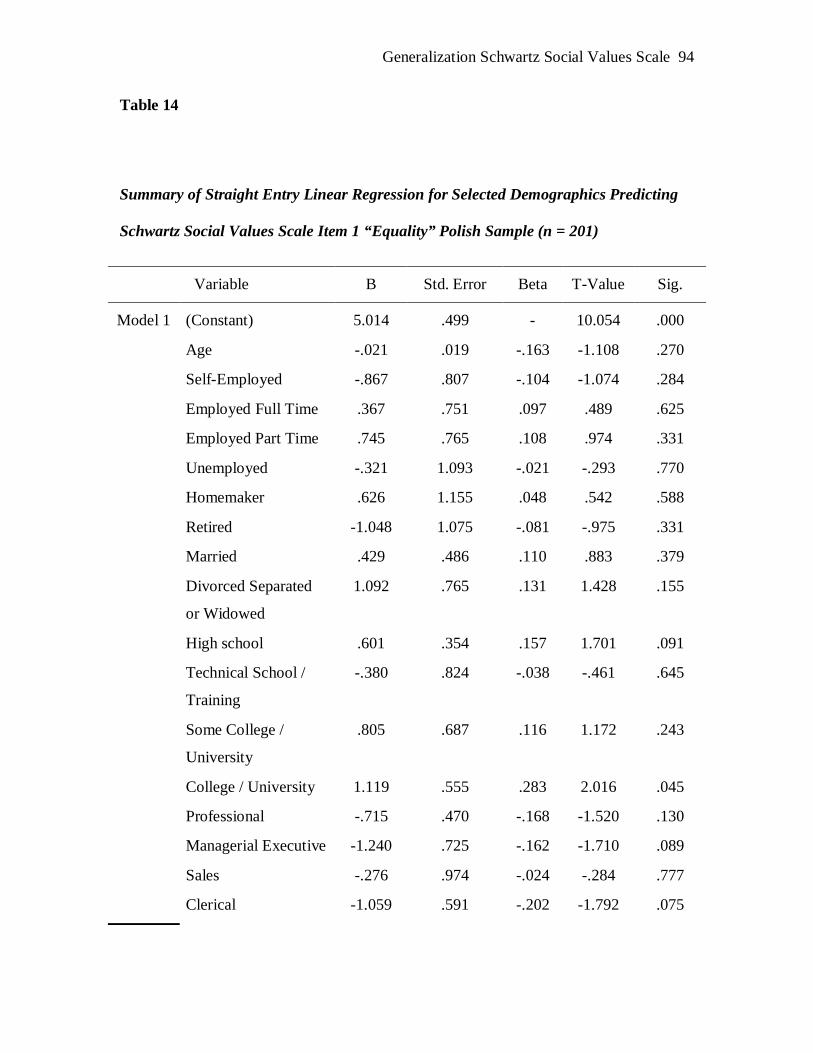
Generalization Schwartz Social Values Scale 94
Table 14
Summary of Straight Entry Linear Regression for Selected Demographics Predicting
Schwartz Social Values Scale Item 1 “Equality” Polish Sample (n = 201)
Variable B Std. Error Beta T-Value Sig.
Model 1 (Constant) 5.014 .499 - 10.054 .000
Age -.021 .019 -.163 -1.108 .270
Self-Employed -.867 .807 -.104 -1.074 .284
Employed Full Time .367 .751 .097 .489 .625
Employed Part Time .745 .765 .108 .974 .331
Unemployed -.321 1.093 -.021 -.293 .770
Homemaker .626 1.155 .048 .542 .588
Retired -1.048 1.075 -.081 -.975 .331
Married .429 .486 .110 .883 .379
Divorced Separated
or Widowed
1.092 .765 .131 1.428 .155
High school .601 .354 .157 1.701 .091
Technical School /
Training
-.380 .824 -.038 -.461 .645
Some College /
University
.805 .687 .116 1.172 .243
College / University 1.119 .555 .283 2.016 .045
Professional -.715 .470 -.168 -1.520 .130
Managerial Executive -1.240 .725 -.162 -1.710 .089
Sales -.276 .974 -.024 -.284 .777
Clerical -1.059 .591 -.202 -1.792 .075
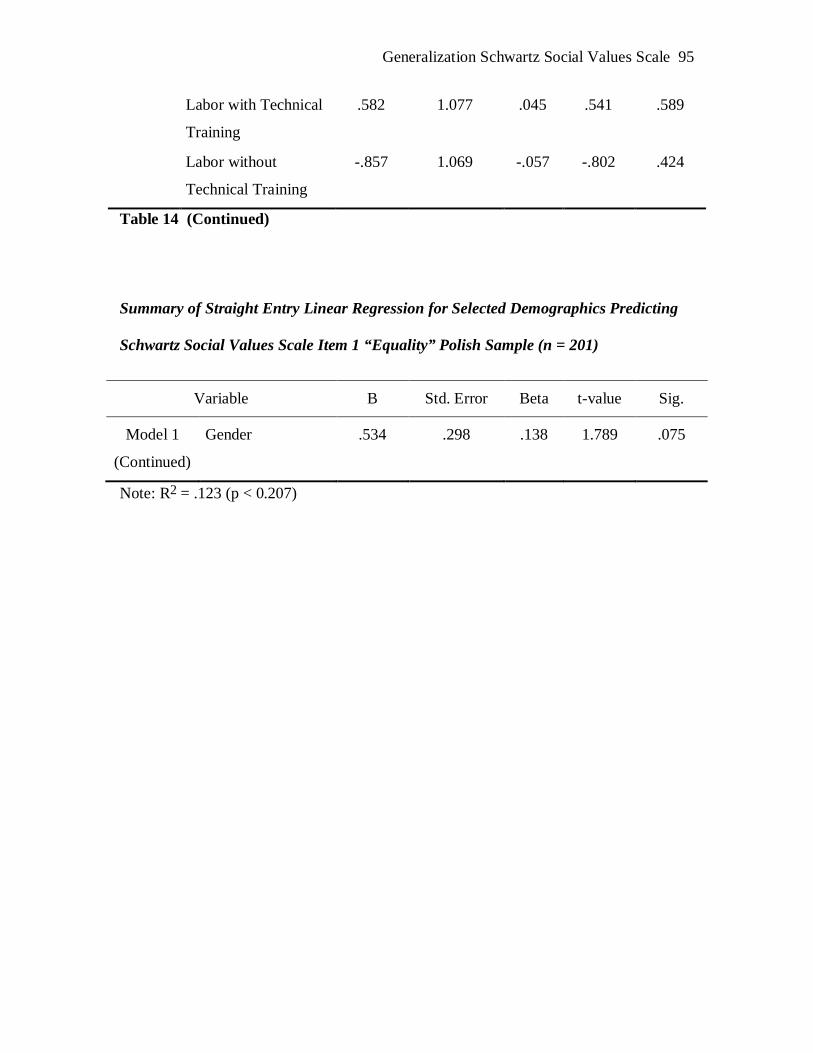
Generalization Schwartz Social Values Scale 95
Labor with Technical
Training
.582 1.077 .045 .541 .589
Labor without
Technical Training
-.857 1.069 -.057 -.802 .424
Table 14 (Continued)
Summary of Straight Entry Linear Regression for Selected Demographics Predicting
Schwartz Social Values Scale Item 1 “Equality” Polish Sample (n = 201)
Variable B Std. Error Beta t-value Sig.
Model 1
(Continued)
Gender .534 .298 .138 1.789 .075
Note: R2 = .123 (p < 0.207)

Generalization Schwartz Social Values Scale 96
Table 15
Summary of Straight Entry Linear Regression for Selected Demographics Predicting
Schwartz Social Values Scale Item 25 “A Varied Life” Polish Sample (n = 210)
Variable B Std. Error Beta T-Value Sig.
Model 1 (Constant) 4.646 .402 - 11.559 .000
Age -.004 .015 -.035 -.234 .815
Self-Employed .208 .651 .031 .320 .749
Employed Full Time .522 .605 .174 .862 .390
Employed Part Time .630 .617 .115 1.021 .309
Unemployed .538 .881 .045 .611 .542
Homemaker .102 .931 .010 .110 .912
Retired -.823 .866 -.080 -.949 .344
Married -.509 .392 -.164 -1.300 .195
Divorced Separated
or Widowed
.596 .616 .090 .966 .335
High School .258 .285 .085 .905 .367
Technical School /
Training
1.007 .664 .128 1.516 .131
Some College /
University
.122 .553 .022 .220 .826
College / University -.107 .447 -.034 -.238 .812
Professional .166 .379 .049 .438 .662
Managerial Executive .412 .584 .068 .705 .482
Sales .381 .785 .041 .486 .628
Clerical -.392 .476 -.094 -.824 .411
Labor with Technical
Training
.583 .868 .057 .672 .502

Generalization Schwartz Social Values Scale 97
Labor without
Technical Training
.815 .861 .069 .946 .345

Generalization Schwartz Social Values Scale 98
Table 15 (Continued)
Summary of Straight Entry Linear Regression for Selected Demographics Predicting Schwartz Social Values Scale Item 25 “A Varied Life” Polish Sample (n = 210)
Variable B Std. Error Beta T-Value Sig.
Model 1
(Continued)
Gender .306 .241 .100 1.271 .205
Note: R2 = .091 (p < 0.585)

Generalization Schwartz Social Values Scale 99
Table 16 Summary of Straight Entry Linear Regression for Selected Demographics Predicting Schwartz Social Values Scale Item 1 “Equality” Romanian Sample (n = 128)
Variable B Std. Error Beta T-Value Sig.
Model 1 (Constant) 4.817 3.907 - 1.233 .220
Age .049 .126 .065 .390 .697
Self-Employed -1.997 1.603 -.155 -1.246 .216
Employed Full Time 1.408 1.497 .209 .940 .349
Employed Part Time 2.123 2.123 .148 1.000 .320
Unemployed -.232 1.256 -.020 -.185 .854
Student .665 1.309 .103 .508 .612
Retired 1.310 4.791 .046 .273 .785
Married -.922 1.225 -.078 -.753 .453
Divorced Separated or
Widowed
.522 1.660 .032 .314 .754
High school -.922 1.903 -.183 -.485 .629
Technical School /
Training
-3.200 2.250 -.249 -1.422 .158
Some College /
University
-1.072 1.904 -.208 -.563 .574
College / University -.877 2.131 -.103 -.411 .682
Graduate or
Professional School
-.868 2.273 -.079 -.382 .703
Professional -.120 .806 -.017 -.149 .882
Managerial Executive .816 1.077 .084 .758 .450
Sales -1.560 1.266 -.183 -1.232 .221
Clerical -1.939 1.864 -.097 -1.040 .301
Labor with Technical
Training
-1.121 1.323 -.078 -.847 .399

Generalization Schwartz Social Values Scale 100
Table 16 (Continued) Summary of Straight Entry Linear Regression for Selected Demographics Predicting Schwartz Social Values Scale Item 1 “Equality” Romanian Sample (n = 128)
Variable B Std. Error Beta T-Value Sig.
Model 1
(Continued)
Gender -.399 .976 -.041 -.409 .683
Labor without
Technical Training
-.576 .516 -.115 -1.116 .267
Note: R2 = .151 (p < 0.595)
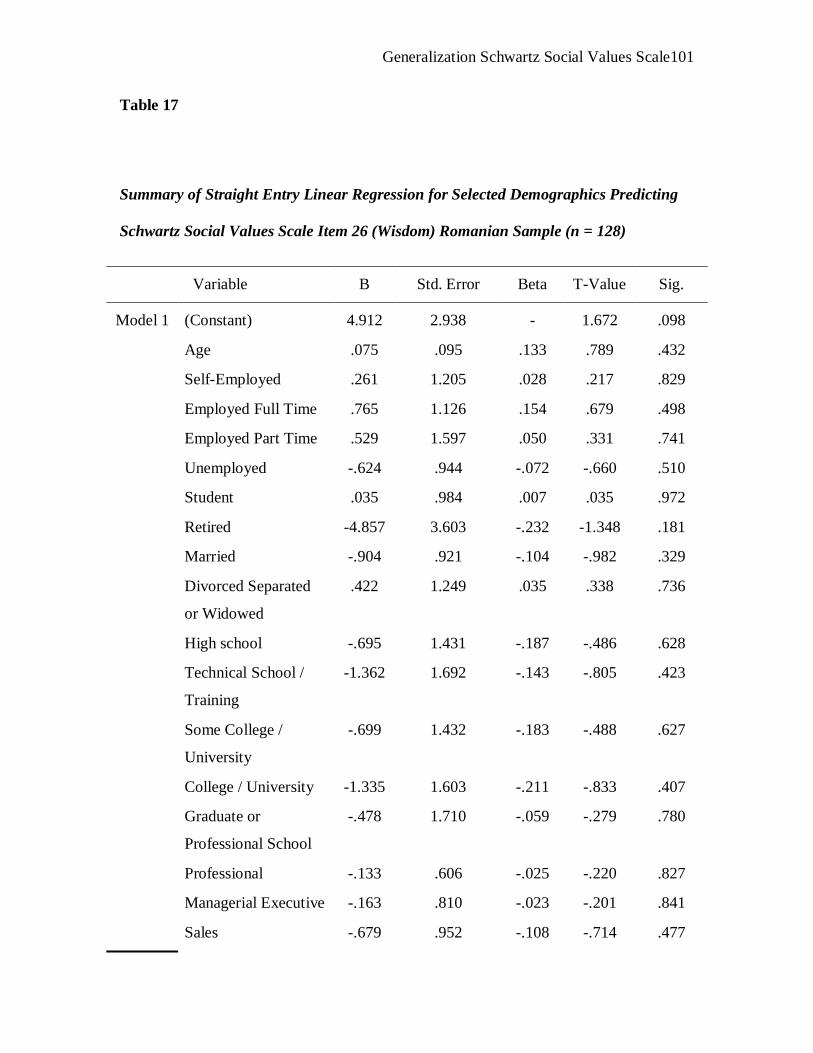
Generalization Schwartz Social Values Scale 101
Table 17
Summary of Straight Entry Linear Regression for Selected Demographics Predicting
Schwartz Social Values Scale Item 26 (Wisdom) Romanian Sample (n = 128)
Variable B Std. Error Beta T-Value Sig.
Model 1 (Constant) 4.912 2.938 - 1.672 .098
Age .075 .095 .133 .789 .432
Self-Employed .261 1.205 .028 .217 .829
Employed Full Time .765 1.126 .154 .679 .498
Employed Part Time .529 1.597 .050 .331 .741
Unemployed -.624 .944 -.072 -.660 .510
Student .035 .984 .007 .035 .972
Retired -4.857 3.603 -.232 -1.348 .181
Married -.904 .921 -.104 -.982 .329
Divorced Separated
or Widowed
.422 1.249 .035 .338 .736
High school -.695 1.431 -.187 -.486 .628
Technical School /
Training
-1.362 1.692 -.143 -.805 .423
Some College /
University
-.699 1.432 -.183 -.488 .627
College / University -1.335 1.603 -.211 -.833 .407
Graduate or
Professional School
-.478 1.710 -.059 -.279 .780
Professional -.133 .606 -.025 -.220 .827
Managerial Executive -.163 .810 -.023 -.201 .841
Sales -.679 .952 -.108 -.714 .477

Generalization Schwartz Social Values Scale 102
Clerical -.793 1.402 -.053 -.566 .573

Generalization Schwartz Social Values Scale 103
Table 17 (Continued)
Summary of Straight Entry Linear Regression for Selected Demographics Predicting Schwartz Social Values Scale Item 26 (Wisdom) Romanian Sample (n = 128)
Variable B Std. Error Beta T-Value Sig.
Model 1
(Continued)
Labor with
Technical
Training
.586 .995 .055 .589 .557
Labor
With Out
Technical
Training
.144 .734 .020 .196 .845
Gender -.636 .388 -.172 -1.638 .104
Note: R2 = .122 (p < 0.824)
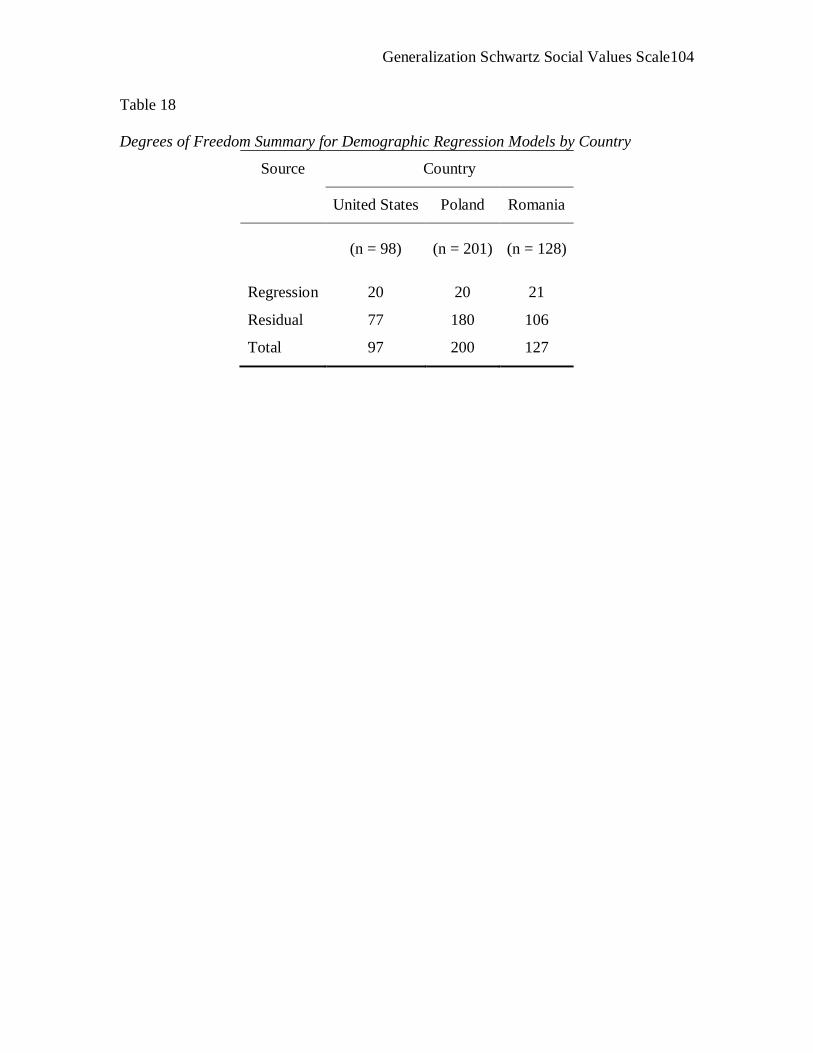
Generalization Schwartz Social Values Scale 104
Table 18 Degrees of Freedom Summary for Demographic Regression Models by Country
Source Country
United States Poland Romania
Regression
(n = 98)
20
(n = 201)
20
(n = 128)
21
Residual 77 180 106
Total 97 200 127
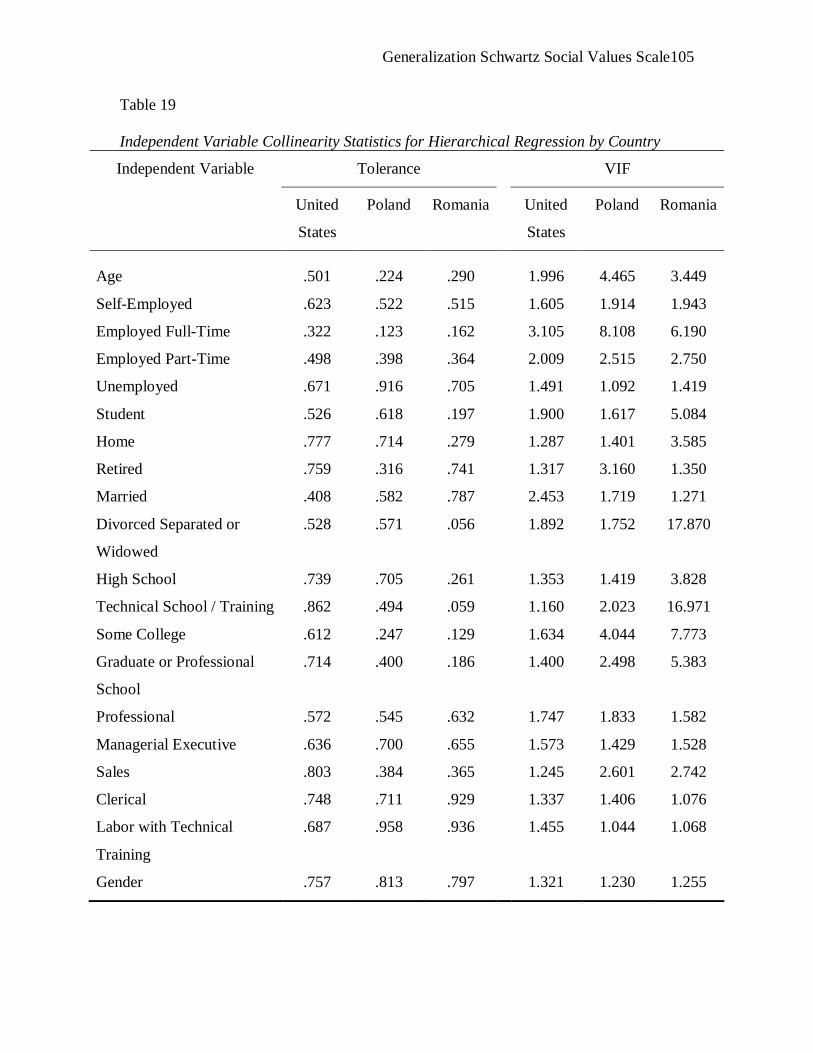
Generalization Schwartz Social Values Scale 105
Table 19 Independent Variable Collinearity Statistics for Hierarchical Regression by Country
Independent Variable Tolerance VIF
United
States
Poland Romania United
States
Poland Romania
Age .501 .224 .290 1.996 4.465 3.449
Self-Employed .623 .522 .515 1.605 1.914 1.943
Employed Full-Time .322 .123 .162 3.105 8.108 6.190
Employed Part-Time .498 .398 .364 2.009 2.515 2.750
Unemployed .671 .916 .705 1.491 1.092 1.419
Student .526 .618 .197 1.900 1.617 5.084
Home .777 .714 .279 1.287 1.401 3.585
Retired .759 .316 .741 1.317 3.160 1.350
Married .408 .582 .787 2.453 1.719 1.271
Divorced Separated or
Widowed
.528 .571 .056 1.892 1.752 17.870
High School .739 .705 .261 1.353 1.419 3.828
Technical School / Training .862 .494 .059 1.160 2.023 16.971
Some College .612 .247 .129 1.634 4.044 7.773
Graduate or Professional
School
.714 .400 .186 1.400 2.498 5.383
Professional .572 .545 .632 1.747 1.833 1.582
Managerial Executive .636 .700 .655 1.573 1.429 1.528
Sales .803 .384 .365 1.245 2.601 2.742
Clerical .748 .711 .929 1.337 1.406 1.076
Labor with Technical
Training
.687 .958 .936 1.455 1.044 1.068
Gender .757 .813 .797 1.321 1.230 1.255

Generalization Schwartz Social Values Scale 106
Table 20 Univariate Descriptors of the 56 by 56 Matrix of Lin’s Concordance Coefficients for the Schwartz Social Values Scale
Measure Country
United States Poland Romania
Mean 0.1991 0.3201 0.3773
Median 0.1951 0.3316 0.3811
Std. Deviation 0.1728 0.1309 0.1485
Variance 0.0299 0.0171 0.0221
Skewness 0.0692 -0.3609 -0.2172
Std. Error of Skewness 0.0624 0.0624 0.0624
Kurtosis -0.1255 -0.1657 0.1527
Std. Error of Kurtosis 0.1246 0.1246 0.1246
Range 1.1462 0.7548 1.0244
Minimum -0.4127 -0.0856 -0.2117
Maximum 0.7335 0.6691 0.8127
Percentiles 25 0.0811 0.2294 0.2899
50 0.1951 0.3316 0.3811
75 0.3162 0.4177 0.4744

Generalization Schwartz Social Values Scale 107
Table 21 Variance Shared by Solution for Weighted Multidimensional Scaling Model by Country
Number of
Dimensions
Variance Shared
Average United States Poland Romania
2 0.409 0.344 0.571 0.312
3 0.530 0.362 0.621 0.607
4 0.594 0.53 0.648 0.604
5 0.564 0.636 0.714 0.343
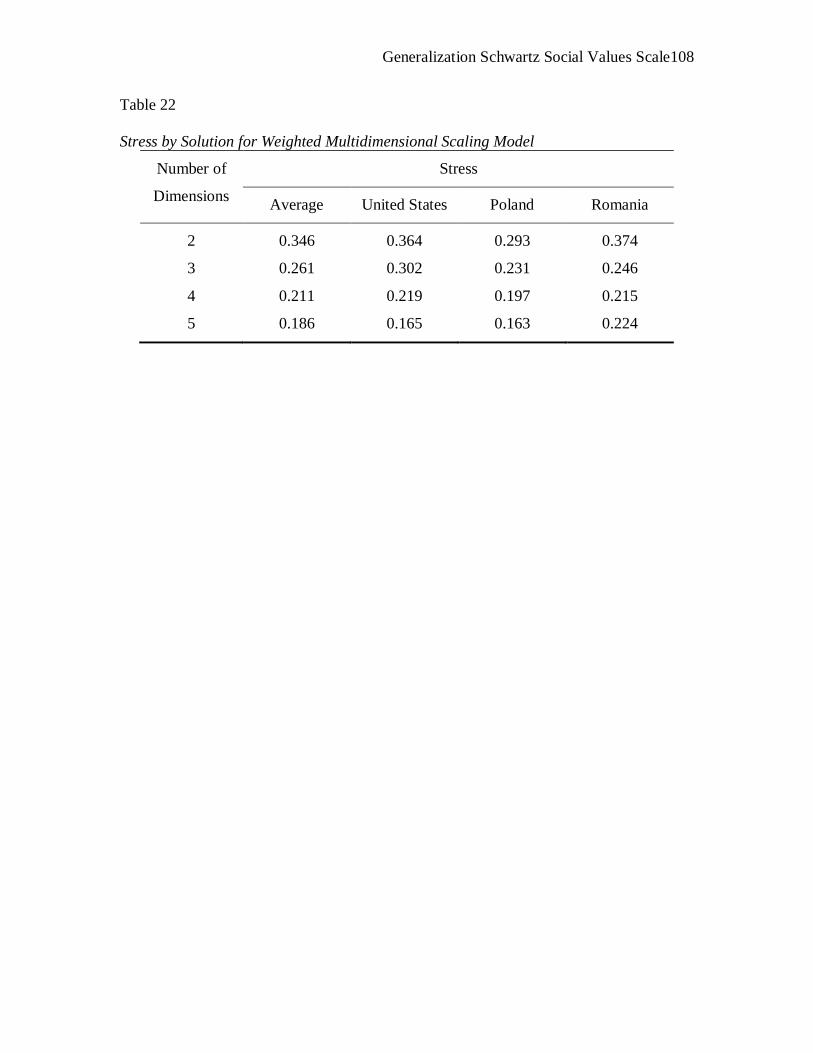
Generalization Schwartz Social Values Scale 108
Table 22 Stress by Solution for Weighted Multidimensional Scaling Model
Number of
Dimensions
Stress
Average United States Poland Romania
2 0.346 0.364 0.293 0.374
3 0.261 0.302 0.231 0.246
4 0.211 0.219 0.197 0.215
5 0.186 0.165 0.163 0.224
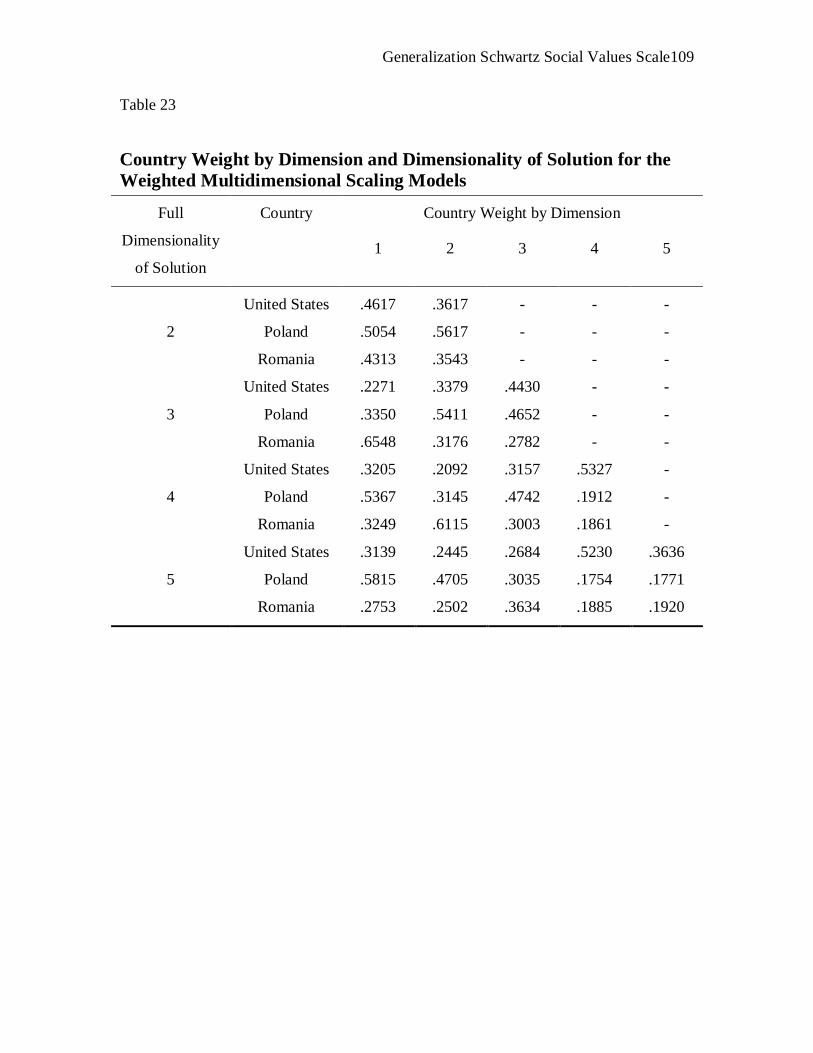
Generalization Schwartz Social Values Scale 109
Table 23
Country Weight by Dimension and Dimensionality of Solution for the Weighted Multidimensional Scaling Models
Full
Dimensionality
of Solution
Country Country Weight by Dimension
1 2 3 4 5
2
United States .4617 .3617 - - -
Poland .5054 .5617 - - -
Romania .4313 .3543 - - -
3
United States .2271 .3379 .4430 - -
Poland .3350 .5411 .4652 - -
Romania .6548 .3176 .2782 - -
4
United States .3205 .2092 .3157 .5327 -
Poland .5367 .3145 .4742 .1912 -
Romania .3249 .6115 .3003 .1861 -
5
United States .3139 .2445 .2684 .5230 .3636
Poland .5815 .4705 .3035 .1754 .1771
Romania .2753 .2502 .3634 .1885 .1920

Generalization Schwartz Social Values Scale 110
Table 24
Weirdness by Dimension and Dimensionality of Solution for the Weighted Multidimensional Scaling Model
Country Weirdness by Dimensionality of Solution
2 3 4 5
United States .0976 .2775 .4075 .3147
Poland .1239 .2034 .2788 .3061
Romania .0676 .3931 .3588 .2002
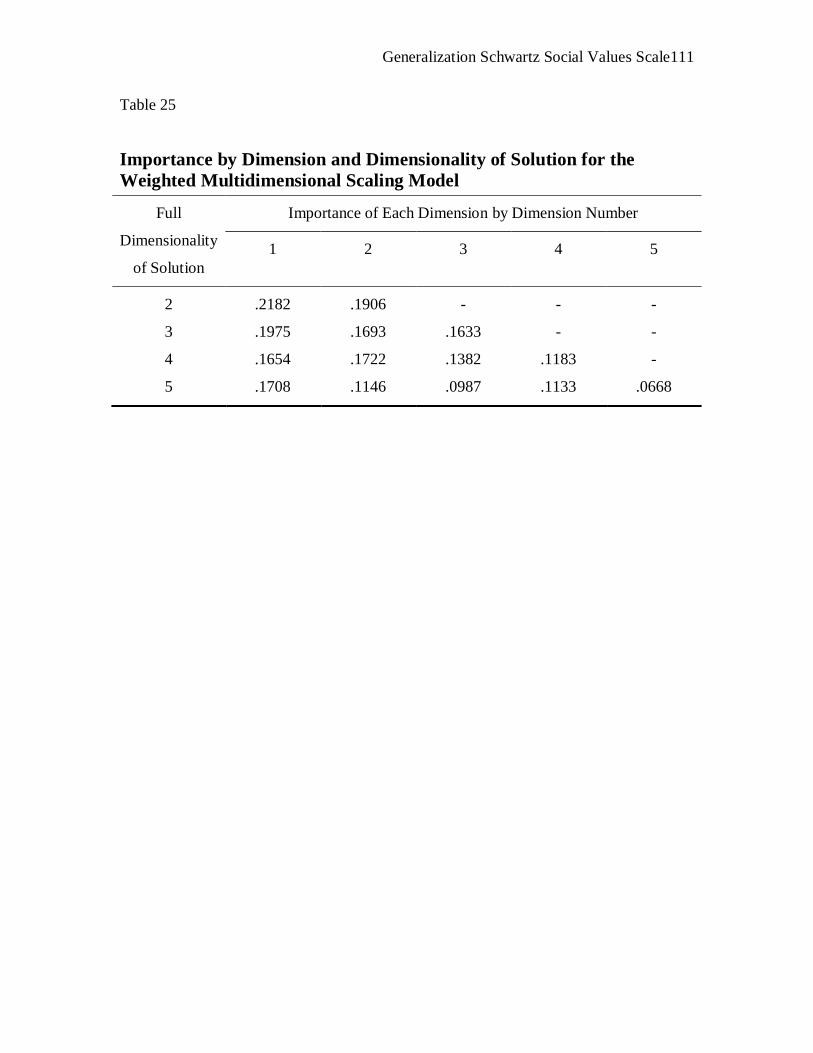
Generalization Schwartz Social Values Scale 111
Table 25
Importance by Dimension and Dimensionality of Solution for the Weighted Multidimensional Scaling Model
Full
Dimensionality
of Solution
Importance of Each Dimension by Dimension Number
1 2 3 4 5
2 .2182 .1906 - - -
3 .1975 .1693 .1633 - -
4 .1654 .1722 .1382 .1183 -
5 .1708 .1146 .0987 .1133 .0668

Generalization Schwartz Social Values Scale 112
Table 26 Iterations to Convergence for the Weighted Multidimensional Scaling Model and
Classic Multidimensional Scaling Models by Country Versus Number of Dimensions
Number of
Dimensions
Iterations to Convergence
Common
Space
United States Poland Romania
1 - 5 6 4
2 6 5 5 7
3 7 6 6 5
4 23 9 6 7
5 32 6 8 6
6 - 10 7 6
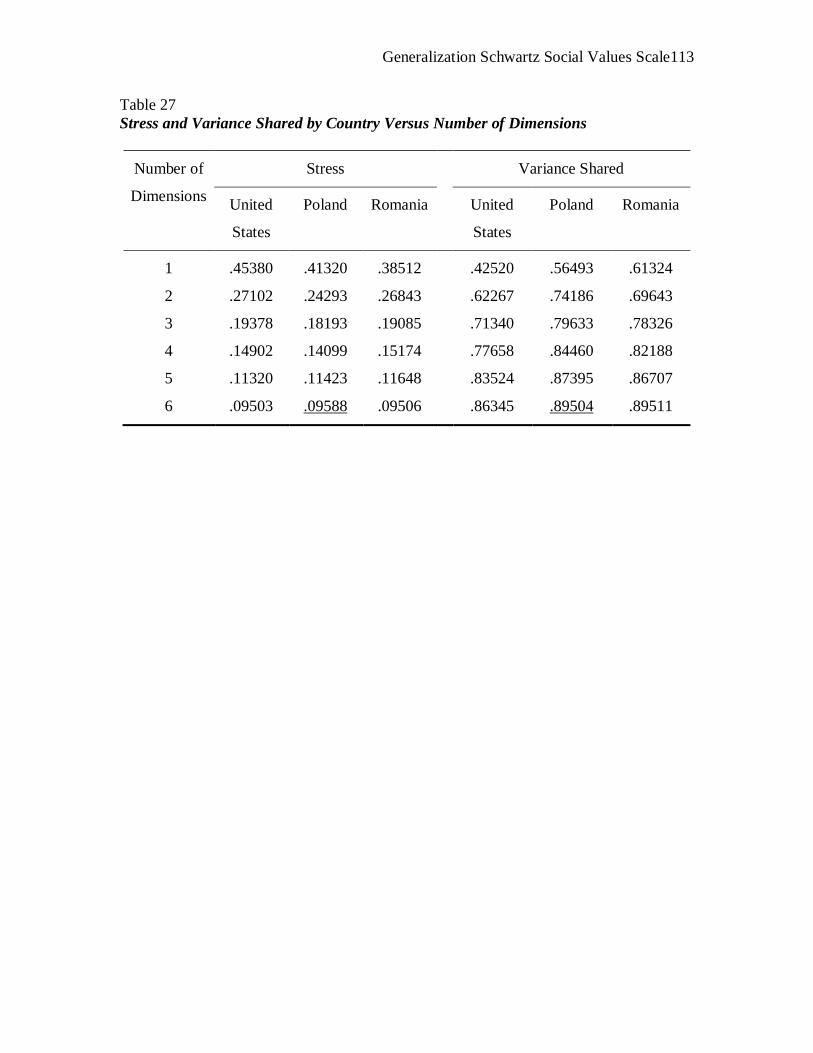
Generalization Schwartz Social Values Scale 113
Table 27 Stress and Variance Shared by Country Versus Number of Dimensions
Number of
Dimensions
Stress Variance Shared
United
States
Poland Romania United
States
Poland Romania
1 .45380 .41320 .38512 .42520 .56493 .61324
2 .27102 .24293 .26843 .62267 .74186 .69643
3 .19378 .18193 .19085 .71340 .79633 .78326
4 .14902 .14099 .15174 .77658 .84460 .82188
5 .11320 .11423 .11648 .83524 .87395 .86707
6 .09503 .09588 .09506 .86345 .89504 .89511

Generalization Schwartz Social Values Scale 114
Table 28 Standardized Discriminant Function Loadings for the Weighted Multidimensional Scaling Model’s Common Space Primary Motivation Type classification
Variable Discriminant Function
1 2 3 4 5
Common Space Dimension 1 0.715 0.695 -0.046 -0.370 -0.014
Common Space Dimension 2 -0.577 0.716 -0.365 0.350 -0.076
Common Space Dimension 3 0.340 0.414 0.701 0.550 -0.036
Common Space Dimension 4 -0.559 0.214 0.392 -0.375 0.768
Common Space Dimension 5 0.877 -0.238 -0.453 0.471 0.404
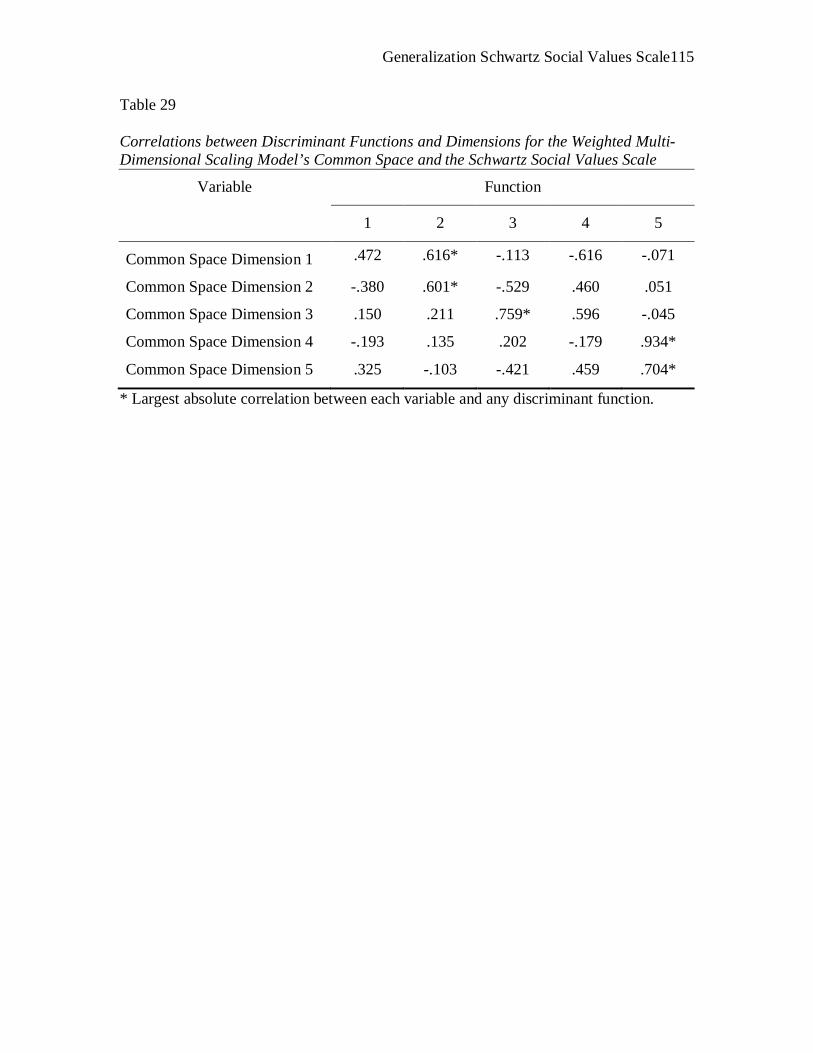
Generalization Schwartz Social Values Scale 115
Table 29 Correlations between Discriminant Functions and Dimensions for the Weighted Multi-Dimensional Scaling Model’s Common Space and the Schwartz Social Values Scale
Variable Function
1 2 3 4 5
Common Space Dimension 1 .472 .616* -.113 -.616 -.071
Common Space Dimension 2 -.380 .601* -.529 .460 .051
Common Space Dimension 3 .150 .211 .759* .596 -.045
Common Space Dimension 4 -.193 .135 .202 -.179 .934*
Common Space Dimension 5 .325 -.103 -.421 .459 .704*
* Largest absolute correlation between each variable and any discriminant function.

Generalization Schwartz Social Values Scale 116
Table 30 Mean Scores for each primary Motivation Type (centroids) for the Discriminant Functions Analyzing the Weighted Multidimensional Scaling model of the Schwartz Social Values Scale
Primary Motivation Type
Common Space Model
Discriminant Function
1 2 3 4 5
Power 3.594 2.450 0.011 0.123 -0.015
Achievement 2.296 0.287 -0.507 -0.709 0.659
Hedonism 2.960 -1.822 1.044 -0.417 -0.421
Stimulation 2.507 -1.231 0.138 -1.609 -0.714
Self-Direction 1.013 -1.653 -0.294 0.549 0.011
Universalism -0.861 -1.520 -0.827 0.376 -0.008
Benevolence -2.608 -0.600 0.723 -0.523 0.110
Tradition -2.077 2.336 -0.887 -0.248 -0.577
Conformity -2.152 1.700 0.081 -0.244 0.411
Security -0.032 0.915 0.882 1.013 -0.041

Generalization Schwartz Social Values Scale 117
Table 31 Common Space Tests of Significance for Multiple Discriminant Regression Analyzing the Weighted Multidimensional Scaling Model’s Common Space of the Schwartz Social Values Scale
Test of Function(s) Discriminant Functions
1 through 5 2 through 5 3 through 5 4 through 5 5
Wilks' Lambda 0.016 0.100 0.385 0.598 0.881
Chi-square 197.080 109.463 45.385 24.460 5.994
Degrees of Freedom 45 32 21 12 5
Significance 0.000 0.000 0.002 0.018 0.307
Canonical Correlation 0.918 0.861 0.597 0.568 0.344
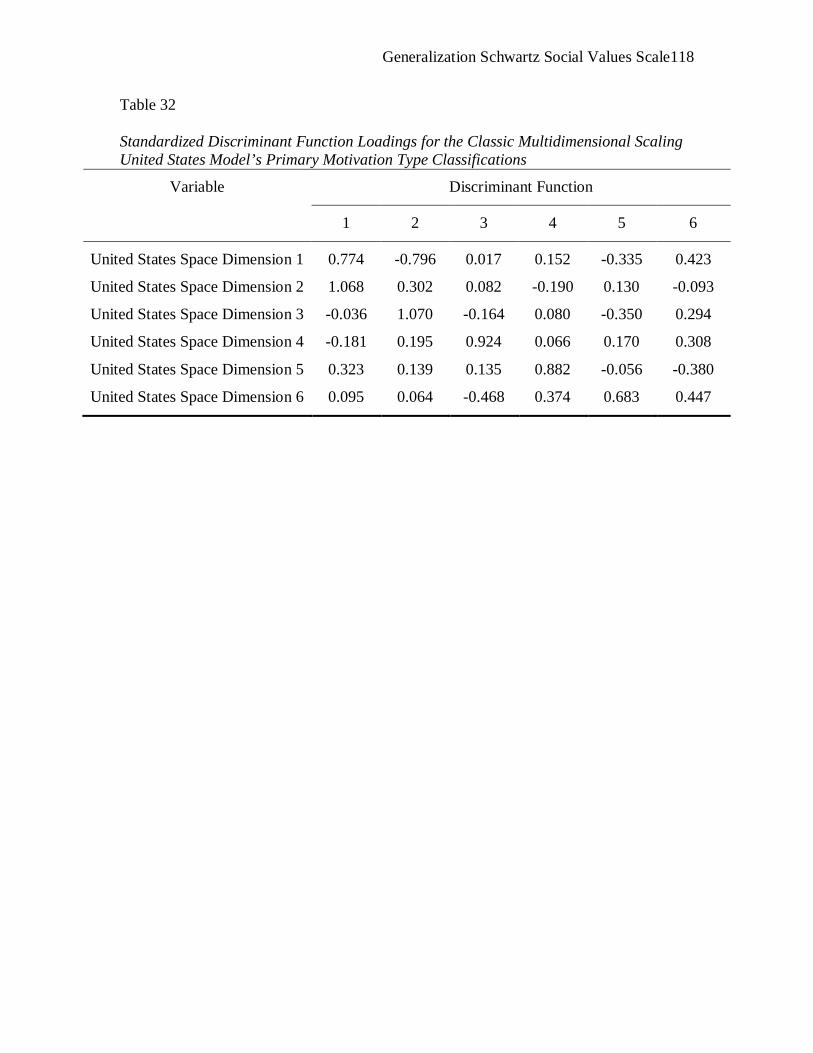
Generalization Schwartz Social Values Scale 118
Table 32 Standardized Discriminant Function Loadings for the Classic Multidimensional Scaling United States Model’s Primary Motivation Type Classifications
Variable Discriminant Function
1 2 3 4 5 6
United States Space Dimension 1 0.774 -0.796 0.017 0.152 -0.335 0.423
United States Space Dimension 2 1.068 0.302 0.082 -0.190 0.130 -0.093
United States Space Dimension 3 -0.036 1.070 -0.164 0.080 -0.350 0.294
United States Space Dimension 4 -0.181 0.195 0.924 0.066 0.170 0.308
United States Space Dimension 5 0.323 0.139 0.135 0.882 -0.056 -0.380
United States Space Dimension 6 0.095 0.064 -0.468 0.374 0.683 0.447
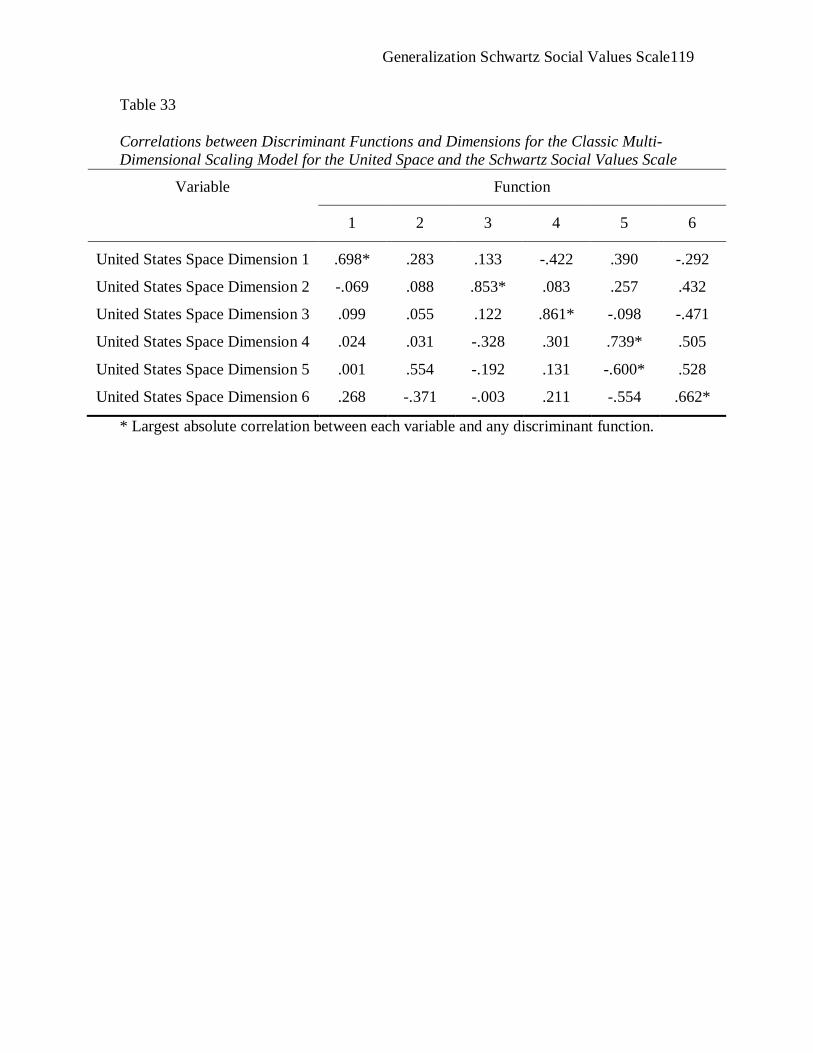
Generalization Schwartz Social Values Scale 119
Table 33 Correlations between Discriminant Functions and Dimensions for the Classic Multi-Dimensional Scaling Model for the United Space and the Schwartz Social Values Scale
Variable Function
1 2 3 4 5 6
United States Space Dimension 1 .698* .283 .133 -.422 .390 -.292
United States Space Dimension 2 -.069 .088 .853* .083 .257 .432
United States Space Dimension 3 .099 .055 .122 .861* -.098 -.471
United States Space Dimension 4 .024 .031 -.328 .301 .739* .505
United States Space Dimension 5 .001 .554 -.192 .131 -.600* .528
United States Space Dimension 6 .268 -.371 -.003 .211 -.554 .662*
* Largest absolute correlation between each variable and any discriminant function.

Generalization Schwartz Social Values Scale 120
Table 34 United States Mean scores (centroids) for each primary Motivation Type with Regard to Discriminant Functions for Classic Multidimensional Scaling Model of the Schwartz Social Values Scale
Primary Motivation Type
United States Model
Discriminant Function
1 2 3 4 5 6
Power -4.340 -0.331 1.040 0.071 -0.377 0.216
Achievement -1.311 -0.277 -1.313 1.342 0.261 0.016
Hedonism -1.201 1.896 -0.276 -1.309 0.035 -0.356
Stimulation -1.226 1.393 0.475 -0.083 0.621 -0.892
Self-Direction 0.169 1.784 -0.332 -0.325 0.035 0.168
Universalism 1.252 1.994 0.242 0.456 -0.196 0.039
Benevolence 2.174 -0.887 0.133 -0.310 0.012 0.199
Tradition 0.824 -1.546 1.380 0.388 0.517 -0.072
Conformity 1.160 -2.185 -0.325 0.178 -0.817 -0.488
Security -0.924 -1.631 -0.774 -0.666 0.190 0.099

Generalization Schwartz Social Values Scale 121
Table 35 Tests of Significance for the Multiple Discriminant Regression Analyzing the Classic Multidimensional Scaling United States’ Space Model of the Schwartz Social Values Scale
Test of
Function(s)
Discriminant Functions
1 through 6 2 through 6 3 through 6 4 through 6 5 through 6 6
Wilks' Lambda 0.017 0.087 0.332 0.551 0.810 0.923
Chi-Square 190.170 115.001 51.828 28.038 9.910 3.749
Degrees of
Freedom 54 40 28 18 10 4
Significance 0.000 0.000 0.004 0.061 0.448 0.441
Canonical
Correlations 0.893 0.860 0.630 0.566 0.351 0.277

Generalization Schwartz Social Values Scale 122
Table 36 Standardized Discriminant Function Loadings for the Classic Multidimensional Scaling Polish Space Model’s Common Space Primary Motivation Type Classification
Variable Discriminant Function
1 2 3 4 5 6
Polish Space Dimension 1 0.698 0.772 -0.132 0.077 -0.106 -0.021
Polish Space Dimension 2 -0.838 0.614 -0.229 -0.036 0.048 0.090
Polish Space Dimension 3 -0.206 0.297 0.619 0.739 0.232 0.010
Polish Space Dimension 4 0.176 0.477 0.698 -0.520 0.300 0.226
Polish Space Dimension 5 0.220 -0.262 -0.089 0.181 -0.284 0.918
Polish Space Dimension 6 0.431 -0.210 -0.552 0.044 0.766 0.214
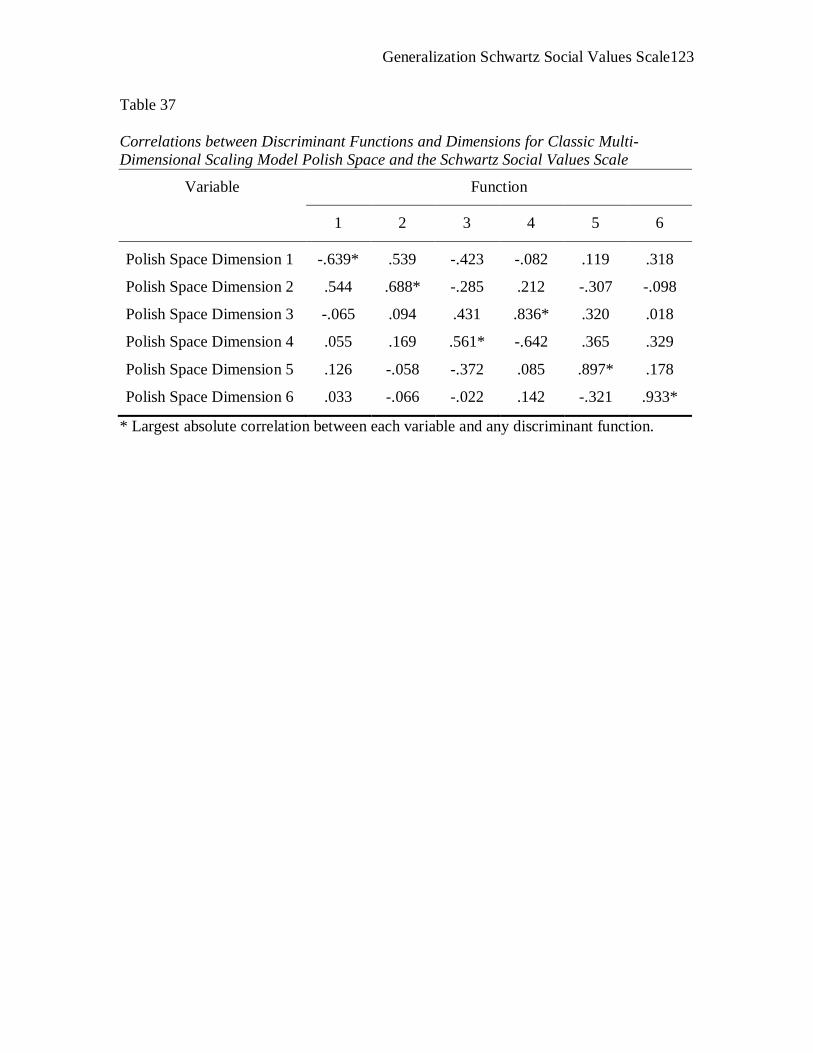
Generalization Schwartz Social Values Scale 123
Table 37 Correlations between Discriminant Functions and Dimensions for Classic Multi-Dimensional Scaling Model Polish Space and the Schwartz Social Values Scale
Variable Function
1 2 3 4 5 6
Polish Space Dimension 1 -.639* .539 -.423 -.082 .119 .318
Polish Space Dimension 2 .544 .688* -.285 .212 -.307 -.098
Polish Space Dimension 3 -.065 .094 .431 .836* .320 .018
Polish Space Dimension 4 .055 .169 .561* -.642 .365 .329
Polish Space Dimension 5 .126 -.058 -.372 .085 .897* .178
Polish Space Dimension 6 .033 -.066 -.022 .142 -.321 .933*
* Largest absolute correlation between each variable and any discriminant function.

Generalization Schwartz Social Values Scale 124
Table 38 Polish Mean scores (centroids) for each Primary Motivation Type for Discriminant Functions Analyzing the Classic Multidimensional Scaling (WMDS) Model of the Schwartz Social Values Scale (SVS)
Primary Motivation Type
Polish Model
Discriminant Function
1 2 3 4 5 6
Power -1.581 -3.206 0.304 -0.707 0.367 0.088
Achievement -2.124 -0.954 0.273 0.510 -0.266 -0.306 Hedonism -4.147 1.183 0.271 -0.330 -0.762 0.213 Stimulation -3.214 0.943 1.271 0.860 1.092 0.097 Self-Direction -0.674 0.910 -1.044 0.381 -0.039 0.124 Universalism 0.740 1.729 0.351 -0.272 0.162 -0.240 Benevolence 1.105 1.527 0.388 -0.246 -0.002 0.170 Tradition 2.184 -1.750 1.328 0.165 -0.418 -0.022 Conformity 2.444 -1.431 -0.050 0.644 0.083 0.196 Security 0.688 -0.834 -1.718 -0.166 0.028 -0.093
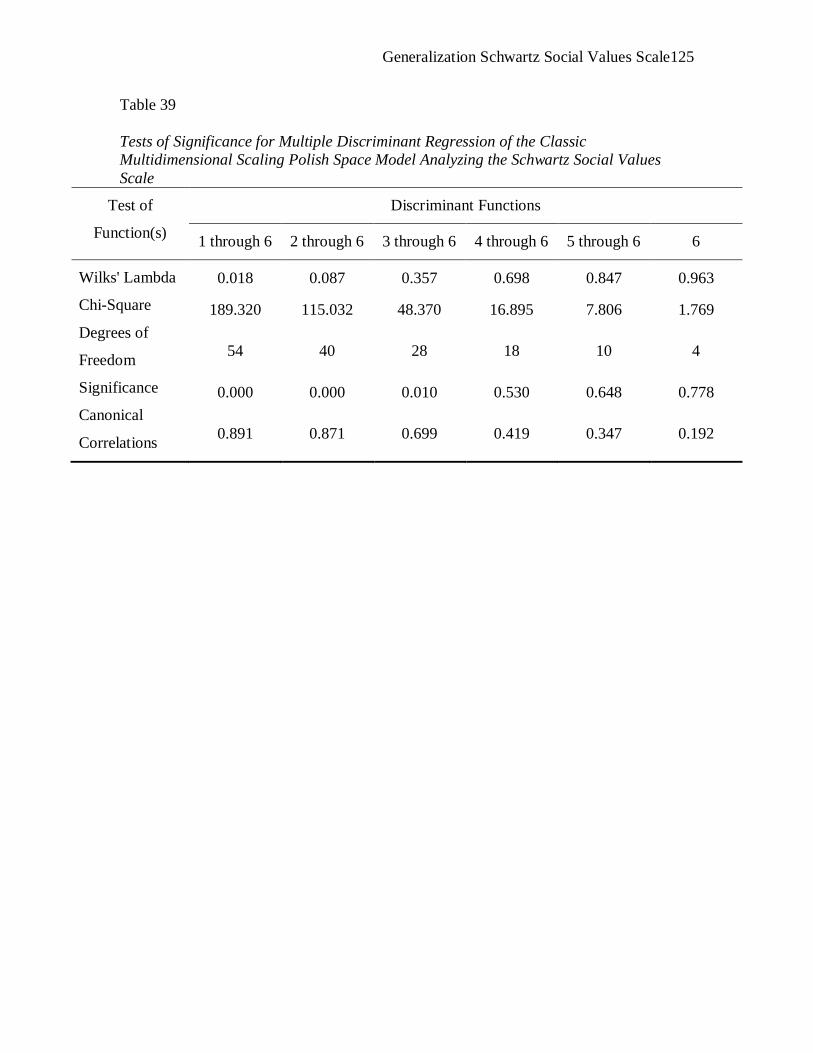
Generalization Schwartz Social Values Scale 125
Table 39 Tests of Significance for Multiple Discriminant Regression of the Classic Multidimensional Scaling Polish Space Model Analyzing the Schwartz Social Values Scale
Test of
Function(s)
Discriminant Functions
1 through 6 2 through 6 3 through 6 4 through 6 5 through 6 6
Wilks' Lambda 0.018 0.087 0.357 0.698 0.847 0.963
Chi-Square 189.320 115.032 48.370 16.895 7.806 1.769 Degrees of
Freedom 54 40 28 18 10 4
Significance 0.000 0.000 0.010 0.530 0.648 0.778 Canonical
Correlations 0.891 0.871 0.699 0.419 0.347 0.192

Generalization Schwartz Social Values Scale 126
Table 40 Standardized Discriminant Function Loadings for the Classic Multidimensional Scaling Analysis of the Romanian Space Model’s Common Space Classifying the Primary Motivation Types
Variable Discriminant Function
1 2 3 4 5 6
Romanian Space Dimension 1 -0.923 0.321 0.240 0.491 -0.043 0.257
Romanian Space Dimension 2 -0.111 -0.888 0.303 0.209 0.280 0.144
Romanian Space Dimension 3 1.039 0.175 0.295 0.259 -0.139 0.255
Romanian Space Dimension 4 0.218 0.005 -0.806 0.253 0.275 0.443
Romanian Space Dimension 5 0.132 0.480 0.300 -0.081 0.834 -0.055
Romanian Space Dimension 6 -0.238 0.004 0.204 -0.639 -0.080 0.717

Generalization Schwartz Social Values Scale 127
Table 41 Correlations between Discriminant Functions and Dimensions for Classic Multi-Dimensional Scaling Model Romanian Space and the Schwartz Social Values Scale
Variable Function
1 2 3 4 5 6
Romanian Space Dimension 1 .551* .173 .440 .457 -.272 .434
Romanian Space Dimension 2 -.017 -.799* .314 .271 .389 .193 Romanian Space Dimension 3 .068 -.016 -.748* .265 .327 .508 Romanian Space Dimension 4 -.417 .329 .273 .691* -.130 .384 Romanian Space Dimension 5 .046 .321 .244 -.127 .902* -.069 Romanian Space Dimension 6 -.081 .015 .163 -.639 -.068 .744*
* Largest absolute correlation between each variable and any discriminant function.

Generalization Schwartz Social Values Scale 128
Table 42 Romanian Mean Scores (centroids) for each Primary Motivation Type with regard to Discriminant Functions for Weighted Multidimensional Scaling Model of the Schwartz Social Values Scale
Primary Motivation Type
Romanian Model
Discriminant Function
1 2 3 4 5 6
Power -3.477 -1.059 0.349 0.152 -0.083 0.140
Achievement -0.915 0.335 -0.791 0.112 -0.194 -0.105
Hedonism -1.903 0.478 0.184 -0.198 -0.354 -0.430
Stimulation -2.342 0.318 0.061 -0.949 0.550 0.128
Self-Direction -0.359 0.663 -0.644 0.330 0.367 0.031
Universalism 0.927 0.148 0.414 -0.363 0.167 -0.065
Benevolence 0.903 0.333 -0.181 -0.234 -0.349 0.183
Tradition 1.731 -1.789 -0.451 -0.044 0.110 -0.094
Conformity 1.318 -0.155 0.044 0.327 -0.100 0.004
Security 0.638 0.306 0.861 0.449 0.039 0.005
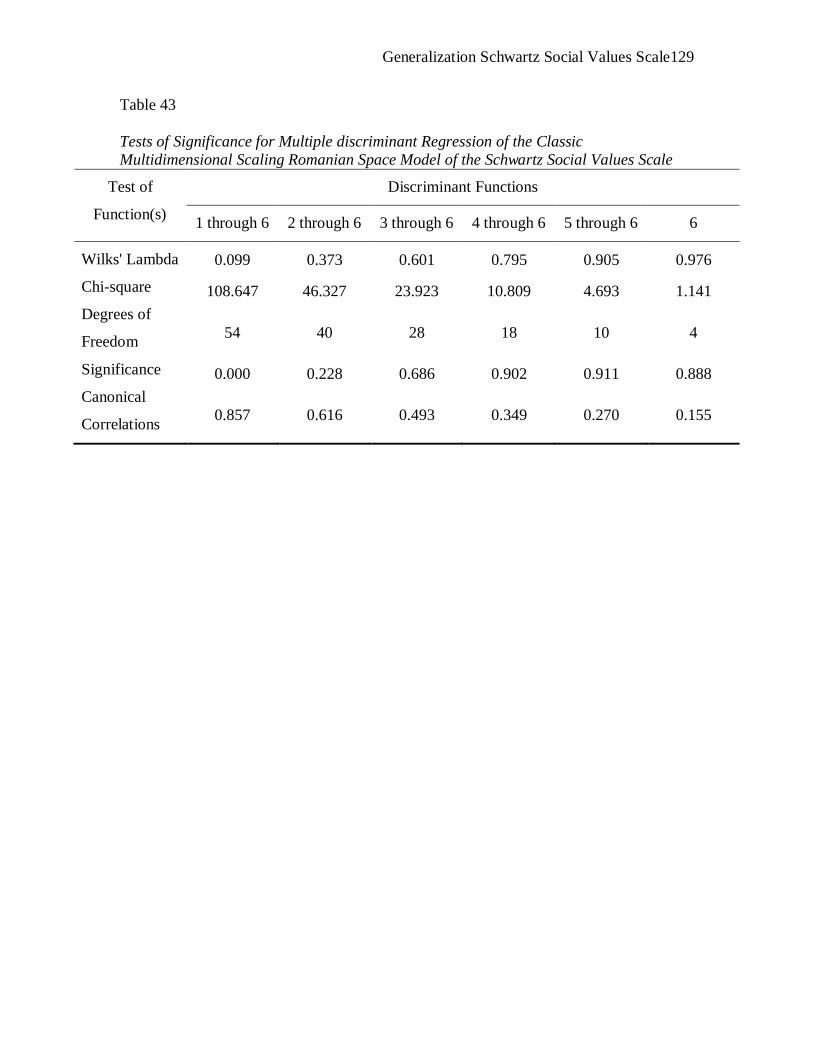
Generalization Schwartz Social Values Scale 129
Table 43 Tests of Significance for Multiple discriminant Regression of the Classic Multidimensional Scaling Romanian Space Model of the Schwartz Social Values Scale
Test of
Function(s)
Discriminant Functions
1 through 6 2 through 6 3 through 6 4 through 6 5 through 6 6
Wilks' Lambda 0.099 0.373 0.601 0.795 0.905 0.976
Chi-square 108.647 46.327 23.923 10.809 4.693 1.141 Degrees of
Freedom 54 40 28 18 10 4
Significance 0.000 0.228 0.686 0.902 0.911 0.888 Canonical
Correlations 0.857 0.616 0.493 0.349 0.270 0.155

Generalization Schwartz Social Values Scale 130
Table 44 Multiple Discriminant Regression Analyses Overall Significance of and Percentage Agreement Beyond Chance for the Schwartz Social Values Scale’s Ten Primary Motivation Types
Country Statistic
Press’s Q -
Significance of Discriminant
Modela
(N = 56)
Cohen’s Kappa ( ) -
Percent Agreement
Beyond Chance
(N = 56)
Common Space 323.8** 79.8%
United States 248.6** 70.0%
Poland 195.6** 61.6%
Romania 128.0** 49.9%
**p < 0.001 a Note that Press’ Q is based on Chi- Squared ( 2). Within the matrix generated by this analysis there were more than five cells with a count of zero. This calls into question the validity of this statistic for this application.
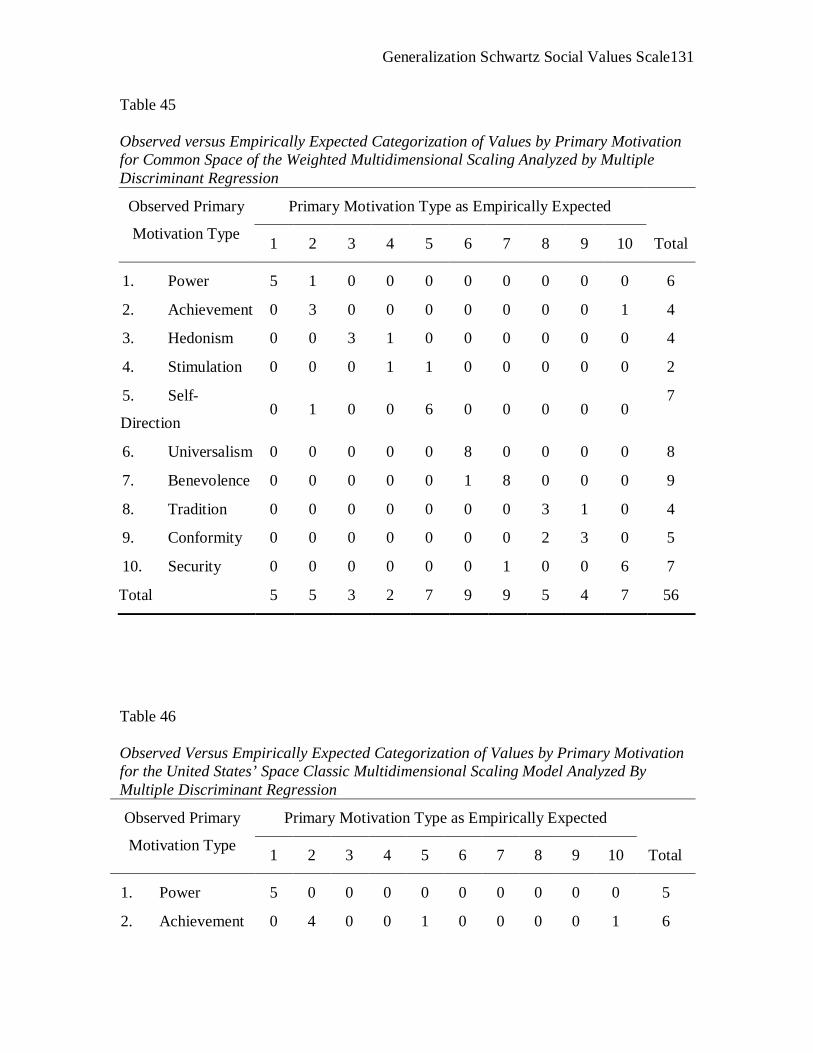
Generalization Schwartz Social Values Scale 131
Table 45 Observed versus Empirically Expected Categorization of Values by Primary Motivation for Common Space of the Weighted Multidimensional Scaling Analyzed by Multiple Discriminant Regression
Observed Primary
Motivation Type
Primary Motivation Type as Empirically Expected
Total 1 2 3 4 5 6 7 8 9 10
1. Power 5 1 0 0 0 0 0 0 0 0 6
2. Achievement 0 3 0 0 0 0 0 0 0 1 4
3. Hedonism 0 0 3 1 0 0 0 0 0 0 4
4. Stimulation 0 0 0 1 1 0 0 0 0 0 2
5. Self-
Direction 0 1 0 0 6 0 0 0 0 0
7
6. Universalism 0 0 0 0 0 8 0 0 0 0 8
7. Benevolence 0 0 0 0 0 1 8 0 0 0 9
8. Tradition 0 0 0 0 0 0 0 3 1 0 4
9. Conformity 0 0 0 0 0 0 0 2 3 0 5
10. Security 0 0 0 0 0 0 1 0 0 6 7
Total 5 5 3 2 7 9 9 5 4 7 56
Table 46 Observed Versus Empirically Expected Categorization of Values by Primary Motivation for the United States’ Space Classic Multidimensional Scaling Model Analyzed By Multiple Discriminant Regression
Observed Primary
Motivation Type
Primary Motivation Type as Empirically Expected
Total 1 2 3 4 5 6 7 8 9 10
1. Power 5 0 0 0 0 0 0 0 0 0 5
2. Achievement 0 4 0 0 1 0 0 0 0 1 6

Generalization Schwartz Social Values Scale 132
3. Hedonism 0 0 2 1 1 0 0 0 0 0 4
4. Stimulation 0 0 1 1 0 0 0 1 0 0 3
5. Self-Direction 0 0 0 0 4 1 0 0 0 0 5
6. Universalism 0 0 0 0 1 8 0 0 0 0 9
7. Benevolence 0 0 0 0 0 0 5 0 0 0 5
8. Tradition 0 0 0 0 0 0 1 3 1 0 5
9. Conformity 0 0 0 0 0 0 3 0 3 0 6
10. Security 0 1 0 0 0 0 0 1 0 6 8
Total 5 5 3 2 7 9 9 5 4 7 56
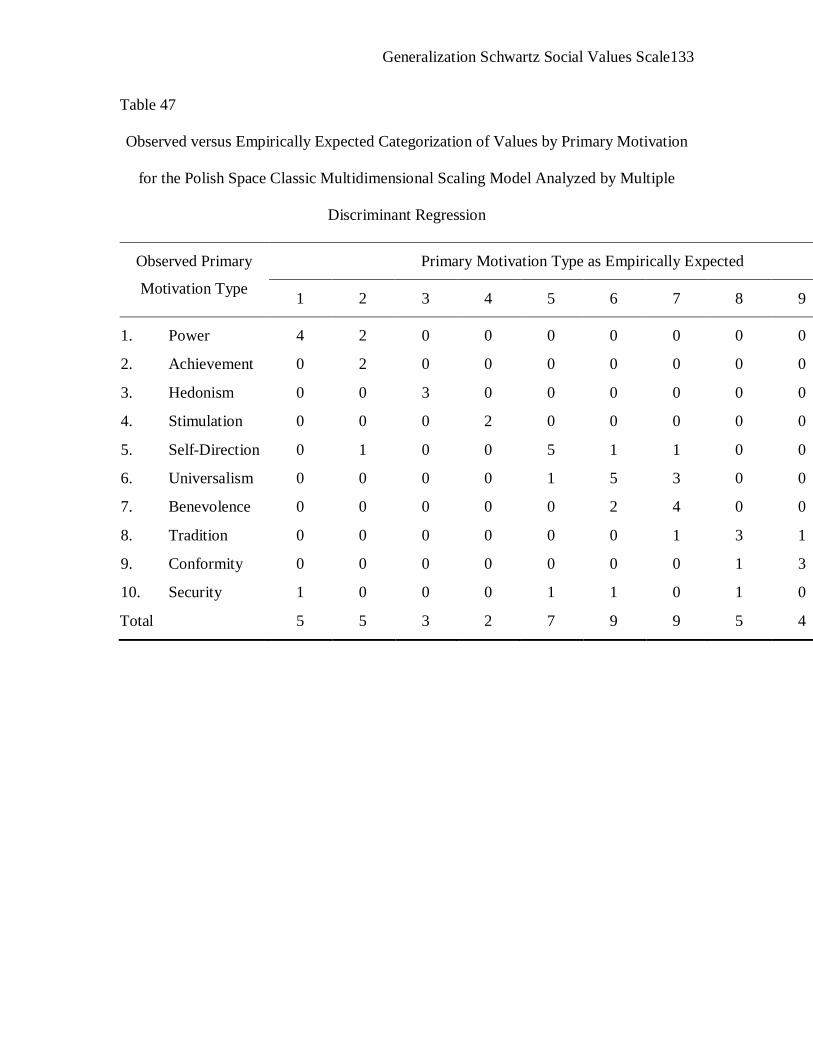
Generalization Schwartz Social Values Scale 133
Table 47 Observed versus Empirically Expected Categorization of Values by Primary Motivation
for the Polish Space Classic Multidimensional Scaling Model Analyzed by Multiple
Discriminant Regression
Observed Primary
Motivation Type
Primary Motivation Type as Empirically Expected
1 2 3 4 5 6 7 8 9
1. Power 4 2 0 0 0 0 0 0 0
2. Achievement 0 2 0 0 0 0 0 0 0
3. Hedonism 0 0 3 0 0 0 0 0 0
4. Stimulation 0 0 0 2 0 0 0 0 0
5. Self-Direction 0 1 0 0 5 1 1 0 0
6. Universalism 0 0 0 0 1 5 3 0 0
7. Benevolence 0 0 0 0 0 2 4 0 0
8. Tradition 0 0 0 0 0 0 1 3 1
9. Conformity 0 0 0 0 0 0 0 1 3
10. Security 1 0 0 0 1 1 0 1 0
Total 5 5 3 2 7 9 9 5 4

Generalization Schwartz Social Values Scale 134
Table 48 Observed Versus Empirically Expected Categorization of Values by Primary Motivation for the Romanian Space Classic Multidimensional Scaling Model Analyzed my Multiple Discriminant Regression
Observed Primary
Motivation Type
Primary Motivation Type as Empirically Expected
Total 1 2 3 4 5 6 7 8 9 10
1. Power 3 1 0 0 0 0 0 0 0 0 4
2. Achievement 1 3 1 0 1 0 0 0 0 0 6
3. Hedonism 1 0 2 1 0 0 1 0 0 0 5
4. Stimulation 0 0 0 1 0 1 0 0 0 0 2
5. Self-
Direction
0 1 0 0 4 0 0 0 1 3 9
6. Universalism 0 0 0 0 0 5 1 0 0 0 6
7. Benevolence 0 0 0 0 1 1 4 0 0 0 6
8. Tradition 0 0 0 0 0 1 0 4 1 0 6
9. Conformity 0 0 0 0 0 0 2 1 1 0 4
10. Security 0 0 0 0 1 1 1 0 1 4 8
Total 5 5 3 2 7 9 9 5 4 7 56

Generalization Schwartz Social Values Scale 135
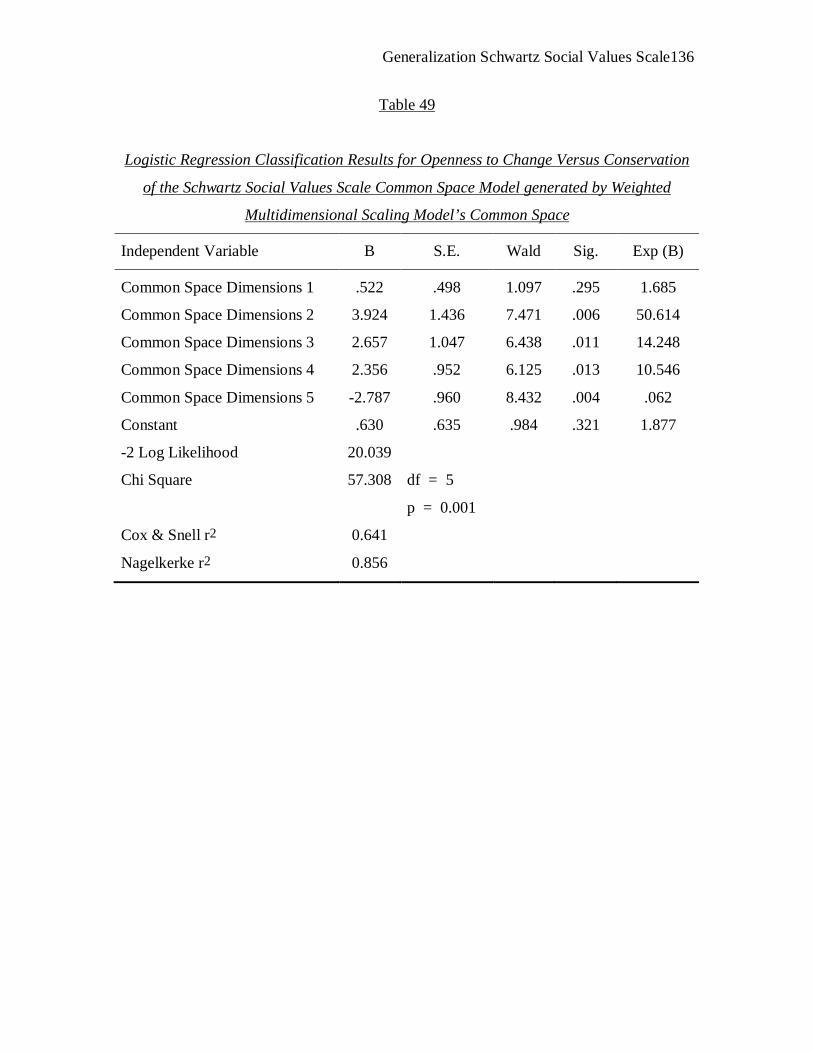
Generalization Schwartz Social Values Scale 136
Table 49
Logistic Regression Classification Results for Openness to Change Versus Conservation
of the Schwartz Social Values Scale Common Space Model generated by Weighted
Multidimensional Scaling Model’s Common Space
Independent Variable B S.E. Wald Sig. Exp (B)
Common Space Dimensions 1 .522 .498 1.097 .295 1.685
Common Space Dimensions 2 3.924 1.436 7.471 .006 50.614
Common Space Dimensions 3 2.657 1.047 6.438 .011 14.248
Common Space Dimensions 4 2.356 .952 6.125 .013 10.546
Common Space Dimensions 5 -2.787 .960 8.432 .004 .062
Constant .630 .635 .984 .321 1.877
-2 Log Likelihood 20.039
Chi Square 57.308 df = 5
p = 0.001
Cox & Snell r2 0.641
Nagelkerke r2 0.856

Generalization Schwartz Social Values Scale 137
Table 50
Logistic Regression Classification Results for Openness to Change Versus
Conservation of the Schwartz Social Values Scale’s Individual Space as Generated by
Classic Multidimensional Scaling Model for the United States
Independent Variables B S.E. Wald Sig. Exp (B)
United States Space Dimension 1 2.132 .696 9.374 .002 8.435
United States Space Dimension 2 -.869 .556 2.447 .118 .419
United States Space Dimension 3 -3.620 1.152 9.880 .002 .027
United States Space Dimension 4 .316 .523 .365 .546 1.372
United States Space Dimension 5 -1.447 .685 4.457 .035 .235
United States Space Dimension 6 -1.255 .772 2.646 .104 .285
Constant .660 .575 1.317 .251 1.934
-2 Log Likelihood 23.181
Chi Square 54.165 df = 6
p = 0.001
Cox & Snell r2 0.620
Nagelkerke r2 0.828
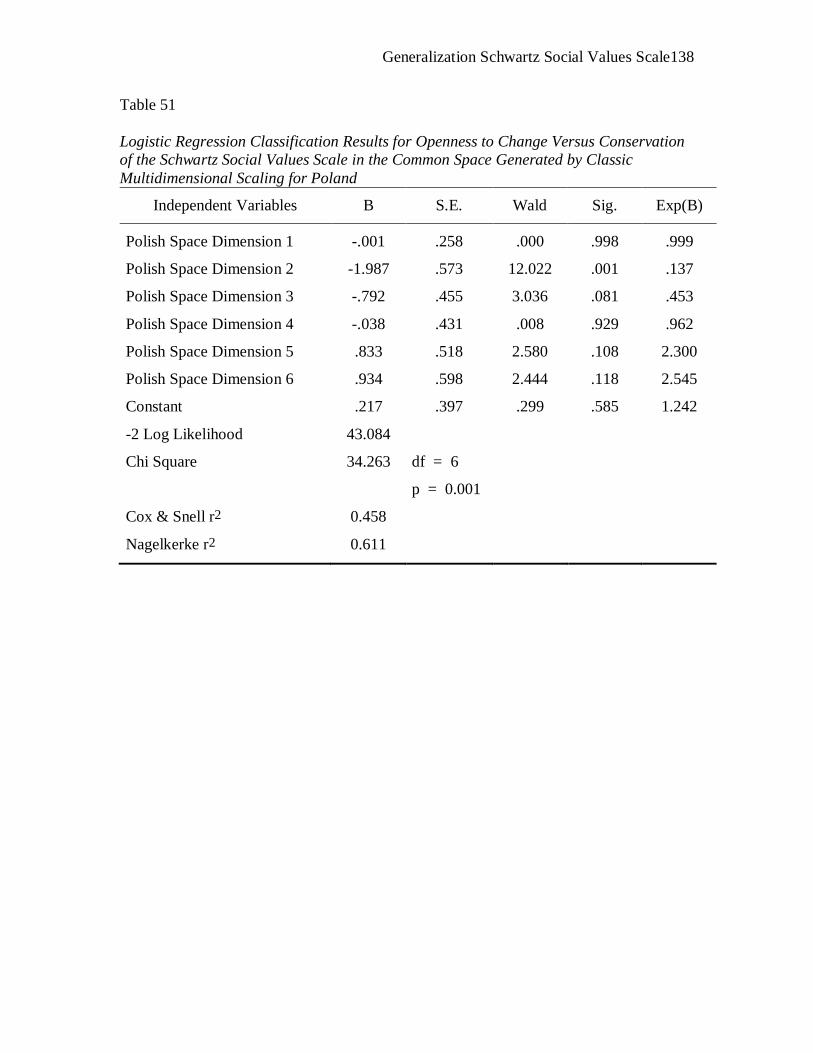
Generalization Schwartz Social Values Scale 138
Table 51 Logistic Regression Classification Results for Openness to Change Versus Conservation of the Schwartz Social Values Scale in the Common Space Generated by Classic Multidimensional Scaling for Poland
Independent Variables B S.E. Wald Sig. Exp(B)
Polish Space Dimension 1 -.001 .258 .000 .998 .999
Polish Space Dimension 2 -1.987 .573 12.022 .001 .137
Polish Space Dimension 3 -.792 .455 3.036 .081 .453
Polish Space Dimension 4 -.038 .431 .008 .929 .962
Polish Space Dimension 5 .833 .518 2.580 .108 2.300
Polish Space Dimension 6 .934 .598 2.444 .118 2.545
Constant .217 .397 .299 .585 1.242
-2 Log Likelihood 43.084
Chi Square 34.263 df = 6
p = 0.001
Cox & Snell r2 0.458
Nagelkerke r2 0.611

Generalization Schwartz Social Values Scale 139
Table 52 Logistic Regression Classification Results for Openness to Change Versus Conservation of the Schwartz Social Values Scale for the Common Space Generated by Classic Multidimensional Scaling for Romania
Independent Variables B S.E. Wald Sig. Exp(B)
Romanian Space Dimension 1 -.150 .221 .464 .496 .860
Romanian Space Dimension 2 .665 .304 4.807 .028 1.945
Romanian Space Dimension 3 .534 .309 2.989 .084 1.705
Romanian Space Dimension 4 -.191 .352 .296 .586 .826
Romanian Space Dimension 5 -.592 .387 2.336 .126 .553
Romanian Space Dimension 6 -.013 .368 .001 .972 .987
Constant .210 .300 .490 .484 1.234
-2 Log Likelihood 66.248
Chi Square 11.098 df = 6
p = 0.085
Cox & Snell r2 0.180
Nagelkerke r2 0.240

Generalization Schwartz Social Values Scale 140
Table 53 Logistic Regression Classification Results for Self-Enhancement Versus Self-Transcendence of the Schwartz Social Values Scale for the Common Space Generated by Weighted Multidimensional Scaling
Independent Variables B S.E. Wald Sig. Exp(B)
Common Space Dimensions 1 -7.714 3.249 5.636 .018 .000
Common Space Dimensions 2 2.569 1.195 4.617 .032 13.048
Common Space Dimensions 3 -4.864 2.113 5.301 .021 .008
Common Space Dimensions 4 .309 .732 .178 .673 1.362
Common Space Dimensions 5 -1.924 .991 3.769 .052 .146
Constant 1.586 .934 2.881 .090 4.883
-2 Log Likelihood 17.386
Chi Square 57.655 df = 5
p < 0.001
Cox & Snell r2 0.643
Nagelkerke r2 0.871

Generalization Schwartz Social Values Scale 141
Table 54 Logistic Regression Classification Results for Self-Enhancement Versus Self-Transcendence of the Schwartz Social Values Scale as Generated by Classic Multidimensional Scaling for the United States
Independent Variables B S.E. Wald Sig. Exp(B)
United States Space Dimension 1 2.332 .835 7.798 .005 10.294
United States Space Dimension 2 4.373 1.473 8.808 .003 79.282
United States Space Dimension 3 .300 .738 .165 .684 1.350
United States Space Dimension 4 1.686 .850 3.936 .047 5.397
United States Space Dimension 5 1.904 .998 3.644 .056 6.716
United States Space Dimension 6 .113 .791 .020 .887 1.119
Constant 2.001 .923 4.701 .030 7.398
-2 Log Likelihood 20.514
Chi Square 54.526 df = 6
p < 0.001
Cox & Snell r2 0.622
Nagelkerke r2 0.843

Generalization Schwartz Social Values Scale 142
Table 55 Logistic Regression Classification Results for openness Self-Enhancement Versus Self-Transcendence of the Schwartz Social Values Scale (SVS) in common space as generated by Classic Multidimensional Scaling (CMDS) model’s Polish space
Independent Variables B S.E. Wald Sig. Exp(B)
Polish Space Dimension 1 4.003 1.384 8.369 .004 54.781
Polish Space Dimension 2 -1.115 .533 4.370 .037 .328
Polish Space Dimension 3 1.415 .756 3.504 .061 4.116
Polish Space Dimension 4 2.217 1.054 4.421 .035 9.181
Polish Space Dimension 5 .544 .744 .535 .465 1.723
Polish Space Dimension 6 -.581 .669 .755 .385 .559
Constant 1.365 .801 2.900 .089 3.914
-2 Log Likelihood 25.653
Chi Square 49.388 df = 6
p < 0.001
Cox & Snell r2 0.586
Nagelkerke r2 0.794
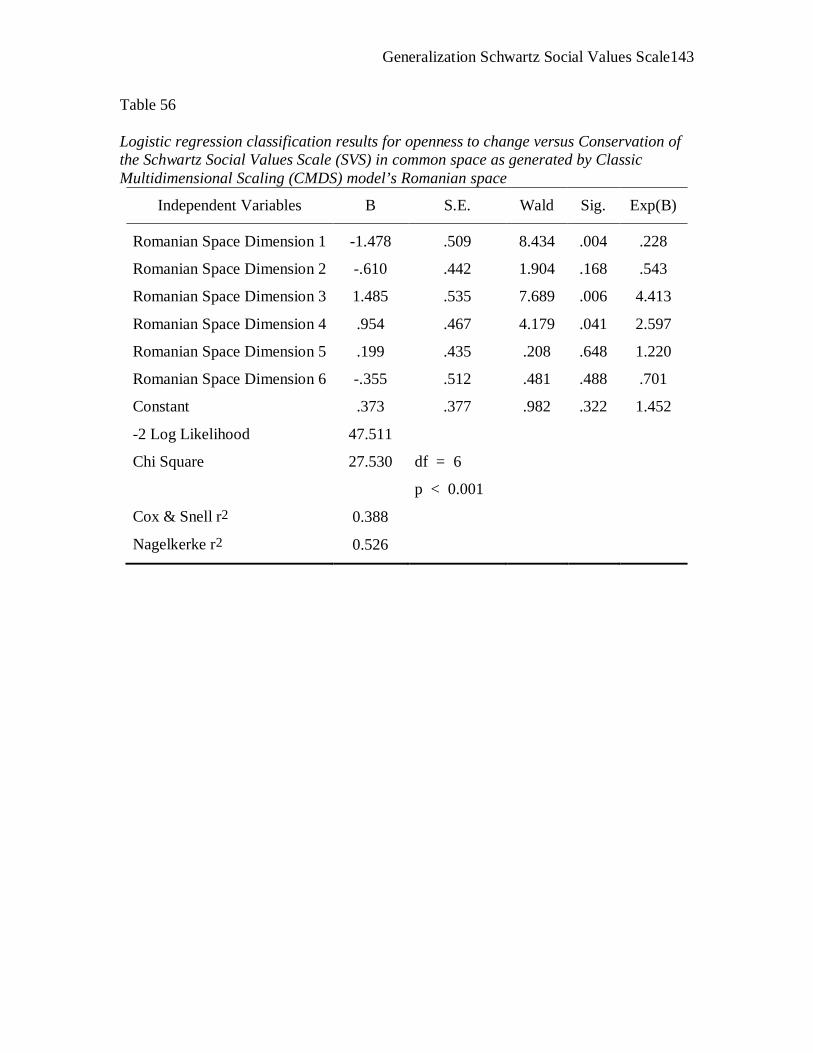
Generalization Schwartz Social Values Scale 143
Table 56 Logistic regression classification results for openness to change versus Conservation of the Schwartz Social Values Scale (SVS) in common space as generated by Classic Multidimensional Scaling (CMDS) model’s Romanian space
Independent Variables B S.E. Wald Sig. Exp(B)
Romanian Space Dimension 1 -1.478 .509 8.434 .004 .228
Romanian Space Dimension 2 -.610 .442 1.904 .168 .543
Romanian Space Dimension 3 1.485 .535 7.689 .006 4.413
Romanian Space Dimension 4 .954 .467 4.179 .041 2.597
Romanian Space Dimension 5 .199 .435 .208 .648 1.220
Romanian Space Dimension 6 -.355 .512 .481 .488 .701
Constant .373 .377 .982 .322 1.452
-2 Log Likelihood 47.511
Chi Square 27.530 df = 6
p < 0.001
Cox & Snell r2 0.388
Nagelkerke r2 0.526
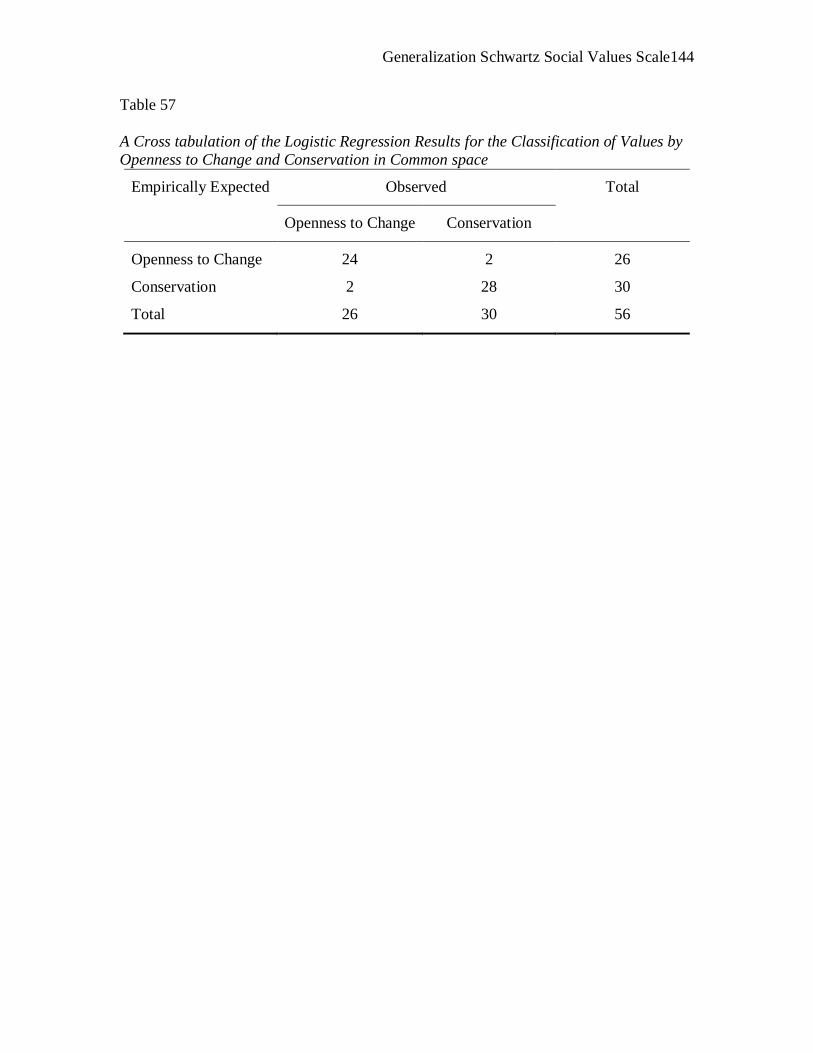
Generalization Schwartz Social Values Scale 144
Table 57 A Cross tabulation of the Logistic Regression Results for the Classification of Values by Openness to Change and Conservation in Common space
Empirically Expected Observed Total
Openness to Change Conservation
Openness to Change 24 2 26
Conservation 2 28 30
Total 26 30 56

Generalization Schwartz Social Values Scale 145
Table 58 A Cross tabulation of the Logistic Regression Results for the Classification of Values by Openness to Change and Conservation in United States space
Empirically Expected Observed Total
Openness to Change Conservation
Openness to Change 23 3 26
Conservation 2 28 30
Total 25 31 56

Generalization Schwartz Social Values Scale 146
Table 59 A Cross Tabulation of the Logistic Regression Results for the Classification of Values by Openness to Change and Conservation in Polish space
Empirically Expected Observed Total
Openness to Change Conservation
Openness to Change 19 7 26
Conservation 4 26 30
Total 23 33 56

Generalization Schwartz Social Values Scale 147
Table 60 A Cross Tabulation of the Logistic Regression Results for the Classification of Values by Openness to Change and Conservation in Romanian Space
Empirically Expected Observed Total
Openness to Change Conservation
Openness to Change 17 9 26
Conservation 8 22 30
Total 25 31 56

Generalization Schwartz Social Values Scale 148
Table 61 A Cross Tabulation of the Logistic Regression Results for the Classification of Values by Self-Enhancement and Self-Transcendence in Common space
Empirically
Expected
Observed Total
Self-Enhancement Self-Transcendence
Self-Enhancement 19 3 22
Self-Transcendence 2 32 34 Total 21 35 56
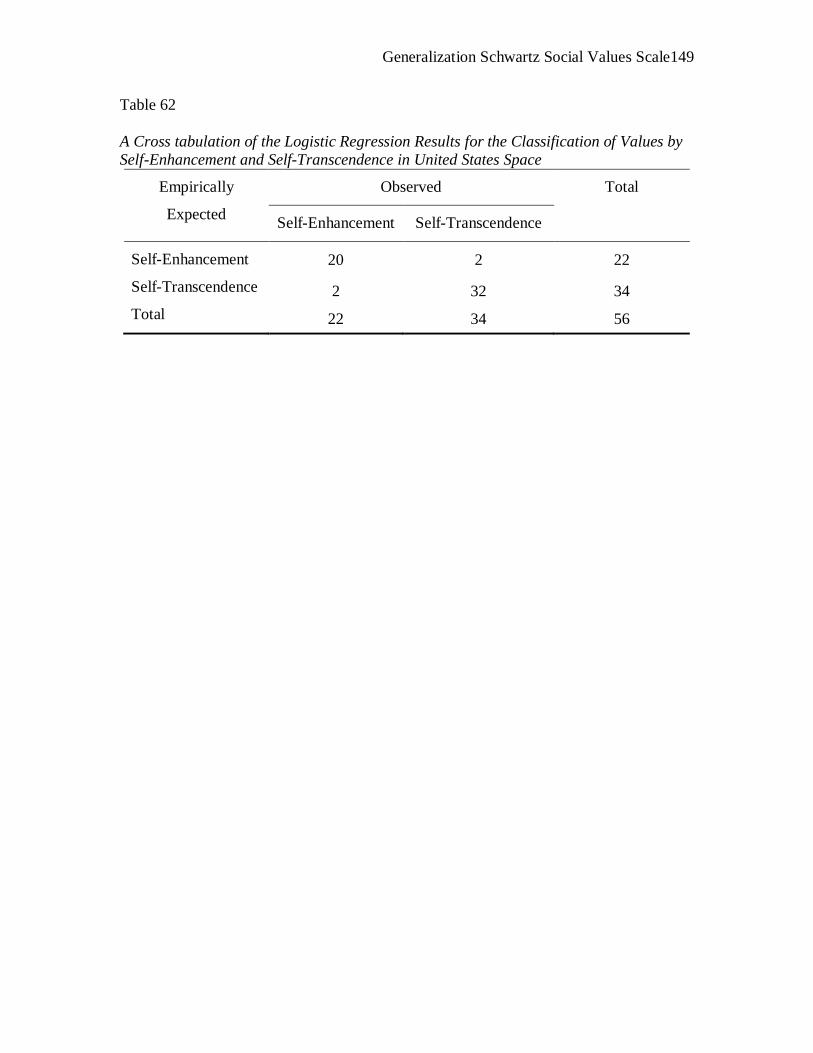
Generalization Schwartz Social Values Scale 149
Table 62 A Cross tabulation of the Logistic Regression Results for the Classification of Values by Self-Enhancement and Self-Transcendence in United States Space
Empirically
Expected
Observed Total
Self-Enhancement Self-Transcendence
Self-Enhancement 20 2 22
Self-Transcendence 2 32 34 Total 22 34 56

Generalization Schwartz Social Values Scale 150
Table 63 Cross Tabulation of the Logistic Regression Results for the Classification of Values by Self-Enhancement and Self-Transcendence in Polish Space
Empirically
Expected
Observed Total
Self-Enhancement Self-Transcendence
Self-Enhancement 18 4 22
Self-Transcendence 3 31 34
Total 21 35 56

Generalization Schwartz Social Values Scale 151
Table 64 A Cross Tabulation of the Logistic Regression Results for the Classification of Values by Self-Enhancement and Self-Transcendence in Romanian Space
Empirically
Expected
Observed Total
Self-Enhancement Self-Transcendence
Self-Enhancement 13 9 22
Self-Transcendence 5 29 34
Total 18 38 56
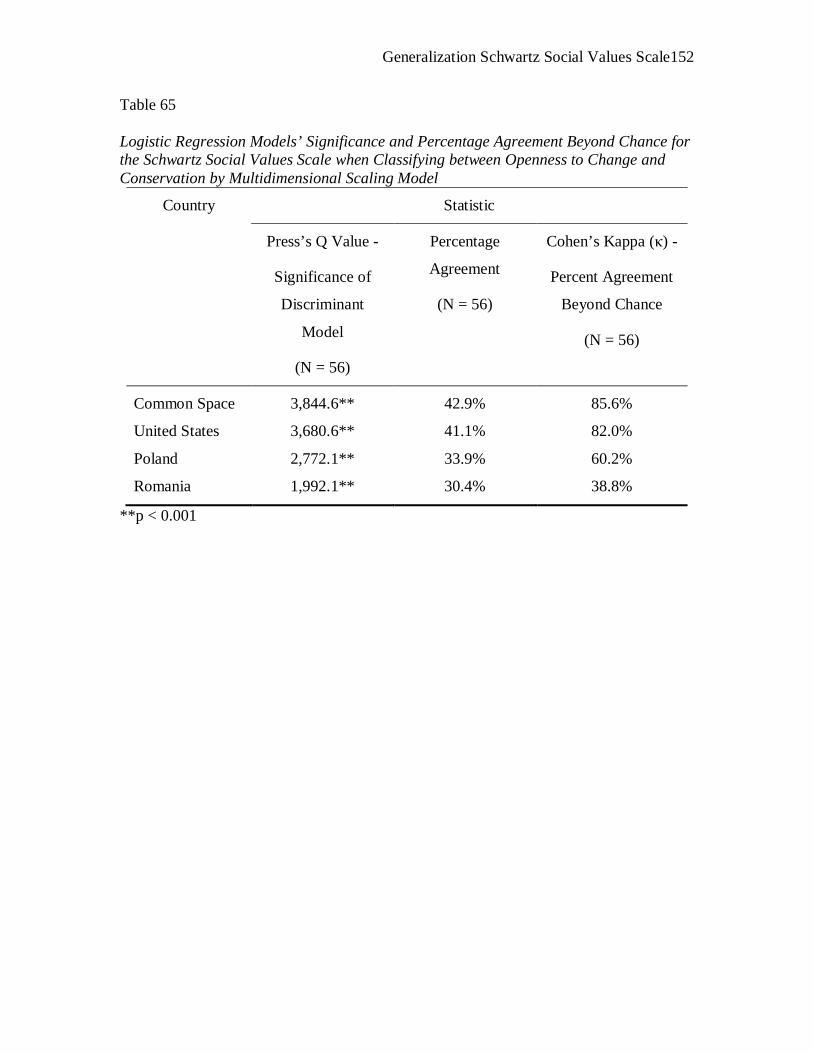
Generalization Schwartz Social Values Scale 152
Table 65 Logistic Regression Models’ Significance and Percentage Agreement Beyond Chance for the Schwartz Social Values Scale when Classifying between Openness to Change and Conservation by Multidimensional Scaling Model
Country Statistic
Press’s Q Value -
Significance of
Discriminant
Model
(N = 56)
Percentage
Agreement
(N = 56)
Cohen’s Kappa ( ) -
Percent Agreement
Beyond Chance
(N = 56)
Common Space 3,844.6** 42.9% 85.6%
United States 3,680.6** 41.1% 82.0%
Poland 2,772.1** 33.9% 60.2%
Romania 1,992.1** 30.4% 38.8%
**p < 0.001

Generalization Schwartz Social Values Scale 153
Table 66 Logistic Regression Models’ Significance and Percentage Agreement Beyond Chance for the Schwartz Social Values Scale When Classifying Between Self-Enhancement and Self-Transcendence by Multidimensional Scaling Model
Country Statistic
Press’s Q Value -
Significance of
Discriminant
Model
(N = 56)
Percentage
Agreement
(N = 56)
Cohen’s Kappa ( ) -
Percent Agreement
Beyond Chance
(N = 56)
Common Space 3,680.6** 33.9% 81.1%
United States 3,844.6** 35.7% 85.0%
Poland 3,363.5** 32.1% 73.6%
Romania 2,366.0** 23.2% 45.9%
**p < 0.001
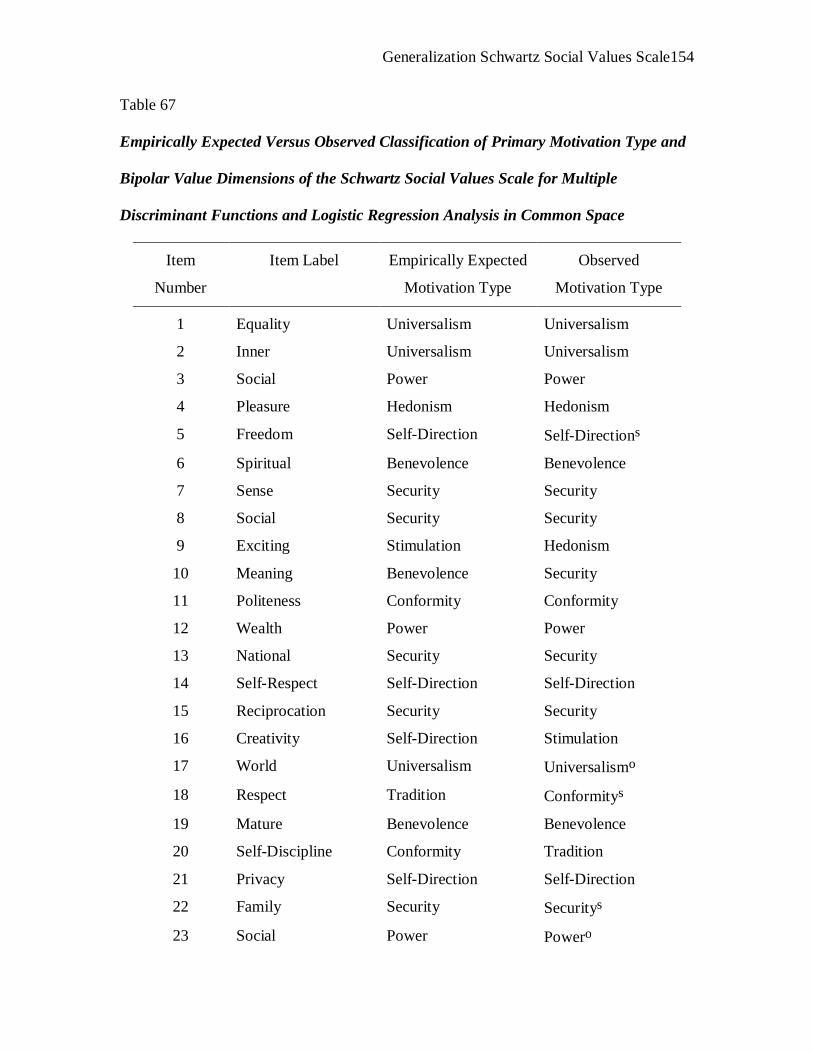
Generalization Schwartz Social Values Scale 154
Table 67 Empirically Expected Versus Observed Classification of Primary Motivation Type and
Bipolar Value Dimensions of the Schwartz Social Values Scale for Multiple
Discriminant Functions and Logistic Regression Analysis in Common Space
Item
Number
Item Label Empirically Expected
Motivation Type
Observed
Motivation Type
1 Equality Universalism Universalism
2 Inner Universalism Universalism
3 Social Power Power
4 Pleasure Hedonism Hedonism
5 Freedom Self-Direction Self-Directions
6 Spiritual Benevolence Benevolence
7 Sense Security Security
8 Social Security Security
9 Exciting Stimulation Hedonism
10 Meaning Benevolence Security
11 Politeness Conformity Conformity
12 Wealth Power Power
13 National Security Security
14 Self-Respect Self-Direction Self-Direction
15 Reciprocation Security Security
16 Creativity Self-Direction Stimulation
17 World Universalism Universalismo
18 Respect Tradition Conformitys
19 Mature Benevolence Benevolence
20 Self-Discipline Conformity Tradition
21 Privacy Self-Direction Self-Direction
22 Family Security Securitys
23 Social Power Powero

Generalization Schwartz Social Values Scale 155
24 Unity With Nature Universalism Universalism

Generalization Schwartz Social Values Scale 156
Table 67 (Continued) Empirically Expected Versus Observed Classification of Primary Motivation Type and
Bipolar Value Dimensions of the Schwartz Social Values Scale for Multiple
Discriminant Functions and Logistic Regression Analysis in Common Space
Item Number Item Label Empirically Expected
Motivation Type
Observed Motivation
Type
25 Varied Life Hedonism Hedonism
26 Wisdom Universalism Benevolence
27 Authority Power Power
28 True Love Benevolence Benevolence
29 World Universalism Universalism
30 Social Universalism Universalism
31 Independent Self-Direction Self-Direction
32 Moderate Tradition Tradition
33 Loyal Benevolence Benevolenceo
34 Ambitious Achievement Achievement
35 Broad-minded Universalism Universalism
36 Humble Tradition Tradition
37 Daring Stimulation Stimulation
38 Protecting Universalism Universalism
39 Influential Achievement Powero
40 Honoring Conformity Conformity
41 Choosing Self-Direction Self-Direction
42 Healthy Security Securitys
43 Capable Achievement Self-Directions
44 Accepting Tradition Tradition
45 Honest Benevolence Benevolence
46 Preserving Power Power
47 Obedient Conformity Conformity

Generalization Schwartz Social Values Scale 157
48 Intelligent Achievement Achievement
49 Helpful Benevolence Benevolence

Generalization Schwartz Social Values Scale 158
Table 67 (Continued) Empirically Expected Versus Observed Classification of Primary Motivation Type and
Bipolar Value Dimensions of the Schwartz Social Values Scale for Multiple
Discriminant Functions and Logistic Regression Analysis in Common Space
Item Number Item Label Empirically Expected
Motivation Type
Observed Motivation
Type
50 Enjoying Hedonism Hedonism
51 Devout Tradition Conformity
52 Responsible Benevolence Benevolence
53 Curious Self-Direction Self-Direction
54 Forgiving Benevolence Benevolence
55 Successful Achievement Achievement
56 Clean Security Achievement
s Indicates that the item was inappropriately classified with regard to self-enhancement versus self-transcendence classification when Schwartz’s prediction was checked via logistic regression. o Indicates that the item was inappropriately classified with regard to openness to change versus Conservation classification when Schwartz’s prediction was checked via logistic regression.

Generalization Schwartz Social Values Scale 159
Table 68 Empirically Expected Versus Observed Classification of Primary Motivation Type and
Bipolar Value Dimensions of the Schwartz Social Values Scale for Multiple
Discriminant Functions and Logistic Regression Analysis in the United States’ Space
Item
Number
Item Label Empirically Expected
Motivation Type
Observed Motivation
Type
1 Equality Universalism Universalism
2 Inner Harmony Universalism Self-Direction
3 Social Power Power Power
4 Pleasure Hedonism Hedonism
5 Freedom Self-Direction Hedonismo
6 Spiritual Life Benevolence Benevolence
7 Sense of Belonging Security Security
8 Social Order Security Security
9 Exciting Life Stimulation Hedonism
10 Meaning in Life Benevolence Tradition
11 Politeness Conformity Conformity
12 Wealth Power Powero
13 National Security Security Security
14 Self-Respect Self-Direction Self-Direction
15 Reciprocation of Favors Security Security
16 Creativity Self-Direction Self-Direction
17 World at Peace Universalism Universalism
18 Respect for Tradition Tradition Security
19 Mature Love Benevolence Benevolence
20 Self-Discipline Conformity Tradition
21 Privacy Self-Direction Self-Direction
22 Family Security Security Securitys
23 Social Recognition Power Power

Generalization Schwartz Social Values Scale 160
24 Unity with Nature Universalism Universalism
25 Varied Life Hedonism Stimulation

Generalization Schwartz Social Values Scale 161
Table 68 (Continued) Empirically Expected Versus Observed Classification of Primary Motivation Type and
Bipolar Value Dimensions of the Schwartz Social Values Scale for Multiple
Discriminant Functions and Logistic Regression Analysis in the United States’ Space
Item
Number
Item Label Empirically Expected
Motivation Type
Observed Motivation
Type
26 Wisdom Universalism Universalism
27 Authority Power Power
28 True Friendship Benevolence Benevolence
29 World of Beauty Universalism Universalism
30 Social Justice Universalism Universalism
31 Independent Self-Direction Self-Directions
32 Moderate Tradition Stimulation
33 Loyal Benevolence Conformity
34 Ambitious Achievement Achievemento
35 Broad-minded Universalism Universalism
36 Humble Tradition Tradition
37 Daring Stimulation Stimulations
38 Protecting the Environment Universalism Universalism
39 Influential Achievement Securityo
40 Honoring of Parent Conformity Conformity
41 Choosing own Goals Self-Direction Achievements
42 Healthy Security Securityo
43 Capable Achievement Achievement
44 Accepting my Portion in Life Tradition Tradition
45 Honest Benevolence Conformity
46 Preserving my Public Image Power Power

Generalization Schwartz Social Values Scale 162
Table 68 (Continued) Empirically Expected versus Observed Classification of Primary Motivation Type for United States Discriminant Regression and Classic Multidimensional Scaling (CMDS) Model
Item
Number
Item Label Empirically Expected
Motivation Type
Observed Motivation
Type
47 Obedient Conformity Conformity
48 Intelligent Achievement Achievement
49 Helpful Benevolence Benevolence
50 Enjoying Life Hedonism Hedonism
51 Devout Tradition Tradition
52 Responsible Benevolence Conformity
53 Curious Self-Direction Universalism
54 Forgiving Benevolence Benevolence
55 Successful Achievement Achievement
56 Clean Security Achievement
s Indicates that the item was inappropriately classified with regard to self-enhancement versus self-transcendence classification when Schwartz’s prediction was checked via logistic regression. o Indicates that the item was inappropriately classified with regard to openness to change versus Conservation classification when Schwartz’s prediction was checked via logistic regression.

Generalization Schwartz Social Values Scale 163
Table 69 Empirically Expected Versus Observed Classification of Primary Motivation Type and
Bipolar Value Dimensions of the Schwartz Social Values Scale for Multiple
Discriminant Functions and Logistic Regression Analysis in Polish Space
Item
Number
Item Label Empirically Expected
Motivation Type
Observed Motivation
Type
1 Equality Universalism Benevolence
2 Inner Harmony Universalism Benevolenceo
3 Social Power Power Power
4 Pleasure Hedonism Hedonism
5 Freedom Self-Direction Self-Direction
6 Spiritual Life Benevolence Benevolence
7 Sense of Belonging Security Security
8 Social Order Security Securitys
9 Exciting Life Stimulation Stimulation
10 Meaning in Life Benevolence Benevolence
11 Politeness Conformity Conformity
12 Wealth Power Power
13 National Security Security Security
14 Self-Respect Self-Direction Self-Directionso
15 Reciprocation of Favors Security Security
16 Creativity Self-Direction Self-Directions
17 World at Peace Universalism Securityo
18 Respect for Tradition Tradition Security
19 Mature Love Benevolence Universalismo
20 Self-Discipline Conformity Conformity
21 Privacy Self-Direction Securityso
22 Family Security Security Self-Directions
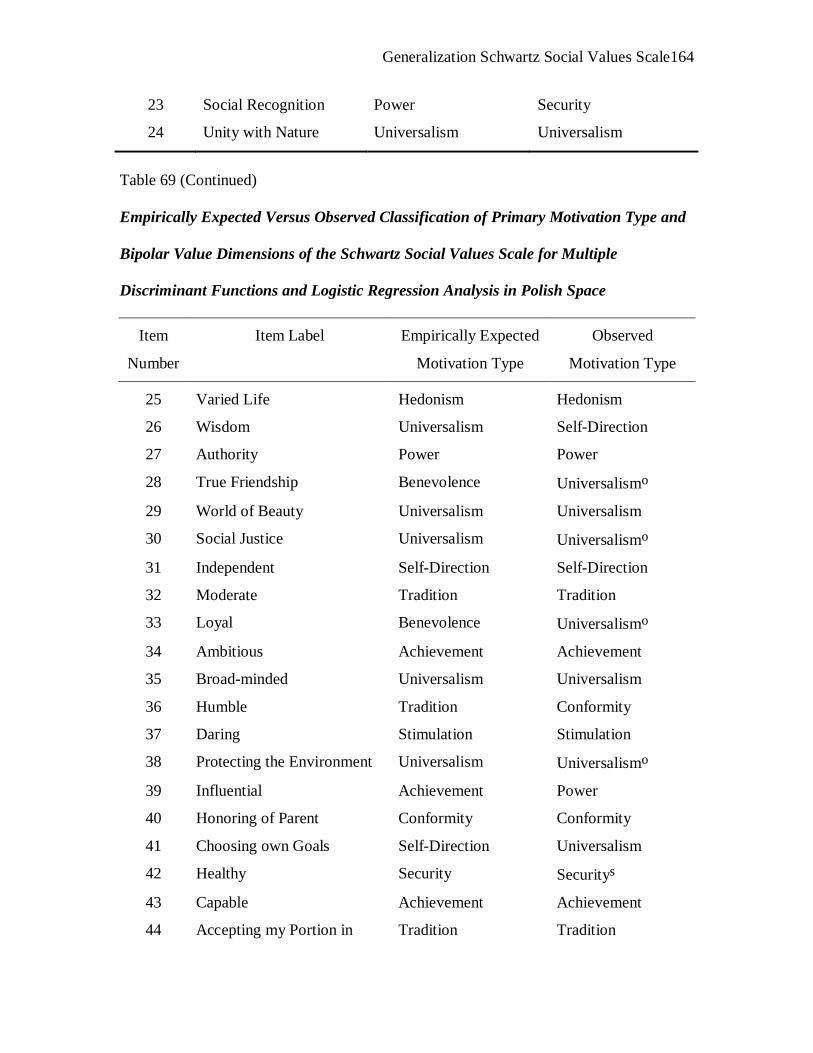
Generalization Schwartz Social Values Scale 164
23 Social Recognition Power Security
24 Unity with Nature Universalism Universalism
Table 69 (Continued) Empirically Expected Versus Observed Classification of Primary Motivation Type and
Bipolar Value Dimensions of the Schwartz Social Values Scale for Multiple
Discriminant Functions and Logistic Regression Analysis in Polish Space
Item
Number
Item Label Empirically Expected
Motivation Type
Observed
Motivation Type
25 Varied Life Hedonism Hedonism
26 Wisdom Universalism Self-Direction
27 Authority Power Power
28 True Friendship Benevolence Universalismo
29 World of Beauty Universalism Universalism
30 Social Justice Universalism Universalismo
31 Independent Self-Direction Self-Direction
32 Moderate Tradition Tradition
33 Loyal Benevolence Universalismo
34 Ambitious Achievement Achievement
35 Broad-minded Universalism Universalism
36 Humble Tradition Conformity
37 Daring Stimulation Stimulation
38 Protecting the Environment Universalism Universalismo
39 Influential Achievement Power
40 Honoring of Parent Conformity Conformity
41 Choosing own Goals Self-Direction Universalism
42 Healthy Security Securitys
43 Capable Achievement Achievement
44 Accepting my Portion in Tradition Tradition

Generalization Schwartz Social Values Scale 165
Life
45 Honest Benevolence Benevolence
46 Preserving my Public Image Power Power
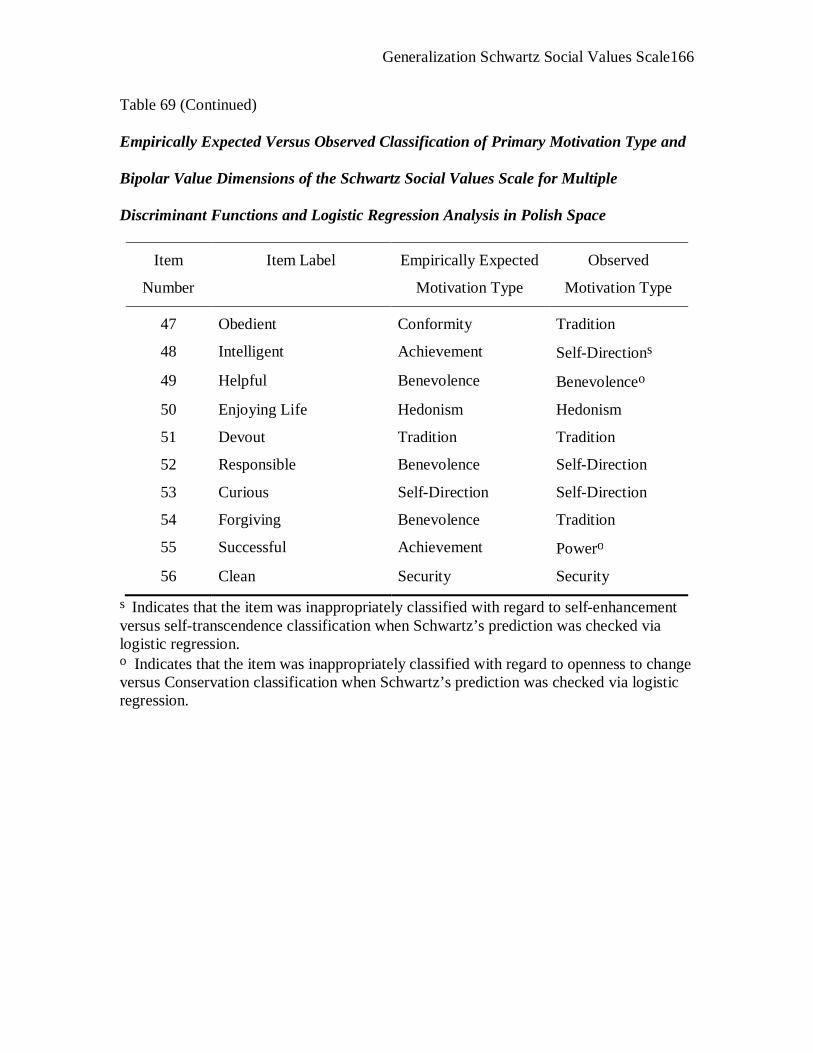
Generalization Schwartz Social Values Scale 166
Table 69 (Continued) Empirically Expected Versus Observed Classification of Primary Motivation Type and
Bipolar Value Dimensions of the Schwartz Social Values Scale for Multiple
Discriminant Functions and Logistic Regression Analysis in Polish Space
Item
Number
Item Label Empirically Expected
Motivation Type
Observed
Motivation Type
47 Obedient Conformity Tradition
48 Intelligent Achievement Self-Directions
49 Helpful Benevolence Benevolenceo
50 Enjoying Life Hedonism Hedonism
51 Devout Tradition Tradition
52 Responsible Benevolence Self-Direction
53 Curious Self-Direction Self-Direction
54 Forgiving Benevolence Tradition
55 Successful Achievement Powero
56 Clean Security Security
s Indicates that the item was inappropriately classified with regard to self-enhancement versus self-transcendence classification when Schwartz’s prediction was checked via logistic regression. o Indicates that the item was inappropriately classified with regard to openness to change versus Conservation classification when Schwartz’s prediction was checked via logistic regression.

Generalization Schwartz Social Values Scale 167
Table 70 Empirically Expected Versus Observed Classification of Primary Motivation Type and
Bipolar Value Dimensions of the Schwartz Social Values Scale for Multiple
Discriminant Functions and Logistic Regression Analysis in Romanian Space
Item
Number
Item Label Empirically Expected
Motivation Type
Observed
Motivation Type
1 Equality Universalism Securityo
2 Inner Harmony Universalism Benevolenceo
3 Social Power Power Power
4 Pleasure Hedonism Hedonism
5 Freedom Self-Direction Self-Directions
6 Spiritual Life Benevolence Conformity
7 Sense of Belonging Security Security
8 Social Order Security Security
9 Exciting Life Stimulation Hedonism
10 Meaning in Life Benevolence Securitys
11 Politeness Conformity Security
12 Wealth Power Powero
13 National Security Security Securitys
14 Self-Respect Self-Direction Security
15 Reciprocation of Favors Security Securitys
16 Creativity Self-Direction Self-Direction
17 World at Peace Universalism Traditiono
18 Respect for Tradition Tradition Conformity
19 Mature Love Benevolence Conformity
20 Self-Discipline Conformity Conformity
21 Privacy Self-Direction Self-Direction
22 Family Security Security Self-Directionso

Generalization Schwartz Social Values Scale 168
23 Social Recognition Power Hedonismo
24 Unity with Nature Universalism Universalismo
Table 70 (Continued) Empirically Expected Versus Observed Classification of Primary Motivation Type and
Bipolar Value Dimensions of the Schwartz Social Values Scale for Multiple
Discriminant Functions and Logistic Regression Analysis in Romanian Space
Item
Number
Item Label Empirically Expected
Motivation Type
Observed Motivation
Type
25 Varied Life Hedonism Hedonism
26 Wisdom Universalism Universalism
27 Authority Power Power
28 True Friendship Benevolence Hedonismso
29 World of Beauty Universalism Universalismo
30 Social Justice Universalism Universalism
31 Independent Self-Direction Self-Direction
32 Moderate Tradition Tradition
33 Loyal Benevolence Universalismo
34 Ambitious Achievement Self-Directions
35 Broad-minded Universalism Stimulations
36 Humble Tradition Tradition
37 Daring Stimulation Stimulations
38 Protecting the
Environment
Universalism Universalismo
39 Influential Achievement Powero
40 Honoring of Parent Conformity Self-Direction
41 Choosing own Goals Self-Direction Achievements
42 Healthy Security Self-Directionso

Generalization Schwartz Social Values Scale 169
43 Capable Achievement Achievemento
44 Accepting my Portion in
Life
Tradition Tradition
45 Honest Benevolence Benevolence

Generalization Schwartz Social Values Scale 170
Table 70 (Continued) Empirically Expected Versus Observed Classification of Primary Motivation Type and
Bipolar Value Dimensions of the Schwartz Social Values Scale for Multiple
Discriminant Functions and Logistic Regression Analysis in Romanian Space
Item
Number
Item Label Empirically Expected
Motivation Type
Observed Motivation
Type
46 Preserving my Public
Image
Power Achievement
47 Obedient Conformity Tradition
48 Intelligent Achievement Achievements
49 Helpful Benevolence Benevolence
50 Enjoying Life Hedonism Achievement
51 Devout Tradition Tradition
52 Responsible Benevolence Benevolenceo
53 Curious Self-Direction Benevolenceo
54 Forgiving Benevolence Benevolence
55 Successful Achievement Achievements
56 Clean Security Self-Directionso
s Indicates that the item was inappropriately classified with regard to self-enhancement versus self-transcendence classification when Schwartz’s prediction was checked via logistic regression. o Indicates that the item was inappropriately classified with regard to openness to change versus Conservation classification when Schwartz’s prediction was checked via logistic regression.

Generalization Schwartz Social Values Scale 171
Table 71 Value Statements from Schwartz Social Values Scale that maintain the Same Primary
Motivation Type between the United States, Poland, Romania, and Common Space
Multidimensional Scaling solutions
Item Number Item Label Empirically Expected
Motivation Type
3 Social Power Power
4 Pleasure Hedonism
7 Sense of Belonging Security
8 Social Order Security
12 Wealth Power
13 National Security Security
15 Reciprocation of Favors Security
16 Creativity Self-Direction
24 Unity with Nature Universalism
27 Authority Power
29 World of Beauty Universalism
30 Social Justice Universalism
31 Independent Self-Direction
37 Daring Stimulation
38 Protecting the Environment Universalism
43 Capable Achievement*
44 Accepting my Portion in Life Tradition
49 Helpful Benevolence
51 Devout Tradition
*Item 43 was classified as falling under the primary motivation of Self-Direction under the common space solution of the weighted multidimensional scaling (WMDS) model.

Generalization Schwartz Social Values Scale 172
Table 72 Raw Counts and Percentage Agreement of Value Statements Versus Primary Motivation Type for each Space
Primary
Motivation
Type
Space Schwartz's
Model Common
Space
(WMDS)
United States Poland Romania
Power 5 5 4 3 5
100.0% 100.0% 80.0% 60.0%
Achievement 3 4 2 3 5
60.0% 80.0% 40.0% 60.0%
Hedonism 3 2 3 2 3
100.0% 66.7% 100.0% 66.7%
Stimulation 1 1 2 1 2
50.0% 50.0% 100.0% 50.0%
Self-Direction 6 4 5 4 7
85.7% 57.1% 71.4% 57.1%
Universalism 8 8 5 5 9
88.9% 88.9% 55.6% 55.6%
Benevolence 8 5 4 4 9
88.9% 55.6% 44.4% 44.4%
Tradition 3 3 3 4 5
60.0% 60.0% 60.0% 80.0%
Conformity 3 3 3 1 4
75.0% 75.0% 75.0% 25.0%
Security 6 6 6 4 7
85.7% 85.7% 85.7% 57.1%

Generalization Schwartz Social Values Scale 173
Table 73 Correlations of Lin’s Concordance between the 56 Value Statements of the Schwartz
Social Values Scale Ratios via Kendall’s Tau-b by Country
Country
1 2 3
1. United States -
2. Poland .243* -
3. Romania .173* .381* -
* Correlation is significant at the 0.01 level (2-tailed).

Generalization Schwartz Social Values Scale 174
Table 74 Correlations of Lin’s Concordance between the 56 Value Statements of the Schwartz
Social Values Scale Ratios via Pearson’s r by Country
Country
1. 2. 3.
1. United States -
2. Poland .399** - 3. Romanian .288** .579** -
** Correlation is significant at the 0.01 level (2-tailed).
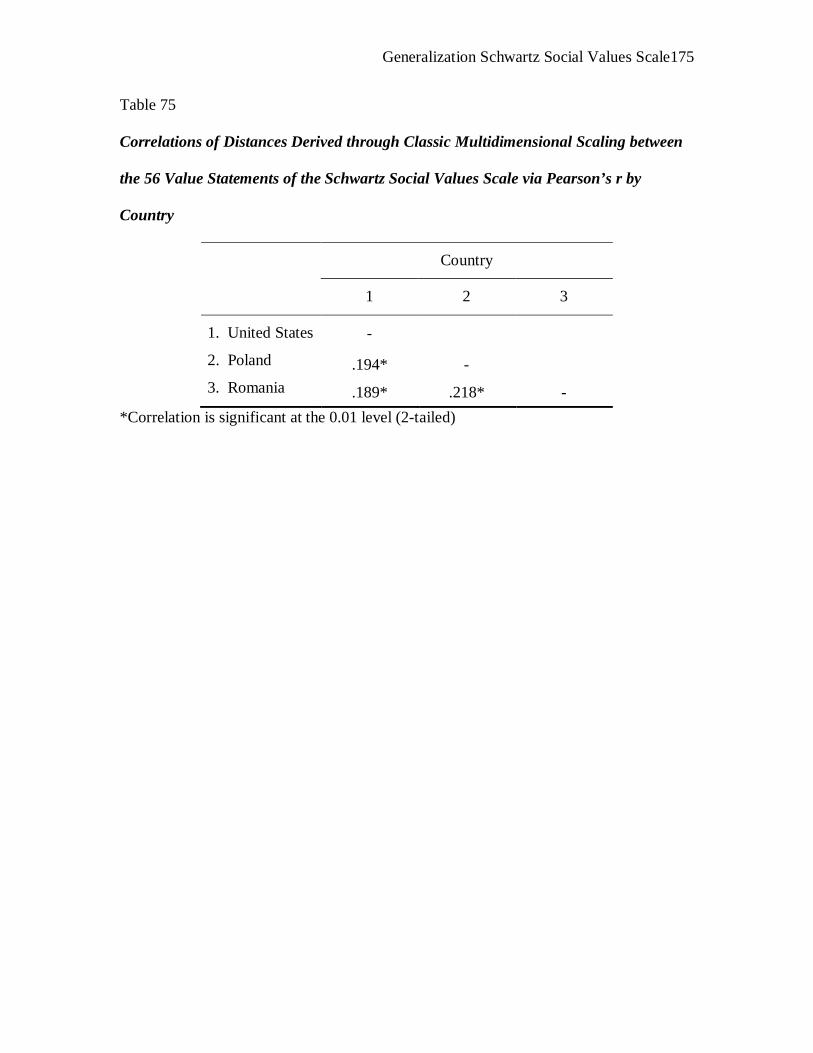
Generalization Schwartz Social Values Scale 175
Table 75 Correlations of Distances Derived through Classic Multidimensional Scaling between
the 56 Value Statements of the Schwartz Social Values Scale via Pearson’s r by
Country
Country
1 2 3
1. United States -
2. Poland .194* - 3. Romania .189* .218* -
*Correlation is significant at the 0.01 level (2-tailed)

Generalization Schwartz Social Values Scale 176
Table 76
Correlations of Distances Derived through Classic Multidimensional Scaling via
Kendall’s Tau-b between the 56 Value Statements of the Schwartz Social Values Scale
by Country
Country
1 2 3
1. United States -
2. Poland .114* - 3. Romania .121* .144* -
*Correlation is significant at the 0.01 level (2-tailed)

Generalization Schwartz Social Values Scale 177
Appendix A
The English version of the Schwartz Social Values Scale
Item
Number
Item
1 Equality (equal opportunity for all)
2 Inner Harmony (at peace with myself)
3 Social Power (control over others, dominance)
4 Pleasure (gratification of desires)
5 Freedom (freedom of action and thought)
6 A Spiritual Life (emphasis on spiritual not material matters)
7 Sense of Belonging (feeling that others care about me)
8 Social Order (stability of society)
9 An Exciting Life (stimulating experiences)
10 Meaning in Life (a purpose in life)
11 Politeness (courtesy, good manners)
12 Wealth (material possessions, money)
13 National Security (protection of my nation from enemies)
14 Self-Respect (belief in one’s own worth)
15 Reciprocation of Favors (avoidance of indebtedness)
16 Creativity (uniqueness, imagination)
17 A World at Peace (free of war and conflict)
18 Respect for Tradition (preservation of time-honored customs)
19 Mature Love (deep emotional and spiritual intimacy)
20 Self-Discipline (self-restraint, resistance to temptation)
21 Privacy (the right to have a private sphere)
22 Family Security (safety for loved ones)
23 Social Recognition (respect, approval by others)
24 Unity with Nature (fitting into nature)
25 A Varied Life (filled with challenge, novelty, and change)
26 Wisdom (a mature understanding of life)

Generalization Schwartz Social Values Scale 178
Appendix A (Continued)
The English version of the Schwartz Social Values Scale
Item
Number
Item
27 Authority (the right to lead or command)
28 True Friendship (close, supportive friends)
29 A World of Beauty (beauty of nature and the arts)
30 Social Justice (correcting injustice, care for the weak)
31 Independent (self-reliant, self-sufficient)
32 Moderate (avoiding extremes of feeling and action)
33 Loyal (faithful to my friends, group)
34 Ambitious (hardworking, aspiring)
35 Broad-minded (tolerant of different ideas and beliefs)
36 Humble (modest, self-effacing)
37 Daring (seeking adventure, risk)
38 Protecting the Environment (preserving nature)
39 Influential (having an impact on people and events)
40 Honoring of Parent and Elders (showing respect)
41 Choosing Own Goals (selecting own purposes)
42 Healthy (not being sick physically or mentally)
43 Capable (competent, effective, efficient)
44 Accepting my Portion in Life (submitting to life’s circumstances)
45 Honest (genuine, sincere)
46 Preserving my Public Image (protecting my “face”)
47 Obedient (dutiful, meeting obligations)
48 Intelligent (logical, thinking)
49 Helpful (working for the welfare of others)
50 Enjoying Life (enjoying food, sex, leisure, etc.)
51 Devout (holding to religious faith and belief)
52 Responsible (dependable, reliable)

Generalization Schwartz Social Values Scale 179
Appendix A (Continued)
The English version of the Schwartz Social Values Scale
Item
Number
Item
53 Curious (interested in everything, exploring)
54 Forgiving (willing to pardon others)
55 Successful (achieving goals)
56 Clean (neat, tidy)
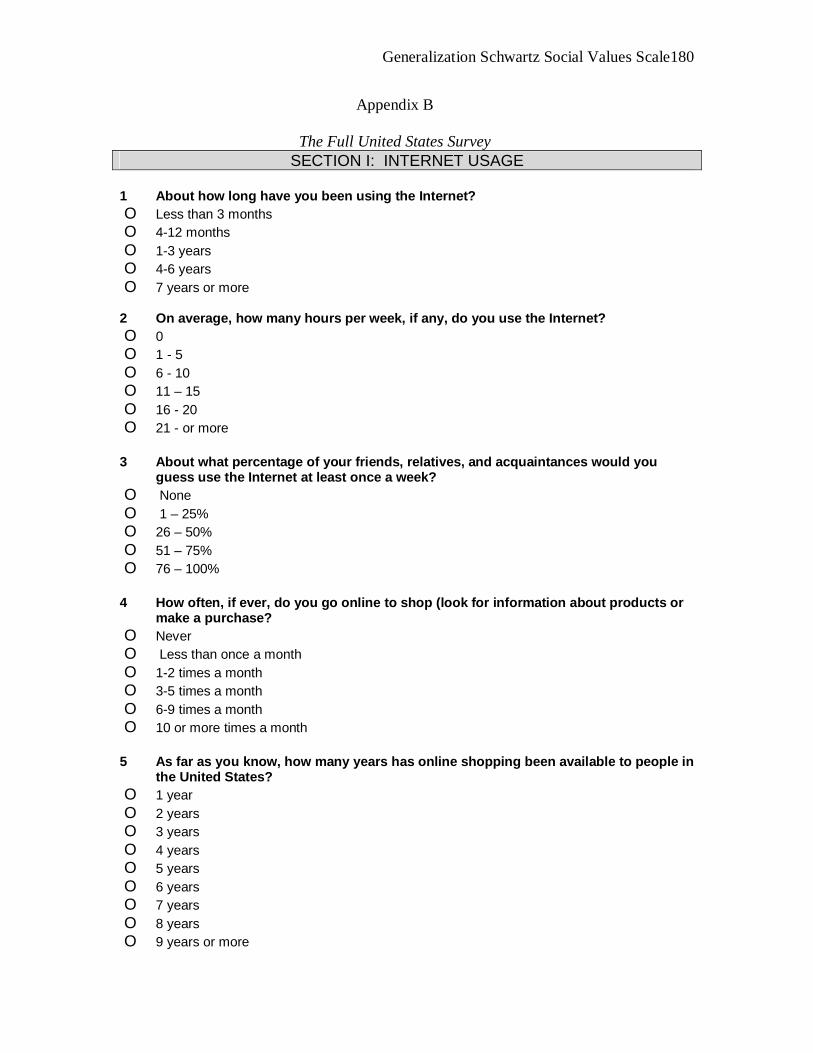
Generalization Schwartz Social Values Scale 180
Appendix B
The Full United States Survey SECTION I: INTERNET USAGE
1 About how long have you been using the Internet? O Less than 3 months O 4-12 months O 1-3 years O 4-6 years O 7 years or more 2 On average, how many hours per week, if any, do you use the Internet? O 0 O 1 - 5 O 6 - 10 O 11 – 15 O 16 - 20 O 21 - or more 3 About what percentage of your friends, relatives, and acquaintances would you
guess use the Internet at least once a week? O None O 1 – 25% O 26 – 50% O 51 – 75% O 76 – 100% 4 How often, if ever, do you go online to shop (look for information about products or
make a purchase? O Never O Less than once a month O 1-2 times a month O 3-5 times a month O 6-9 times a month O 10 or more times a month 5 As far as you know, how many years has online shopping been available to people in
the United States? O 1 year O 2 years O 3 years O 4 years O 5 years O 6 years O 7 years O 8 years O 9 years or more
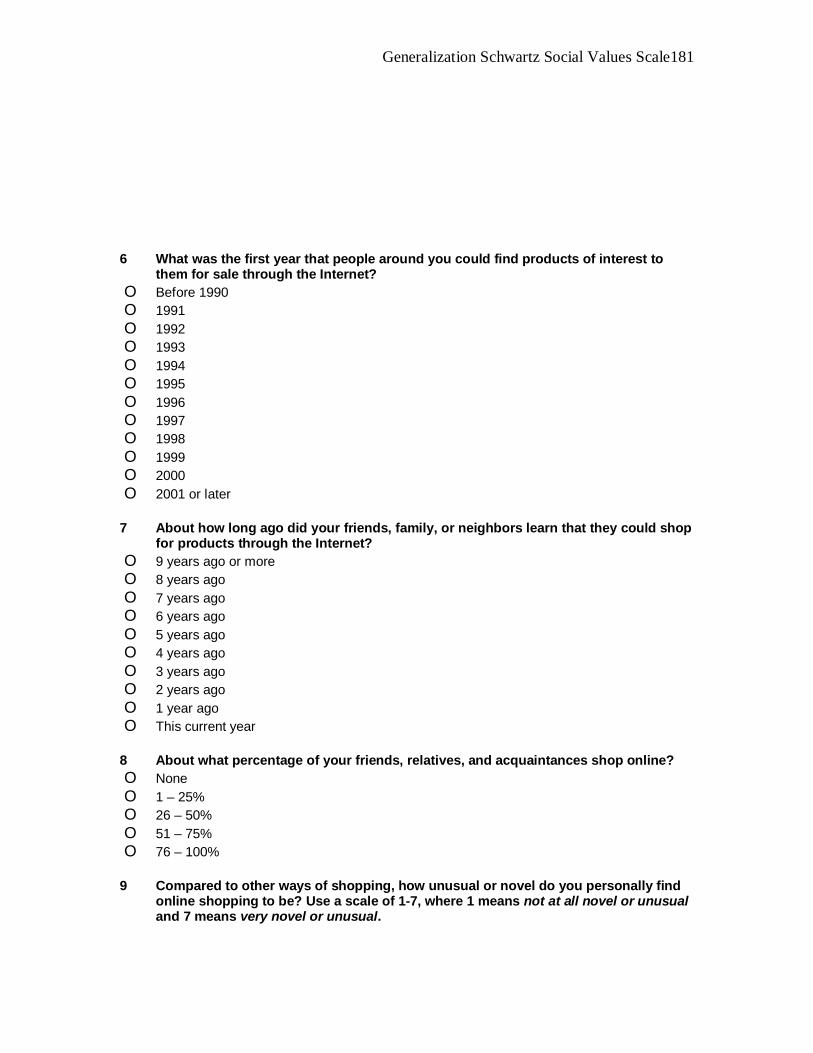
Generalization Schwartz Social Values Scale 181
6 What was the first year that people around you could find products of interest to
them for sale through the Internet? O Before 1990 O 1991 O 1992 O 1993 O 1994 O 1995 O 1996 O 1997 O 1998 O 1999 O 2000 O 2001 or later 7 About how long ago did your friends, family, or neighbors learn that they could shop
for products through the Internet? O 9 years ago or more O 8 years ago O 7 years ago O 6 years ago O 5 years ago O 4 years ago O 3 years ago O 2 years ago O 1 year ago O This current year 8 About what percentage of your friends, relatives, and acquaintances shop online? O None O 1 – 25% O 26 – 50% O 51 – 75% O 76 – 100% 9 Compared to other ways of shopping, how unusual or novel do you personally find
online shopping to be? Use a scale of 1-7, where 1 means not at all novel or unusual and 7 means very novel or unusual.
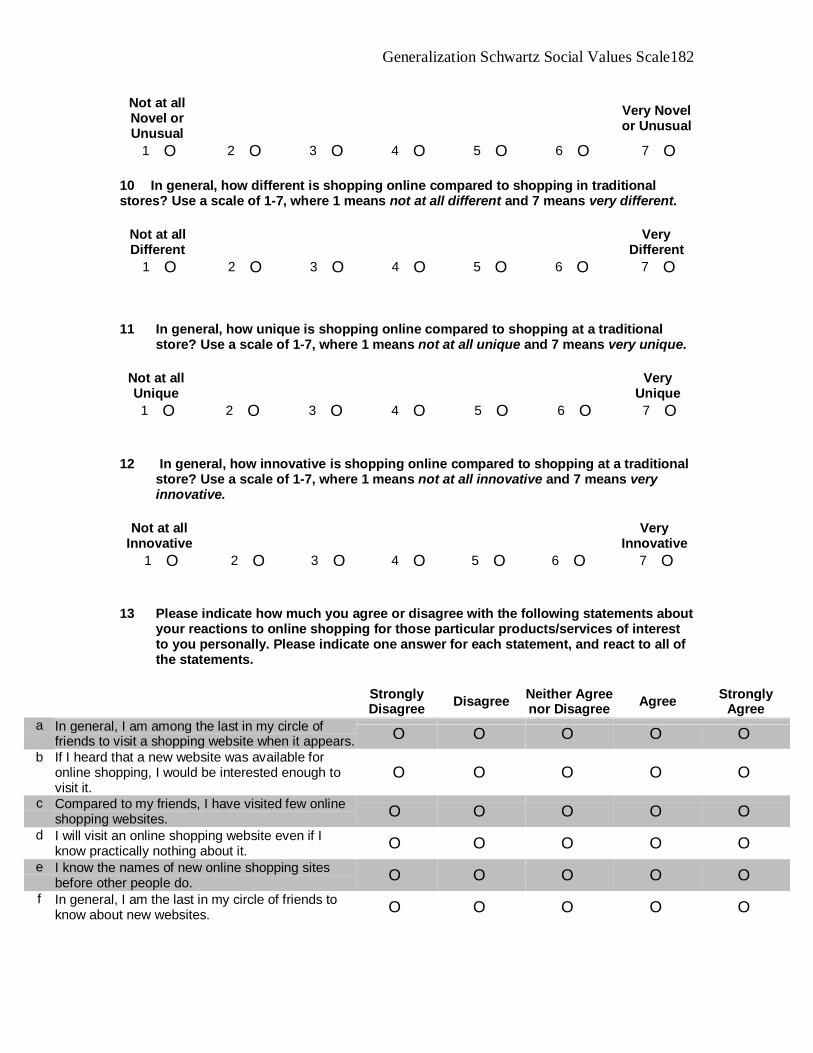
Generalization Schwartz Social Values Scale 182
Not at all Novel or Unusual
Very Novel or Unusual
1 O 2 O 3 O 4 O 5 O 6 O 7 O 10 In general, how different is shopping online compared to shopping in traditional stores? Use a scale of 1-7, where 1 means not at all different and 7 means very different.
Not at all Different
Very Different
1 O 2 O 3 O 4 O 5 O 6 O 7 O 11 In general, how unique is shopping online compared to shopping at a traditional
store? Use a scale of 1-7, where 1 means not at all unique and 7 means very unique.
Not at all Unique
Very Unique
1 O 2 O 3 O 4 O 5 O 6 O 7 O 12 In general, how innovative is shopping online compared to shopping at a traditional
store? Use a scale of 1-7, where 1 means not at all innovative and 7 means very innovative.
Not at all
Innovative Very
Innovative 1 O 2 O 3 O 4 O 5 O 6 O 7 O
13 Please indicate how much you agree or disagree with the following statements about
your reactions to online shopping for those particular products/services of interest to you personally. Please indicate one answer for each statement, and react to all of the statements.
Strongly
Disagree Disagree Neither Agree nor Disagree Agree Strongly
Agree
a In general, I am among the last in my circle of friends to visit a shopping website when it appears. O O O O O
b If I heard that a new website was available for online shopping, I would be interested enough to visit it.
O O O O O
c Compared to my friends, I have visited few online shopping websites. O O O O O
d I will visit an online shopping website even if I know practically nothing about it. O O O O O
e I know the names of new online shopping sites before other people do. O O O O O
f In general, I am the last in my circle of friends to know about new websites. O O O O O
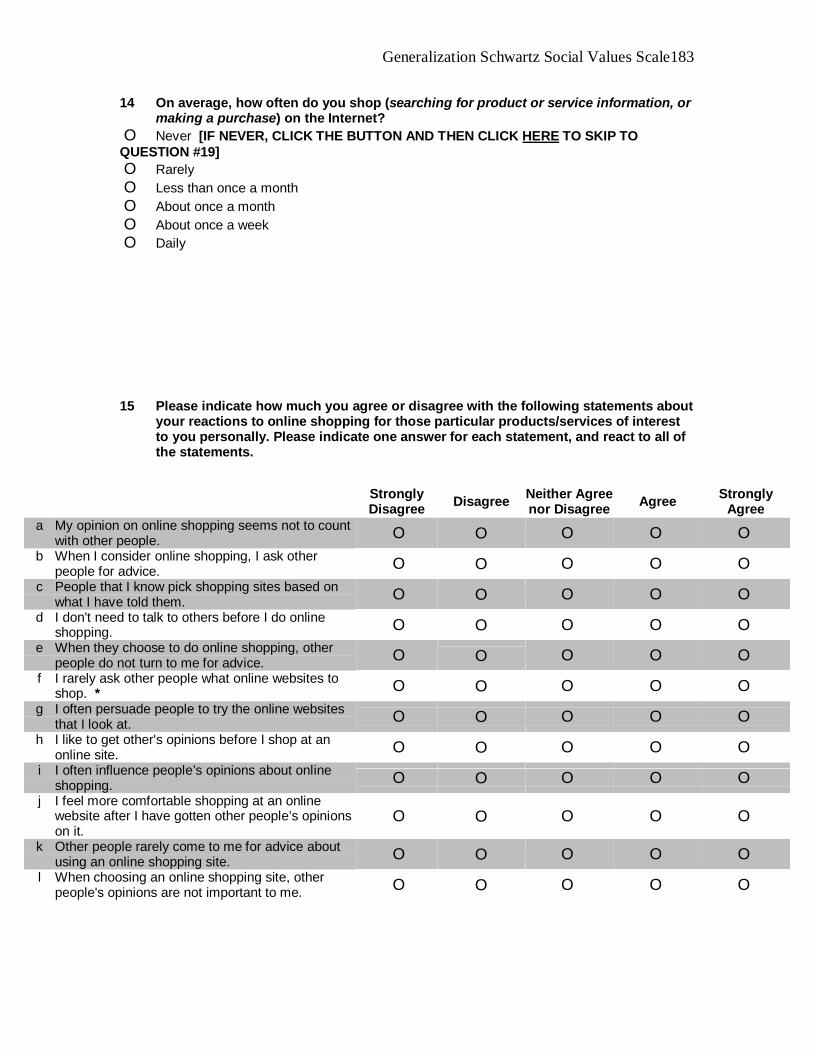
Generalization Schwartz Social Values Scale 183
14 On average, how often do you shop (searching for product or service information, or making a purchase) on the Internet?
O Never [IF NEVER, CLICK THE BUTTON AND THEN CLICK HERE TO SKIP TO QUESTION #19] O Rarely O Less than once a month O About once a month O About once a week O Daily 15 Please indicate how much you agree or disagree with the following statements about
your reactions to online shopping for those particular products/services of interest to you personally. Please indicate one answer for each statement, and react to all of the statements.
Strongly Disagree Disagree Neither Agree
nor Disagree Agree Strongly Agree
a My opinion on online shopping seems not to count with other people. O O O O O
b When I consider online shopping, I ask other people for advice. O O O O O
c People that I know pick shopping sites based on what I have told them. O O O O O
d I don't need to talk to others before I do online shopping. O O O O O
e When they choose to do online shopping, other people do not turn to me for advice. O O O O O
f I rarely ask other people what online websites to shop. * O O O O O
g I often persuade people to try the online websites that I look at. O O O O O
h I like to get other's opinions before I shop at an online site. O O O O O
i I often influence people’s opinions about online shopping. O O O O O
j I feel more comfortable shopping at an online website after I have gotten other people’s opinions on it.
O O O O O
k Other people rarely come to me for advice about using an online shopping site. O O O O O
l When choosing an online shopping site, other people's opinions are not important to me. O O O O O
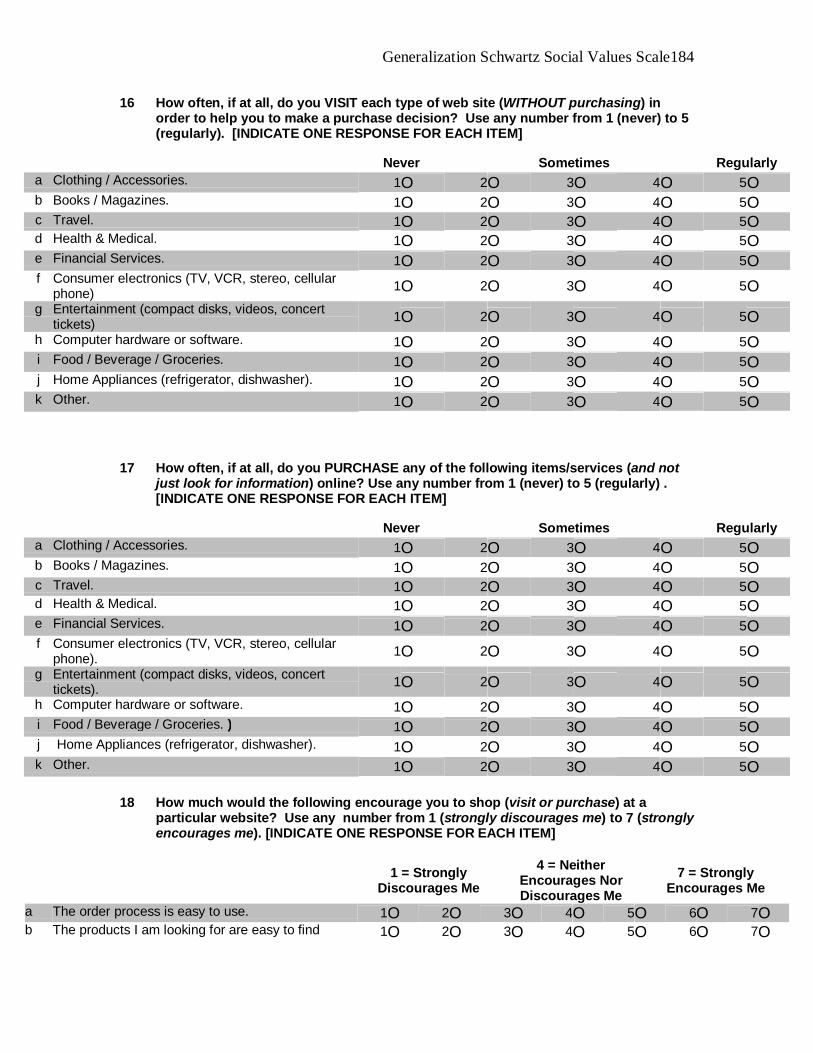
Generalization Schwartz Social Values Scale 184
16 How often, if at all, do you VISIT each type of web site (WITHOUT purchasing) in order to help you to make a purchase decision? Use any number from 1 (never) to 5 (regularly). [INDICATE ONE RESPONSE FOR EACH ITEM]
Never Sometimes Regularly
a Clothing / Accessories. 1O 2O 3O 4 O 5 O b Books / Magazines. 1O 2O 3O 4 O 5 O c Travel. 1O 2O 3O 4 O 5 O d Health & Medical. 1O 2O 3O 4 O 5 O e Financial Services. 1O 2O 3O 4 O 5 O f Consumer electronics (TV, VCR, stereo, cellular
phone) 1O 2O 3O 4 O 5 O g Entertainment (compact disks, videos, concert
tickets) 1O 2O 3O 4 O 5 O h Computer hardware or software. 1O 2O 3O 4 O 5 O i Food / Beverage / Groceries. 1O 2O 3O 4 O 5 O j Home Appliances (refrigerator, dishwasher). 1O 2O 3O 4 O 5 O k Other. 1O 2O 3O 4 O 5 O
17 How often, if at all, do you PURCHASE any of the following items/services (and not
just look for information) online? Use any number from 1 (never) to 5 (regularly) . [INDICATE ONE RESPONSE FOR EACH ITEM]
Never Sometimes Regularly
a Clothing / Accessories. 1O 2O 3O 4 O 5 O b Books / Magazines. 1O 2O 3O 4 O 5 O c Travel. 1O 2O 3O 4 O 5 O d Health & Medical. 1O 2O 3O 4 O 5 O e Financial Services. 1O 2O 3O 4 O 5 O f Consumer electronics (TV, VCR, stereo, cellular
phone). 1O 2O 3O 4 O 5 O g Entertainment (compact disks, videos, concert
tickets). 1O 2O 3O 4 O 5 O h Computer hardware or software. 1O 2O 3O 4 O 5 O i Food / Beverage / Groceries. ) 1O 2O 3O 4 O 5 O j Home Appliances (refrigerator, dishwasher). 1O 2O 3O 4 O 5 O k Other. 1O 2O 3O 4 O 5 O
18 How much would the following encourage you to shop (visit or purchase) at a
particular website? Use any number from 1 (strongly discourages me) to 7 (strongly encourages me). [INDICATE ONE RESPONSE FOR EACH ITEM]
1 = Strongly Discourages Me
4 = Neither Encourages Nor Discourages Me
7 = Strongly Encourages Me
a The order process is easy to use. 1O 2O 3O 4O 5O 6O 7O b The products I am looking for are easy to find 1O 2O 3O 4O 5O 6O 7O

Generalization Schwartz Social Values Scale 185
c The website is new and different 1O 2O 3O 4O 5O 6O 7O d Product price. 1O 2O 3O 4O 5O 6O 7O e Provides customer feedback (that is, the site
provides a place for you to learn about other customer’s evaluation of the product))
1O 2O 3O 4O 5O 6O 7O
f My friends and family have been happy when they have shopped there 1O 2O 3O 4O 5O 6O 7O
g Reputation and credibility of the company on the web. 1O 2O 3O 4O 5O 6O 7O
h It is enjoyable to visit. 1O 2O 3O 4O 5O 6O 7O i The delivery time is short. 1O 2O 3O 4O 5O 6O 7O j The site is in my primary language. 1O 2O 3O 4O 5O 6O 7O k My friends and family will like to know my opinions
of the site. 1O 2O 3O 4O 5O 6O 7O l A wide selection and variety of products. 1O 2O 3O 4O 5O 6O 7O m Low or no charge for shipping and handling. 1O 2O 3O 4O 5O 6O 7O n It has entertaining graphics and displays. 1O 2O 3O 4O 5O 6O 7O o Provides product information, including FAQs –
frequently asked questions. 1O 2O 3O 4O 5O 6O 7O p A good place to find a bargain. 1O 2O 3O 4O 5O 6O 7O q Providing credit card safety. 1O 2O 3O 4O 5O 6O 7O r Fast response time from customer service. 1O 2O 3O 4O 5O 6O 7O s I hear about it on the radio, television or in
newspapers . 1O 2O 3O 4O 5O 6O 7O t The download speed of the page. 1O 2O 3O 4O 5O 6O 7O u A return policy that is easy to understand and us. 1O 2O 3O 4O 5O 6O 7O v Price incentives (coupons, future sale items,
frequent shopper program, etc.). 1O 2O 3O 4O 5O 6O 7O w Interactive web design (try it on, design your
product / services). 1O 2O 3O 4O 5O 6O 7O
*YOU ARE HALF WAY THROUGH THE SURVEY, THANK YOU FOR YOUR PATIENCE.
SECTION II: OPINIONS AND BELIEFS 19 Please indicate whether the following statements are true or false of you.
True False a. I sometimes litter. T O F O b. Before voting I thoroughly investigate the qualifications of all the
candidates. T O F O c. I always admit my mistakes openly and face the potential
negative consequences. T O F O d. I never hesitate to go out of my way to help someone in trouble. T O F O e. In traffic I am always polite and considerate of others. T O F O f. It is hard for me to go on with my work if I am not encouraged. T O F O g. I always accept others’ opinions, even when they don’t agree
with my own. T O F O h. I have never intensely disliked anyone. T O F O i. I take out my bad moods on others now and then. T O F O

Generalization Schwartz Social Values Scale 186
j. On occasion I have doubts about my ability to succeed in life. T O F O k. There has been an occasion when I took advantage of someone
else. T O F O l. I sometimes feel resentful when I don’t get my way. T O F O
m. In conversations I always listen attentively and let others finish their sentences. T O F O
n. I am always careful about my manner or dress. T O F O o. I never hesitate to help someone in case of emergency. T O F O p. My table manners at home are as good as when I eat out in a
restaurant. T O F O q. If I could get into a movie without paying and be sure that I was
not seen I would probably do it. T O F O r. When I have made a promise, I keep it – no ifs, ands, or buts. T O F O s. On a few occasions, I have given up doing something because I
thought too little of my ability. T O F O t. I occasionally speak badly of others behind their backs. T O F O u. I like to gossip at times. T O F O v. I would never live off/at other people’s expense. T O F O w. There have been times when I felt like rebelling against people in
authority even though I knew they were right. T O F O x. I always stay friendly and courteous with other people, even
when I am stressed out. T O F O y. No matter who I am talking to, I’m always a good listener. T O F O z. During arguments I always stay objective and matter-of-fact. T O F O
aa. I can remember “playing sick” to get out of something. T O F O bb. There has been at least one occasion when I failed to return an
item that I borrowed. T O F O cc. There have been occasions when I took advantage of someone. T O F O dd. I always eat a healthy diet. T O F O ee. I’m always willing to admit when I make a mistake. T O F O ff. Sometimes I only help because I expect something in return. T O F O
gg. I always try to practice what I preach. T O F O hh. I don’t find it particularly difficult to get along with loud-mouthed
obnoxious people. T O F O ii. I sometimes try to get even rather than to forgive and forget. T O F O jj. When I don’t know something I don’t at all mind admitting it. T O F O
kk. I am courteous even to people who are disagreeable. T O F O ll. At times I have really insisted on having things my own way. T O F O
mm. There have been occasions when I felt like smashing things. T O F O nn. I would never think of letting someone else be punished for my
wrongdoings. T O F O oo. I never resent being asked to return a favor. T O F O pp. I have never been irked when people expressed ideas very
different from my own. T O F O qq. I never make a long trip without checking the safety of my car. T O F O rr. There have been times when I have been quite jealous of the
good fortune of others. T O F O ss. I have almost never felt the urge to tell someone off. T O F O tt. I am sometimes irritated by people who ask favors of me. T O F O
uu. I have never felt that I was punished without cause. T O F O
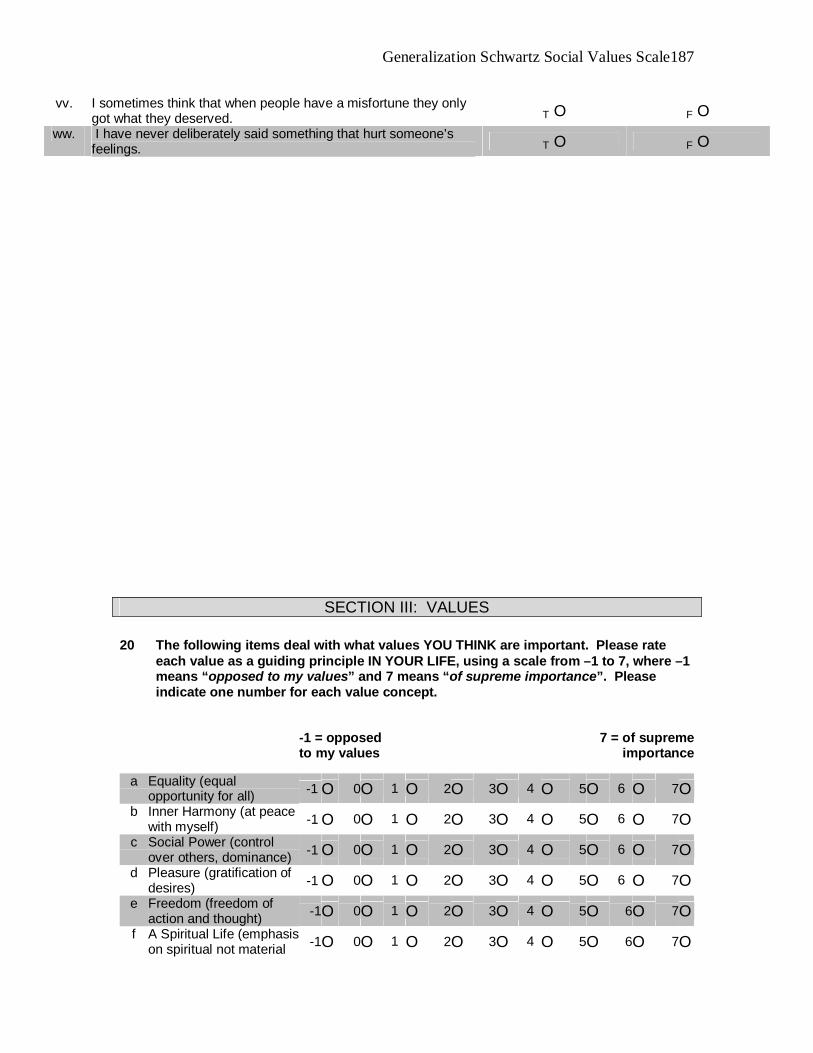
Generalization Schwartz Social Values Scale 187
vv. I sometimes think that when people have a misfortune they only got what they deserved. T O F O
ww. I have never deliberately said something that hurt someone’s feelings. T O F O
SECTION III: VALUES
20 The following items deal with what values YOU THINK are important. Please rate each value as a guiding principle IN YOUR LIFE, using a scale from –1 to 7, where –1 means “opposed to my values” and 7 means “of supreme importance”. Please indicate one number for each value concept.
-1 = opposed to my values
7 = of supreme importance
a Equality (equal opportunity for all) -1 O 0O 1 O 2O 3O 4 O 5O 6 O 7O
b Inner Harmony (at peace with myself) -1 O 0O 1 O 2O 3O 4 O 5O 6 O 7O
c Social Power (control over others, dominance) -1 O 0O 1 O 2O 3O 4 O 5O 6 O 7O
d Pleasure (gratification of desires) -1 O 0O 1 O 2O 3O 4 O 5O 6 O 7O
e Freedom (freedom of action and thought) -1O 0O 1 O 2O 3O 4 O 5O 6O 7O
f A Spiritual Life (emphasis on spiritual not material -1O 0O 1 O 2O 3O 4 O 5O 6O 7O

Generalization Schwartz Social Values Scale 188
matters)
g Sense of Belonging (feeling that others care about me)
-1O 0O 1 O 2O 3O 4 O 5O 6O 7O
h Social Order (stability of society) -1O 0O 1 O 2O 3O 4 O 5O 6O 7O
i An Exciting Life (stimulating experiences) -1O 0O 1 O 2O 3O 4 O 5O 6O 7O
j Meaning in Life (a purpose in life) -1O 0O 1O 2O 3O 4O 5O 6O 7O
k Politeness (courtesy, good manners) -1O 0O 1O 2O 3O 4O 5O 6O 7O
l Wealth (material possessions, money) -1O 0O 1O 2O 3O 4O 5O 6O 7O
m National Security (protection of my nation from enemies)
-1O 0O 1O 2O 3O 4O 5O 6O 7O
n Self-Respect (belief in one’s own worth) -1O 0O 1O 2O 3O 4O 5O 6O 7O
o Reciprocation of Favors (avoidance of indebtedness)
-1O 0O 1O 2O 3O 4O 5O 6O 7O
p Creativity (uniqueness, imagination) -1O 0O 1O 2O 3O 4O 5O 6O 7O
q A World at Peace (free of war and conflict) -1O 0O 1O 2O 3O 4O 5O 6O 7O
r Respect for Tradition (preservation of time-honored customs)
-1O 0O 1O 2O 3O 4O 5O 6O 7O
s Mature Love (deep emotional and spiritual intimacy)
-1O 0O 1O 2O 3O 4O 5O 6O 7O
t Self-Discipline (self-restraint, resistance to temptation)
-1O 0O 1O 2O 3O 4O 5O 6O 7O
u Privacy (the right to have a private sphere) -1O 0O 1O 2O 3O 4O 5O 6O 7O
-1 = opposed to my values
7 = of supreme importance
v Family Security (safety for loved ones) -1O 0O 1O 2O 3O 4O 5O 6O 7O
w Social Recognition (respect, approval by others)
-1O 0O 1O 2O 3O 4O 5O 6O 7O
x Unity with Nature (fitting into nature) -1O 0O 1O 2O 3O 4O 5O 6O 7O
y A Varied Life (filled with challenge, novelty, and -1O 0O 1O 2O 3O 4O 5O 6O 7O
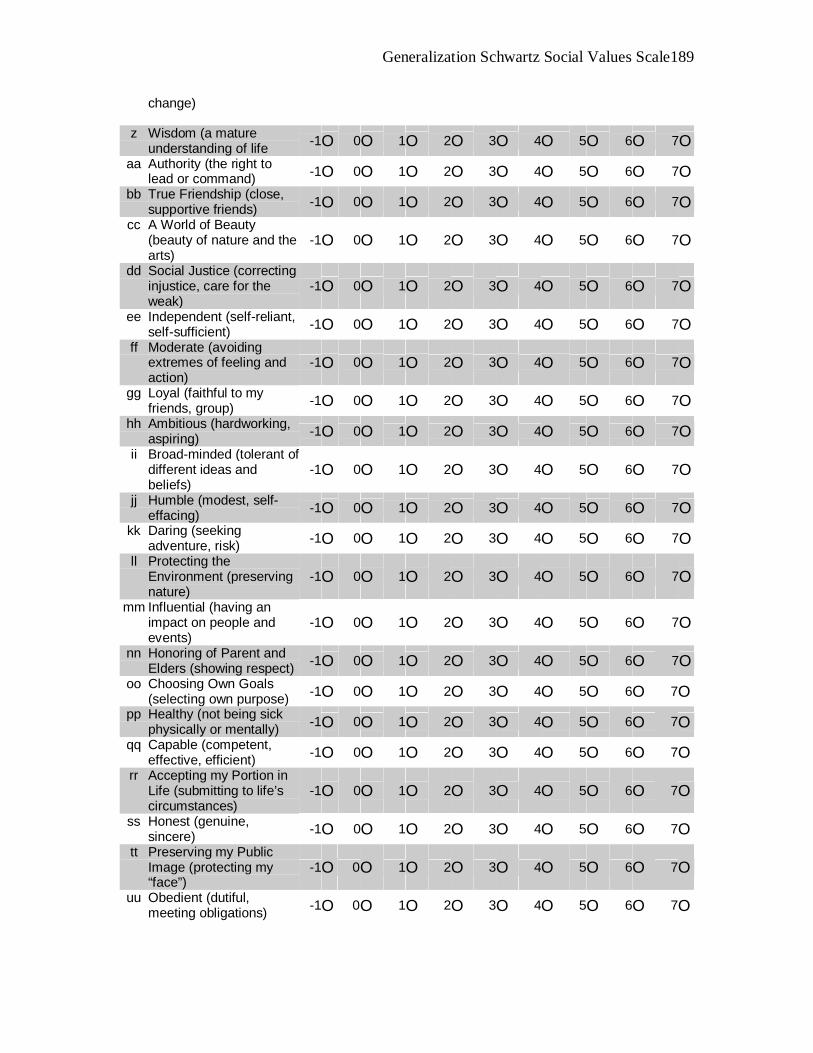
Generalization Schwartz Social Values Scale 189
change)
z Wisdom (a mature understanding of life -1O 0O 1O 2O 3O 4O 5O 6O 7O
aa Authority (the right to lead or command) -1O 0O 1O 2O 3O 4O 5O 6O 7O
bb True Friendship (close, supportive friends) -1O 0O 1O 2O 3O 4O 5O 6O 7O
cc A World of Beauty (beauty of nature and the arts)
-1O 0O 1O 2O 3O 4O 5O 6O 7O
dd Social Justice (correcting injustice, care for the weak)
-1O 0O 1O 2O 3O 4O 5O 6O 7O
ee Independent (self-reliant, self-sufficient) -1O 0O 1O 2O 3O 4O 5O 6O 7O
ff Moderate (avoiding extremes of feeling and action)
-1O 0O 1O 2O 3O 4O 5O 6O 7O
gg Loyal (faithful to my friends, group) -1O 0O 1O 2O 3O 4O 5O 6O 7O
hh Ambitious (hardworking, aspiring) -1O 0O 1O 2O 3O 4O 5O 6O 7O
ii Broad-minded (tolerant of different ideas and beliefs)
-1O 0O 1O 2O 3O 4O 5O 6O 7O
jj Humble (modest, self-effacing) -1O 0O 1O 2O 3O 4O 5O 6O 7O
kk Daring (seeking adventure, risk) -1O 0O 1O 2O 3O 4O 5O 6O 7O
ll Protecting the Environment (preserving nature)
-1O 0O 1O 2O 3O 4O 5O 6O 7O
mm Influential (having an impact on people and events)
-1O 0O 1O 2O 3O 4O 5O 6O 7O
nn Honoring of Parent and Elders (showing respect) -1O 0O 1O 2O 3O 4O 5O 6O 7O
oo Choosing Own Goals (selecting own purpose) -1O 0O 1O 2O 3O 4O 5O 6O 7O
pp Healthy (not being sick physically or mentally) -1O 0O 1O 2O 3O 4O 5O 6O 7O
qq Capable (competent, effective, efficient) -1O 0O 1O 2O 3O 4O 5O 6O 7O
rr Accepting my Portion in Life (submitting to life’s circumstances)
-1O 0O 1O 2O 3O 4O 5O 6O 7O
ss Honest (genuine, sincere) -1O 0O 1O 2O 3O 4O 5O 6O 7O
tt Preserving my Public Image (protecting my “face”)
-1O 0 O 1O 2O 3O 4O 5O 6O 7O
uu Obedient (dutiful, meeting obligations) -1O 0 O 1O 2O 3O 4O 5O 6O 7O
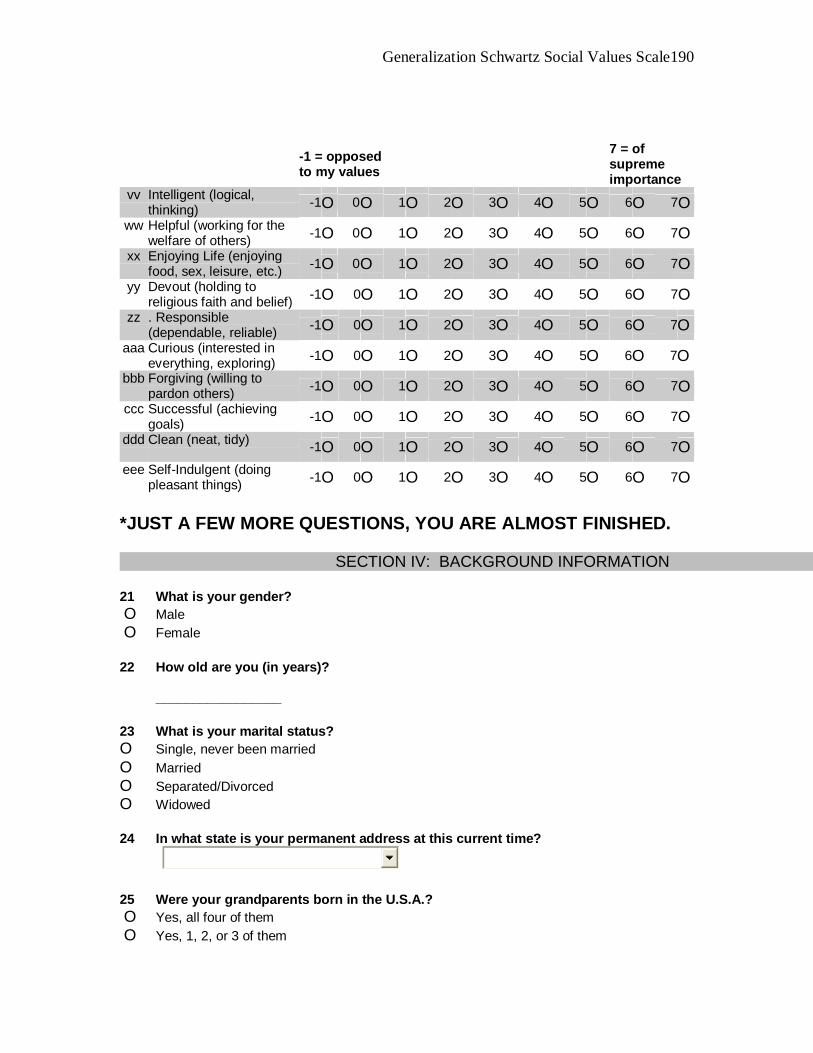
Generalization Schwartz Social Values Scale 190
-1 = opposed to my values
7 = of supreme importance
vv Intelligent (logical, thinking) -1O 0 O 1O 2O 3O 4O 5O 6O 7O
ww Helpful (working for the welfare of others) -1O 0 O 1O 2O 3O 4O 5O 6O 7O
xx Enjoying Life (enjoying food, sex, leisure, etc.) -1O 0 O 1O 2O 3O 4O 5O 6O 7O
yy Devout (holding to religious faith and belief) -1O 0O 1O 2O 3O 4O 5O 6O 7O
zz . Responsible (dependable, reliable) -1O 0O 1O 2O 3O 4O 5O 6O 7O
aaa Curious (interested in everything, exploring) -1O 0O 1O 2O 3O 4O 5O 6O 7O
bbb Forgiving (willing to pardon others) -1O 0O 1O 2O 3O 4O 5O 6O 7O
ccc Successful (achieving goals) -1O 0O 1O 2O 3O 4O 5O 6O 7O
ddd Clean (neat, tidy) -1O 0O 1O 2O 3O 4O 5O 6O 7O eee Self-Indulgent (doing
pleasant things) -1O 0O 1O 2O 3O 4O 5O 6O 7O *JUST A FEW MORE QUESTIONS, YOU ARE ALMOST FINISHED.
SECTION IV: BACKGROUND INFORMATION 21 What is your gender? O Male O Female 22 How old are you (in years)? _________________ 23 What is your marital status? O Single, never been married O Married O Separated/Divorced O Widowed 24 In what state is your permanent address at this current time?
25 Were your grandparents born in the U.S.A.? O Yes, all four of them O Yes, 1, 2, or 3 of them

Generalization Schwartz Social Values Scale 191
O None of them O Don’t know 26 Were your parents born in the U.S.A.? O Neither O My mother O My father O Both O Don’t know 27 Were you born in the U.S.A.? O Yes O No O Don’t know 28 Would you describe your family as mainly: O African American O Taiwanese American O Chinese (mainland) American O Iranian American O Palestinian American O German/Austrian American O Hispanic American O Polish American O Greek American O Romanian American O Canadian O Other (please specify) ____________________ 29 What was the last year of education you completed? O Some high school O High school O Technical School/Training (such as auto mechanic) O Some college/university O College/university graduate O Graduate or professional school 30 What is your current employment? [CHECK ALL THAT APPLY] Employed-full time [GO TO Q36] Employed-part time [GO TO Q36] Self employed [GO TO Q36] (self) Temporarily unemployed [GO TO Q37]

Generalization Schwartz Social Values Scale 192
Student [GO TO Q37] Homemaker/housewife [GO TO Q37] Retired [GO TO Q37] 31 (IF EMPLOYED) What is your occupation? O Professional O Managerial/Executive O Sales O Clerical O Labor with technical training O Labor without technical training O Other (please specify) _____________________ 32 Please indicate which of the following categories best represents your annual
household income before taxes. (income) O $10,000 or less O $10,001 to $20,000 O $20,001 to $30,000 O $30,001 to $40,000 O $40,001 to $50,000 O $50,001 to $75,000 O $75,001 to $100,000 O more than $100,000 33 How many people live in your household, including yourself (please enter the number)? __________________ 34 Please indicate whether you own each of the following items. [INDICATE ONE RESPONSE FOR EACH] Yes No Don’t Know
a A personal computer O O O b A DVD player O O O c A high-definition TV (HDTV) O O O d A Personal Digital Assistant
(PDA) O O O

Generalization Schwartz Social Values Scale 193
Appendix C
The Full Polish Survey in its Original English INTERNET USAGE
1. Is there a personal computer in your home? [CHECK ONE] 1 Yes 2 No 2. About what percentage of your friends, relatives, and acquaintances would you guess use the Internet at least once a week? [CHECK ONE] 1 None 2 1 - 25% 3 26 - 50% 4 51 - 75% 5 76 - 100% 3. About how many, if any, of your friends, relatives, and acquaintances shop online? [CHECK ONE] 1 None 2 1 - 25% 3 26 - 50% 4 51 - 75% 5 76 - 100% 4. About how long ago did your friends, family, or neighbors, learn that they could purchase products on the Internet? [CHECK YOUR ONE BEST GUESS] 1 Over 10 years ago 2 10 years ago 3 9 years ago 4 8 years ago 5 7 years ago 6 6 years ago 7 5 years ago 8 4 years ago 9 3 years ago 10 2 years ago 11 1 year ago 12 This current year 5. What was the first year that people living in your hometown could find products of interest to them for sale on the Internet? [CHECK ONE]
Before
1990 1990 1991 1992 1993 1994 1995 1996 1997 1998 1999 2000 2000
or later 6. AS FAR AS YOU KNOW, for about how many years has online shopping been available to people in Poland? [CHECK ONE]
1 year 2 years 3 years 4 years 5 years 6 years 7 years 8 years 9 years 9 years

Generalization Schwartz Social Values Scale 194
or more 7. Have you ever used the World-Wide Web (WWW) before? [CHECK ONE] 1 Yes [GO TO Q8] 2 No [GO TO Q27] 8. Where do you use the Internet most often? [CHECK ONE] 1 Home 2 School 3 Work 4 Other 9. On average, how many hours per week, if any, do you use the Internet? [CHECK ONE] 1 0 2 1 - 5 3 6 - 10 4 11 - 15 5 16 - 20 6 21 - or more 10. About how long have you been using the Internet? [CHECK ONE] 1 Less than 3 months 2 4 - 12 months 3 1 - 3 years 4 4 - 6 years 5 7 - 9 years 6 10 years or more 11. On average, how often do you do each of the following on the Internet? [CHECK ONE RESPONSE FOR EACH ITEM] Rarely or
Never Less Than
Once a Month
About Once A Month
About Once A Week
Daily
a. Shopping (that is, searching for product or service information, or making a purchase)
1 2 3 4 5
b. Entertainment (game playing, etc.) 1 2 3 4 5 c. Communication with others (E-mail, Voice-mail, BBS,
ICQ, Instant Messenger, etc.) 1 2 3 4 5
d. Education and newspaper reading (e-books, e-magazines, etc.)
1 2 3 4 5
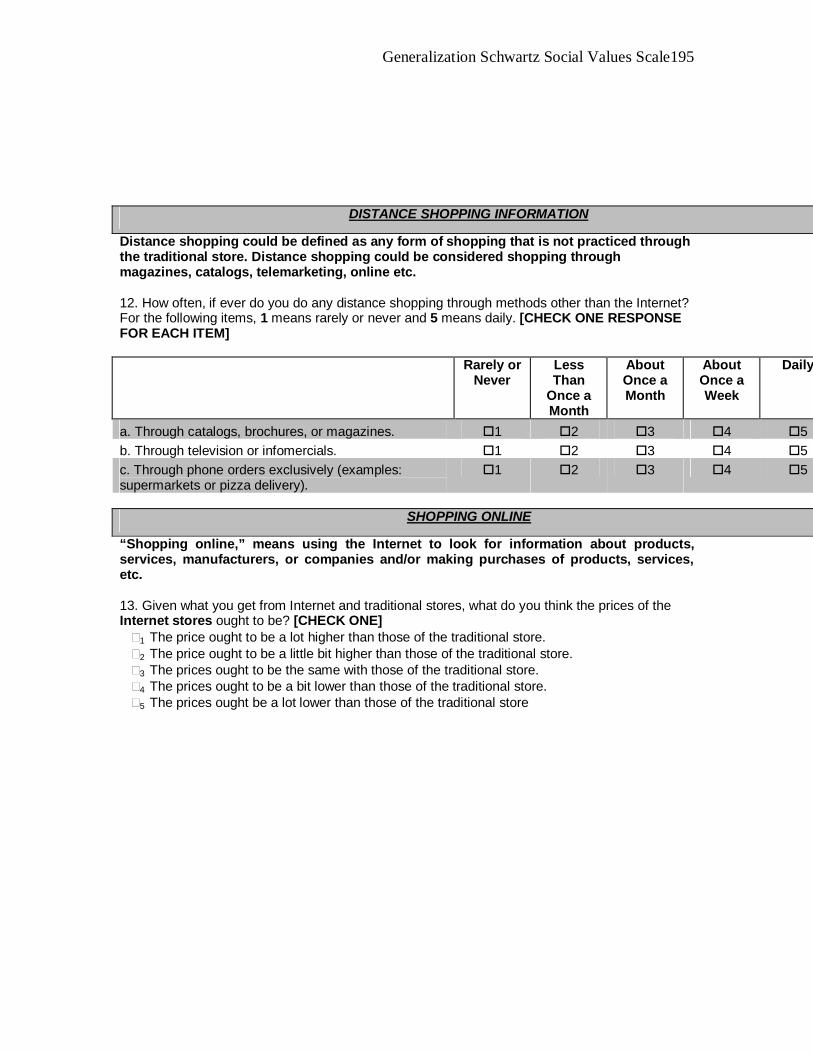
Generalization Schwartz Social Values Scale 195
DISTANCE SHOPPING INFORMATION
Distance shopping could be defined as any form of shopping that is not practiced through the traditional store. Distance shopping could be considered shopping through magazines, catalogs, telemarketing, online etc. 12. How often, if ever do you do any distance shopping through methods other than the Internet? For the following items, 1 means rarely or never and 5 means daily. [CHECK ONE RESPONSE FOR EACH ITEM] Rarely or
Never Less Than
Once a Month
About Once a Month
About Once a Week
Daily
a. Through catalogs, brochures, or magazines. 1 2 3 4 5 b. Through television or infomercials. 1 2 3 4 5 c. Through phone orders exclusively (examples: supermarkets or pizza delivery).
1 2 3 4 5
SHOPPING ONLINE
“Shopping online,” means using the Internet to look for information about products, services, manufacturers, or companies and/or making purchases of products, services, etc.
13. Given what you get from Internet and traditional stores, what do you think the prices of the Internet stores ought to be? [CHECK ONE]
1 The price ought to be a lot higher than those of the traditional store. 2 The price ought to be a little bit higher than those of the traditional store. 3 The prices ought to be the same with those of the traditional store. 4 The prices ought to be a bit lower than those of the traditional store. 5 The prices ought be a lot lower than those of the traditional store
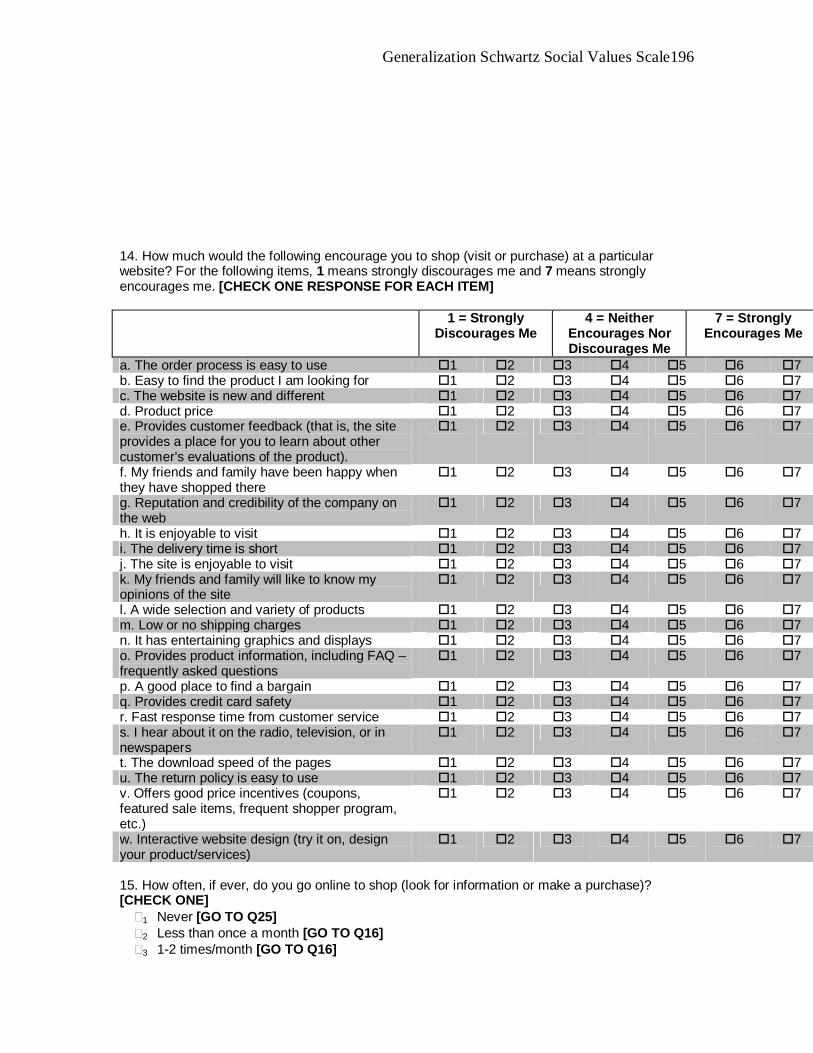
Generalization Schwartz Social Values Scale 196
14. How much would the following encourage you to shop (visit or purchase) at a particular website? For the following items, 1 means strongly discourages me and 7 means strongly encourages me. [CHECK ONE RESPONSE FOR EACH ITEM] 1 = Strongly
Discourages Me 4 = Neither
Encourages Nor Discourages Me
7 = Strongly Encourages Me
a. The order process is easy to use 1 2 3 4 5 6 7 b. Easy to find the product I am looking for 1 2 3 4 5 6 7 c. The website is new and different 1 2 3 4 5 6 7 d. Product price 1 2 3 4 5 6 7 e. Provides customer feedback (that is, the site provides a place for you to learn about other customer’s evaluations of the product).
1 2 3 4 5 6 7
f. My friends and family have been happy when they have shopped there
1 2 3 4 5 6 7
g. Reputation and credibility of the company on the web
1 2 3 4 5 6 7
h. It is enjoyable to visit 1 2 3 4 5 6 7 i. The delivery time is short 1 2 3 4 5 6 7 j. The site is enjoyable to visit 1 2 3 4 5 6 7 k. My friends and family will like to know my opinions of the site
1 2 3 4 5 6 7
l. A wide selection and variety of products 1 2 3 4 5 6 7 m. Low or no shipping charges 1 2 3 4 5 6 7 n. It has entertaining graphics and displays 1 2 3 4 5 6 7 o. Provides product information, including FAQ – frequently asked questions
1 2 3 4 5 6 7
p. A good place to find a bargain 1 2 3 4 5 6 7 q. Provides credit card safety 1 2 3 4 5 6 7 r. Fast response time from customer service 1 2 3 4 5 6 7 s. I hear about it on the radio, television, or in newspapers
1 2 3 4 5 6 7
t. The download speed of the pages 1 2 3 4 5 6 7 u. The return policy is easy to use 1 2 3 4 5 6 7 v. Offers good price incentives (coupons, featured sale items, frequent shopper program, etc.)
1 2 3 4 5 6 7
w. Interactive website design (try it on, design your product/services)
1 2 3 4 5 6 7
15. How often, if ever, do you go online to shop (look for information or make a purchase)? [CHECK ONE] 1 Never [GO TO Q25] 2 Less than once a month [GO TO Q16] 3 1-2 times/month [GO TO Q16]
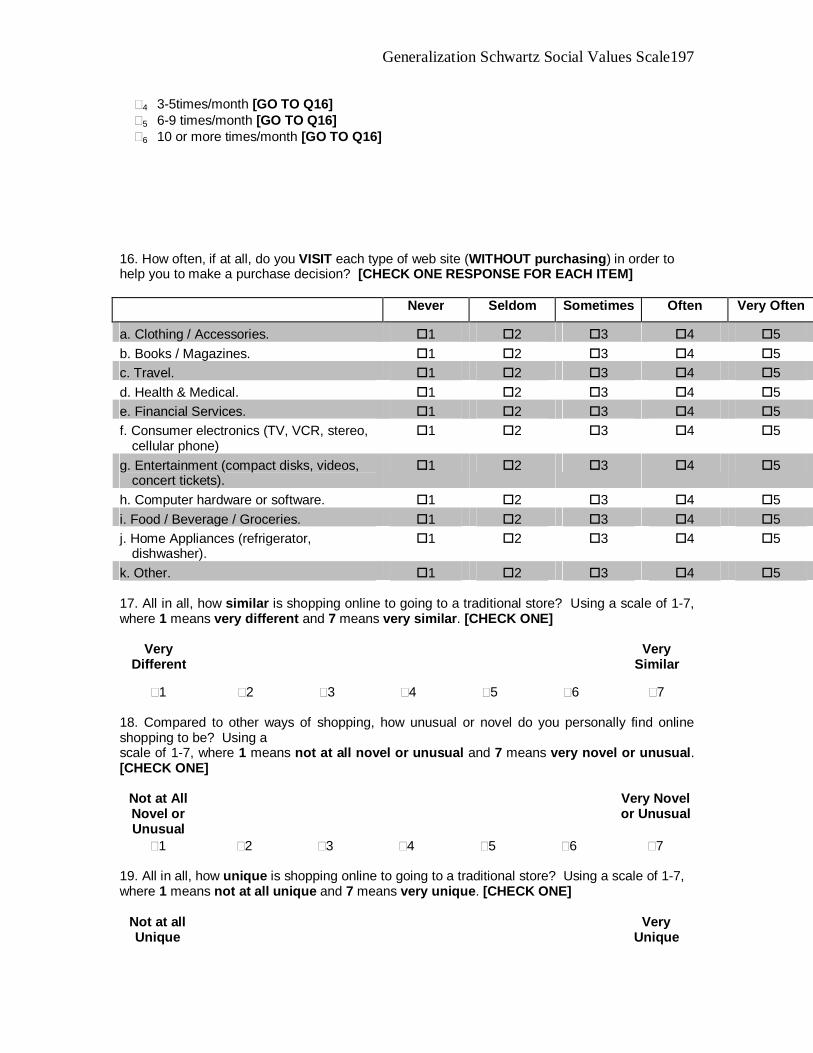
Generalization Schwartz Social Values Scale 197
4 3-5times/month [GO TO Q16] 5 6-9 times/month [GO TO Q16] 6 10 or more times/month [GO TO Q16] 16. How often, if at all, do you VISIT each type of web site (WITHOUT purchasing) in order to help you to make a purchase decision? [CHECK ONE RESPONSE FOR EACH ITEM] Never Seldom Sometimes Often Very Often
a. Clothing / Accessories. 1 2 3 4 5 b. Books / Magazines. 1 2 3 4 5 c. Travel. 1 2 3 4 5 d. Health & Medical. 1 2 3 4 5 e. Financial Services. 1 2 3 4 5 f. Consumer electronics (TV, VCR, stereo,
cellular phone) 1 2 3 4 5
g. Entertainment (compact disks, videos, concert tickets).
1 2 3 4 5
h. Computer hardware or software. 1 2 3 4 5 i. Food / Beverage / Groceries. 1 2 3 4 5 j. Home Appliances (refrigerator,
dishwasher). 1 2 3 4 5
k. Other. 1 2 3 4 5 17. All in all, how similar is shopping online to going to a traditional store? Using a scale of 1-7, where 1 means very different and 7 means very similar. [CHECK ONE]
Very Different
Very Similar
1 2 3 4 5 6 7 18. Compared to other ways of shopping, how unusual or novel do you personally find online shopping to be? Using a scale of 1-7, where 1 means not at all novel or unusual and 7 means very novel or unusual. [CHECK ONE]
Not at All Novel or Unusual
Very Novel or Unusual
1 2 3 4 5 6 7 19. All in all, how unique is shopping online to going to a traditional store? Using a scale of 1-7, where 1 means not at all unique and 7 means very unique. [CHECK ONE]
Not at all Unique
Very Unique

Generalization Schwartz Social Values Scale 198
1 2 3 4 5 6 7 20. Compared to what you find in traditional stores, how often are you surprised by the ads, products, prices, displays, and other features of online shopping? [CHECK ONE]
1 I am surprised much more often online. 2 I am surprised somewhat more often online 3 I am surprised slightly more often online 4 I am surprised equally often online and in traditional stores 5 I am surprised slightly more often in traditional stores 6 I am surprised somewhat more often in traditional stores 7 I am surprised much more often in traditional stores 8 Don’t Know
21. All in all, how innovative is shopping online to going to a traditional store? Using a scale of 1-7, where 1 means not at all innovative and 7 means highly innovative. [CHECK ONE]
Not at all Innovative
Highly Innovative
1 2 3 4 5 6 7 22. Do you find shopping through the Internet pleasant or unpleasant? Using a scale of 1-7, where 1 means unpleasant and 7 means pleasant. [CHECK ONE] Unpleasant
Pleasant
1 2 3 4 5 6 7 23. Overall, how satisfied or dissatisfied are you with shopping in the Internet? Using a scale of 1-7, where 1 means not very at all satisfied and 7 means very satisfied. [CHECK ONE]
Very Dissatisfied
Neither Satisfied nor Dissatisfied
Very Satisfied
1 2 3 4 5 6 7 24. How often, if ever, do you PURCHASE (and not just look for information) online? [CHECK ONE RESPONSE FOR EACH ITEM] Never Seldom Sometimes Often Very Oftena. Clothing / Accessories. 1 2 3 4 5 b. Books / Magazines. 1 2 3 4 5 c. Travel. 1 2 3 4 5

Generalization Schwartz Social Values Scale 199
d. Health & Medical. 1 2 3 4 5 e. Financial Services. 1 2 3 4 5 f. Consumer electronics (TV, VCR, stereo, cellular phone)
1 2 3 4 5
g. Entertainment (compact disks, videos, concert tickets).
1 2 3 4 5
h. Computer hardware or software. 1 2 3 4 5 i. Food / Beverage / Groceries. 1 2 3 4 5 j. Home Appliances (refrigerator, dishwasher).
1 2 3 4 5
k. Other. 1 2 3 4 5 25. How much do you agree or disagree with the following statements about your reactions to online shopping for those particular products/services of interest to you personally? [CHECK ONE RESPONSE FOR EACH ITEM] Strongly
Disagree Disagree Neither
Agree Nor
Disagree
Agree Strongly Agree
a. My opinion on online shopping seems not to count with other people.
1 2 3 4 5
b. When I consider online shopping, I ask other people for advice.
1 2 3 4 5
c. In general, I am among the last in my circle of friends to visit a shopping website when it appears.
1 2 3 4 5
d. People that I know pick shopping sites based on what I have told them.
1 2 3 4 5
e. I don’t need to talk to others before I do online shopping. 1 2 3 4 5 f. If I heard that a new website was available for online shopping, I would be interested enough to visit it.
1 2 3 4 5
g. When they choose to do online shopping, other people do not turn to me for advice.
1 2 3 4 5
h. I rarely ask other people what online websites to shop. 1 2 3 4 5 i. Compared to my friends, I have visited few online shopping websites.
1 2 3 4 5
j. I often persuade people to try the online shopping websites that I look at.
1 2 3 4 5
k. I like to get other’s opinions before I shop at an online site.
1 2 3 4 5
l. I will visit an online shopping website even if I know practically nothing about it.
1 2 3 4 5
m. I often influence people’s opinions about online shopping.
1 2 3 4 5
n. I feel more comfortable shopping at an online website after I have gotten other people’s opinions on it.
1 2 3 4 5
o. I know the names of new online shopping sites before other people do.
1 2 3 4 5
p. Other people rarely come to me for advice about using an online shopping site.
1 2 3 4 5
q. When choosing an online shopping site, other people’s opinions are not important to me.
1 2 3 4 5

Generalization Schwartz Social Values Scale 200
r. Usually, my friends know the name of a new shopping website before I do.
1 2 3 4 5
26. How much do you agree or disagree about the following statements with regard to yourself? [CHECK ONE RESPONSE FOR EACH ITEM] Strongly
Disagree Disagree Neither
Agree nor
Disagree
Agree Strongly Agree
a. I am suspicious of new inventions and ways of thinking
1 2 3 4 5
b. I am reluctant about adopting new ways of doing things until I see them working for people around me
1 2 3 4 5
c. I rarely trust new ideas until I can see whether the vast majority of people around me accept them
1 2 3 4 5
d. I am generally cautious about accepting new ideas 1 2 3 4 5 e. I must see other people using new innovations before I will consider them
1 2 3 4 5
f. I often find my self skeptical of new ideas 1 2 3 4 5 g. I am aware that I am usually one of the last people in my group to accept something new
1 2 3 4 5
h. I tend to feel that the traditional way of living and doing things is the best way
1 2 3 4 5
i. I consider myself to be creative and original in my thinking and behavior
1 2 3 4 5
j. I am an inventive kind of person 1 2 3 4 5 k. I seek out new ways to do things 1 2 3 4 5 l. I enjoy trying out new things 1 2 3 4 5 m. I am challenged by ambiguities and unsolved problems
1 2 3 4 5
n. I find it stimulating to be original in my thinking and behavior.
1 2 3 4 5
o. I am receptive to new ideas 1 2 3 4 5 p. I frequently improvise methods for solving a problem when an answer is not apparent
1 2 3 4 5
q. I fell that I am an influential member of my peer group
1 2 3 4 5
r. My peers often ask me for advice or information 1 2 3 4 5
ATTITUDES AND OPINIONS
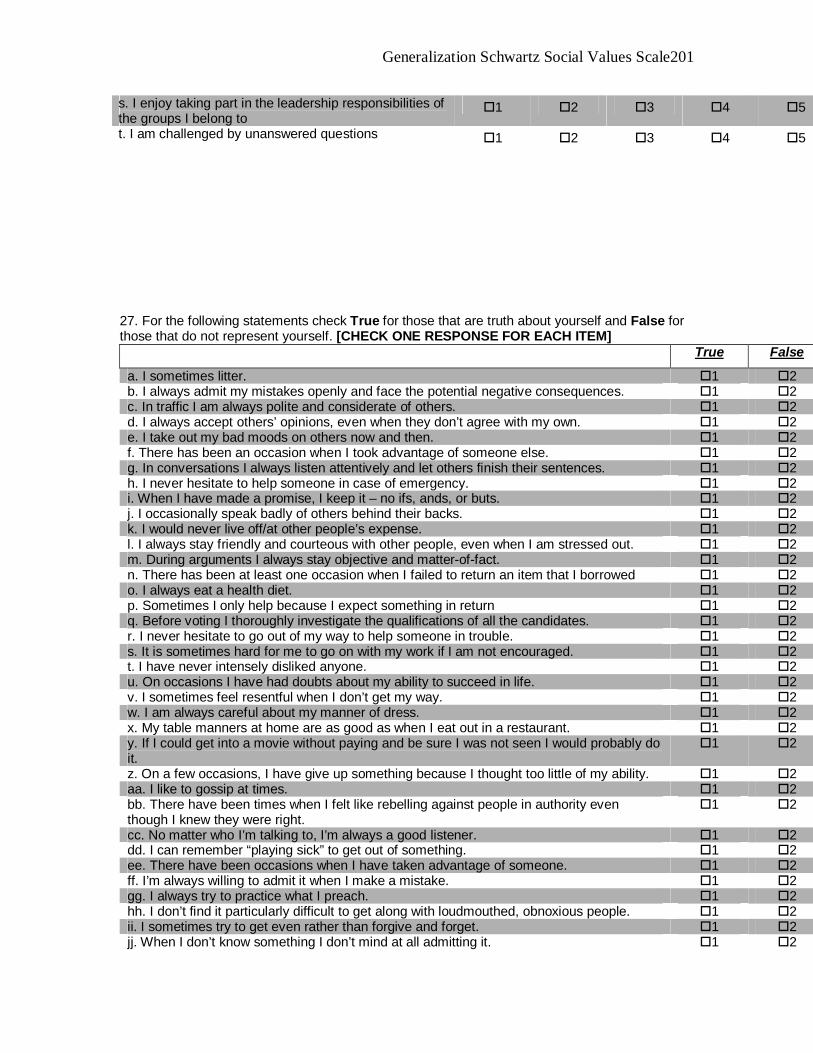
Generalization Schwartz Social Values Scale 201
s. I enjoy taking part in the leadership responsibilities of the groups I belong to
1 2 3 4 5
t. I am challenged by unanswered questions 1 2 3 4 5 27. For the following statements check True for those that are truth about yourself and False for those that do not represent yourself. [CHECK ONE RESPONSE FOR EACH ITEM]
True False
a. I sometimes litter. 1 2 b. I always admit my mistakes openly and face the potential negative consequences. 1 2 c. In traffic I am always polite and considerate of others. 1 2 d. I always accept others’ opinions, even when they don’t agree with my own. 1 2 e. I take out my bad moods on others now and then. 1 2 f. There has been an occasion when I took advantage of someone else. 1 2 g. In conversations I always listen attentively and let others finish their sentences. 1 2 h. I never hesitate to help someone in case of emergency. 1 2 i. When I have made a promise, I keep it – no ifs, ands, or buts. 1 2 j. I occasionally speak badly of others behind their backs. 1 2 k. I would never live off/at other people’s expense. 1 2 l. I always stay friendly and courteous with other people, even when I am stressed out. 1 2 m. During arguments I always stay objective and matter-of-fact. 1 2 n. There has been at least one occasion when I failed to return an item that I borrowed 1 2 o. I always eat a health diet. 1 2 p. Sometimes I only help because I expect something in return 1 2 q. Before voting I thoroughly investigate the qualifications of all the candidates. 1 2 r. I never hesitate to go out of my way to help someone in trouble. 1 2 s. It is sometimes hard for me to go on with my work if I am not encouraged. 1 2 t. I have never intensely disliked anyone. 1 2 u. On occasions I have had doubts about my ability to succeed in life. 1 2 v. I sometimes feel resentful when I don’t get my way. 1 2 w. I am always careful about my manner of dress. 1 2 x. My table manners at home are as good as when I eat out in a restaurant. 1 2 y. If I could get into a movie without paying and be sure I was not seen I would probably do it.
1 2
z. On a few occasions, I have give up something because I thought too little of my ability. 1 2 aa. I like to gossip at times. 1 2 bb. There have been times when I felt like rebelling against people in authority even though I knew they were right.
1 2
cc. No matter who I’m talking to, I’m always a good listener. 1 2 dd. I can remember “playing sick” to get out of something. 1 2 ee. There have been occasions when I have taken advantage of someone. 1 2 ff. I’m always willing to admit it when I make a mistake. 1 2 gg. I always try to practice what I preach. 1 2 hh. I don’t find it particularly difficult to get along with loudmouthed, obnoxious people. 1 2 ii. I sometimes try to get even rather than forgive and forget. 1 2 jj. When I don’t know something I don’t mind at all admitting it. 1 2
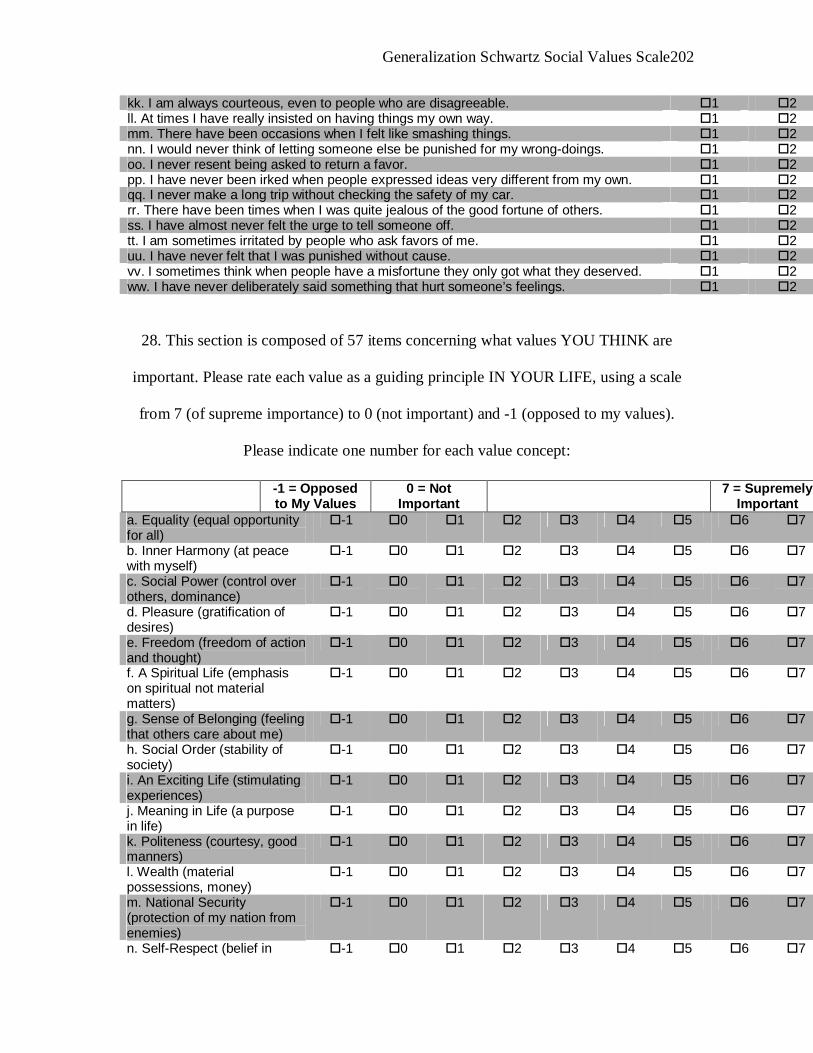
Generalization Schwartz Social Values Scale 202
kk. I am always courteous, even to people who are disagreeable. 1 2 ll. At times I have really insisted on having things my own way. 1 2 mm. There have been occasions when I felt like smashing things. 1 2 nn. I would never think of letting someone else be punished for my wrong-doings. 1 2 oo. I never resent being asked to return a favor. 1 2 pp. I have never been irked when people expressed ideas very different from my own. 1 2 qq. I never make a long trip without checking the safety of my car. 1 2 rr. There have been times when I was quite jealous of the good fortune of others. 1 2 ss. I have almost never felt the urge to tell someone off. 1 2 tt. I am sometimes irritated by people who ask favors of me. 1 2 uu. I have never felt that I was punished without cause. 1 2 vv. I sometimes think when people have a misfortune they only got what they deserved. 1 2 ww. I have never deliberately said something that hurt someone’s feelings. 1 2
28. This section is composed of 57 items concerning what values YOU THINK are
important. Please rate each value as a guiding principle IN YOUR LIFE, using a scale
from 7 (of supreme importance) to 0 (not important) and -1 (opposed to my values).
Please indicate one number for each value concept:
a. Equality (equal opportunity for all)
-1 0 1 2 3 4 5 6 7
b. Inner Harmony (at peace with myself)
-1 0 1 2 3 4 5 6 7
c. Social Power (control over others, dominance)
-1 0 1 2 3 4 5 6 7
d. Pleasure (gratification of desires)
-1 0 1 2 3 4 5 6 7
e. Freedom (freedom of action and thought)
-1 0 1 2 3 4 5 6 7
f. A Spiritual Life (emphasis on spiritual not material matters)
-1 0 1 2 3 4 5 6 7
g. Sense of Belonging (feeling that others care about me)
-1 0 1 2 3 4 5 6 7
h. Social Order (stability of society)
-1 0 1 2 3 4 5 6 7
i. An Exciting Life (stimulating experiences)
-1 0 1 2 3 4 5 6 7
j. Meaning in Life (a purpose in life)
-1 0 1 2 3 4 5 6 7
k. Politeness (courtesy, good manners)
-1 0 1 2 3 4 5 6 7
l. Wealth (material possessions, money)
-1 0 1 2 3 4 5 6 7
m. National Security (protection of my nation from enemies)
-1 0 1 2 3 4 5 6 7
n. Self-Respect (belief in -1 0 1 2 3 4 5 6 7
-1 = Opposed to My Values
0 = Not Important
7 = Supremely Important

Generalization Schwartz Social Values Scale 203
one’s own worth) o. Reciprocation of Favors (avoidance of indebtedness)
-1 0 1 2 3 4 5 6 7
p. Creativity (uniqueness, imagination)
-1 0 1 2 3 4 5 6 7
q. A World at Peace (free of war and conflict)
-1 0 1 2 3 4 5 6 7
r. Respect for Tradition (preservation of time-honored customs)
-1 0 1 2 3 4 5 6 7
s. Mature Love (deep emotional and spiritual intimacy)
-1 0 1 2 3 4 5 6 7
t. Self-Discipline (self-
restraint, resistance to
temptation)
-1 0 1 2 3 4 5 6 7
u. Privacy (the right to have a private sphere)
-1 0 1 2 3 4 5 6 7
v. Family Security (safety for loved ones)
-1 0 1 2 3 4 5 6 7
w. Social Recognition (respect, approval by others)
-1 0 1 2 3 4 5 6 7
x. Unity with Nature (fitting into nature)
-1 0 1 2 3 4 5 6 7
y. A Varied Life (filled with challenge, novelty, and change)
-1 0 1 2 3 4 5 6 7
z. Wisdom (a mature understanding of life)
-1 0 1 2 3 4 5 6 7
aa. Authority (the right to lead or command)
-1 0 1 2 3 4 5 6 7
bb. True Friendship (close, supportive friends)
-1 0 1 2 3 4 5 6 7
cc. A World of Beauty (beauty of nature and the arts)
-1 0 1 2 3 4 5 6 7
dd. Social Justice (correcting injustice, care for the weak)
-1 0 1 2 3 4 5 6 7
ee. Independent (self-reliant, self-sufficient)
-1 0 1 2 3 4 5 6 7
ff. Moderate (avoiding extremes of feeling and action)
-1 0 1 2 3 4 5 6 7
-1 = Opposed to My Values
0 = Not Important
7 = Supremely Important
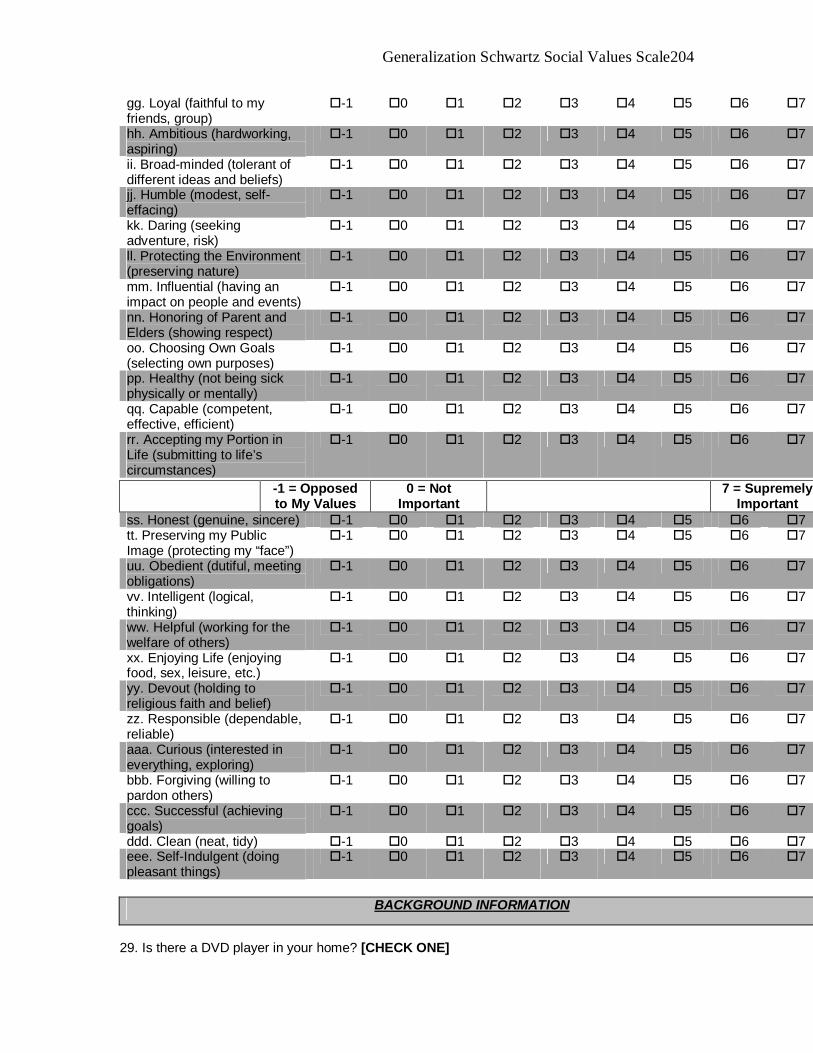
Generalization Schwartz Social Values Scale 204
gg. Loyal (faithful to my friends, group)
-1 0 1 2 3 4 5 6 7
hh. Ambitious (hardworking, aspiring)
-1 0 1 2 3 4 5 6 7
ii. Broad-minded (tolerant of different ideas and beliefs)
-1 0 1 2 3 4 5 6 7
jj. Humble (modest, self-effacing)
-1 0 1 2 3 4 5 6 7
kk. Daring (seeking adventure, risk)
-1 0 1 2 3 4 5 6 7
ll. Protecting the Environment (preserving nature)
-1 0 1 2 3 4 5 6 7
mm. Influential (having an impact on people and events)
-1 0 1 2 3 4 5 6 7
nn. Honoring of Parent and Elders (showing respect)
-1 0 1 2 3 4 5 6 7
oo. Choosing Own Goals (selecting own purposes)
-1 0 1 2 3 4 5 6 7
pp. Healthy (not being sick physically or mentally)
-1 0 1 2 3 4 5 6 7
qq. Capable (competent, effective, efficient)
-1 0 1 2 3 4 5 6 7
rr. Accepting my Portion in Life (submitting to life’s circumstances)
-1 0 1 2 3 4 5 6 7
ss. Honest (genuine, sincere) -1 0 1 2 3 4 5 6 7 tt. Preserving my Public Image (protecting my “face”)
-1 0 1 2 3 4 5 6 7
uu. Obedient (dutiful, meeting obligations)
-1 0 1 2 3 4 5 6 7
vv. Intelligent (logical, thinking)
-1 0 1 2 3 4 5 6 7
ww. Helpful (working for the welfare of others)
-1 0 1 2 3 4 5 6 7
xx. Enjoying Life (enjoying food, sex, leisure, etc.)
-1 0 1 2 3 4 5 6 7
yy. Devout (holding to religious faith and belief)
-1 0 1 2 3 4 5 6 7
zz. Responsible (dependable, reliable)
-1 0 1 2 3 4 5 6 7
aaa. Curious (interested in everything, exploring)
-1 0 1 2 3 4 5 6 7
bbb. Forgiving (willing to pardon others)
-1 0 1 2 3 4 5 6 7
ccc. Successful (achieving goals)
-1 0 1 2 3 4 5 6 7
ddd. Clean (neat, tidy) -1 0 1 2 3 4 5 6 7 eee. Self-Indulgent (doing pleasant things)
-1 0 1 2 3 4 5 6 7
29. Is there a DVD player in your home? [CHECK ONE]
-1 = Opposed to My Values
0 = Not Important
7 = Supremely Important
BACKGROUND INFORMATION

Generalization Schwartz Social Values Scale 205
1 Yes 2 No 30. Is there a Digital TV in your home? [CHECK ONE] 1 Yes 2 No 31. Do you own a PDA (Personal Digital Assistant)? [CHECK ONE] 1 Yes 2 No 32. Do you have any major credit cards in your name (e.g., American Express, Diners Club, MasterCard)? [CHECK ONE] 1 Yes 2 No 33. Were you born within the Poland? [CHECK ONE] 1 Yes 2 No 34. Were your parents born in Poland [CHECK ONE] 1 Neither 2 My mother 3 My father 4 Both 35. Were your grandparents born in Poland? [CHECK ONE]
1 Yes, all four of them 2 Yes, 1, 2, or 3 of them 3 None of them 4 Don’t know
36. Where is your permanent address at this time? [CHECK ONE]
1 Warsaw 2 Within the Mazowieckie Vovoidship 3 Outside of the Mazowieckie Vovoidship
37. How many people live in your household, including yourself? ______ 38. How many of the people in your household are 17 years old or younger? ______ 39. How old are you? ______ 40. What is your gender? 1 Male 2 Female 41. What is your marital status? [CHECK ONE] 1 Single, never been married 2 Married

Generalization Schwartz Social Values Scale 206
3 Separated, Divorced, or Widowed 42. What was the last year of education you completed? [CHECK ONE] 1 Some high school 2 High school 3 Technical School/Training (such as auto mechanic) 4 Some College/University 5 College/University Graduate 6 Graduate or professional school 43. What is your religious affiliation? [CHECK ONE] 1 Roman Catholic 2 Protestant 3 Russian Orthodox 4 Other Christian 5 Agnostic 6 Atheist 7 None 8 Other (please specify) __________________ 44. What is your current employment? [CHECK ALL THAT APPLY] 1 Employed – Full Time [GO TO Q45] 2 Employed – Part Time [GO TO Q45] 3 Temporarily Unemployed [GO TO Q45] 4 Self-Employed [GO TO Q45] 5 Student [GO TO Q46] 6 Homemaker/Housewife [GO TO Q46] 7 Retired [GO TO Q46] 45. [IF EMPLOYED] What is your occupation? [CHECK ONE] 1 Professional [CONTINUE TO Q46] 2 Managerial/Executive [CONTINUE TO Q46] 3 Sales [CONTINUE TO Q46] 4 Clerical [CONTINUE TO Q46] 5 Labor with Technical Training [CONTINUE TO Q46] 6 Labor without Technical Training [CONTINUE TO Q46] 46. Please indicate which of the following categories best represents your monthly household income before taxes? [CHECK ONE] 1 0 - 500 zlotny 2 500 - 1000 zl 3 1001 - 1500 zl
4 1501 - 1750 zl 5 1751 - 2000 zl 6 2001 - 2250 zl 7 2251 - 2500 zl 8 2501 - 2750 zl 9 2751 - 3000 zl 10 3001 - 3250 zl 11 3251 - 3500 zl 12 3501 - 4000 zl

Generalization Schwartz Social Values Scale 207
13 4001 - 4500 zl 14 4501 or more per month

Generalization Schwartz Social Values Scale 208