general genetic bio 221 lab 6. law of independent assortment (the "second law") the law of...
TRANSCRIPT

General Genetic General Genetic
Bio 221 Lab 6Bio 221 Lab 6

Law of Independent Assortment (The "Second Law")
The Law of Independent Assortment, also known as "Inheritance Law", states that alleles of different genes assort and distribute independently of one another , during gamete formation.
Mendel’s Second Law
http://www.springer.com/cda/content/document/cda_downloaddocument/1002s.swf?SGWID=0-0-45-753210-0
Mendel’s Law animation:
http://www.sumanasinc.com/webcontent/animations/content/independentassortment.html
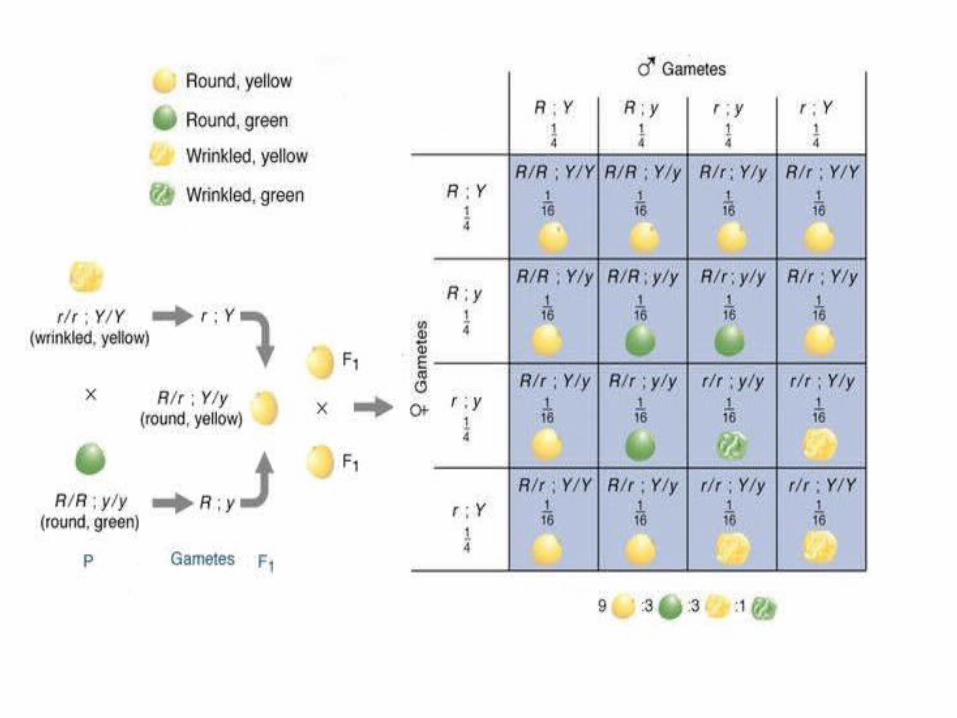
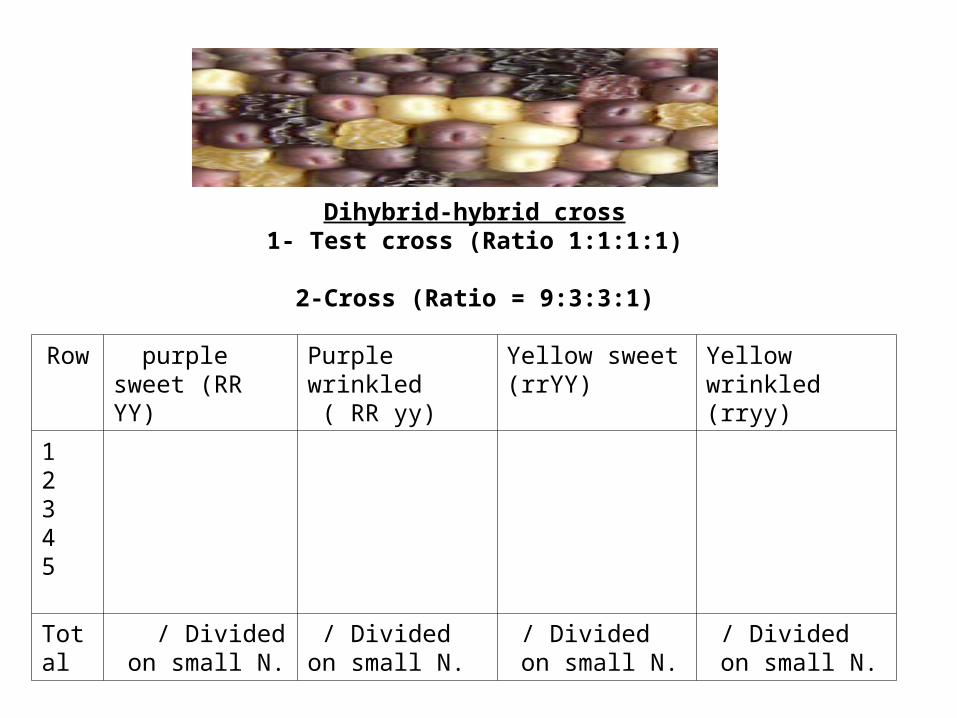
Dihybrid-hybrid cross1- Test cross (Ratio 1:1:1:1)
2-Cross (Ratio = 9:3:3:1)
Row purplesweet (RR YY)
Purple wrinkled ( RR yy)
Yellow sweet (rrYY)
Yellow wrinkled (rryy)
12345
Total
/ Divided on small N.
/ Divided on small N.
/ Divided on small N.
/ Divided on small N.
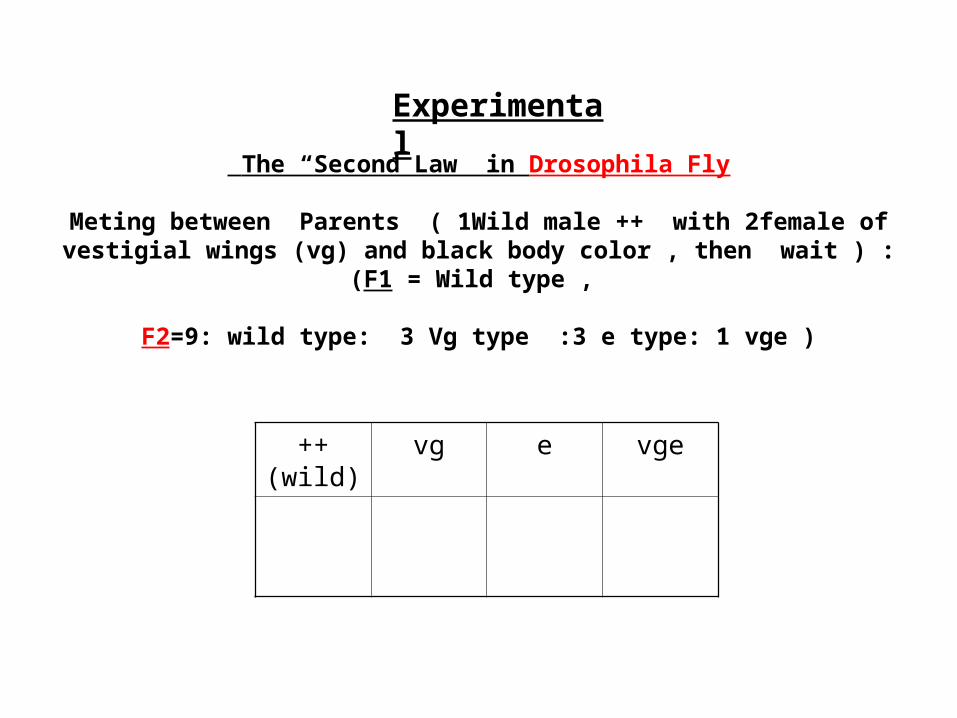
Experimental
The “Second Law in Drosophila Fly
Meting between Parents ( 1Wild male ++ with 2female of vestigial wings (vg) and black body color , then wait ) :
(F1 = Wild type ,
F2=9: wild type: 3 Vg type :3 e type: 1 vge )
++(wild) vg e vge

CHI SQUARE TEST(X2) 1- The chi square test:
• Chi-square (X2) is a statistical test commonly used to compare observed data with data we would expect to obtain according to a specific hypothesis.
• The chi-square test is always testing what scientists call the null hypothesis, which states that there is no significant difference between the expected and observed result.
or the difference between your observed result and expected is probably due to random chance.
2- Determining the chi-square value H0 :( Null hypothesis) There is no significant difference between observed and expected H1 :(Alternative hypothesis ) There is a significant difference .
3- Degrees of Freedom (df)• Is a measure of how many values can vary in a final statistical calculation. • It calculates as= the number of categories – 1• EX: there are 2 classes of offspring : Purple and white .Thus, degrees of freedom = 2-1
=1 .4- Chi square formula:

• Step-by-Step Procedure for Testing Your Hypothesis and Calculating Chi-Square:
1. State the hypothesis being tested and the predicted results.
2- Calculate X2 using the formula. Complete all calculations to three significant digits.
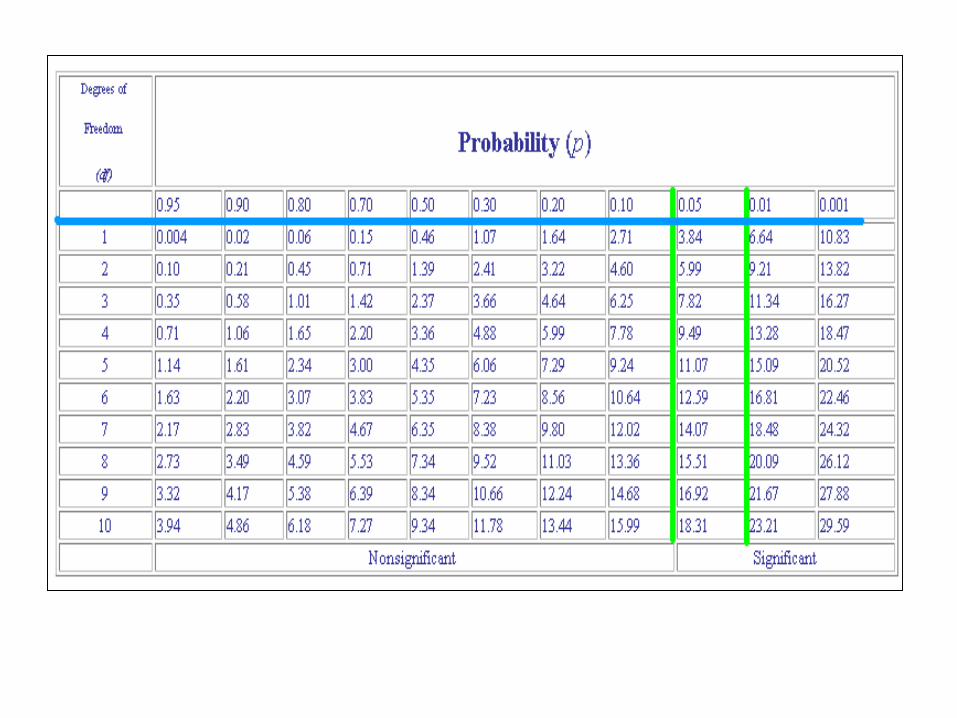
3- Use the chi-square distribution table to determine significance of the value.
4- Determine degrees of freedom and locate the value in the appropriate column.
5- Locate the value closest to your calculated X2 on that degrees of freedom df row.
6- Move up the column to determine the p value.
7- State your conclusion in terms of your hypothesis.
• If the p value for the calculated X2 s p > 0.05, accept your hypothesis. 'The deviation is small enough that chance alone accounts for it. A p value of 0.6, for example, means that there is a 60% probability that any deviation from expected is due to chance only.
• If the p value for the calculated X2 is p < 0.05, reject your hypothesis, and conclude that some factor other than chance is operating for the deviation to be so great. For example, a p value of 0.01 means that there is only a 1% chance that this deviation is due to chance alone. Therefore, other factors must be involved.

Mono-hybrid cross in corn
1- Test cross (Ratio= 1:1)
2-Cross (Ratio =3:1 )
Row Black (Purple )
(RR)
Yellow (rr)
12345
Total / Divided by small N.
/ Divided on small N.
Obs. N.
1- RR
2- rr
Note: 95/ 33=333/33=1
Chi-square calculation

• Breeding between Parent
( 1Wild male ++ with 2vestagial wings female)
F1 = Wild type ,
F2= 3 wild type : 1 Vg type
++ vg
Total
Obs. N.
1- ++
2- vg
Chi-square calculation
Apply X2 on first law of Drosophila fly
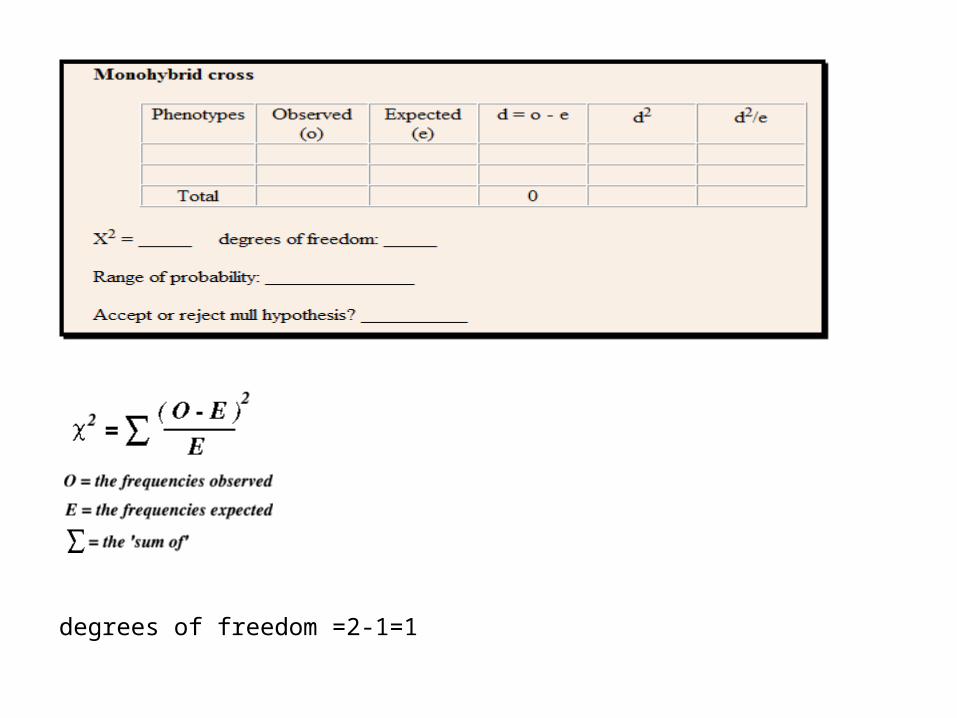
degrees of freedom =2-1=1
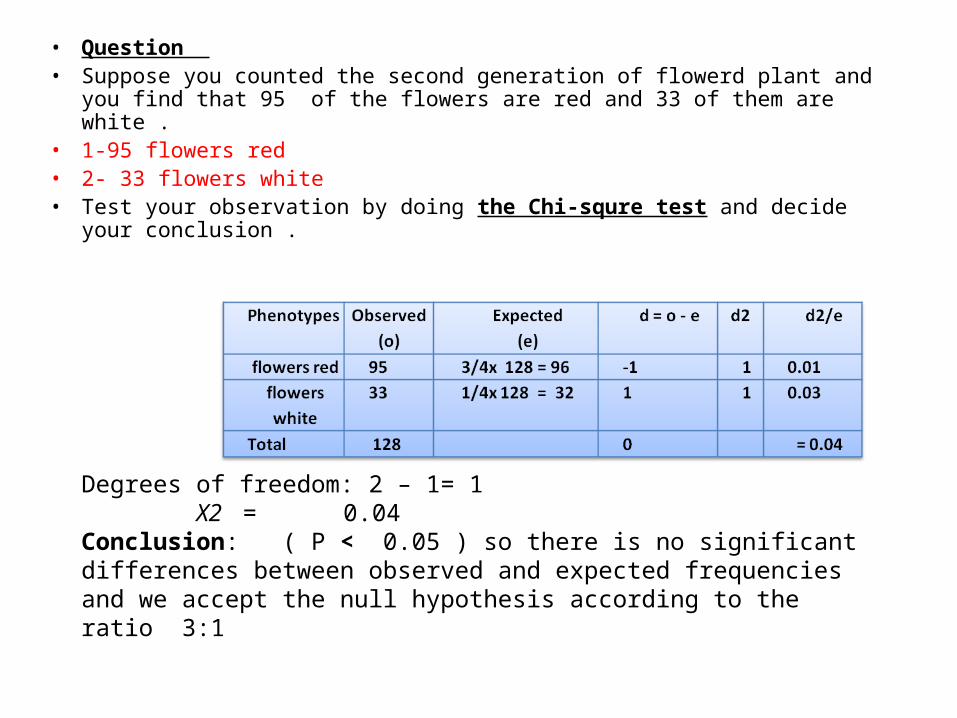
• Question • Suppose you counted the second generation of flowerd plant and you find
that 95 of the flowers are red and 33 of them are white . • 1-95 flowers red• 2- 33 flowers white • Test your observation by doing the Chi-squre test and decide your
conclusion .
Degrees of freedom: 2 – 1= 1 X2 = 0.04Conclusion: ( P < 0.05 ) so there is no significant differences between observed and expected frequencies and we accept the null hypothesis according to the ratio 3:1
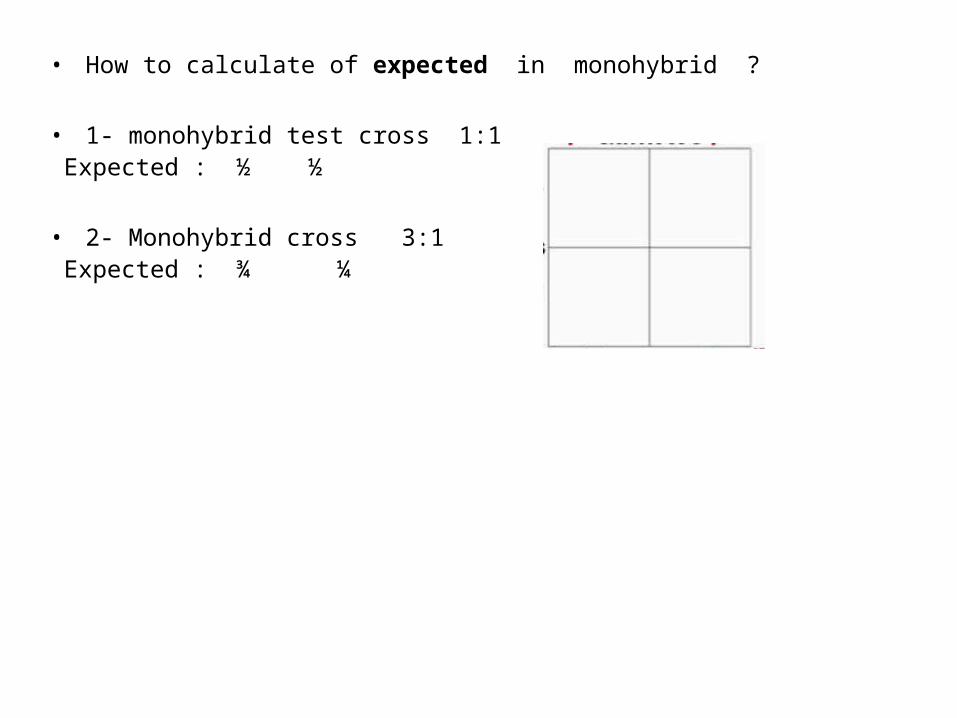
• How to calculate of expected in monohybrid ?
• 1- monohybrid test cross 1:1 Expected : ½ ½
• 2- Monohybrid cross 3:1 Expected : ¾ ¼
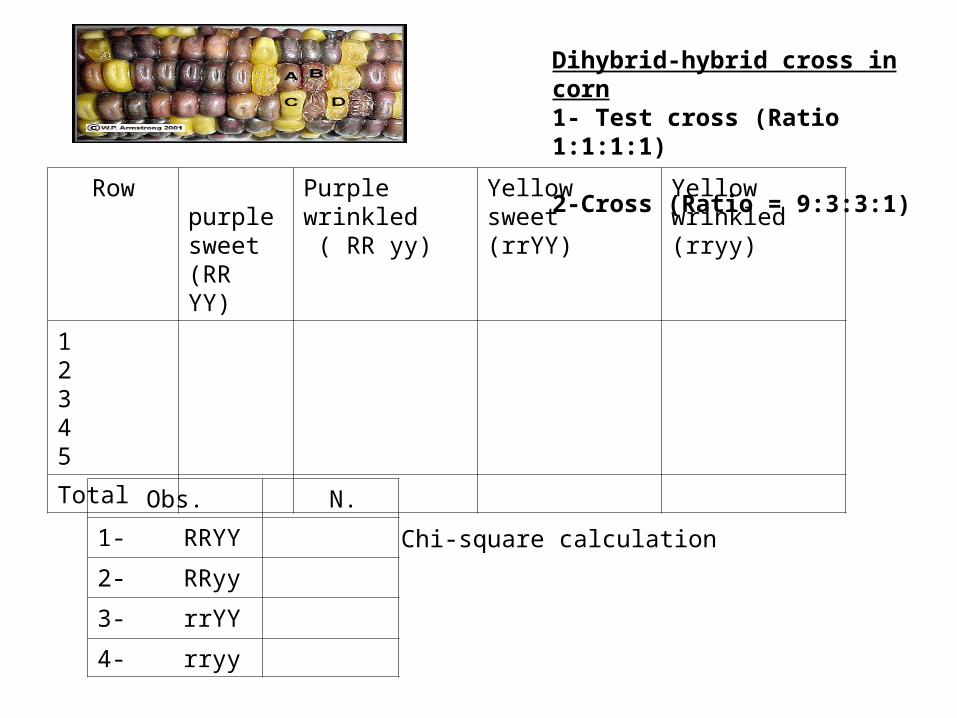
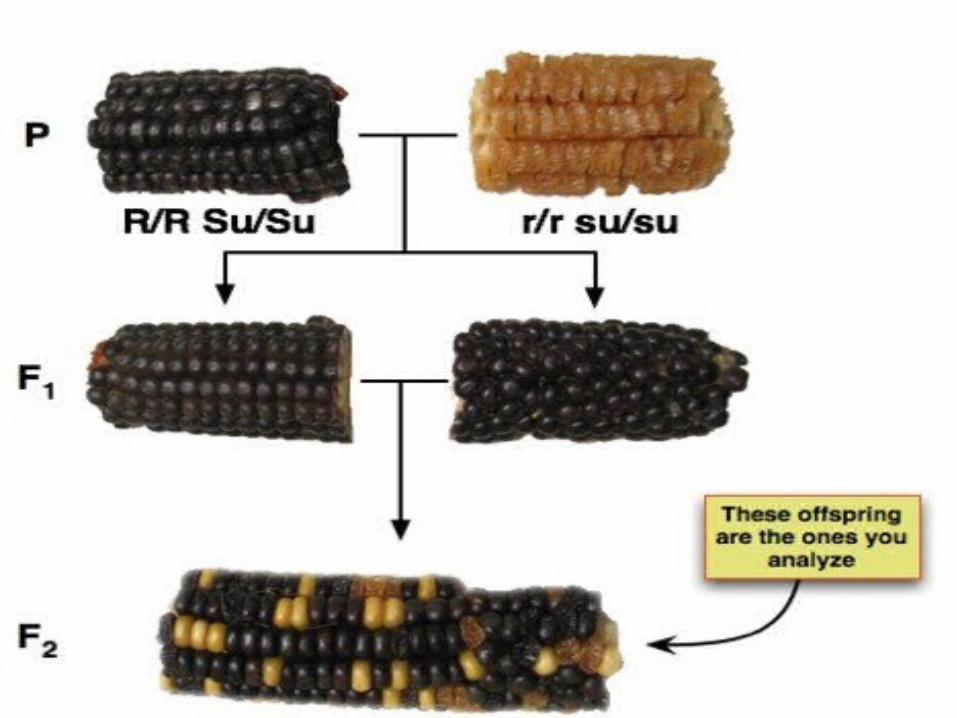
Dihybrid-hybrid cross in corn1- Test cross (Ratio 1:1:1:1)
2-Cross (Ratio = 9:3:3:1)
Row purplesweet (RR YY)
Purple wrinkled ( RR yy)
Yellow sweet (rrYY)
Yellow wrinkled (rryy)
12345
Total
Obs. N.
1- RRYY
2- RRyy
3- rrYY
4- rryy
Chi-square calculation

• How to calculate of expected in Dihybrid ?
• 1- Dihybrid test cross 1:1 :1:1 • Expected : ¼ ¼ ¼ ¼
• 2- Dihybrid cross 9:3:3:1• Expected : 9/16 3/16 3/16 1/16

• Breeding between Parent
( 1Wild male ++ with 2vestagial wings female for )
(F1 = Wild type , F2= 9 ,3 ,3 , 1)
Apply chi square test on the “Second Law in Drosophila Fly
Obs. N.
1- ++
2- e
3- vg
4- vg-e
Chi-square calculation

degrees of freedom=4-1=3
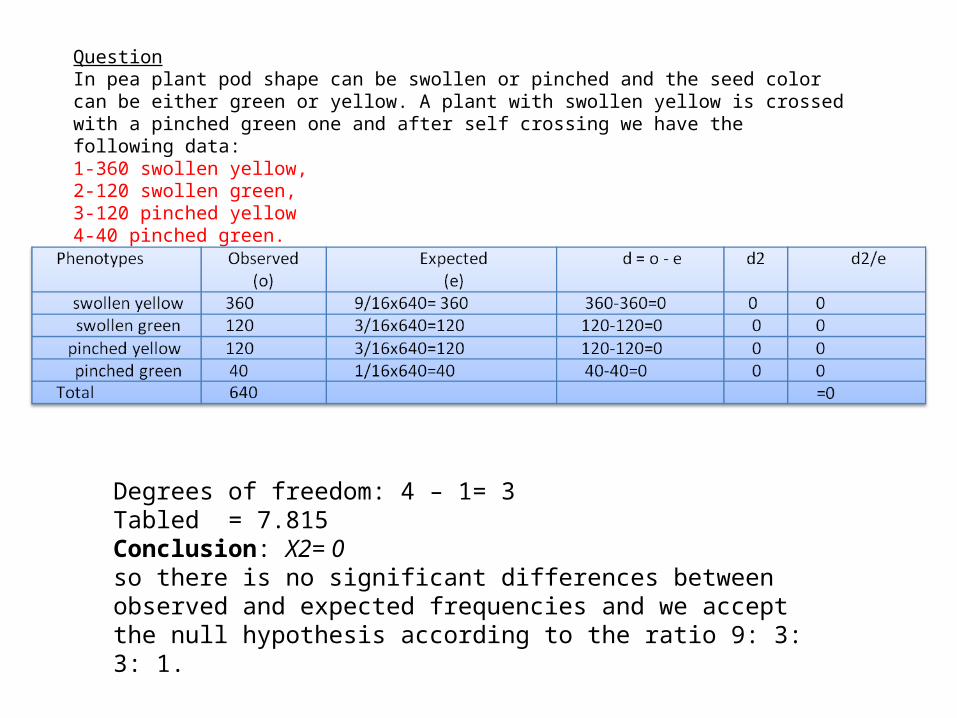
QuestionIn pea plant pod shape can be swollen or pinched and the seed color can be either green or yellow. A plant with swollen yellow is crossed with a pinched green one and after self crossing we have the following data: 1-360 swollen yellow, 2-120 swollen green, 3-120 pinched yellow 4-40 pinched green. Test the observation by doing the Chi-square test and decide your conclusion.
Degrees of freedom: 4 – 1= 3 Tabled = 7.815 Conclusion: X2= 0so there is no significant differences between observed and expected frequencies and we accept the null hypothesis according to the ratio 9: 3: 3: 1.
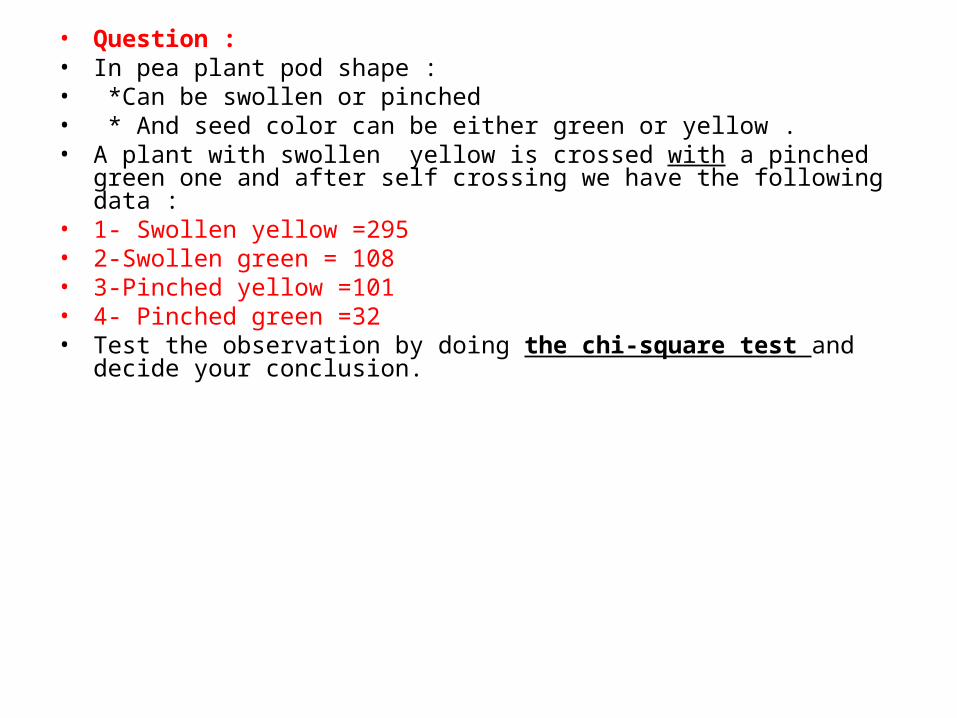
• Question : • In pea plant pod shape : • *Can be swollen or pinched • * And seed color can be either green or yellow . • A plant with swollen yellow is crossed with a pinched green one and after
self crossing we have the following data :• 1- Swollen yellow =295• 2-Swollen green = 108• 3-Pinched yellow =101• 4- Pinched green =32• Test the observation by doing the chi-square test and decide your
conclusion.