general expenditure policy spending reviews in the uk richard hughes hm treasury 29 march 2007
TRANSCRIPT

General expenditure policy
Spending Reviews in the UK
Richard HughesHM Treasury
29 March 2007
General expenditure policy 2
Spending Reviews in the UK: Outline
1. Key Features of UK Spending Reviews
2. Some Recent Innovations in CSR07
3. Lessons from UK Experience for Italy
General expenditure policy 3
1. Key Features of UK Spending Reviews
a. Medium-term fiscal rules and top-down spending limits
b. Department-centred spending control
c. Fixed multi-annual Departmental budgets
d. Bottom-up Departmental bidding process
e. Outcome-focused performance management
General expenditure policy 4
Ia. Medium-term fiscal rules
Golden rule
Over the economic cycle, the Government will borrow only to
invest and not to fund current spending
Sustainable investment rule
Debt as a proportion of GDP will be held over the economic
cycle at a stable and prudent level (below 40% of GDP)
General expenditure policy 5
The Golden Rule and Current Spending
Current Receipts vs. Current Spending (% of GDP)
35%
36%
37%
38%
39%
40%
41%
% o
f GD
P
Current Receipts % of GDP
Current Spending % of GDP (RHS)
Current Receipts % of GDP
35%
36%
37%
38%
39%
40%
41%
% o
f GD
P
Current Receipts % of GDP
Current Spending
-1%
0%
1%
2%
3%
4%
5%
6%
Rea
l Gro
wth
%
33%
34%
35%
36%
37%
38%
39%
40%
% o
f GD
P
Current Spending real growth (LHS)
Current Spending % of GDP (RHS)
Surplus on the Current Budget
-2.0%
-1.5%
-1.0%
-0.5%
0.0%
0.5%
1.0%
1.5%
2.0%
2.5%
3.0%
% o
f GD
P
Average current surplus from 1997-98
Average current surplus from 2006-07
Current Surplus % of GDP
General expenditure policy 6
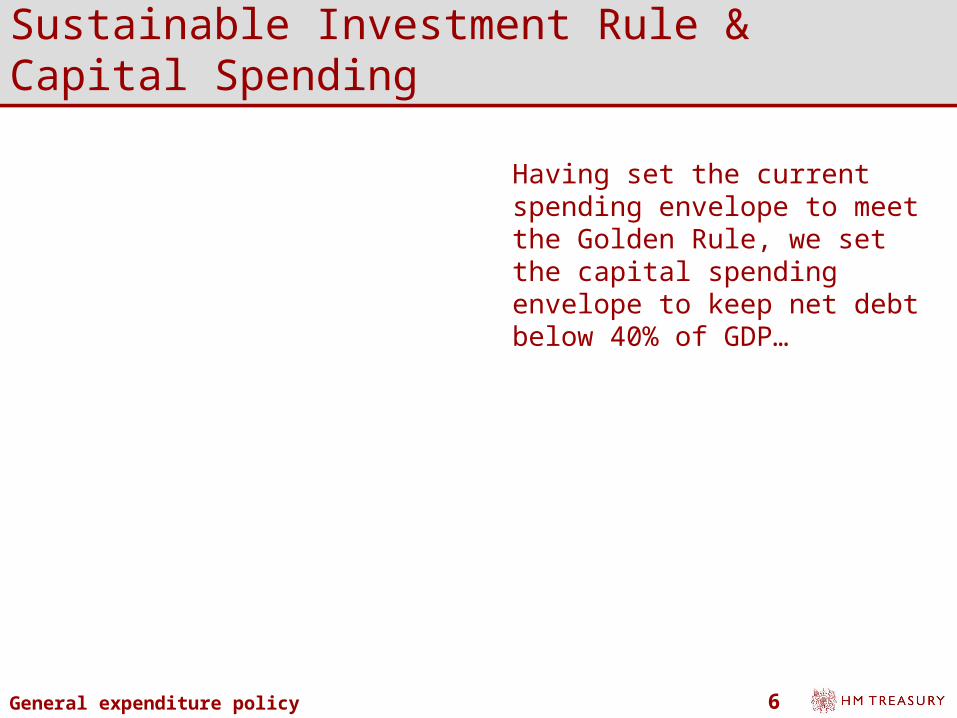
Sustainable Investment Rule & Capital Spending
Having set the current spending envelope to meet the Golden Rule, we set the capital spending envelope to keep net debt below 40% of GDP…
Capital Spending
40.85%
-10%
-5%
0%
5%
10%
15%
20%
Real
Gro
wth
%
-1.5%
-1.0%
-0.5%
0.0%
0.5%
1.0%
1.5%
2.0%
2.5%
3.0%
% o
f G
DP
Year-on-year real capital growth (LHS)
Net Investment as % of GDP (RHS)
Public Sector Net Debt as % of GDP
28%
30%
32%
34%
36%
38%
40%
42%
44%
46%
1996
-97
1997
-98
1998
-99
1999
-00
2000
-01
2001
-02
2002
-03
2003
-04
2004
-05
2005
-06
2006
-07
2007
-08
2008
-09
2009
-10
2010
-11
2011
-12
% o
f G
DP
…which implies a big slowdown in investment growth following a period of rapid “catch-up”

General expenditure policy 7
Ib. Department-centred spending control
Annually Managed Expenditure (AME)
• c.40% of total spending
• Volatile or demand-led expenditure
• Managed centrally on an annual basis
TransportDCLGLocal Govt
Home Office
Defence
Trade & Industry
Work & Pensions
Chx's Depts
Scot, Wales & NI
OtherReserve
International Development
Health
Education
BBC
Student loans
Pensions
Net EU payments
AME margin
Other
Public corps
Tax credits
Social security benefits
Debt interest
Non-cash items
Departmental Expenditure Limits (DEL)
• c. 60% of total spending
• 3-year fixed Departmental budgets
• End-year flexibility for underspends
Annually Managed Expenditure
Departmental Expenditure Limits
= £239bn
= £344bn

General expenditure policy 8
Ic. The Spending Review Cycle
July 04 plans set for
2004-05 2005-06 2006-07 2007-08 2008-09 2009-10 2010-11
Year 1 Year 2 Year 3
SR2004
Year 1 Year 2 Year 3
CSR 2007
Oct 07 plans set
for
General expenditure policy 9
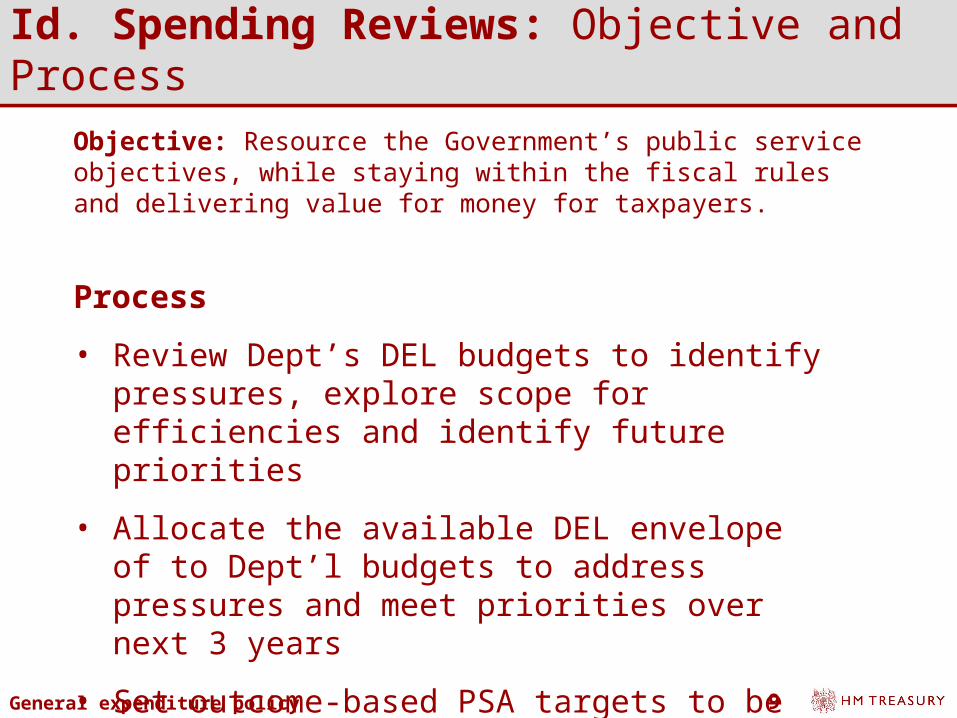
Id. Spending Reviews: Objective and Process
Objective: Resource the Government’s public service objectives, while staying within the fiscal rules and delivering value for money for taxpayers.
Process
• Review Dept’s DEL budgets to identify pressures, explore scope for efficiencies and identify future priorities
• Allocate the available DEL envelope of to Dept’l budgets to address pressures and meet priorities over next 3 years
• Set outcome-based PSA targets to be delivered with those budgets

General expenditure policy 10
SR Process: Inputs (3 months before SR day)
Departmental submissions• Baseline is cash budget in previous year on which
Dept identifies:– Existing pressures– Scope for efficiency gains/re-prioritisation– New priorities
• Updated objectives, outcome-based PSA target and reforms
• Highlight how responding to cross-government issues
Independent reviews• Wanless on health• Stern on climate change• Eddington on transport
General expenditure policy 11
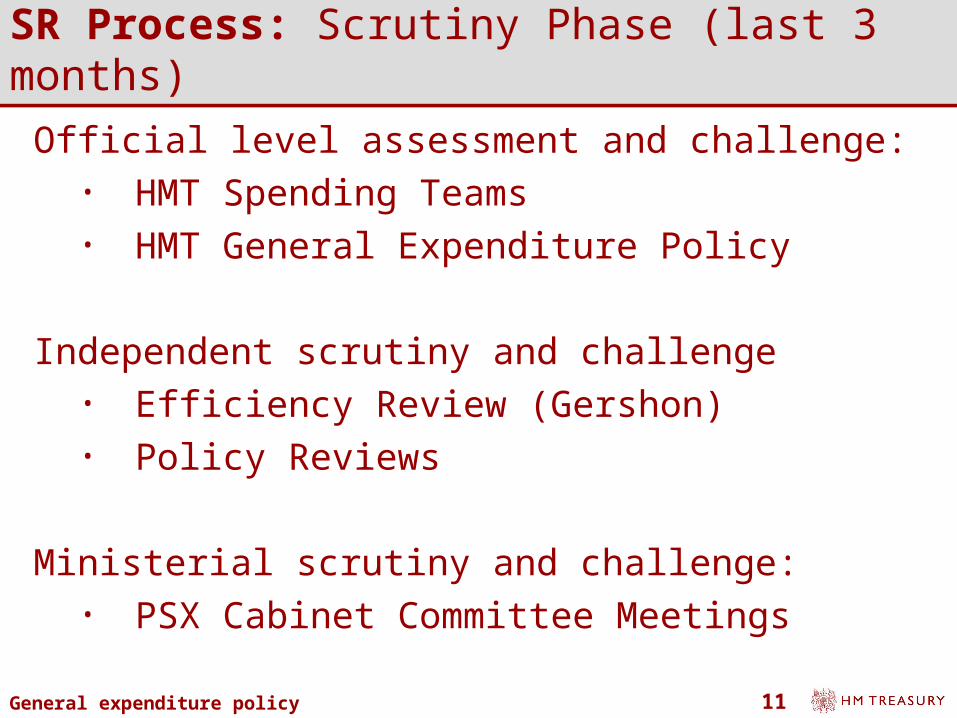
SR Process: Scrutiny Phase (last 3 months)
Official level assessment and challenge:• HMT Spending Teams• HMT General Expenditure Policy
Independent scrutiny and challenge• Efficiency Review (Gershon)• Policy Reviews
Ministerial scrutiny and challenge:• PSX Cabinet Committee Meetings
General expenditure policy 12
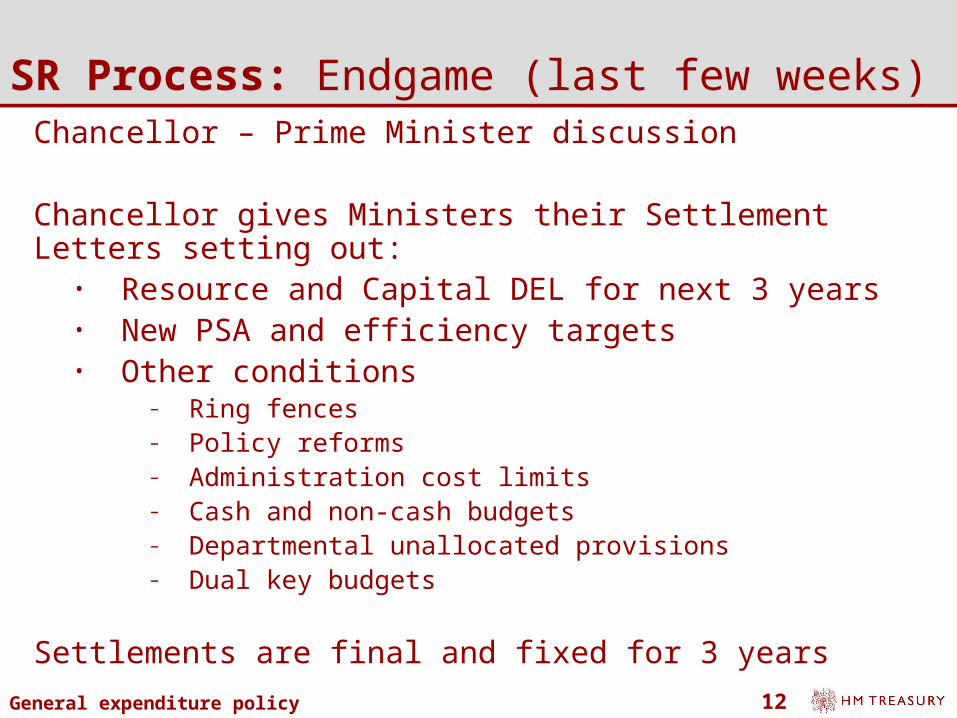
SR Process: Endgame (last few weeks)Chancellor – Prime Minister discussion
Chancellor gives Ministers their Settlement Letters setting out:
• Resource and Capital DEL for next 3 years• New PSA and efficiency targets• Other conditions
– Ring fences– Policy reforms– Administration cost limits– Cash and non-cash budgets– Departmental unallocated provisions– Dual key budgets
Settlements are final and fixed for 3 years
General expenditure policy 13
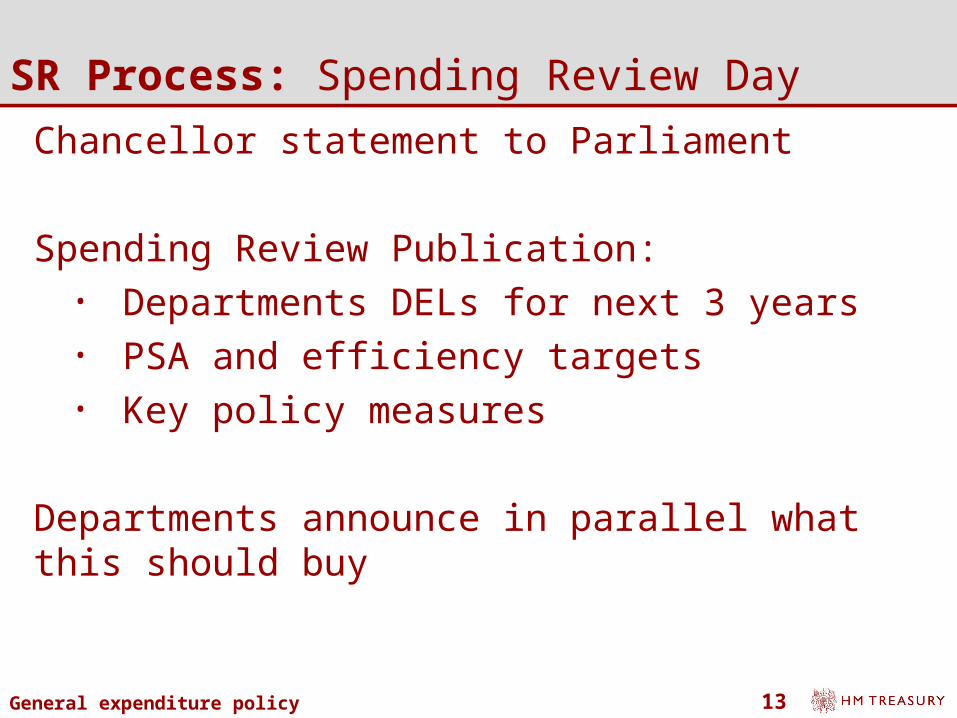
SR Process: Spending Review Day
Chancellor statement to Parliament
Spending Review Publication:• Departments DELs for next 3 years• PSA and efficiency targets• Key policy measures
Departments announce in parallel what this should buy
General expenditure policy 14
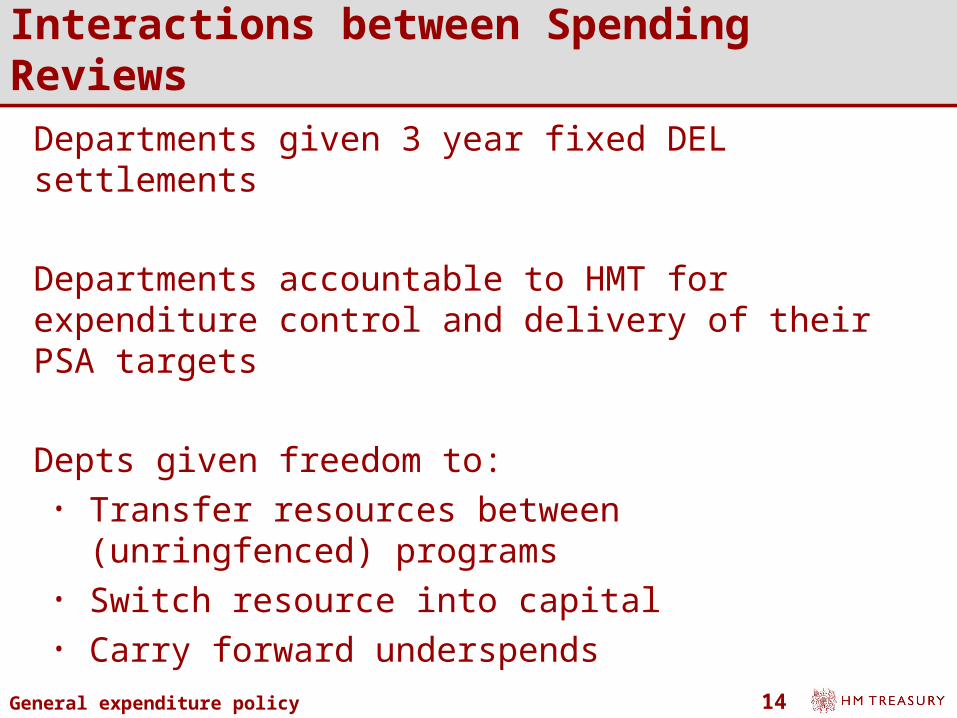
Interactions between Spending Reviews
Departments given 3 year fixed DEL settlements
Departments accountable to HMT for expenditure control and delivery of their PSA targets
Depts given freedom to:• Transfer resources between (unringfenced)
programs• Switch resource into capital• Carry forward underspends

General expenditure policy 15
Adjusting Department’s allocations b/w SRs
In practice some in-year adjustments in the form of claims on:
• DEL Reserve (w/ HMT approval) – £1 / 2 / 3bn• AME Margin (forecast revision) - £1 / 2 / 3bn
Depts have accumulated £8bn worth of EYF “entitlement.”
Some discretionary DEL and AME measures in Budgets and Pre-Budget Reports
Fiscal prudence to deal with major contingencies on expenditure and revenue side
General expenditure policy 16
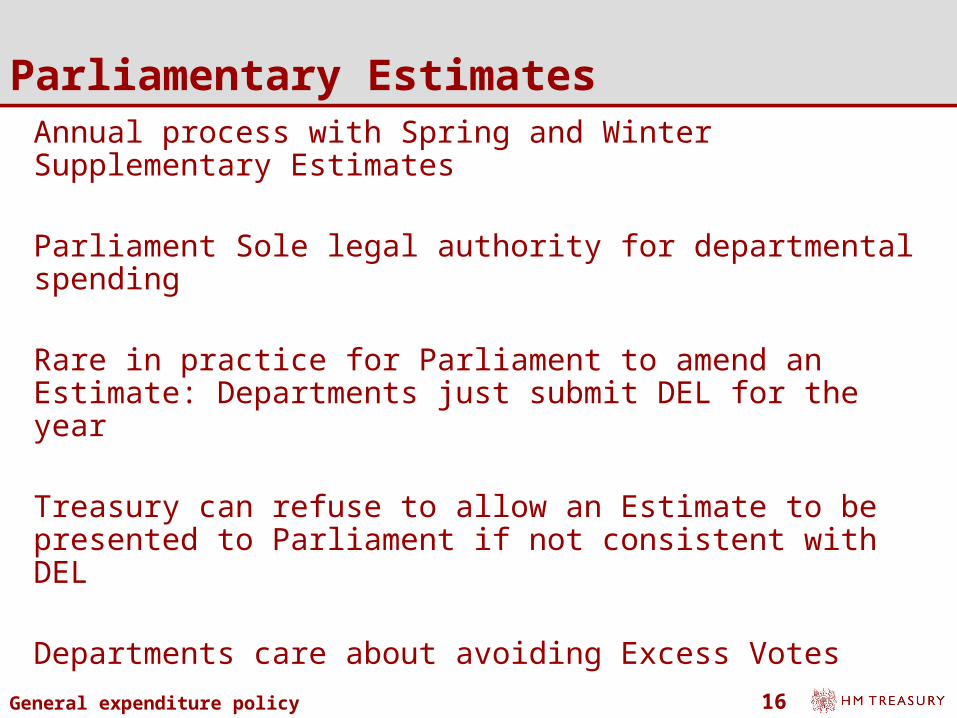
Parliamentary EstimatesAnnual process with Spring and Winter Supplementary Estimates
Parliament Sole legal authority for departmental spending
Rare in practice for Parliament to amend an Estimate: Departments just submit DEL for the year
Treasury can refuse to allow an Estimate to be presented to Parliament if not consistent with DEL
Departments care about avoiding Excess Votes
General expenditure policy 17
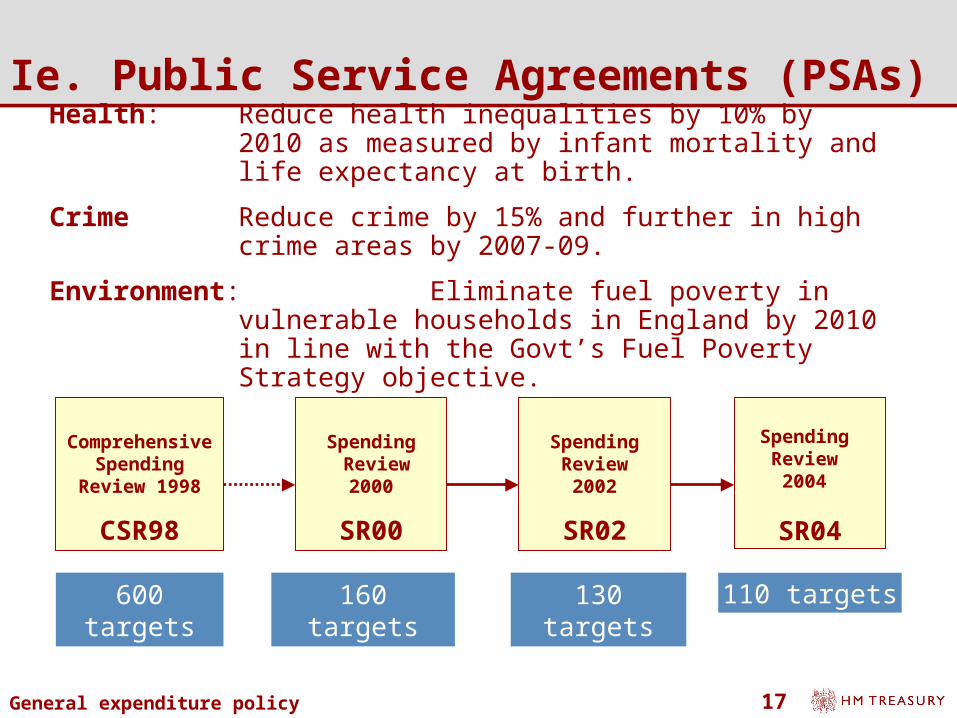
Ie. Public Service Agreements (PSAs)
Comprehensive Spending
Review 1998
CSR98
Spending Review
2000
SR00
SpendingReview
2002
SR02
600 targets 160 targets 130 targets
Spending Review
2004
SR04
110 targets
Health: Reduce health inequalities by 10% by 2010 as measured by infant mortality and life expectancy at birth.
Crime Reduce crime by 15% and further in high crime areas by 2007-09.
Environment: Eliminate fuel poverty in vulnerable households in England by 2010 in line with the Govt’s Fuel Poverty Strategy objective.

General expenditure policy 18
II. Some Recent Innovations in CSR07
a. Fiscal consolidation as an (implicit) objective
b. Long-term challenges and policy reviews
c. “Early” spending settlements
d. Comprehensive value for money programme
e. Further streamlining of PSA targets
General expenditure policy 19
IIa. Delivering fiscal consolidation
Total Managed Expenditure (TME)
-1%
0%
1%
2%
3%
4%
5%
6%
1996
-97
1997
-98
1998
-99
1999
-00
2000
-01
2001
-02
2002
-03
2003
-04
2004
-05
2005
-06
2006
-07
2007
-08
2008
-09
2009
-10
2010
-11
2011
-12
Re
al G
row
th %
34%
35%
36%
37%
38%
39%
40%
41%
42%
43%
% o
f G
DP
Year-on-year TME growth (LHS)
TME % of GDP (RHS)
General expenditure policy 20
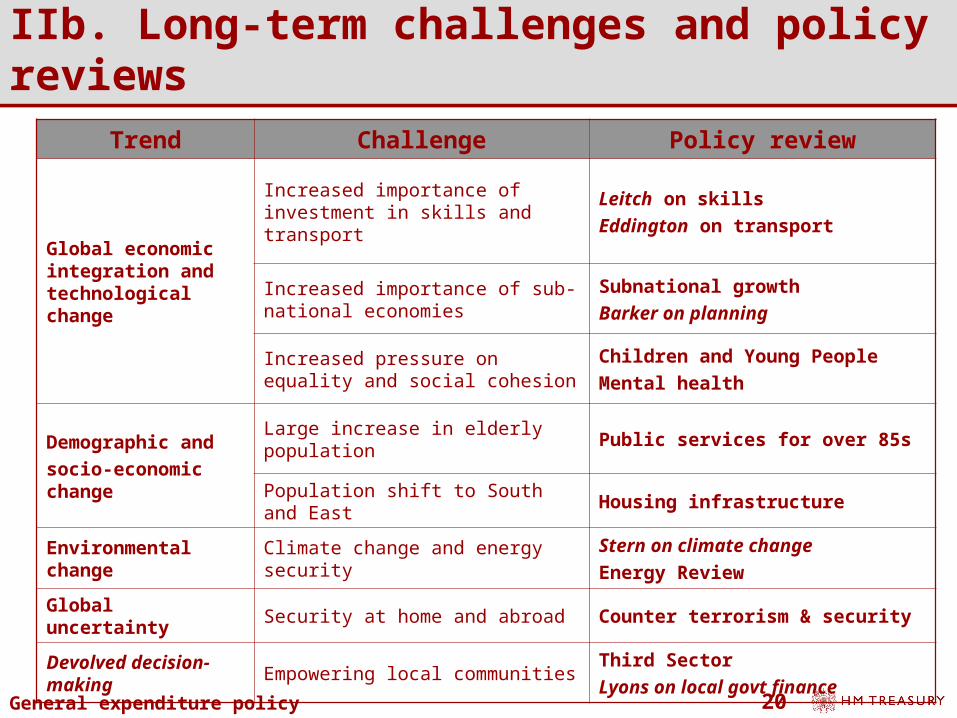
IIb. Long-term challenges and policy reviews
Trend Challenge Policy review
Global economic integration and technological change
Increased importance of investment in skills and transport
Leitch on skillsEddington on transport
Increased importance of sub-national economies
Subnational growthBarker on planning
Increased pressure on equality and social cohesion
Children and Young People Mental health
Demographic and socio-economic change
Large increase in elderly population
Public services for over 85s
Population shift to South and East
Housing infrastructure
Environmental change
Climate change and energy security
Stern on climate changeEnergy Review
Global uncertainty Security at home and abroad Counter terrorism & security
Devolved decision-making
Empowering local communitiesThird SectorLyons on local govt finance

General expenditure policy 21
IIc. Early Settlements: Seizing Opportunities
March 2006• Home Office: 0% real• DWP, HMRC, HMT & CO: -5% real
December 2006• Constitutional Affairs: -3.5% real
March 2006• Education & Science: 2.5% real• Attorney General: -3.5% real

General expenditure policy 22
IIc. Value for money: A comprehensive approach…
Zero-based reviews
Operational efficiencies
FocusPolices &
programmesProcesses
Departmentby
Department
Input costs
Programmes
Organisations
Systemic issues
Procurement
Corporate services
Productive time
Transactions
Cross-Department
al
Cross-cutting policy reviews
Varney Review of service transformation

General expenditure policy 23
200
220
240
260
280
300
320
2004-05 2005-06 2006-07 2007-08 2008-09 2009-10 2010-11
To
tal n
ear
cash
res
ou
rce
DE
L £
bn
(ex
clu
des
Bar
net
t)
…with a single global target of 3% savings per year…
07-08 baseline
Estimated CSR DEL
envelope (1.5% AARG)
Pressures are running at ~4.5% real,
also ~ the trend rate of DEL growth since 2000
Gap: £30bn or
>3% nominal pa
SR04
Projected DEL pressures
Projected DEL spendUnfunded Pressures
CSR07

General expenditure policy 24
Admininstration Budgets
13,200
13,400
13,600
13,800
14,000
14,200
14,400
14,600
14,800
15,000
15,200
2004-05 2005-06 2006-07 2007-08 2008-09 2009-10 2010-11
£m
0.0%
0.5%
1.0%
1.5%
2.0%
2.5%
3.0%
3.5%
% o
f Pu
blic
Sp
end
ing
Administration Costs (LHS) Admin as % of public spending (RHS)
…a 5% annual real cut in administration…
£1bn
General expenditure policy 25
0
50,000
100,000
150,000
200,000
250,000
To
tal P
ay £
m
46%
51%
56%
61%
66%
71%
Pay
bill
as
% o
f RD
EL
Pay bill
Pay bill at trend grow th
Paybill w ith 2% headline & 1% w orkforce
Pay bill as % RDEL (trend)
Pay bill as % of RDEL (2% headline & 1%w orkforce)
…and a 2% target for pay settlements.
• macro stability: headline settlements in line with 2 % CPI target
• value for money: taking into account historic and private sector benchmarks
• affordability: paybill growth consistent with likely range of DEL settlements
General expenditure policy 26
IIe. Further streamlining PSAs in CSR07
• Reducing the number of PSAs from 110 to 30
• Focusing PSAs on cross-Departmental outcomes
• Emphasising consultation with the delivery chain
• Reducing underlying data burdens on frontline
• Building user voice into performance management

General expenditure policy 27
III. UK Experience: Key advantages1. Medium-term fiscal framework limited debate about
overall level of spending and gave us 4 years to prepare for spending slowdown
2. Focus on DELs as control total empowers Departments to act as “mini Treasuries”
3. 3 year budgeting horizon allows scope for greater ambition on both outcomes and efficiency
4. Outcome-focused performance management frees up Departments to find most cost-effective route to deliver
5. Budgetary discipline reinforced by not having a Spending Review every year!
General expenditure policy 28
UK Experience: Key challenges1. Building a collective sense of priorities - but had
the advantage in CSR007 of Manifesto commitments, revealed preference of history and common sense.
2. Ministers’ sensitivity to accusation of “cuts in public services”
3. Moving beyond incrementalism and digging into Departments’ baseline budgets
4. Unpacking the “black box” that links spending – inputs – outputs – outcomes
5. Creeping return of input targets – spending as a share of GDP, spending per pupil, numbers of policemen
General expenditure policy 29
UK Experience: Lessons for Italy (I)1. Start with a top-down, medium-term constraint –
critical to keep the discussion focused on priorities and trade-offs
2. Personalise that constraint to those expected to make decisions – stop Departments from “gaming” the system by telling them the answer from the start
3. Create a sense that change is inevitable – “long-term challenges” were an attempt to create a sense of urgency during a period of relative fiscal plenty
4. Use intuition to focus central efforts early – zero-based reviews covered 20% of spending where we expected to be able to find substantial savings
5. Get Departments to take responsibility for tough choices – require them to nominate programmes for review and agree them with Treasury not the other way around

General expenditure policy 30
UK Experience: Lessons for Italy (II)6. Benchmark Departments against each other – identify
top-performers early & challenge others to match their ambition
7. Don’t be too ambitious – difficult to imagine how any large organisation can shrink by more than 15-20% over 3 years
8. Use Ministers’ discount factors to your advantage – offer them cash in Year 1 for ambitious savings in Years 2 and 3
9. Use the data you have – don’t wait for the perfect information system to set Departments’ performance or savings targets
10. Accept that spending outcomes relationship will always be a “gray box” – beware of utopian ideal of “integrated” financial and performance management