general enquiries on this form should be made...
TRANSCRIPT

General enquiries on this form should be made to:Defra, Science Directorate, Management Support and Finance Team,Telephone No. 020 7238 1612E-mail: [email protected]
SID 5 Research Project Final Report
SID 5 (Rev. 3/06) Page 1 of 19
NoteIn line with the Freedom of Information Act 2000, Defra aims to place the results of its completed research projects in the public domain wherever possible. The SID 5 (Research Project Final Report) is designed to capture the information on the results and outputs of Defra-funded research in a format that is easily publishable through the Defra website. A SID 5 must be completed for all projects.
This form is in Word format and the boxes may be expanded or reduced, as appropriate.
ACCESS TO INFORMATIONThe information collected on this form will be stored electronically and may be sent to any part of Defra, or to individual researchers or organisations outside Defra for the purposes of reviewing the project. Defra may also disclose the information to any outside organisation acting as an agent authorised by Defra to process final research reports on its behalf. Defra intends to publish this form on its website, unless there are strong reasons not to, which fully comply with exemptions under the Environmental Information Regulations or the Freedom of Information Act 2000.Defra may be required to release information, including personal data and commercial information, on request under the Environmental Information Regulations or the Freedom of Information Act 2000. However, Defra will not permit any unwarranted breach of confidentiality or act in contravention of its obligations under the Data Protection Act 1998. Defra or its appointed agents may use the name, address or other details on your form to contact you in connection with occasional customer research aimed at improving the processes through which Defra works with its contractors.
Project identification
1. Defra Project code PS2342
2. Project title
Improved estimates of water intake by mammals for risk assessment
3. Contractororganisation(s)
Central Science LaboratorySand HuttonYorkYO41 1LZ
54. Total Defra project costs £ 10052(agreed fixed price)
5. Project: start date................ 01 May 2008
end date................. 31/10/2008
SID 5 (Rev. 3/06) Page 2 of 19

6. It is Defra’s intention to publish this form. Please confirm your agreement to do so...................................................................................YES NO (a) When preparing SID 5s contractors should bear in mind that Defra intends that they be made public. They
should be written in a clear and concise manner and represent a full account of the research project which someone not closely associated with the project can follow.Defra recognises that in a small minority of cases there may be information, such as intellectual property or commercially confidential data, used in or generated by the research project, which should not be disclosed. In these cases, such information should be detailed in a separate annex (not to be published) so that the SID 5 can be placed in the public domain. Where it is impossible to complete the Final Report without including references to any sensitive or confidential data, the information should be included and section (b) completed. NB: only in exceptional circumstances will Defra expect contractors to give a "No" answer.In all cases, reasons for withholding information must be fully in line with exemptions under the Environmental Information Regulations or the Freedom of Information Act 2000.
(b) If you have answered NO, please explain why the Final report should not be released into public domain
Executive Summary7. The executive summary must not exceed 2 sides in total of A4 and should be understandable to the
intelligent non-scientist. It should cover the main objectives, methods and findings of the research, together with any other significant events and options for new work.1. Risk assessments for pesticides require an assessment of the risk posed to birds and mammals from
drinking contaminated water. However, an animal can obtain the water it needs other than by drinking, such as water in the food it eats and water produced during metabolism. The relative amounts of water obtained from each source will be different for different species and diets. For example an animal feeding on large quantities of succulent food will have far less need for drinking water than one that is feeding on dry seeds. There is therefore a need to be able to estimate drinking water requirements that takes account of the effect of food moisture content.
2. Methods for estimating drinking water requirements of animals by combining water flux data with estimates of food water and metabolic water production have been developed in projects PS2327 and PS2330. The objective of this study was to provide improved methods of estimating daily water intake by mammals for use in risk assessments by including data from DLW studies conducted since the publication of Nagy and Peterson (1988), as was done for birds in project PS2330.
3. A total of 848 values for water flux for fully-grown mammals from 107 species were collected from 102 studies. This allowed a significant expansion of the dataset that was available when the existing allometric equations were generated by Nagy and Peterson (1988).
4. This data was used to develop updated allometric equations to estimate the water flux of species relevant to risk assessment in the UK. The equations relate body mass to water turnover. Different equations have been calculated for different mammal groupings. Example calculations demonstrating the methods of calculating water flux and drinking water requirements are provided.
5. Where data on water flux for species found in the UK were identified, these were reported along with the conditions under which they were collected as far as this information was available. Data for only six species were found, with only three of the species measured in Europe, only two of which were in the UK. This data was used to illustrate the potential difficulties of using data from single studies where details of diet are uncertain.
6. It is recommended that estimations of drinking water requirements should be conducted as suggested for birds in project PS2330 and EFSA (2008) using the appropriate data from this study to estimate water flux. Where published data for water flux are available for the species of concern at an appropriate time of year when diet is likely to be similar to the food type being considered, these should be used in place of estimated values.
SID 5 (Rev. 3/06) Page 3 of 19

Project Report to Defra8. As a guide this report should be no longer than 20 sides of A4. This report is to provide Defra with
details of the outputs of the research project for internal purposes; to meet the terms of the contract; and to allow Defra to publish details of the outputs to meet Environmental Information Regulation or Freedom of Information obligations. This short report to Defra does not preclude contractors from also seeking to publish a full, formal scientific report/paper in an appropriate scientific or other journal/publication. Indeed, Defra actively encourages such publications as part of the contract terms. The report to Defra should include: the scientific objectives as set out in the contract; the extent to which the objectives set out in the contract have been met; details of methods used and the results obtained, including statistical analysis (if appropriate); a discussion of the results and their reliability; the main implications of the findings; possible future work; and any action resulting from the research (e.g. IP, Knowledge Transfer).
SID 5 (Rev. 3/06) Page 4 of 19
PROGRESS
Objective 1. Provide improved methods of estimating daily water intake by mammals for use in risk assessments by including data from DLW studies conducted since the publication of Nagy and Peterson (1988).
Estimating drinking water requirements
An animal can obtain water from sources other than drinking such as water in the food it eats and water produced during metabolism. The relative amounts obtained from each source will be different for different species and diets. For example an animal feeding on large quantities of succulent food will have far less need for drinking water than one that is feeding on dry seeds.
Where an estimate of total daily water flux can be made it is therefore possible to combine this with data on preformed water in the diet and metabolic water production to determine how much water an animal would need to drink to achieve water balance.
e.g. Drinking water (ml/d) = Total water flux – [Food water + Metabolic water]
This approach has been proposed in the EFSA opinion on risk assessment for birds and mammals (EFSA 2008), although the current document uses the allometric equations from Nagy and Peterson (1988) to estimate water flux in mammals.
Improved estimates of daily water flux
Published papers on doubly-labelled water (DLW) studies on free-living mammals from projects PN0908 and PS2330 were examined to extract any data on water flux. These were supplemented with data from more recent papers from an online search conducted by the CSL Information Centre. This was combined with data from sources reported in Nagy and Peterson (1988) and tritiated water studies to produce an up to date database of water flux values for free-living mammals which could be used to calculate updated allometric equations using the linear regression methods reported in projects PN0908 and PS2330. Where possible we collected data on individual mammals’ water flux, so that it could be used in any future probabilistic risk assessment in which the daily variation and uncertainty in water intake could be simulated for individual animals to estimate reasonable worst-case individual drinking requirements.
A total of 848 values for water flux for fully-grown mammals from 107 species were collected from 102 studies. This allowed a significant expansion of the dataset that was available when the existing allometric equations were generated by Nagy and Peterson (1988). Some of the values obtained were from animals that were fasting throughout the measurement period and were therefore not included in the analysis. For one species (northern elephant seal) this meant that all data was excluded leaving 842 values from 106 species.
While the vast majority of these values (over 80%) were from DLW studies where daily energy expenditure (DEE) data for the same individuals or group of mammals was also reported, a significant number of values came from tritiated water studies where only water flux was measured and these were also included (as in the earlier study by Nagy and Peterson 1988).
The relationship between body mass and water flux for all mammal species is shown in Figure 1.
SID 5 (Rev. 3/06) Page 5 of 19
Figure 1. Relationship between body mass and water flux for all mammal species excluding those values where animals were fasting (some marine mammals only).
Adjusted r2 for this regression was 0.903 and this increased to 0.931 when ‘group’ (desert eutherian, marine eutherian, other eutherian and non-eutherian) was also included. The data for each group and fitted lines are shown in Figure 2.
Figure 2. Relationship between body mass and water flux indicating the values from each group.
The relationships between body mass and water flux for each of these groupings are shown in figures 3 to 6.
SID 5 (Rev. 3/06) Page 6 of 19

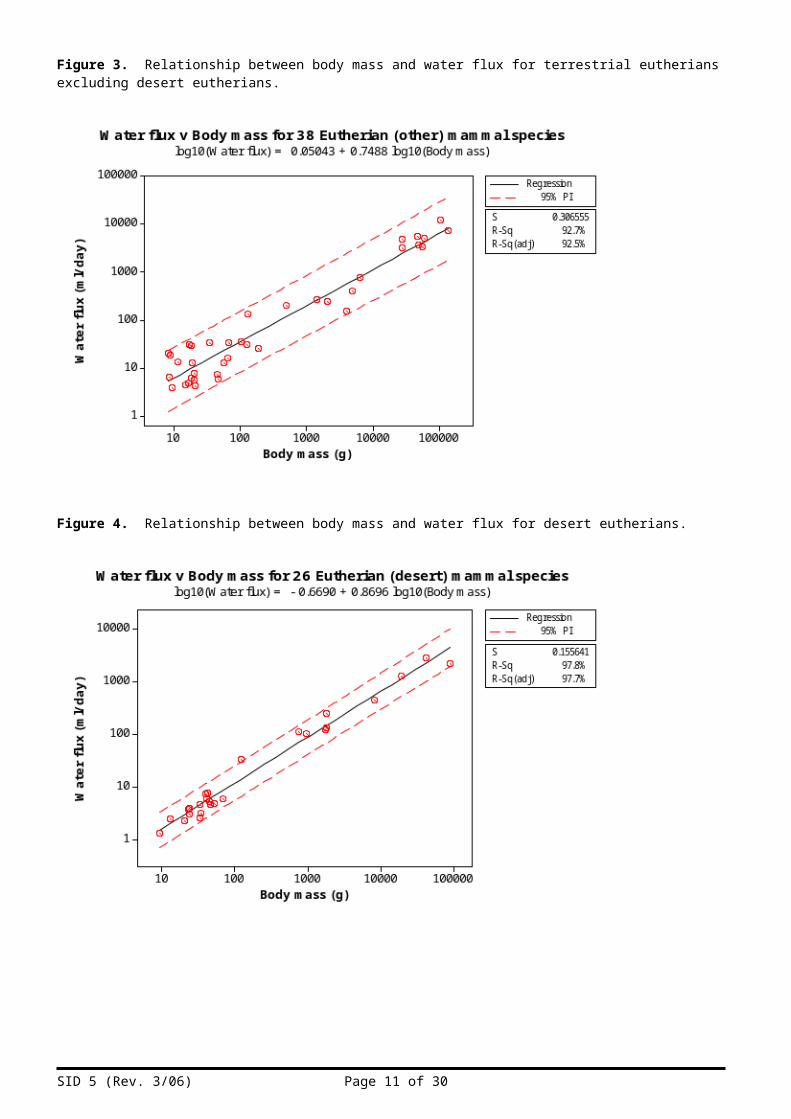
Figure 3. Relationship between body mass and water flux for terrestrial eutherians excluding desert eutherians.
Figure 4. Relationship between body mass and water flux for desert eutherians.
SID 5 (Rev. 3/06) Page 7 of 19
Figure 5. Relationship between body mass and water flux for non-eutherians (marsupials, monotremes).
Figure 6. Relationship between body mass and water flux for marine species (excluding data from fasting animals). Most of this data comes form lactating females spending varying amounts of time foraging at sea.
While the relationship between body mass and water flux in marine mammals was weak, removing them from the dataset slightly reduced the r2 value from 90.3% to 89.2% (Figure 7).
SID 5 (Rev. 3/06) Page 8 of 19

Figure 7. Relationship between body mass and water flux for all mammal species excluding marine species.
Details of the allometric equations for each classification of mammal groups are shown in Table 1.
Table 1. Relationship between body mass (g) and Daily Water Flux (ml) in for selected groups of mammal species. The general form of equation is: Log(Flux) = Log a + b (log Body mass). Insert Log10 a and b from the table to obtain the specific equation for the relevant species group. Also shown are the standard errors for a and b (SE), the number of species in each group (N), and the proportion of variation explained by each equation (r2).
Group Log10 a SE Log10 a b SE b N r2 pAll mammal species -0.1806 0.0745 0.7703 0.0246 106 0.903 <0.001
All eutherians -0.2654 0.0841 0.8099 0.0288 69 0.921 <0.001Terrestrial eutherians -0.2437 0.0884 0.7965 0.0325 64 0.905 <0.001
Desert eutherians -0.6690 0.0681 0.8696 0.0267 26 0.977 <0.001Other eutherians 0.0504 0.0994 0.7488 0.0351 38 0.925 <0.001
Marine eutherians 0.9450 2.5930 0.5838 0.5414 5 0.039 0.360Non-eutherians 0.2868 0.1512 0.6100 0.0431 37 0.824 <0.001
The group ‘other eutherians’ indicates terrestrial eutherians that are not desert species and would therefore appear to be the most appropriate equation for estimating water flux in risk in the UK.
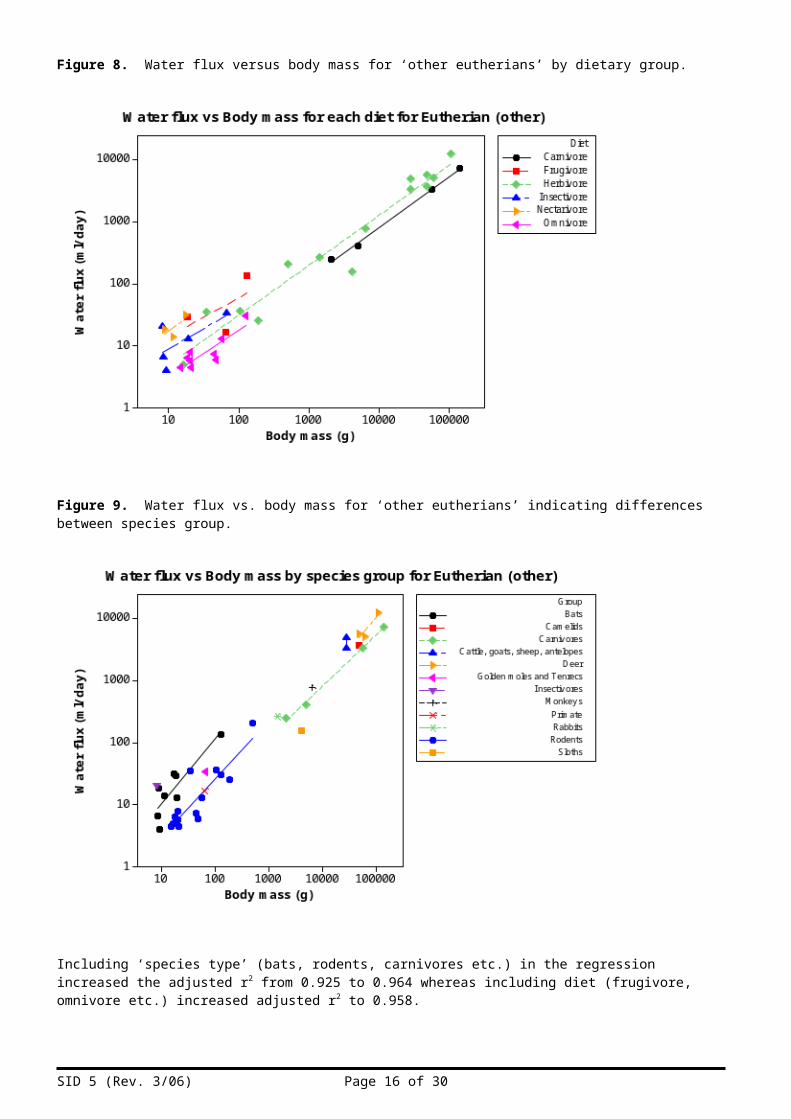
However, closer inspection of the data indicated that some small species had relatively high water fluxes and that these were mostly bats which include nectarivores, frugivores and insectivores (Figures 8 and 9).
SID 5 (Rev. 3/06) Page 9 of 19

Figure 8. Water flux versus body mass for ‘other eutherians’ by dietary group.
Figure 9. Water flux vs. body mass for ‘other eutherians’ indicating differences between species group.
Including ‘species type’ (bats, rodents, carnivores etc.) in the regression increased the adjusted r2 from 0.925 to 0.964 whereas including diet (frugivore, omnivore etc.) increased adjusted r2 to 0.958.
SID 5 (Rev. 3/06) Page 10 of 19
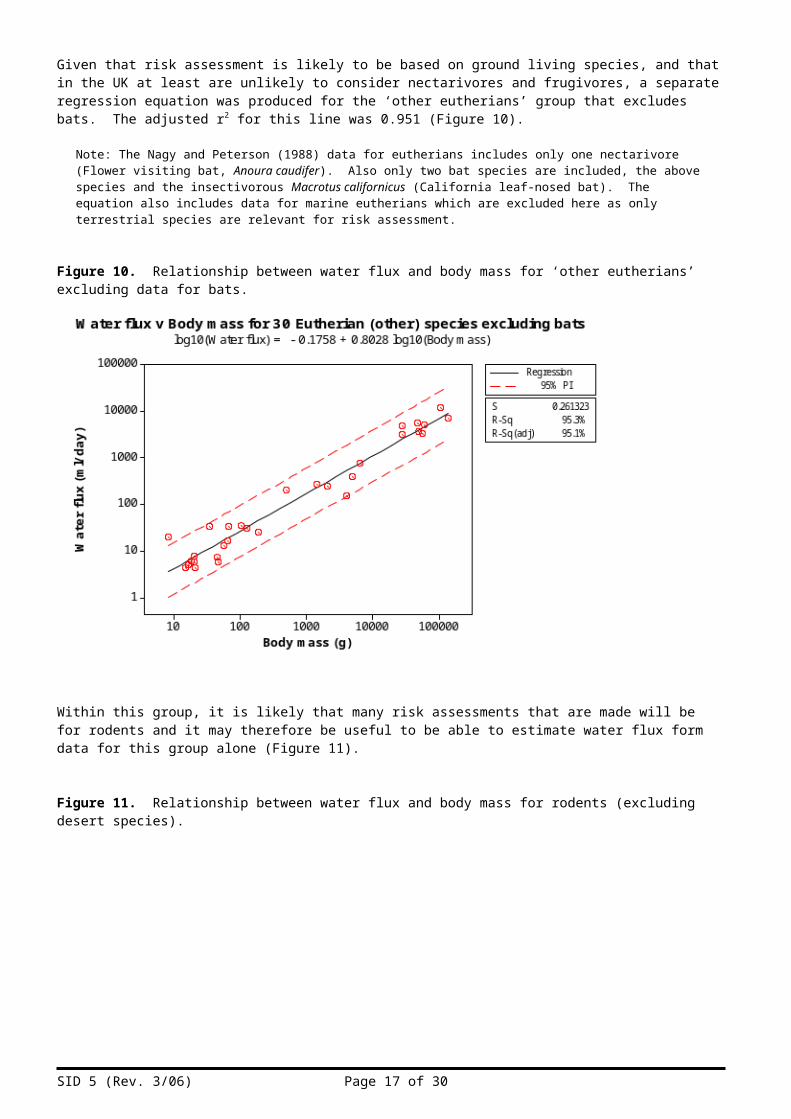
Given that risk assessment is likely to be based on ground living species, and that in the UK at least are unlikely to consider nectarivores and frugivores, a separate regression equation was produced for the ‘other eutherians’ group that excludes bats. The adjusted r2 for this line was 0.951 (Figure 10).
Note: The Nagy and Peterson (1988) data for eutherians includes only one nectarivore (Flower visiting bat, Anoura caudifer). Also only two bat species are included, the above species and the insectivorous Macrotus californicus (California leaf-nosed bat). The equation also includes data for marine eutherians which are excluded here as only terrestrial species are relevant for risk assessment.
Figure 10. Relationship between water flux and body mass for ‘other eutherians’ excluding data for bats.
Within this group, it is likely that many risk assessments that are made will be for rodents and it may therefore be useful to be able to estimate water flux form data for this group alone (Figure 11).
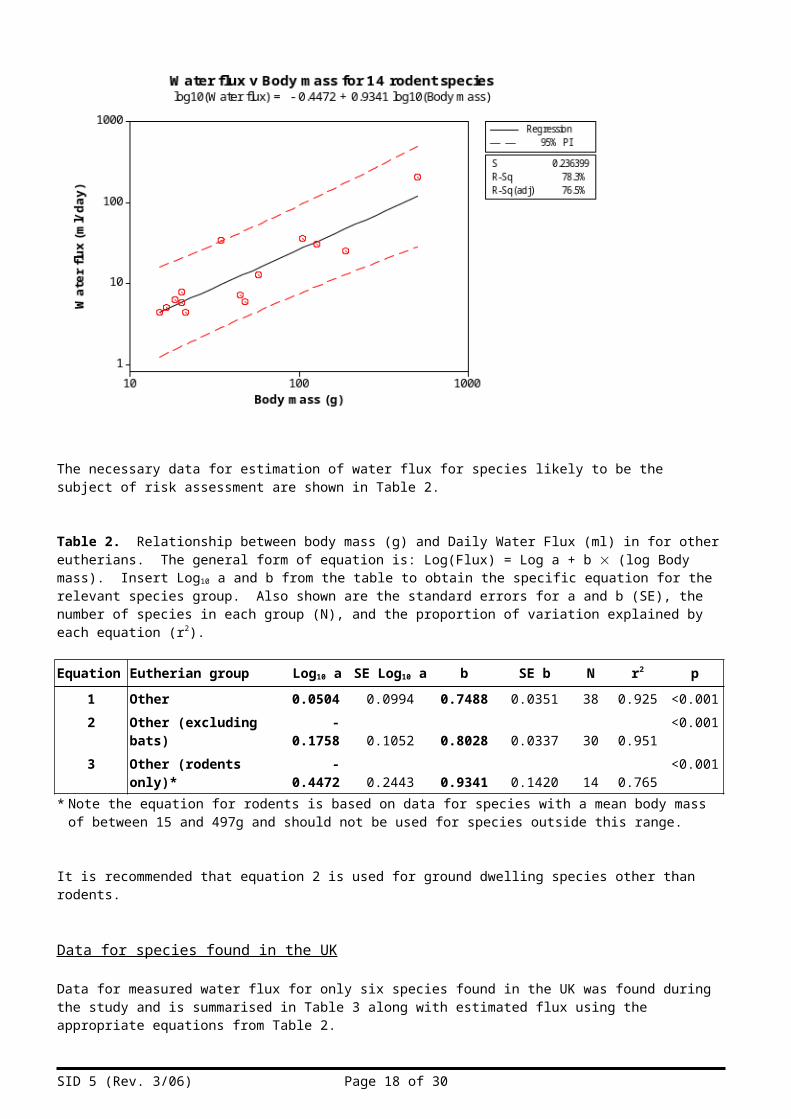
Figure 11. Relationship between water flux and body mass for rodents (excluding desert species).
SID 5 (Rev. 3/06) Page 11 of 19

The necessary data for estimation of water flux for species likely to be the subject of risk assessment are shown in Table 2.
Table 2. Relationship between body mass (g) and Daily Water Flux (ml) in for other eutherians. The general form of equation is: Log(Flux) = Log a + b (log Body mass). Insert Log10 a and b from the table to obtain the specific equation for the relevant species group. Also shown are the standard errors for a and b (SE), the number of species in each group (N), and the proportion of variation explained by each equation (r2).
Equation Eutherian group Log10 a SE Log10 a b SE b N r2 p1 Other 0.0504 0.0994 0.7488 0.0351 38 0.925 <0.0012 Other (excluding bats) -0.1758 0.1052 0.8028 0.0337 30 0.951 <0.0013 Other (rodents only)* -0.4472 0.2443 0.9341 0.1420 14 0.765 <0.001
* Note the equation for rodents is based on data for species with a mean body mass of between 15 and 497g and should not be used for species outside this range.
It is recommended that equation 2 is used for ground dwelling species other than rodents.
Data for species found in the UK
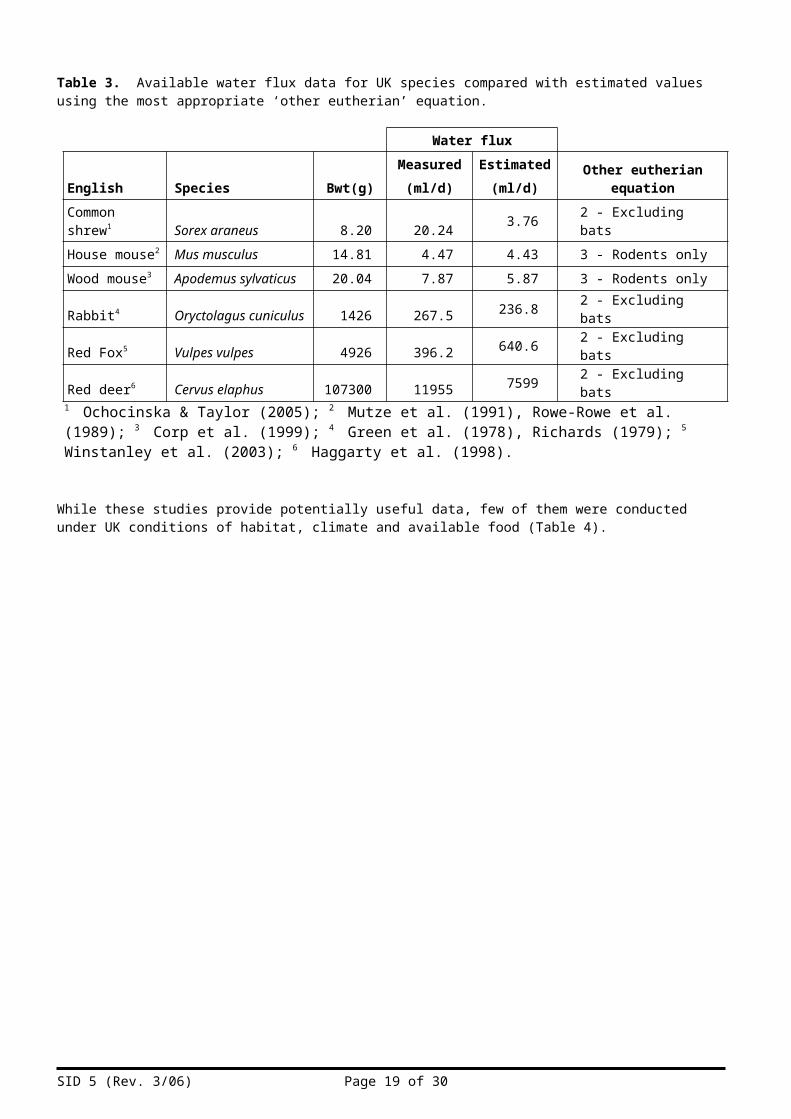
Data for measured water flux for only six species found in the UK was found during the study and is summarised in Table 3 along with estimated flux using the appropriate equations from Table 2.
Table 3. Available water flux data for UK species compared with estimated values using the most appropriate ‘other eutherian’ equation.
Water flux
English Species Bwt(g)Measured
(ml/d)Estimated
(ml/d) Other eutherian equationCommon shrew1 Sorex araneus 8.20 20.24 3.76 2 - Excluding batsHouse mouse2 Mus musculus 14.81 4.47 4.43 3 - Rodents onlyWood mouse3 Apodemus sylvaticus 20.04 7.87 5.87 3 - Rodents onlyRabbit4 Oryctolagus cuniculus 1426 267.5 236.8 2 - Excluding batsRed Fox5 Vulpes vulpes 4926 396.2 640.6 2 - Excluding batsRed deer6 Cervus elaphus 107300 11955 7599 2 - Excluding bats
1 Ochocinska & Taylor (2005); 2 Mutze et al. (1991), Rowe-Rowe et al. (1989); 3 Corp et al. (1999); 4 Green et al. (1978), Richards (1979); 5 Winstanley et al. (2003); 6 Haggarty et al. (1998).
While these studies provide potentially useful data, few of them were conducted under UK conditions of habitat, climate and available food (Table 4).
SID 5 (Rev. 3/06) Page 12 of 19

Table 4. Details of studies with water flux data for species found in the UK.
English(species)
Country/Habitat(s)
Season Diet Reference
Common shrew(Sorex araneus)
NE Poland /Tussocky sedge swampBlack alder forest
July No detailed information except a 71% water content for the presumed diet of this species in the study area
Ochocinska & Taylor (2005)
House mouse(Mus musculus)
South Australia /Roadside verge and adjacent paddocks. Semi arid Mediterranean climate
All year No details but stated that weed seeds, grain and fruits available seasonally.
Mutze et al. (1991)
Marion Island, Southern Indian Ocean /Vegetated lava and mire
April-May(summer / autumn)
Mainly moths (larvae,pupae, adults), weevils, spiders. Some plant material.
Rowe-Rowe et al. (1989)
Wood mouse(Apodemus sylvaticus)
NE Scotland /Maritime sand dunes.Deciduous woodland.
Breeding and non-breeding seasons.
Authors considered that sand dune animals would have an arthropod based diet while woodland animals fed more on seeds and plant material and this was reflected in the measured water flux
Corp et al. (1999)
Rabbit(Oryctolagus cuniculus)
NSW Australia /Grassy plains.Sandhills.Dunes.(2 of the 4 sites had no permanent water available)
Feb, May, July(southern hemisphere)
Vegetation with a range of water and sodium contents depending on site.
Green et al. (1978),
NSW Australia /Sandflats adjoining a terminal flood plain. Arid.
Measurements made through the year.
Pasture species with varying seasonal water content.
Richards (1979)
Red Fox(Vulpes vulpes)
NSW Australia /River flats, undulating pasture, wooded hills with farmland for sheep/cattle grazing and some cropping.
November (spring) and April (autumn).
No details Winstanley et al. (2003)
Red deer(Cervus elaphus)
Scotland /Lowland pasture
August Grass Haggarty et al. (1998)
Only three studies were conducted in Europe with two of these in the UK.
While there is a broad agreement between the measured and estimated water flux for mice and rabbits, predictions for other species using these methods are less good. When comparing the estimates on log scale (Figure 12) the biggest disparity in these examples is for the common shrew and possible reasons for this are discussed below in the section on ‘limitations of the method’,
SID 5 (Rev. 3/06) Page 13 of 19
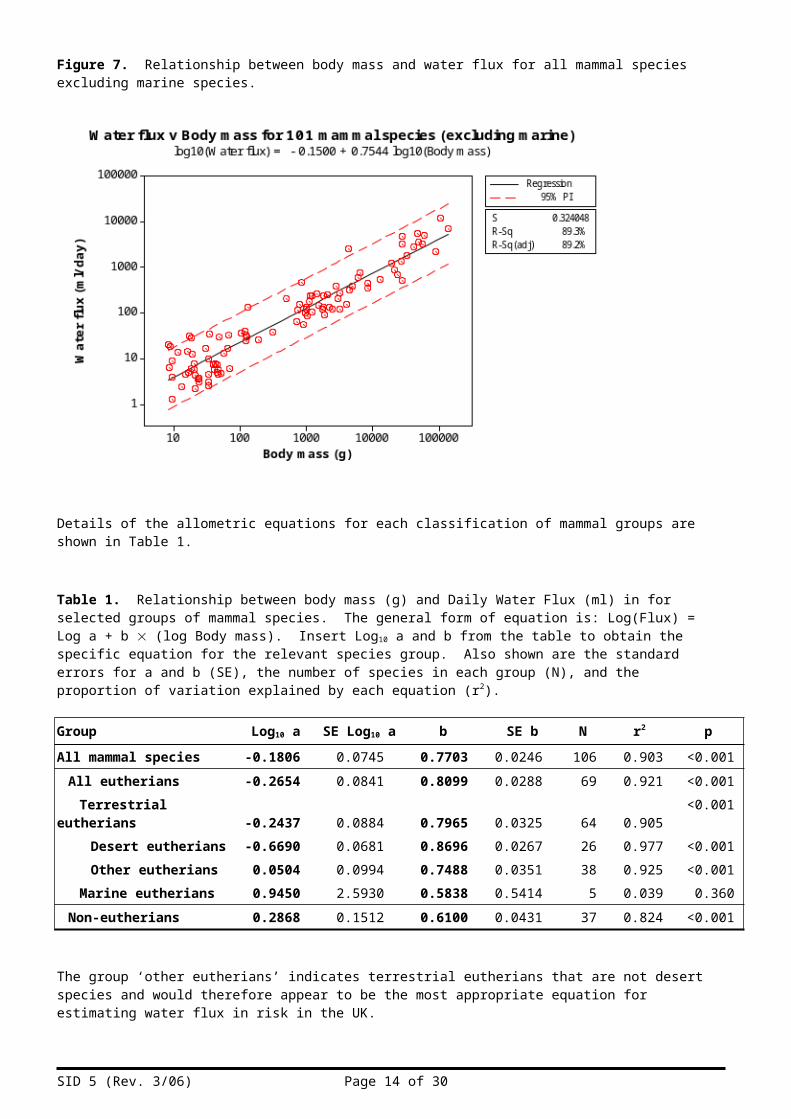
Figure 12. Relationship between water flux and body mass for UK species showing both measured and estimated values.
For the measurements made in the UK (wood mice and red deer), some indications of possible diets are provided that may explain the differences between measured and estimated values. Wood mice on maritime sand dunes with an arthropod based diet had a water influx rate of 9.3ml/d compared to those in deciduous woodland with a likely seed and plant material diet which had an influx rate of 6.3ml/d (Corp et al. 1999). The latter value is very close to the estimated value of 5.9 ml/d. In the study of red deer (Haggarty et al. 1998) it is stated that the deer fed only on grass in lowland pasture during the measurement period. It might be expected that the normal water flux rate for this species would be lower as other parts of the normal diet which include leaves, buds, shoots and bark may have a lower moisture content.
Calculating water flux
The following are examples of estimates using the above equations for species that may be the subject of risk assessment for which no measured data was found.
A bank vole weighing 24g may be expected to have a Daily Water Flux of:
Log10(Water Flux) = -0.4472 + 0.9341*Log10(24) [Equation 3]
Log10(Water Flux) = 0.8545
Water Flux = 100.8545
Water Flux = 7.15 ml/day
Similarly a hare weighing 3.3kg might be expected to show a Daily Water Flux of:
Log10(Water Flux) = -0.1758 + 0.8028*Log10(3300) [Equation 2]
Water Flux = 445.5 ml/day
SID 5 (Rev. 3/06) Page 14 of 19

Estimating drinking water requirements
To estimate drinking water requirements it is necessary to combine the estimated or measured water flux with the amount of water provided by the food eaten and the amount of metabolic water produced as described above.
e.g. Drinking water (ml/d) = Total water flux – [Food water + Metabolic water]
Water in food
To determine how much of an animals daily water requirement might be obtained from its food, it is necessary to determine how much food is eaten in a day and combine this with the fractional water content. Methods for estimating food intake have already been developed (Crocker et al. 2002) based on DEE estimates from allometric equations, energy contents of different foods and assimilation efficiency. Data on the moisture content of foods is used to calculate the wet weight daily food requirements. The best approach would therefore be to use the output of these calculations to determine the amount of water that may be obtained from food.
e.g. Food water (g) = Daily food intake (g) x Fractional water content
For a mixed diet it would be necessary to calculate the water content for each type and sum to estimate total daily food water intake.
Metabolic water
Different food constituents (fats, proteins, carbohydrates) produce different amounts of water when metabolised (Table 5).
Table 5. Energy and metabolic water values for food constituents adapted from Schmidt-Nielsen (1979) using a conversion of 1 kcal = 4.184kJ.
Foodstuff Water formed (ml water/g food)
Metabolic energy value(kJ/g)
Water formed(ml H2O/kJ)
Starch (carbohydrates) 0.56 17.57 0.0319Fat 1.07 39.33 0.0272Protein (urea excretion) 0.39 17.99 0.0217Protein (uric acid excretion) 0.5 18.41 0.0272
While different food constituents yield different amounts of water per g of food metabolised, these differences are reduced when the water produced per kJ is considered. This also simplifies the calculation of metabolic water produced as it could be estimated directly from the estimate of DEE.
Ideally this would be estimated based on the relative amounts of carbohydrate, fat and protein in the diet under consideration. In the absence of such detailed information about dietary composition then it may be appropriate to use a mean value (0.0269 g water/kJ) for carbohydrates, fats and protein (urea excretion) or, more conservatively, the lowest value for proteins (0.0217 g water/kJ).
e.g. Metabolic water (ml) = DEE (kJ) x 0.0269 (ml/kJ) (using mean value)
Alternatively, it would be possible to estimate metabolic water production from daily food intake provided energy content, fractional water content and assimilation efficiency are known.
e.g. Metabolic water (ml) = DFI x [1 – FWC] x AE x EC x MWP
where: DFI = Daily food intake (g wet weight)FWC* = Fractional water content of food (unitless proportion)AE* = Assimilation efficiency (unitless proportion)EC = Energy content of food (kJ/g dry weight)MWP = Metabolic water production (ml/kJ see above)* Note that these are often reported as percentages
SID 5 (Rev. 3/06) Page 15 of 19
Where detailed information about dietary composition is available (% carbohydate, % fat, % protein) then metabolic water production can be estimated from the data on production per unit dry weight metabolised (ml/g), e.g.
Metabolic water (ml) = (g carbohydrate x 0.56)+(g fat x 1.07)+(g protein x 0.0244)
Note this should be estimated using the dry weight of food that is metabolised.
e.g. DEE/energy content (kJ/g dry weight of food)
or Total food intake (dry weight in g) x Assimilation Efficiency
For a mixed diet it would be best to calculate the metabolic water content production for each type of food (if sufficient data are available on the dietary composition of each food type is available) and sum them to estimate total daily food water intake. Otherwise the total DEE estimate could be used with a single value for metabolic water production as indicated above.
Metabolic water can therefore be estimated in at least three ways depending on the data available and the degree of precision required e.g.
1. Use DEE and mean (0.0269 ml/kJ) or lowest (0.0217 ml/kJ) value for MWP.2. Calculate from carbohydrate, fat and protein values (ml/g) where data on dietary composition and food
intake is available.3. Use calculated values for the food type from previous studies where available.
Example of drinking water estimation
To estimate the drinking water requirements for a species for which we have no water flux or DEE values such as the hare (Lepus lepus) we will first have to use the available allometric equations to estimate these. We have already estimated the water flux for a 3300g hare to be 464.4 ml/day.
DEE can be estimated using the ‘other eutherians’ equation developed in project PS2330;
Log10(DEE) = 0.814 + 0.715*Log10(3300)
DEE = 2137 kJ/d
To estimate food water it is now necessary to estimate the food intake rate (FIR) from the DEE value. From Crocker et al. (2002), assimilation efficiency (AE) for a lagomorph feeding on vegetation is 74%. Food energy content (FE) and moisture content (MC) are 18.0kJ/g and 76.4% respectively.
FIR = (DEE/FE)/((1-(MC/100)) x (AE/100))= (2137/18.0)/((1-(76.4/100)) x (74/100))= 679.8 g/d
Food water = FIR (g/d) x (MC (%)/100)= 372.3 x (76.4/100)= 519.4ml
Metabolic water = DEE (kJ) x 0.0269 ml/kJ= 2137 x 0.0269= 57.5 ml
Drinking water = Total water flux – [Food water + Metabolic water]= 445.5 – (519.4 + 57.5)= -131.4 ml/d
In this case the drinking water requirement is negative indicating that the animal should be able to meet its water requirements from feeding alone.
SID 5 (Rev. 3/06) Page 16 of 19
Limitations of the method for estimating drinking water requirements
This method of estimating drinking water requirements provides a useful indication of those species/food type combinations that present the most risk. However, the lack of measured daily water flux data for many of the relevant species that might be considered in risk assessment leads to a heavy reliance on allometric equations. The shortcomings of this approach were discussed in detail in projects PS2327 and PS2330. The main issue is that measured values of water flux are highly dependent on the specific circumstances under which they were collected such as time of year and the water content of the diet. For example, high values for water flux for a given species may reflect the fact that the animals were feeding on succulent materials when measured, and therefore had a relatively high volume of water passing through the body. An example of this is the disparity between the estimated and measured water flux for the common shrew identified above which might be explained if the shrews were eating food with a very high water content (such as earthworms or slugs) when measurements were made. However, the authors suggest a 71% water content for the presumed diet of this species in the study area which would seem to correspond with an arthropod diet. To compare the two diets, estimated water flux for shrews feeding on insects and soil invertebrates based on the published DEE (Ochocinska and Taylor 2005) were made and are shown in Table 6.
Table 6. Estimated water flux for shrews using DEE values from Ochocinska and Taylor (2005) and values for food energy content (FE), food moisture content (MC) and assimilation efficiency (AE) from Crocker et al (2000). The value for metabolic water production used was the average value for carbohydrates, fats and proteins (0.0269 ml/kJ). Food intake rate (FIR) was estimated using the equation FIR = (DEE/FE)/((1-(MC/100)) x (AE/100)) where MC and AE are percentages.
Diet Bwt (g)
DEE(kJ/d)
FIR(g/d)
MWP(ml)
FW(ml)
Flux(ml/d)
Insects1 8.19 58.1 10.22 1.56 8.61 10.18Soil invertebrates2 8.19 58.1 22.21 1.56 18.73 20.291 FE = 21.9 kJ/g; MC = 70.5%; AE = 88%2 FE = 19.3 kJ/g; MC = 84.6%; AE = 88%
Using values for food energy content, moisture content and assimilation efficiency from Crocker et al. (2000), estimated flux for a 8.19g shrew feeding on soil invertebrates is 20.29 ml/d. This corresponds closely with the reported mean efflux rate of 20.24 ml/d in Ochocinska and Taylor (2005) and might suggest that this alone could explain such a high value for water flux. However, the same publication cites unpublished data indicating that captive shrews ingesting 11.6g of water in food also drank 6.2g of water. This combined with an estimated metabolic water production of 1.2g suggested a water flux of 19.0g which is close to the measured flux in the field. Pernetta (1976) also reported that captive shrews (Sorex araneus and Sorex minutus) died within a few days of being deprived of drinking water. The same study reports data for another shrew species (the lesser white-toothed shrew, Crocidura suaveolens) that shows a reduction in food intake and bodyweight in the absence of water. This would suggest that the measured water flux could also be explained by an arthropod diet (which would correspond with the 71% estimate for food water content) combined with the ingestion of liquid water either while drinking, grooming wet fur or along with wet food. This would suggest that the measured value should be used to estimate water flux for shrews regardless of the suspected diet. In this respect shrews appear to differ from other similar sized species in the same way as they do for energy expenditure. For example, the measured DEE for this species (58.1kJ/d) is around twice the value of 29.3kJ/d for a 8.19g animal that is estimated using the appropriate allometric equation from PS2330.
For other species with more varied diets in terms of water content, such as wood mice, we have already seen that measured water flux can vary greatly. In this case the measured value selected would depend on the diet being considered. In most cases involving risk assessment on arable fields, the seeds and plant material value would seem to be most appropriate.
Recommendations
Estimations of drinking water requirements should be conducted as suggested for birds in project PS2330 and EFSA (2008) using the appropriate data in Table 2 to estimate water flux. Where published data for water flux is available for the species of concern at an appropriate time of year when diet is likely to be similar to the diet being considered, this should be used. At present very little such data exists for species found in the UK and most of what has been found was not measured under UK conditions.
SID 5 (Rev. 3/06) Page 17 of 19
The lack of measured values for UK species in agricultural habitats means that there is a research need for further DLW studies to obtain measurements of water flux and DEE that can be used directly in risk assessment. The disparity between the measured and estimated water flux for shrews highlights this need.
References to published material9. This section should be used to record links (hypertext links where possible) or references to other
published material generated by, or relating to this project.
SID 5 (Rev. 3/06) Page 18 of 19
Corp N, Gorman M L and Speakman J R (1999) Daily energy expenditure of free-living male wood mice in different habitats and seasons. Functional Ecology 13:585-593
Crocker D, Hart A, Gurney J and McCoy C. (2002) Methods for estimating daily food intake of wild birds and mammals. http://www.pesticides.gov.uk/uploadedfiles/Web_Assets/PSD/Research_PN0908.pdf
EFSA (2008) Scientific Opinion of the Panel on Plant protection products and their residues on a request from the EFSA PRAPeR Unit on risk assessment for birds and mammals. The EFSA Journal 734:1-181
Green B, Dunsmore J, Bults H and Newgrain K (1978) Turnover of sodium and water by free-living rabbits (Oryctolagus cuniculus). Australian Wildlife Research 5:93-99Richards (1979)
Haggarty P, Robinson J J, Ashton J, Milne E, Adam C L, Kyle C E , Christie S L and Midwood A J (1998) Estimation of energy expenditure in free-living red deer (Cervus elaphus) with the doubly-labelled water method. British Journal of Nutrition 80:263-272.
Mutze G J, Green B and Newgrain K (1991) Water flux and energy use in wild house mice (Mus-domesticus) and the impact of seasonal aridity on breeding and population levels. Oecologia 88:529-538Rowe-Rowe et al. (1989)
Nagy K A and Peterson C C. (1988) Scaling of Water Flux Rate in Animals. University of California Press. Berkeley.
Ochocinska D and Taylor J R E (2005) Living at the physiological limits: Field and maximum metabolic rates of the common shrew (Sorex araneus). Physiological and Biochemical Zoology 78:808-818.
Pernetta J C (1976) Bioenergetics of British shrews in grassland. Acta. Theriol. 21:481-497.
Richards G C (1979) Variation in water turnover by wild rabbits, Oryctolagus cuniculus, in an arid environment, due to season, age group and reproductive condition. Australian Wildlife Research 6:289-296
Rowe-Rowe D T, Green B and Crafford J (1989) Estimated impact of feral house mice on sub-Antarctic invertebrates at Marion Island. Polar Biology 9:457-460
Schmidt-Nielsen K (1979) Animal Physiology: Adaptation and Environment. Cambridge University Press. London.
Winstanley R K, Buttemer W A and Saunders G (2003) Field metabolic rate and body water turnover of the red fox Vulpes vulpes in Australia. Mammal Review 33:295-301
SID 5 (Rev. 3/06) Page 19 of 19