gene profile in the spleen under massive partial hepatectomy using complementary dna microarray and...
TRANSCRIPT

Arakawa Y. et al.
This article is protected by copyright. All rights reserved.
1
Article type: Original Article - Hepatology (Experimental)
Received date: 28-Sep-2013
Accepted date: 24-Feb-2014
Original article
The gene profile in the spleen under massive partial
hepatectomy using cDNA microarray and pathway analysis 1
Running title: expression and change of splenic genes after hepatectomy
Key words: EGR1, GRO1, microarray, massive hepatectomy, splenectomy
Yusuke Arakawa, Mitsuo Shimada, Tohru Utsunomiya, Satoru Imura,
Yuji Morine, Tetsuya Ikemoto, Hiroki Mori, Mami Kanamoto, Shuichi
Iwahashi, Yu Saito, Chie Takasu
From the Department of Surgery, Institute of Health Biosciences,
The University of Tokushima, 3-18-15 Kuramoto-cho, Tokushima 770-8503, JAPAN
Correspondence and reprint requests:
YUSUKE ARAKAWA, MD
Assistant Professor, Institute of Health Biosciences, Department of Surgery,
The University of Tokushima Graduate School
3-18-15 Kuramoto, Tokushima. 770-8503 JAPAN.
This article has been accepted for publication and undergone full peer review but has not been through the
copyediting, typesetting, pagination and proofreading process, which may lead to differences between this
version and the Version of Record. Please cite this article as doi: 10.1111/jgh.12573 Acc
epte
d A
rticl
e

Arakawa Y. et al.
This article is protected by copyright. All rights reserved.
2
(Phone) +81-88-633-7137 (FAX) +81-88-631-9698
(E-mail) [email protected]
Abbreviations
hepatectomy (Hx)
complementary DNA (cDNA)
early growth response-1 (EGR1)
Gene ontology (GO)
FBJ murine osteosarcoma (FOS)
Activating transcription factor 3 (ATF3)
Tumor necrosis factor alpha (TNFɑ)
Interferon gamma (IFNγ)
Acc
epte
d A
rticl
e

Arakawa Y. et al.
This article is protected by copyright. All rights reserved.
3
Abstract
Background: In general, the spleen is one of the abdominal organs connected by the portal
system, and a splenectomy improves hepatic functions in the settings of partial hepatectomy
(Hx) for portal hypertensive cases or living donor liver transplantation with excessive portal
vein flow. Those precise mechanisms remain still unclear; therefore, we investigated the
DNA expression profile in the spleen after 90% Hx in rats using cDNA microarray and
pathway analysis.
Methods: mRNAs were prepared from three rat spleens at each time point (0, 3 and 6h
after 90% Hx). Using the gene chip, mRNA was hybridized to Affymetrix GeneChip Rat
Genome 230 2.0 Array (Affymetrix®) and pathway analysis was done with Ingenuity
Pathway Analysis (IPA®).
Results: We determined the 3h or 6h / 0h ratio to assess the influence of Hx, and
cut-off-values were set at more than 2.0-fold or less than 1/2 (0.5)-fold. Chemokine activity
related genes including Cxcl1 (GRO1) and Cxcl2 (MIP-2) related pathway were
up-regulated in the spleen. Also, immediate early response genes including early growth
response-1 (EGR1), FBJ murine osteosarcoma (FOS) and activating transcription factor 3
(ATF3) related pathway were up-regulated in the spleen.
Conclusions: We concluded that in the spleen the expression of numerous inflammatory
related genes would occur after 90% Hx. The spleen could take a harmful role and provide
a negative impact during post Hx phase due to the induction of chemokine and transcription
factors including GRO1 and EGR1. Acc
epte
d A
rticl
e

Arakawa Y. et al.
This article is protected by copyright. All rights reserved.
4
Introduction
The results of hepatobiliary surgeries for malignant tumors such as hepatocellular
carcinoma or bile duct cancer have steadily improved (1, 2); however, liver failure after a
partial hepatectomy (Hx) was still the major cause of morbidity and mortality (3).
It is well recognized that the spleen is one of the abdominal organs, which connected
with the portal system. Kim et al. reported the negative relation between liver and spleen
after Hx (4). In the settings of Hx for portal hypertensive cases or living donor liver
transplantation, it had been reported that a splenectomy induced significant reductions in
excessive portal system pressure, resulting in improving hepatic functions including serum
albumin level, prothrombin time and number of platelets (5-7). Furthermore, recent reports
have suggested that a splenectomy might cause some anti-inflammatory effects in the portal
systems on massive Hx or hepatic ischemia reperfusion injury due to a reduction of the
number of splenic monocytes or macrophages, although the exact mechanism was still
unclear (8). We have previously reported that a splenectomy had beneficial effects owing to
the protection of the hepatocytes by the induction of heat shock proteins in a massive Hx rat
model (9). However, the large “black-box” still remained. No research has focused on what
happened in the spleen after Hx, although many reports and studies mentioned about the
gene profile in the liver under massive Hx (10, 11). This was because that a new study was
needed to be performed in this field to reveal the molecular mechanism and role of the
spleen under that condition.
Nowadays, large-scale gene expression analysis with complementary DNA (cDNA) Acc
epte
d A
rticl
e

Arakawa Y. et al.
This article is protected by copyright. All rights reserved.
5
microarray has been gaining importance in biology and chemistry. The quantity of
information obtained from analysis of the expression of thousands of genes at once not only
created unique opportunities for research but also posed substantial challenges (10). As we
described recently, numerous genes and pathways were expressed in the liver of the rat with
massive Hx using cDNA microarray and pathway analysis (12).
In the current study, the molecular changes in the spleen after massive Hx were
investigated using cDNA microarray and pathway analysis methods.
Acc
epte
d A
rticl
e

Arakawa Y. et al.
This article is protected by copyright. All rights reserved.
6
Materials and Methods
Animals. 6x-week-old male Wister rats, weighing 180-220g were obtained from Charles
River Laboratories (Kanagawa, Japan). Animals were provided with water and standard
laboratory diet for at least 7 days before use. Throughout the experiment, the animals were
maintained behind barriers under controlled conditions and had free access to tap water and
food before and after operation. The experiments and procedures were approved by the
Animal Care and Use Committee of the University of Tokushima.
Experimental protocols. Animals were randomly divided into following three groups (n=3,
each); sham operation group, 3h after 90% partial Hx (3h group) and 6h after 90% Hx (6h
group). Surgeries were performed under ether anesthesia. In sham operation group, mouse
underwent only simple laparotomy without hepatic resection. Hepatic resection was
performed according to the technique of Higgins and Anderson (9). Then splenic artery and
vein were ligated with 4-0 silk and spleen was removed from the abdominal space after the
hepatic resection was performed. Consecutively, animals were sacrificed at 3 and 6h after
surgery. Immediately before the sacrifice, the spleens for further study were obtained.
RNA isolation and purification. Total RNA was isolated from frozen spleens manually by
Trizol reagent (Invitrogen Corporation, Carls bad, California, USA) (13) and then purified
using RNeasy Mini Kit (QIAGEN, Inc, Valencia, CA, USA, Cat.No.74106.) (14). Total
RNA samples concentration and purity were examined and estimated by optical density Acc
epte
d A
rticl
e

Arakawa Y. et al.
This article is protected by copyright. All rights reserved.
7
measurements at 260/280 nm (NanoDrop, ND-1000 Spectrophotometer, NanoDrop
Technologies, Inc, Wilmington, DE, USA). After RNA extraction, equal amounts of
samples from three rats were mixed together in each group for further microarray analysis.
Preparation of sample and gene chip analysis. We committed Bio Matrix Research Inc
(105 Higashifukai, Nagareyama-shi, 270-0101 Chiba, Japan) to the cDNA microarray.
Isolated total RNA were amplified and labeled as described in the GeneChip Expression
Analysis Technical Manual (Affymetrix, Santa Clara, CA). First, total RNA (1 µg) was
converted into double-stranded cDNA using the One-Cycle cDNA Synthesis Kit
(Affymetrix). Double-stranded cDNA was purified by using a GeneChip Sample Cleanup
Module (Affymetrix). In vitro transcription reactions were performed using a GeneChip
IVT Labeling Kit, which includes T7 RNA polymerase and Biotin-labeled ribonucleotides.
Biotin-labeled cRNA was purified using a GeneChip Sample Cleanup Module. The
concentration of cRNA was calculated from light absorbance at 260 nm using a UV
spectrophotometer. Next, cRNA (15 µg) was fragmented at 94°C in the presence of a
fragmentation buffer (Affymetrix). Fifteen micrograms of the cRNA was hybridized to
Affymetrix GeneChip Rat Genome 230 2.0 Array (Affymetrix). The array was incubated
for 16 hr at 45°C, then automatically washed and stained with GeneChip Hybridization,
Wash and Stain Kit (Affymetrix). The Probe Array was scanned using a GeneChip Scanner
3000 7G. The data was analyzed with Microarray Suite version 5.0 (MAS 5.0).
Acc
epte
d A
rticl
e
Arakawa Y. et al.
This article is protected by copyright. All rights reserved.
8
Normalization and analysis of microarray data. Further analysis was carried out with
GeneSpring®7.3.1 (Agilent Technologies, Palo Alto, CA). Additionally, gene function was
evaluated using web tools. In per-chip normalization, a raw intensity value was divided by
the median value of the chip measurements. In per-gene normalization, each gene was
normalized to the respective control, to enable of relative changes in gene expression levels
between samples.
Then the normalized signal values and the fold changes of 3h or 6h group / sham group
could be obtained. Cut-off-values were set at more than 2.0-fold or less than 1/2 (0.5)-fold.
IPA pathway analysis. The Ingenuity Pathway Analysis (IPA) application (Ingenuity
Systems, Mountain View, CA, USA) was used to organize differentially expressed genes
into networks of interacting genes and to identify modules of functionally related genes that
correspond to pathways. A detailed description is given in the online repository
(http://www.ingenuity.com).
Quantitative real time polymerase chain reaction (PCR) for Egr1. After that, the
mRNA expression level of early growth response-1 (EGR1) was evaluated by Quantitative
real time PCR. Total RNA was extracted from 30mg of rat liver and spleen tissue using
RNeasy Mini Kit (QIAGEN, Inc, Valencia, CA, USA, Cat.No.74106). Quantitative
RT-PCR was performed by using an ABI 7500 Real-time PCR system (PE Applied
Biosystems). TaqMan gene expression systems (PE Applied Biosystems) for EGR1 (assay Acc
epte
d A
rticl
e

Arakawa Y. et al.
This article is protected by copyright. All rights reserved.
9
ID Rn00561138) was used for quantification of mRNA expression of the respective genes.
To normalize, amplification of GAPDH (Taq man ribosomal RNA control reagents, assay
ID Rn9999916) was performed as an endogenous control.
Statistical Analysis. Real time PCR result was presented as mean ± SD and Mann-Whitney
U test was used for statistical analysis. The probability of a relationship between each
biological function and the identified genes was calculated by Fisher’s exact test. A p-value
of less than 0.05 was considered statistically significant.
Acc
epte
d A
rticl
e

Arakawa Y. et al.
This article is protected by copyright. All rights reserved.
10
Results
Microarray Data Analysis and Biostatistics
Microarray data analysis identified 31099 probe sets that were differentially
expressed. Among these, 760 (up-regulated genes: 572, down-regulated genes: 188) after 3h
and 1452 (up-regulated genes: 1018, down-regulated genes: 434) after 6h uniquely known
genes were identified as “post Hx specific genes in the spleen.” Analysis of the these genes
with IPA indicated that the spleen under the massive hepatectomy was likely to have altered
the activities of “disease and disorders pathways”, “Molecular and Cellular Functions”,
“Physiological System Development and Function” and “Tox lists” (Table 1 and 2).
Top Canonical pathway from IPA in spleen
The top ten high level canonical pathways were identified by IPA as being
significantly overrepresented by differentially expressed genes in this dataset. In 3h,
inflammatory response related pathways including “Acute Phase Response Signaling”,
“Hepatic Fibrosis/Hepatic Stellate cell Activation”, “IL-10 signaling” and “IL-6 signaling”
were affected under the massive Hx (Figure 1A). In 6h, inflammatory response related
pathways including “IL-10 signaling”, “IL-6 signaling” and “Hepatic Fibrosis/Hepatic
Stellate cell Activation” were also strongly affected (Figure 1B).
Gene Ontology (GO) analysis on chemokines
The detailed GO analysis revealed that genes of the chemokine activity which has a Acc
epte
d A
rticl
e

Arakawa Y. et al.
This article is protected by copyright. All rights reserved.
11
crucial role in the acute phase response showed significant different patterns between the
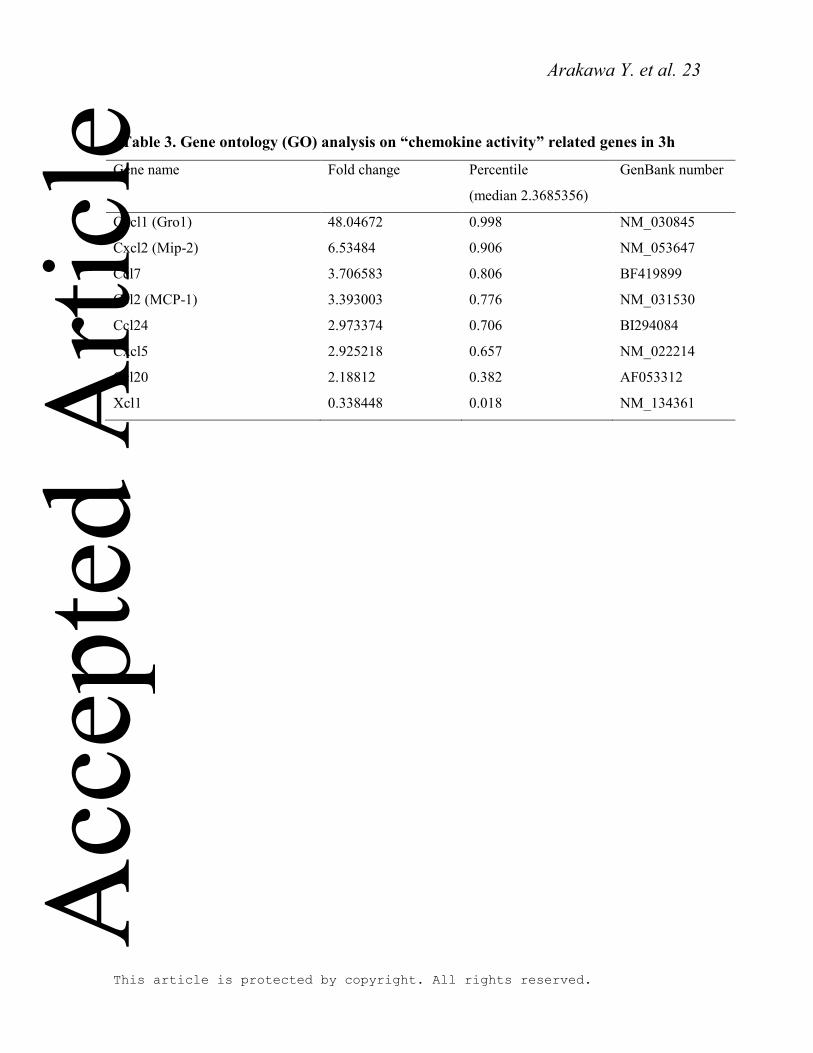
two groups. In GO “chemokine activity”, 8 genes (up-regulated: Cxcl1 (Gro1), Cxcl2
(Mip-2), Ccl7, Ccl2 (MCP-1), Ccl24, Cxcl5 and Ccl20, down-regulated: Xcl1) after 3h and 13
genes (up-regulated: Cxcl1 (Gro1), Ccl2 (MCP-1), Ccl20 (ST38), Cxcl2 (Mip-2), Ccl9, Ccl7,
Cxcl5, Ccl3 (MIP-1a), Ccl4 (Mip1-b), Cxcl9, Ccl6 (Mrp-1), Cxcl10 (IP-10), Ccl22) after 6h
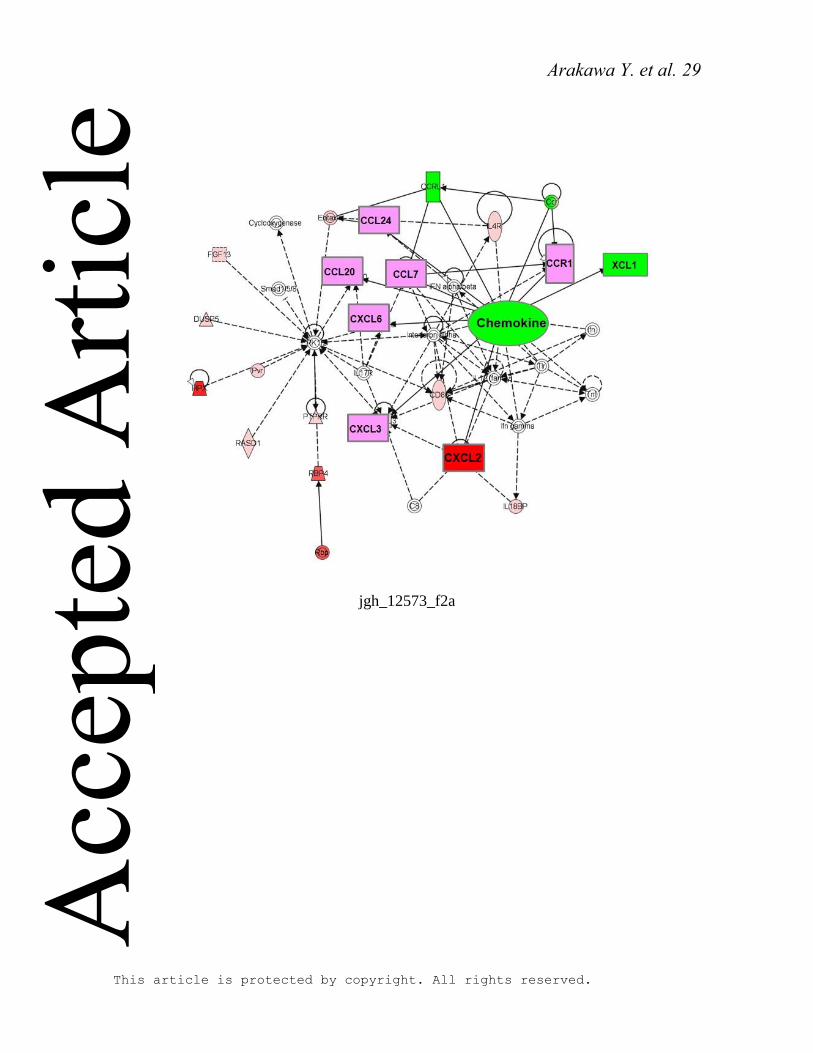
unique genes were isolated (Table 3 and 4). We constructed several networks using these
genes. IPA revealed that chemokine activity formed an acute phase response network of
“chemokine activity.” IPA represented up-regulated (red) and down-regulated (green) genes
in the gene network. This pathway included many kinds of chemokine genes. Interestingly,
all of these genes were up-regulated except XCL1, so this meant these pathways were
up-regulated (Figure 2A, B).
GO analysis on transcription factor
In addition, another GO analysis revealed that genes of the transcription factor
activity which has a crucial role in the acute phase response showed significantly different
patterns between the two groups. In GO “transcriptional factor activity”, 30 genes
(up-regulated: 24, down-regulated: 6) after 3h and 56 (up-regulated: 44, down-regulated:
12) after 6h unique genes were isolated (Table 5 and 6). Those genes included key
transcription factors, such as EGR1, FBJ murine osteosarcoma (FOS), Activating
transcription factor 3 (ATF3), JUN and JUN-B belonging to immediately early response
genes. We constructed several networks using these genes. These pathways included these Acc
epte
d A
rticl
e

Arakawa Y. et al.
This article is protected by copyright. All rights reserved.
12
stress response genes (Figure 3A and B). The qRT-PCR showed that in the spleen under
the massive Hx constitutively expressed a higher amount of EGR1 mRNA which was a key
molecule of the pathway (Figure 3C).
Acc
epte
d A
rticl
e

Arakawa Y. et al.
This article is protected by copyright. All rights reserved.
13
Discussion
In general, the major known functions of the spleen were removal of aging
erythrocytes and recycling of iron, elicitation of immunity, removal of blood-borne
microorganism and cellular debris, and a supply of erythrocytes after hemorrhagic shock
(15). In response to inflammation, splenic monocytes such as dendritic cells or
macrophages increased their motility, exited the spleen, accumulated in the injured tissue,
and participated in wound healing (16). The blood flow was significantly lower and
vascular resistances became higher in the spleen after Hx; therefore, the congestion and
ischemia injury might occur in the spleen (17). As a result, it could affect the gene
expression in the spleen. Despite these reports, molecular changes in the spleen after Hx
have not been investigated and reported yet. Remarkably, this was the first report to
investigate the genetic change in the spleen after Hx, so we could know “what happens in
the spleen” expectantly.
First of all, the results of top bio functional gene analysis (Tables 1 and 2) suggested
that the altered genes included inflammatory response, inflammatory disease, cell death,
liver necrosis/cell death and hepatic fibrosis. The results of top canonical pathways (figures
1A and 1B) also suggested that the altered pathways included acute phase response
signaling, hepatic fibrosis/hepatic stellate cell activation and IL-6 signaling. These features
of genes and pathways expression showed an inflammatory response could occur in the
spleen, and they might provide a negative and harmful impact to the liver via the portal vein.
Actually, Kuriyama et al. reported splenectomy could not only decrease the portal vein flow Acc
epte
d A
rticl
e

Arakawa Y. et al.
This article is protected by copyright. All rights reserved.
14
but also induce cytoprotective effect by decreased ET-1 and increased HO-1 (18). Takuya et
al. has also reported the limitation of splenic inflammatory cell recruitment into the liver
was the cytoprotective effect of splenectomy in small-for-size liver transplantation (19).
Furthermore we have already reported gene changes in the liver after 90% Hx and
protective effect of splenectomy (12).
In the current study, we could achieve the investigation or the gene-expression
changes in the rat spleens under the situation of 90% Hx on the two time points. Firstly, we
could find numerous “chemokines” related genes. Along with the accelerated rate of the
discovery of chemokines had come the realization that these molecules not only controlled
hemopoietic cell migration, but also they were involved in a number of other physiological
and pathological processes including induction of either monocytes, macrophages or
fibroblastic cells in inflammation (20). So it was expected that they were one of the triggers
in inflammatory response in the spleen. The message for the chemoattractants Ccl2
(MCP-1), Ccl7, Cxcl2 (MIP-2), Cxcl1 (GRO1), Ccl4 (MIP1-B) and Ccl3 (MIP-1A) were
extremely increasing. Especially, GRO1 showed the highest up-regulation in chemokine
related genes in this study. GRO1 encoding a potent chemoattractant belonging to the CXC
chemokine subfamily was most rapidly and markedly up-regulated after 90% Hx; therefore,
GRO1 played a vital role in acute liver injury after Hx (21). Cxcl4 and Cxcl3 were MIP-1
(macrophage inflammatory protein 1) family, indicating an acute inflammatory host
response at sites of injury mainly by recruiting pro-inflammatory cells, such as T-cell, NK
cell, neutrophil and eosinophil (22). Tumor necrosis factor alpha (TNFɑ) and interferon Acc
epte
d A
rticl
e

Arakawa Y. et al.
This article is protected by copyright. All rights reserved.
15
gamma (IFNγ) were well-known as one of the pro-inflammatory cytokines, also
demonstrating to play a critical role in the liver injury. They formed a pro-inflammatory
cytokine network in this study. Moreover, Cxcl2 (MIP-2) which was induced by TNFɑ was
involved in the recruitment of neutrophils in the development of massive hepatocellular
apoptosis and necrosis (23). These findings implied the gene expressions in the spleen had a
negative impact on the remnant liver after Hx in terms of inducing inflammatory response.
Secondly, “transcription factors,” containing one or more DNA-binding domains
which attached to specific sequences of DNA adjacent to the genes that they regulated
including EGR1, EGR2, FOS, JUNB and ATF3 were up-regulated. JUNB and FOS were
reported as transcription factors on oxidative stress pathways (24). They were primary
immediate-early genes expressed by many cell types in response to cellular stress, and DNA
binding of their heterodimer was modulated by reduction-oxidation of a single conserved
cysteine residue in the DNA-binding domains of the two proteins (25). EGR1 was one of
the zinc-finger transcription factors and up-regulated at 3h and 6h in the current study. It
was reported as a master switch coordinating up-regulation of divergent gene families
related to liver ischemia-reperfusion injury including IL-1β, Cxcl2 (MIP-2), tissue factor
and plasminogen activating inhibitor 1(26). It was also reported that EGR1 had crucial roles
expressed in small-for-size grafts which had a small remnant of the liver after liver
transplantation and was similar to massive Hx (27).
We concluded that in the spleen numerous gene expressions would occur under the
massive Hx which was similar to the small-for-size graft. Based on these results, the spleen Acc
epte
d A
rticl
e

Arakawa Y. et al.
This article is protected by copyright. All rights reserved.
16
could take a harmful role and provide a negative impact in this situation due to inducing
chemokine and transcription factor including GRO1 and EGR1. However, the precise
mechanism is not clear. We did not measure the level of cytokine and transcription factor in
the portal flow. In this microarray analysis the samples in each group were mixed together,
therefore; we couldn’t put SD. So we should interpret these data very carefully. As the
number of samples in this study was also relatively small, a large sample size is needed in
the further study.
Acc
epte
d A
rticl
e

Arakawa Y. et al.
This article is protected by copyright. All rights reserved.
17
Reference
1. Shimada M, Takenaka K, Gion T, Fujiwara Y, Kajiyama K, Maeda T, et al.
Prognosis of recurrent hepatocellular carcinoma: a 10-year surgical experience in Japan.
Gastroenterology. 1996;111(3):720-6.
2. Langer JC, Langer B, Taylor BR, Zeldin R, Cummings B. Carcinoma of the
extrahepatic bile ducts: results of an aggressive surgical approach. Surgery.
1985;98(4):752-9.
3. Morita T, Togo S, Kubota T, Kamimukai N, Nishizuka I, Kobayashi T, et al.
Mechanism of postoperative liver failure after excessive hepatectomy investigated using a
cDNA microarray. Journal of hepato-biliary-pancreatic surgery. 2002;9(3):352-9.
4. Kim SJ, Na GH, Choi HJ, You Y, Kim DG. Effect of donor right hepatectomy on
splenic volume and platelet count for living donor liver transplantation. J Gastrointest Surg.
2013;17(9):1576-83.
5. Shimada M, Ijichi H, Yonemura Y, Harada N, Shiotani S, Ninomiya M, et al. The
impact of splenectomy or splenic artery ligation on the outcome of a living donor adult liver
transplantation using a left lobe graft. Hepato-gastroenterology. 2004;51(57):625-9.
6. Chen XP, Wu ZD, Huang ZY, Qiu FZ. Use of hepatectomy and splenectomy to
treat hepatocellular carcinoma with cirrhotic hypersplenism. The British journal of surgery.
2005;92(3):334-9.
7. Sugawara Y, Yamamoto J, Shimada K, Yamasaki S, Kosuge T, Takayama T, et al.
Splenectomy in patients with hepatocellular carcinoma and hypersplenism. Journal of the
American College of Surgeons. 2000;190(4):446-50.
8. Okuaki Y, Miyazaki H, Zeniya M, Ishikawa T, Ohkawa Y, Tsuno S, et al.
Splenectomy-reduced hepatic injury induced by ischemia/reperfusion in the rat. Liver.
1996;16(3):188-94.
9. Arakawa Y, Shimada M, Uchiyama H, Ikegami T, Yoshizumi T, Imura S, et al.
Beneficial effects of splenectomy on massive hepatectomy model in rats. Hepatol Res.
2009;39(4):391-7.
10. Togo S, Makino H, Kobayashi T, Morita T, Shimizu T, Kubota T, et al.
Mechanism of liver regeneration after partial hepatectomy using mouse cDNA microarray.
Journal of hepatology. 2004;40(3):464-71.
11. Fukuhara Y, Hirasawa A, Li XK, Kawasaki M, Fujino M, Funeshima N, et al.
Gene expression profile in the regenerating rat liver after partial hepatectomy. Journal of
hepatology. 2003;38(6):784-92.
12. Arakawa Y, Shimada M, Utsunomya T, Imura S, Morine Y, Ikemoto T, et al.
Effects of splenectomy on hepatic gene expression profiles after massive hepatectomy in
rats. Journal of gastroenterology and hepatology. 2013;28(10):1669-77.
13. Knepp JH, Geahr MA, Forman MS, Valsamakis A. Comparison of automated and
manual nucleic acid extraction methods for detection of enterovirus RNA. Journal of
clinical microbiology. 2003;41(8):3532-6. Acc
epte
d A
rticl
e

Arakawa Y. et al.
This article is protected by copyright. All rights reserved.
18
14. Nuyts S, Van Mellaert L, Lambin P, Anne J. Efficient isolation of total RNA from
Clostridium without DNA contamination. Journal of microbiological methods.
2001;44(3):235-8.
15. Mebius RE, Kraal G. Structure and function of the spleen. Nature reviews.
2005;5(8):606-16.
16. Swirski FK, Nahrendorf M, Etzrodt M, Wildgruber M, Cortez-Retamozo V,
Panizzi P, et al. Identification of splenic reservoir monocytes and their deployment to
inflammatory sites. Science. 2009;325(5940):612-6.
17. Boermeester MA, Houdijk AP, Straatsburg IH, van Noorden CJ, van Leeuwen PA.
Organ blood flow after partial hepatectomy in rats: modification by endotoxin-neutralizing
bactericidal/permeability-increasing protein (rBPI23). Journal of hepatology.
1999;31(5):905-12.
18. Kuriyama N, Isaji S, Kishiwada M, Ohsawa I, Hamada T, Mizuno S, et al. Dual
cytoprotective effects of splenectomy for small-for-size liver transplantation in rats. Liver
transplantation : official publication of the American Association for the Study of Liver
Diseases and the International Liver Transplantation Society. 2012;18(11):1361-70.
19. Yoichi T, Takayashiki T, Shimizu H, Yoshidome H, Ohtsuka M, Kato A, et al.
Protective effects of simultaneous splenectomy on small-for-size liver graft injury in rat
liver transplantation. Transplant international : official journal of the European Society for
Organ Transplantation. 2013.
20. Rossi D, Zlotnik A. The biology of chemokines and their receptors. Annual review
of immunology. 2000;18:217-42.
21. Kanemura H, Kusumoto K, Miyake H, Tashiro S, Rokutan K, Shimada M.
Geranylgeranylacetone prevents acute liver damage after massive hepatectomy in rats
through suppression of a CXC chemokine GRO1 and induction of heat shock proteins.
Journal of gastrointestinal surgery : official journal of the Society for Surgery of the
Alimentary Tract. 2009;13(1):66-73.
22. Maurer M, von Stebut E. Macrophage inflammatory protein-1. The international
journal of biochemistry & cell biology. 2004;36(10):1882-6.
23. Nakamura K, Okada M, Yoneda M, Takamoto S, Nakade Y, Tamori K, et al.
Macrophage inflammatory protein-2 induced by TNF-alpha plays a pivotal role in
concanavalin A-induced liver injury in mice. Journal of hepatology. 2001;35(2):217-24.
24. Morel Y, Barouki R. Repression of gene expression by oxidative stress. The
Biochemical journal. 1999;342 Pt 3:481-96.
25. Abate C, Patel L, Rauscher FJ, 3rd, Curran T. Redox regulation of fos and jun
DNA-binding activity in vitro. Science. 1990;249(4973):1157-61.
26. Yan SF, Fujita T, Lu J, Okada K, Shan Zou Y, Mackman N, et al. Egr-1, a master
switch coordinating upregulation of divergent gene families underlying ischemic stress.
Nature medicine. 2000;6(12):1355-61.
27. Mori H, Shinohara H, Arakawa Y, Kanemura H, Ikemoto T, Imura S, et al.
Beneficial effects of hyperbaric oxygen pretreatment on massive hepatectomy model in rats.
Transplantation. 2007;84(12):1656-61. Acc
epte
d A
rticl
e

Arakawa Y. et al.
This article is protected by copyright. All rights reserved.
19
Acknowledgements
This study has no financial support.
Acc
epte
d A
rticl
e

Arakawa Y. et al.
This article is protected by copyright. All rights reserved.
20
Figure legends
Figure 1. Canonical pathway analysis with the IPA application showed the pathways of
specific genes in the spleen significantly modified by 90% partial hepatectomy (Hx) using
Fisher’s exact test. The threshold lines represent a p value with 0.05. (A) 3h and (B) 6h
after Hx.
Figure 2. Isolation 90% Hx-induced changes in chemokine networks. Using the chemokine
related genes network. (A) 3h and (B) 6h after Hx. Genes up-regulated and down-regulated
by 2-fold were expressed in red and in green, respectively.
Figure 3. Isolation 90% Hx-induced changes in transcriptional factor networks. Using the
transcription factor related genes including EGR1, ATF3, JUNB and JUN network. (A) 3h
and (B) 6h after Hx. Genes up-regulated and down-regulated by 2-fold were expressed in
red and in green, respectively. The gene-expressions of EGR1 (C) in the spleen were
determined by real-time PCR. GAPDH RNA serves as an endogenous quantity control.
Values were means ± SD. (* p<0.05)
Acc
epte
d A
rticl
e

Arakawa Y. et al.
This article is protected by copyright. All rights reserved.
21
Table 1. The list of top bio functions of the splenic genes in 3h after hepatectomy
P-value # Molecules
Disease and Disorders
Cancer 1.54E-17 167
Inflammatory Response 9.58E-15 96
Organismal Injury and Abnormalities 3.06E-12 62
Dermatological Disease and Conditions 1.72E-10 71
Reproductive System Disease 2.78E-10 86
Molecular and Cellular Functions
Cell Death 3.99E-12 132
Cellular Growth and Proliferation 5.71E-12 145
Cellular Movement 1.89E-11 94
Cellular Development 6.07E-10 129
Cell Morphology 1.73E-08 53
Physiological System Development and Function
Hematological System Development and Function 9.72E-09 88
Immune Cell Trafficking 9.72E-09 59
Tissue Morphology 1.63E-08 75
Organismal Survival 4.00E-08 56
Nervous System Development and Function 2.73E-07 48
Tox Lists
LXR/RXR Activation 1.49E-07 79
Cardiac Hypertrophy 1.28E-06 259
Liver Proliferation 1.42E-06 133
Renal Necrosis/Cell Death 1.92E-06 314
Cardiac Fibrosis 7.64E-06 95
Acc
epte
d A
rticl
e

Arakawa Y. et al.
This article is protected by copyright. All rights reserved.
22
Table 2. The list of top bio functions of the splenic genes in 6h after hepatectomy
P-value # Molecules
Disease and Disorders
Cancer 1.78E-34 343
Inflammatory Response 2.14E-34 205
Inflammatory Disease 1.58E-32 316
Dermatological Diseases and Conditions 2.16E-27 163
Respiratory Disease 2.37E-26 144
Molecular and Cellular Functions
Cellular Movement 1.54E-31 206
Cell-To-Cell Signaling and Interaction 2.53E-31 230
Cell Death 7.95E-26 275
Cellular Growth and Proliferation 1.81E-25 293
Cellular Development 5.08E-21 263
Physiological System Development and Function
Tissue Development 2.53E-31 209
Organismal Survival 4.14E-28 152
Hematological System Development and Function 6.11E-27 209
Immune Cell Trafficking 6.11E-27 153
Tissue Morphology 4.89E-22 142
Tox lists
Cardiac Hypertrophy 3.69E-12 259
Liver Necrosis/Cell Death 4.31E-12 166
Liver Proliferation 1.04E-11 133
LXR/RXR Activation 3.86E-11 79
Hepatic Fibrosis 1.73E-10 85
Acc
epte
d A
rticl
e
Arakawa Y. et al.
This article is protected by copyright. All rights reserved.
23
Table 3. Gene ontology (GO) analysis on “chemokine activity” related genes in 3h
Gene name Fold change Percentile
(median 2.3685356)
GenBank number
Cxcl1 (Gro1) 48.04672 0.998 NM_030845
Cxcl2 (Mip-2) 6.53484 0.906 NM_053647
Ccl7 3.706583 0.806 BF419899
Ccl2 (MCP-1) 3.393003 0.776 NM_031530
Ccl24 2.973374 0.706 BI294084
Cxcl5 2.925218 0.657 NM_022214
Ccl20 2.18812 0.382 AF053312
Xcl1 0.338448 0.018 NM_134361
Acc
epte
d A
rticl
e

Arakawa Y. et al.
This article is protected by copyright. All rights reserved.
24
Table 4. Gene ontology (GO) analysis on “chemokine activity” related genes in 6h
Gene name Fold change Percentile
(median 2.2727032)
GenBank number
Cxcl1 (Gro1) 439.649 1.000 NM_030845
Ccl2 (MCP-1) 70.00393 0.996 NM_031530
Ccl20 (ST38) 62.80219 0.995 AF053312
Cxcl2 (Mip-2) 54.54451 0.995 NM_053647
Ccl9 47.29132 0.992 AI169984
Ccl7 37.39671 0.989 BF419899
Cxcl5 27.58101 0.984 NM_022214
Ccl3 (MIP-1a) 11.08792 0.951 U22414
Ccl4 (Mip1-b) 4.445999 0.845 U06434
Cxcl9 3.993681 0.821 AI044222
Ccl6 (Mrp-1) 2.310009 0.516 BE095824
Cxcl10 (IP-10) 2.304766 0.513 U22520
Ccl22 2.287212 0.506 AF432871
Acc
epte
d A
rticl
e

Arakawa Y. et al.
This article is protected by copyright. All rights reserved.
25
Table 5. Gene ontology (GO) analysis on “transcription factor” related genes in 3h
Gene name Fold change Percentile
(median 2.3685356)
GenBank number
Top 20 genes
RGD1559697_predicted 26.59984 0.992 BE105492
Fos 9.197226 0.943 BF415939
Hit39 8.171527 0.928 AF277902
Crem 6.371599 0.902 NM_017334
Cebpd 6.35065 0.898 BF419200
Phox2a 6.192782 0.895 NM_053869
Ccl7 3.706583 0.806 BF419899
Ccl2 3.393003 0.776 NM_031530
Sox9 3.199223 0.750 AI548994
Ccl24 2.973374 0.706 BI294084
Gadd45g 2.763646 0.657 AI599423
Bhlhb2 2.443606 0.541 AI548256
Nfkbiz_predicted 2.354374 0.492 AI176265
Fkhl18 2.224701 0.401 AI008883
Zfp36l2 2.2081 0.395 AA943730
Fev 2.183003 0.379 U91679
Atf3 2.099832 0.313 NM_012912
Jundp2 2.070742 0.288 NM_053894
Egr1 2.063132 0.279 NM_012551
Mtf1_predicted 2.001628 0.223 BG375691
Acc
epte
d A
rticl
e

Arakawa Y. et al.
This article is protected by copyright. All rights reserved.
26
Table 6. Gene ontology (GO) analysis on “transcription factor” related genes in 6h
Gene name Fold change Percentile
(median 2.2727032)
GenBank number
Top 20 genes
Cebpd 9.097913 0.933 NM_013154
Neurod1 7.304114 0.917 NM_019218
Nfkbiz_predicted 5.75559 0.886 AI176265
Phox2a 5.332282 0.878 NM_053869
Batf_predicted 4.482911 0.848 AA819819
Ccl4 4.445999 0.845 U06434
Cebpb 4.111673 0.829 NM_024125
Fkhl18 3.672931 0.799 AI008883
Egr1 3.628126 0.795 NM_012551
Tfec 3.415391 0.768 L08812
Trim28 3.299043 0.754 BE098563
Fos 3.20988 0.743 BF415939
Gadd45g 3.055698 0.726 AI599423
Junb 3.027802 0.721 NM_021836
Crem 3.015733 0.718 NM_017334
Lhx1 2.862468 0.693 BI282093
Atf3 2.854969 0.691 NM_012912
Zfhx1b 2.729652 0.661 BG377397
Stat3 2.567718 0.620 BE113920
Jundp2 2.49348 0.596 NM_053894
Acc
epte
d A
rticl
e

Arakawa Y. et al.
This article is protected by copyright. All rights reserved.
27
jgh_12573_f1a
Acc
epte
d A
rticl
e

Arakawa Y. et al.
This article is protected by copyright. All rights reserved.
28
jgh_12573_f1b
Acc
epte
d A
rticl
e
Arakawa Y. et al.
This article is protected by copyright. All rights reserved.
29
jgh_12573_f2a
Acc
epte
d A
rticl
e

Arakawa Y. et al.
This article is protected by copyright. All rights reserved.
30
jgh_12573_f2b
Acc
epte
d A
rticl
e

Arakawa Y. et al.
This article is protected by copyright. All rights reserved.
31
jgh_12573_f3a
Acc
epte
d A
rticl
e

Arakawa Y. et al.
This article is protected by copyright. All rights reserved.
32
jgh_12573_f3b
Acc
epte
d A
rticl
e

Arakawa Y. et al.
This article is protected by copyright. All rights reserved.
33
jgh_12573_f3c
Acc
epte
d A
rticl
e