gene expression studies in arabidopsis in response to
TRANSCRIPT

GENE EXPRESSION STUDIES IN ARABIDOPSIS IN RESPONSE TO
SOUTH AFRICAN CASSAVA MOSAIC VIRUS INFECTION UTILIZING
MICROARRAYS
Erica Joanna Pierce
A dissertation submitted to the Faculty of Science, University of the Witwatersrand, Johannesburg, in
fulfillment of the requirements for the degree of Master of Science
Johannesburg, 2005

2 DECLARATION I declare that this dissertation is my own unaided work. It is being submitted for the degree of Master of
Science in the University of the Witwatersrand, Johannesburg. It has not been submitted before for any
degree or examination in any other University.
day of 2005

3 ABSTRACT Cassava Mosaic Disease is the most devastating disease affecting cassava (Manihot esculenta Crantz)
crops worldwide. This disease is associated with eight species of geminiviruses, all belonging to the genus
Begomovirus of the family Geminiviridae. In South Africa, in particular, CMD is caused by South African
cassava mosaic virus (SACMV). Currently, there are no adequate methods for control of this disease as
mechanisms within virus-host interactions are poorly understood. This brings about the need for
development of virus-disease control strategies. This study was therefore conducted to identify the host’s
response to an invading virus. The model plant, Arabidopsis was chosen as it is a well-characterized plant
system, with expression databases readily available as its entire genome has been sequenced. This study
was conducted, firstly, to phenotypically determine if Arabidopsis was resistant or susceptible to SACMV
infection, and secondly, to identify the host’s response to pathogen infection on a molecular level through
gene expression studies utilizing microarrays. Results from the symptomatology study revealed that
Arabidopsis plants were fully symptomatic 28 days post-inoculation, displaying characteristic disease
symptoms such as stunting, yellowing, and leaf deformation. This indicated that Arabidopsis was
susceptible to SACMV infection. Microarray analyses revealed 86 differentially expressed genes, of
which 48 showed up-regulation and 38 down-regulation. Relative quantification real-time PCR was
performed on selected genes to confirm these results. Many up-regulated genes were shown to be
primarily involved in a general stress response induced by the host, whereas those genes that were down-
regulated seemed to be involved in more specific responses to viral invasion, probably a consequence of
suppression of host genes by SACMV to enhance its own replication. The majority of genes identified fell
under the predominant functional categories involved in metabolism, transcription, and transport. To our
knowledge, this is the first study in which a DNA geminivirus has been used in a host-pathogen
interaction utilizing microarrays.

4 ACKNOWLEDGEMENTS
I would like to sincerely thank my supervisor, Professor Christine Rey for her advice, encouragement,
enthusiasm and support throughout the course of this study.
Special thank-you to Daniel Theron and Sally-Ann Walford for their microarray assistance.
I would also like to thank the Council for Scientific and Industrial Research, the National Research
Foundation, and the University of the Witwatersrand Postgraduate Merit Award for the financial support.
Lastly, I would like to thank all my family and friends for their support and encouragement throughout my
studies.

5 CONTENTS DECLARATION……………………………………………………... 2 ABSTRACT…………………………………………………………... 3 ACKNOWLEDGEMENTS…………………………………………... 4 CONTENTS…………………………………………………………... 5 LIST OF FIGURES…………………………………………………... 8 LIST OF TABLES……………………………………………………. 10 LIST OF ABBREVIATIONS………………………………………… 11 CHAPTER ONE – INTRODUCTION 1.1 Importance of Cassava…………………………………………………….. 13
1.2 Constraints to Cassava Production……………………………………….. 15
1.2.1 Pests and Diseases……………………………………………………. 15 1.2.2 Cassava Mosaic Disease (CMD) ……………………………………. 16 1.2.3Geminiviruses………………………………………………………… 17
1.3 Towards Improving Cassava-Based Systems……………………………. 22
1.3.1 Host-Pathogen Interactions…………………………………………. 22 1.3.2 Arabidopsis as a Model Plant System in Host-pathogen
Interactions…………………………………………………………... 28
1.4 Analysis “Tools” for Host-Pathogen Interaction Studies……………….. 31
1.4.1 Analysis of Host-pathogen Interactions through Microarray Technology…………………………………………………………….
31
1.4.2 Agrobacterium-Mediated Gene Transfer (Agroinoculation) of SACMV into Arabidopsis…………………………………………….
36
1.4.3 Validation of Microarray Results through Real-Time RT-PCR…. 36
1.5 Objectives and Specific Aims……………………………………………... 39

6 CHAPTER TWO – METHODS AND MATERIALS 2.1 Plant Growth………………………………………………………………… 40
2.2 Virus Inoculations (Agroinoculation)……………………………………….. 43
2.3 Confirmation of Symptoms…………………………………………………. 44
2.3.1 Total Nucleic Acid Extraction (TNA)………………………………… 44 2.3.2 Polymerase Chain Reaction (PCR)…………………………………....
2.3.3 Absolute Quantitative Real-Time PCR……………………………...... 44 45
2.4 RNA Extractions……………………………………………………………. 45
2.4.1 Purification and Quantification of RNA………………………………. 48 2.4.2 PCR……………………………………………………………………. 48
2.5 Labeling, Hybridization, Scanning and Washing…………………………... 49
2.5.1 Fluorescent Target Preparation………………………………………... 49 2.5.2 Hybridization………………………………………………………….. 50 2.5.3 Target Preparation…………………………………………………….. 50 2.5.4 Washing……………………………………………………………….. 50 2.5.5 Scanning………………………………………………………………. 51
2.6 Data Analysis………………………………………………………………... 51
2.6.1 MIDAS-Normalization………………………………………………... 53 2.6.2 Standard Deviation (SD) Regularization……………………………… 53 2.6.3 Flip-dye Consistency Checking……………………………………….. 53 2.6.4 Virtual Trim…………………………………………………………… 53 2.6.5 MEV – T-test, HCL Clustering and TAIR…………............................. 54
2.7 Validation of Microarray Results Using Real-Time RT-PCR……………… 54

7 CHAPTER THREE – RESULTS 3.1 Symptom Development……………………………………………………... 57
3.2 Confrimation of SACMV Infection…………………………………………. 61
3.2.1 Total Nucleic Acid Extraction (TNA)………………………………… 61 3.2.2 PCR…………………………………………………………………….
3.2.3 Absolute Quantification Real-Time PCR……………………………… 61 62
3.3 RNA Extractions……………………………………………………………. 66
3.3.1 Concentration and Purity Determination……………………………… 66 3.3.2 RNA Formaldehyde Gel Electrophoresis……………………………... 67 3.3.3 PCR…………………………... 67
3.4 Microarrays…………………………………………………………………... 70
3.4.1 Locally Weighted Scatterplot Smoothing (LOWESS) Normalization... 70
3.4.2 Standard Deviation (SD) Regularization……………………………… 73
3.4.3 Flip-Dye Consistency Checking………………………………………. 77
3.4.4 MEV and TAIR………………………………………………………..
79
3.5 Real-time RT-PCR …………………………………………………………. 82

8 CHAPTER FOUR – DISCUSSION………………………………… 85 CHAPTER FIVE – REFERENCES………………………………. 93 LIST OF FIGURES Figure 1.1 (A) A field of healthy cassava plantings, and (B) starchy
cassava roots…………………………………………………… 13
Figure 1.2 Cassava leaves showing the characteristic yellow mosaic patterns, leaf reduction and distortion, as a result of CMD…….
16
Figure 1.3 Bipartite genome organization of begomoviruses (particular species shown is SACMV) …………………………………….
18
Figure 1.4 Interference of geminivirus proteins with host cell pathways…. 19
Figure 2.1 Schematic representation of overall methodology used in this study…………………………………………………………....
41
Figure 2.2 Schematic representation of methodology performed in section (A) showing: Plant Growth, Virus Inoculations, Symptom Development and Symptom Confirmation…………………….
42
Figure 2.3 Schematic representation of methodology performed in section (B) showing: RNA Extractions, Fluorescence-Labeling of cDNA, Hybridization, and Scanning…………………………...
47

9
Figure 2.4 Schematic representation of methodology performed in section (C) showing data analysis using: GenePix version 5.1, MIDAS, MEV, TAIR, and Relative Quantification Real-Time RT-PCR………………………………………………………...
52
Figure 3.1 Showing (A) Healthy N.benthamiana (mock-inoculated control); (B) Infected N.benthamiana. Typical symptoms observed is the stunting of plants; (C) Infected N.benthamiana leaves showing stunting, leaf curling, crinkling, and chlorosis..
58
Figure 3.2 BR1 showing (A) Typical symptom such as stunting of the entire plant; (B) Healthy Arabidopsis; (C) Yellowing and distortion of young SACMV-infected leaves; (D) Leaf deformation……………………………………………………………......
59
Figure 3.3 BR2 showing (A) and (C), Healthy Arabidopsis; (B) and (D) Typical symptom such as stunting of the entire plant; infected plants appear flaccid, diameter of rosettes are smaller than healthy controls and the plants are reduced in height; F) Severely reduced leaf size compared to (E) healthy leaf………...
60
Figure 3.4 BR1 showing a 1% agarose gel of (A) TNA extracted from SACMV-infected Arabidopsis leaf samples and (B) Amplification of the ~550bp CCP fragment from SACMV-infected Arabidopsis leaves…………………………………….
63
Figure 3.5 Figure 3.6
BR2 showing a 1% agarose gel of (A) TNA extracted from SACMV-infected Arabidopsis leaf samples and (B) Amplification of the ~550bp CCP fragment from SACMV-infected Arabidopsis leaves……………………………………. (A) Standard curve obtained from plotting log of known DNA concentrations of plasmid SACMV DNA-A ; (B) 1% Agarose gel………………………………………………………………
64 65
Figure 3.7 BR1 (A) 1% MOPS/Formaldehyde gel electrophoresis of healthy Arabidopsis RNA and B) 1% agarose gel showing band amplification of Arabidopsis DNA using ubiquitin primers………………………………………………………….
68
Figure 3.8 BR2 (A) 1% MOPS/Formaldehyde gel electrophoresis of healthy Arabidopsis RNA and B) 1% agarose gel showing band amplification of Arabidopsis DNA using ubiquitin

10 primers…………………………………………………………. 69
Figure 3.9 BR1 LOWESS pre-(blue) and post (red) normalization ratio-
intensity (RI) plots……………………………………………... 71
Figure 3.10 BR2 LOWESS pre-(blue) and post (red) normalization ratio-intensity (RI) plots……………………………………………...
72
Figure 3.11 BR1 Box Plots displaying the intensity log-ratio distribution for each of the 32 blocks on an array before (pink) and after (green) scale normalization…………………………………….
74
Figure 3.12 BR2 Box Plots displaying the intensity log-ratio distribution for each of the 32 blocks on an array before (pink) and after (green) scale normalization…………………………………….
75
Figure 3.13 Standard deviation (SD) normalization RI plots before SD regularization (Black) and after regularization (Purple) ………
76
Figure 3.14 Flip-dye consistency checking for I(b)/I(a) ratios or (Cy5/Cy3) ratios. Black indicates data before replicate filtering and blue shows filtered data resulting in a better correlation between the flip-dye pair…………………………………………………….
78
Figure 3.15 Figure 3.16
Hierarchical Clustering of 86 differentially expressed Arabidopsis genes……………………………………………... Relative Quantification Real-Time RT-PCR…………………..
81 84
LIST OF TABLES Table 2.1 Primer and Probe Sequences used for Relative Quantification
Real-Time RTPCR…………………………………………….. 56
Table 3.1 RNA concentration and purity determination for each biological replicate……………………………………………..
66

11
Table 3.2 Probability (P) of exceeding the critical value ………………... 79
Table 3.3 Differential up or down-regulated genes in SACMV-infected Arabidopsis based on mean log2 ratios above 0.5 or below 0.5………………………………………………………………
80
Table 3.4 A comparison made between ratios obtained from real-time RT-PCR and microarray analysis…………………………........
83
LIST OF ABBREVIATIONS AA-dUTP amino allyl d-UTP ACMV African cassava mosaic virus avr avirulence BCTV Beet curly top virus BR1 Biological replicate 1 BR2 Biological replicate 2 CaMV Cauliflower mosaic virus CCD charge-coupled device CCP core coat protein cDNA complentary DNA cf confidence factor CMD Cassava Mosaic Disease CMGs Cassava Mosaic Geminiviruses CMV Cucumber mosaic virus CP coat protein CP crossing point CTAB cetyltrimethyl ammonium bromide DD differential display df dispersion factor dsDNA double-stranded DNA EACMV-UG Ugandan variant EST expressed sequence tag ET ethylene EtBr ethidium bromide HCL hierarchical clustering HC-Pro helper component proteinases HR hypersensitive response ISR induced systemic resistance

12 JA jasmonate LOWESS locally weighted linear regression LRR leucine rich repeat MEV MultiExperiment Viewer MHC Microarray high-speed centrifuge MSV Maize streak virus NSP nuclear shuttle protein ORFs open reading frames PCNA proliferating cell nuclear antigen PCR polymerase chain reaction PTGS post-transcriptional gene silencing pRbs retinoblastoma-like tumour suppressor
protein PVX Potato virus X R resistance RBR retinoblastoma related RCR rolling circle replication REn replication enhancer Rep replication protein R-I ratio intensity ROI reactive oxygen intermediate rpm revolutions per minute RT reverse transcription RT room temperature SA salicyclic acid SA South Africa SACMV South African cassava mosaic virus SAR systemic acquired resistance SAGE serial analysis gene expression SD standard deviation siRNAs short interfering RNAs ssDNA single-stranded DNA TAIR The Arabidopsis Information Resource T-DNA transferred DNA TMV Tobacco mosaic virus TNA total nucleic acid TrAP transcriptional activator TR technical replicate TYLCCNV Tomato yellow leaf curl China virus

13
CHAPTER 1
INTRODUCTION
1.1 Importance of Cassava
Cassava, (Manihot esculenta Crantz, Euphorbiaceae), also commonly known as Manioc, Tapioca,
Brazilian arrowroot, and Yuca, is a short-lived perennial, woody shrub that grows up to 5 metres tall, and
produces enlarged tuberous roots (Alleman and Coertze, 1996). It is a major carbohydrate source, well-
known for its starchy root, providing the primary calorie source for over 500 million people in the tropics,
sub-tropical Africa, Asia and Latin America (El-Sharkway, 2004; Olsen, 2004). Cassava has therefore
become the major source of carbohydrates in sub-Saharan Africa and the fourth most important tropical
crop worldwide (Olsen, 2004) (Figure 1.1).
Annually, cassava is able to produce root yields of more than 170 million tons, as it has acreage of more
than 16 million hectares worldwide. During the last 30 years, cassava production has increased 75%
(Anderson et al., 2004). As a monocrop cassava can yield as much as 90 tons of fresh roots per hectare,
under favourable experimental conditions. It is, however, usually grown in poor soils and harsh climates
A B
Figure 1.1 (A) A field of healthy cassava plantings, and (B) starchy cassava roots (IITA, 2001).

14 and in association with other crops, such as maize, beans, or cowpeas. The average yield in tons of fresh
roots per hectare is much lower under these conditions: 9.6 tons worldwide; 7.7 tons in Africa; 12.7 tons
in Latin America; and 12.9 tons in Asia (CIAT, 2001a).
Cassava is generally grown by small-holding farmers as a subsistence crop. It is valued particularly for its
drought tolerance and ability to grow in poor acid soils. It can be safely left in the ground for 7 months to
2 years after planting, providing there is effective security against famine. Furthermore, it is not season-
bound and can be planted and harvested at any time of the year (Nestel, 1980; CIAT, 2001a). After
harvesting, fresh cassava roots are either eaten on the farm, processed for starch extractions, dried for
flour production, roasted for human and/or animal feed, and marketed for consumption. These processed
food products are commonly known as farinha da mandioca in Brazil, gablek in Indonesia, and gari or
foufou in West Africa (El-Sharkway, 2004).
For human food consumption, the cassava root is prepared in many ways, i.e. boiling, baking, frying, as
meal, flour as well as in beer. In West and Central Africa, fresh leaves are eaten as a vegetable. A wide
range of sweet and savoury foods such as crackers, tapioca pearls, noodles, and cheese breads are made
from the starch extracted from cassava roots. When utilized as animal feed, the fresh roots provide a first-
rate source of carbohydrate and the leaves may be used as a protein supplement for cattle. Concentrates of
dried cassava are also used for poultry, pigs, and cattle as well (Alleman and Coertze, 1996). Cassava’s
role varies in different parts of the world. It is grown mainly by women and used mostly for food in sub-
Saharan Africa. As a result, it is an important source of employment and income, since most of the
processing of this crop into food is done on a small scale in rural areas (CIAT, 2001a). In Asia and Latin
America, cassava starch is used in industry in the manufacture of many chemical products such as citric
acid, sorbitol, mannitol, monosodium glutamate, high fructose syrup, glucose, and alcohol. It may also be
used in paper-making, food processing, as a lubricant in oil wells, adhesives and textiles (Alleman and
Coertze, 1996).
The uses of cassava described above have major applications in South Africa (SA). It is the secondary
staple food to maize, and cassava produce is sold by small-holder farmers in provinces such as
Mpumalanga, Limpopo and Kwazulu-Natal. In addition to this, cassava starch is used for paper, wood,

15 textile, pharmaceutical, chemical, corrugated cardboard and mining industries (J. Casey, personal
communication; Mathews, 2000). About 90 000 tons of starch is produced every year for these purposes
in SA (J. Casey, personal communication). Cassava starch could become the preferred source (if
introduced successfully) of glucose production for raw materials as it produces a higher yield per unit area
of land. The yield of cassava fresh tuber per hectare is 10-30 tons whereas maize grains are only 1-7 tons
on dry land. Irrigated cassava tubers produce 30-70 tons per hectare whereas maize grains produce 5-10
tons per hectare (Mathews, 2000). In addition to this, the low protein content of cassava starch makes it
comparatively slightly easier to hydrolyse. SA also utilizes cassava in the making of ethanol where 1 ton
of fresh tuber supplies 180 litres of ethanol, this is less (70 litres) than maize but cassava’s yield per
hectare of available raw material is up to 7-10 tons more than maize. Cassava’s food market is expanding
at a rapid rate with increasing profitability and sustainability of cropping systems of the small-holder
farmers due to its drought tolerance, especially in semi-arid regions of SA (Mathews, 2000).
1.2 Constraints to Cassava Production
1.2.1 Pests and Diseases
The main diseases affecting cassava are cassava bacterial blight, superelongation disease, frog skin
disease and most importantly Cassava Mosaic Disease (CMD). Xanthomonas campestris pv. manihotis is
one of the main biotic constraints in cassava cultivation world-wide causing cassava bacterial blight.
Heavy infestations of bacterial blight can thus destroy the whole crop. Repeated or continual use of
pesticides to prevent subsequent attacks of pests is firstly, environmentally unsound and secondly,
economically prohibited as cassava is grown by subsistence farmers. Cassava is therefore susceptible to
prolonged and repeated attacks from several insect pests due to its long growth period of 8-24 months.
Nematodes are becoming an increasing problem worldwide in severity where crop rotation and fallow
periods are either shortened or abandoned causing losses of up to 98% (Puonti-Kaerlas, 1998). The main
insect pests of cassava in Africa are mealybugs (Phenacoccus manihoti Mat. Ferr.) and green spider mites
(Mononychellus tanajoa Bondar), where green mites cause losses of up to 80% (Dahniya, 1994).
Successful control of the cassava mealybug and green mite has been achieved through stable host-plant
resistance, offering a long-term solution for control, as it may also be used in conjunction with other

16 control measures (Dahniya, 1994). The main attention, however, has been drawn to CMD caused by
geminiviruses. It is the most important disease affecting cassava in Africa and no adequate control for this
disease has been established (Hong et al., 1993).
1.2.2 Cassava Mosaic Disease (CMD)
CMD was first described in Tanzania in 1894, where the causal agent was assumed to be a virus. In 1936,
Storey demonstrated that the disease was transmissible and inferred that a virus was responsible.
However, proof of this theory was not obtained until the 1970`s and 1980`s following isolation and
visualization by electron microscopy of geminivirus particles. In addition, successful mechanical
transmission studies from cassava to the experimental herbaceous host, Nicotiana benthamiana and back
to a susceptible Brazilian cassava cultivar was also achieved (Bock and Woods, 1983). Fulfilling Koch’s
postulates, these isolates were therefore shown to be the cause of CMD (Bock et al., 1978). Characteristic
leaf mosaic patterns, resulting from cassava mosaic geminiviruses (CMGs), are determined at an early
stage of development. The plants are stunted and the leaves are reduced in size, misshapen and twisted
with yellow areas separated by areas of normal green colour. The leaf chlorosis may be paler than normal,
pale yellow or nearly white. The chlorotic areas vary in size from the whole leaflet to small flecks or spots
and are clearly demarcated. Leaflets show either a localized pattern which is often at the base of the leaf or
a uniform mosaic pattern. Secondary effects associated with symptom severity are distortion, reduction in
leaflet size and general growth retardation. Symptoms may vary even for the same plant variety and virus
strain in the same locality due to differences in virus species and strain, sensitivity of the host, plant age,
environmental factors as well as mixed infections (Legg and Thresh, 2000; Hillocks and Thresh, 2001)
(Figure 1.2).
Figure 1.2 Cassava leaves showing the characteristic yellow mosaic patterns, leaf reduction and distortion, as a result of CMD (IITA, 2001).

17 1.2.3 Geminiviruses
Genome Organization of Geminiviruses
Geminiviruses cause several plant diseases of great economic importance. The family, Geminiviridae is
separated into four genera, Mastrevirus, Curtovirus, Topocuvirus and Begomovirus, based on their
biological and molecular properties. These properties include: - genome organization, insect vector taxon
and host range (Gafni and Epel, 2002; Harrison and Robinson, 2002). Mastreviruses infect
monocotyledonous plants mainly (those belonging to the family, Poaceae) and are transmitted by
leafhoppers in a persistent circulative manner. There are about a dozen species in this genus, an example
of which is Maize streak virus (MSV). This virus causes maize streak which is one of the most
economically important plant virus diseases found in Africa. The mastrevirus genome consists of a
monopartite circular, single stranded DNA (ssDNA) molecule of 2.6kb, encoding four proteins: - two on
the viral DNA strand (virion-sense) and two on the complementary strand (Harrison and Robinson, 2002).
Curtoviruses infect dicotyledonous plants and are also transmitted by leafhoppers, namely, the beet
leafhopper, Eutettix tenellus. Beet curly top virus (BCTV) is a type species belonging to this genus which
causes disease in sugar beet and several other crops in North America. Like mastreviruses, curtovirus
genomes consist of ssDNA. The genome is approximately 3kb in size, encoding three proteins in the viral
strand and four proteins in the complementary strand. The genome organization of topocuviruses
resembles that of BCTV but contains only two genes in the viral strand. The only species belonging to this
genus is Tomato pseudo-curly top virus which is transmitted by the treehopper, Micrutalis malleifera, and
occurs in southern United States (Harrison and Robinson, 2002).
Of primary importance in this study is the fourth geminivirus genus, Begomovirus. Begomoviruses infect
dicotyledonous plants and are transmitted by the whitefly, Bemisia tabaci (B. tabaci), in a persistent
circulative manner. B. tabaci is considered to be a species complex occurring worldwide in tropical,
subtropical and warm temperate regions (Harrison and Robinson, 2002). Begomovirus genomes may be
either monopartite (ssDNA A of about 2.6kb) or bipartite (ssDNA A and DNA B each about 2.6-2.8kb in
size) (Gafni and Epel, 2002). The DNA A and DNA B nucleotide sequences in bipartite genomes differ
from one another except for a short “common region” of 200-400 nucleotides that is very similar, even
identical in the two DNAs. This region includes a stem-loop structure (loop containing the nonanucleotide
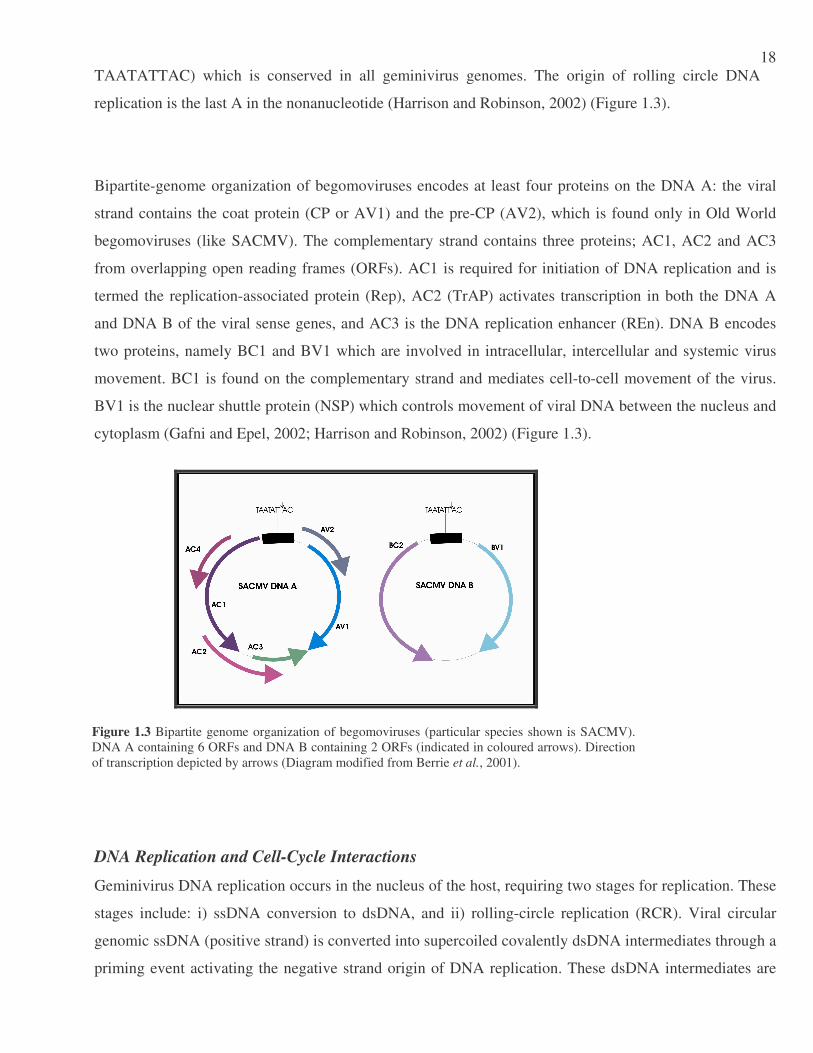
18 TAATATTAC) which is conserved in all geminivirus genomes. The origin of rolling circle DNA
replication is the last A in the nonanucleotide (Harrison and Robinson, 2002) (Figure 1.3).
Bipartite-genome organization of begomoviruses encodes at least four proteins on the DNA A: the viral
strand contains the coat protein (CP or AV1) and the pre-CP (AV2), which is found only in Old World
begomoviruses (like SACMV). The complementary strand contains three proteins; AC1, AC2 and AC3
from overlapping open reading frames (ORFs). AC1 is required for initiation of DNA replication and is
termed the replication-associated protein (Rep), AC2 (TrAP) activates transcription in both the DNA A
and DNA B of the viral sense genes, and AC3 is the DNA replication enhancer (REn). DNA B encodes
two proteins, namely BC1 and BV1 which are involved in intracellular, intercellular and systemic virus
movement. BC1 is found on the complementary strand and mediates cell-to-cell movement of the virus.
BV1 is the nuclear shuttle protein (NSP) which controls movement of viral DNA between the nucleus and
cytoplasm (Gafni and Epel, 2002; Harrison and Robinson, 2002) (Figure 1.3).
DNA Replication and Cell-Cycle Interactions
Geminivirus DNA replication occurs in the nucleus of the host, requiring two stages for replication. These
stages include: i) ssDNA conversion to dsDNA, and ii) rolling-circle replication (RCR). Viral circular
genomic ssDNA (positive strand) is converted into supercoiled covalently dsDNA intermediates through a
priming event activating the negative strand origin of DNA replication. These dsDNA intermediates are
Figure 1.3 Bipartite genome organization of begomoviruses (particular species shown is SACMV). DNA A containing 6 ORFs and DNA B containing 2 ORFs (indicated in coloured arrows). Direction of transcription depicted by arrows (Diagram modified from Berrie et al., 2001).

19 then amplified through a RCR mechanism (Gutierrez, 1999). The initiation site for RCR has been
mapped to the intergenic region which contains an invariant nine nucleotide sequence (TAATATTAC)
which is common among all geminiviruses (Figure 1.3). Viral proteins are expressed from the
transcriptionally active dsDNA forms. Generally, genes encoded on the v-sense have movement and
structural functions whereas those encoded on the c-sense function in DNA replication, regulation of
transcription, and most probably interfere with cellular processes required for replication (Gutierrez et al.,
2004). Viruses require both host cellular factors and machinery for replication, systemic spread as well as
for suppression of antiviral defense mechanisms (Petty et al., 2000).
Geminiviruses have been implicated in many processes such as transcriptional regulation, DNA
replication, control of the cell cycle, cell proliferation and differentiation, and macromolecular trafficking
in whole plants (Gutierrez, 2002). In order to complete infection in a host, geminiviruses need to modify
certain host-cell pathways. Such changes include:- modulation of plasmodesmata structure and function,
host silencing-related defense mechanisms, interactions with proteins such as NAC-domain (NAM,
ATAF1/ATAF2, and CUC2) containing proteins which are involved in growth and development
regulation, host gene expression changes, and retinoblastoma-related (RBR) pathway interference
(Gutierrez, 2002) (Figure 1.4).
Geminiviruses utilize host DNA replication factors such as DNA polymerase in combination with a virus-encoded replication protein (Rep or AC1), for its own replication. Viral and host factors controlling DNA replication, early and late gene expression are thus integrated through activities controlled by the Rep/AC1 protein. The Rep protein is multifunctional in that it is responsible not only for DNA replication
Geminivirus Proteins
Plasmodesmata function
Silencing
Cell differentiation
Gene expression
Cell Cycle
DNA replication
Cell proliferation
Figure 1.4 Interference of geminivirus proteins with host cell pathways (Gutierrez et al., 2004).

20 initiation, binding to the origin, and induction of host replication machinery, but also for regulating its own expression at the transcriptional level and in ATP hydrolysis (Selth et al., 2004).
The Rep/AC1 protein functions by nicking the DNA, once bound to the stem structure at the replication
origin and initiates rolling-circle DNA replication. One problem encountered by geminiviruses is that they
infect terminally differentiated cells at the resting state (G0) which lack factors required for DNA
replication. In order to overcome this problem geminiviruses induce host proliferating cell nuclear antigen
(PCNA) which is a DNA polymerase accessory factor, normally found in the S-phase. Rep/AC1 is
therefore required to induce PCNA. The process involves binding of Rep/AC1 to the viral replication
enhancer (AC3), which then binds to PCNA (Arguello-Astorga et al., 2004). Rep/AC1 in turn, physically
interacts with host encoded retinoblastoma-like tumour suppressor proteins (pRbs). In mammals, the pRB
protein functions as the G1 checkpoint regulator which prevents completion of G1 and entry into the S-
phase. Cyclin-dependent kinases, have phosphorylating activity which stops the cell-cycle inhibition
activity of pRb, therefore allowing progression into S-phase. It is believed that geminivirus Rep proteins
interact with and either inactivate or divert the pRb-like protein in infected cells, allowing S-phase-
specific mRNA production, also providing a pool of factors and enzymes required for viral DNA
replication (Carrington and Whitham, 1998; Gutierrez, 2000; Egelkrout et al., 2002; Kong and Hanley-
Bowdoin, 2002). Plant geminiviruses are therefore analogous to animal DNA tumour-inducing viruses
(such as SV40) and adenoviruss. These viruses also encode proteins which affect cell cycling apparatus
(Carrington and Whitham, 1998).
Post-transcriptional gene silencing (PTGS) is a natural defense mechanism plants have against viruses,
involving a homology-dependent mRNA degradation process (Vanitharani et al., 2004). Several plant
viruses are known to counter antiviral RNA silencing with silencing suppressor proteins. These proteins
interfere with initiation, maintenance, and systemic signalling in the RNA-silencing process. Potyvirus
helper component proteinases (HC-Pro) have been shown to interfere with initiation and maintenance of
silencing where short interfering RNAs (siRNAs) are produced. siRNAs form an active multicomplex
RNA-induced silencing complex which is responsible for homologous RNA cleavage (Vanitharani et al.,
2004). Cucumber mosaic virus (CMV) has been shown to inhibit long-range PTGS-signalling activity,
thereby preventing initiation of PTGS in newly formed tissues. The production of the mobile silencing
signal has also been shown to be suppressed by p25 of Potato virus X (PVX). RNA silencing inhibition by
p19 of tombusviruses was shown to occur through physical interaction of p19 with siRNAs. In

21 geminiviruses in particular, the transcriptional activator protein (TrAp) or Ac2 in both the monopartite
Tomato yellow leaf curl China virus (TYLCCNV) and bipartite African cassava mosaic virus (ACMV),
Kenyan strain (ACMV-[KE]) have been identified as suppressors of PTGS (Vanitharani et al., 2004).
Recombination, Biodiversity and Taxonomy of Begomoviruses
It was suggested that the viruses infecting cassava had separate non-overlapping distributions (Hong et al.,
1993). However, findings on South African cassava mosaic virus and the Ugandan variant (EACMV-UG)
revealed that a greater variability in cassava begomoviruses exists. Apart from transmission by whiteflies,
extensive trafficking of cassava stakes (legally and illegally) has led to multiple introductions of highly
diverse begomoviruses into and around South Africa from neighbouring countries. Movement of infected
stakes therefore increases the possibilities for mixed infections, reassortments, and recombination between
viruses since “new” viruses are introduced into previously uninfected or existing infected areas (Berry and
Rey, 2001). EACMV-UG consists of most of the CP gene of ACMV inserted in an EACMV-like A
component (Zhou et al., 1997). This suggests the occurrence of natural inter- and intraspecies
pseudorecombinations (reassortment of genome components) (Pita et al., 2001). Interspecific
recombination is likely to have occurred in EACMV-UG due to the ability of ACMV and EACMV to co-
infect cassava (Harrison et al., 1997). SACMV on the other hand has shown a close relatedness to
EACMV in both its DNA A (85%) and DNA B (90%) components. The entire AC4 ORF contains a
unique sequence derived from an unknown begomovirus (Berrie et al., 1998). Recombination plays an
important role in the evolution and divergence of begomoviruses, leading to biodiversity of species (Zhou
et al., 1998; Berrie et al., 2001) and therefore an increase in incidence of CMD, resulting in a greater loss
of cassava crops (Fondong et al., 2000).
Currently, there are eight CMG species causing CMD, six African and two Indian. Sequence homologies
between species of begomoviruses have been set at 89%, based on the full DNA A component for each
species (Fauquet et al., 2003). A species is considered to be distinct if its full-length nucleotide sequence
identity is less than 89% (Fauquet et al., 2003). The six African begomovirus species therefore include:
African cassava mosaic virus (ACMV), East African cassava mosaic virus (EACMV), East African
cassava mosaic Cameroon virus (EACMCV), East African cassava mosaic Malawi virus (EACMMV),
East African cassava mosaic Zanzibar virus (EACMZV), and South African cassava mosaic virus
(SACMV), while the two Indian begomoviruses are, Indian cassava mosaic virus (ICMV) and Sri-Lankan
cassava mosaic virus (SLCMV) (Fauquet et al., 2003).

22
According to Trench and Martin (1985), the prevalence of CMD in SA in the early 1980`s was generally
low and controllable with the occurrence of ACMV. However, more recently, commercial growth and
utilization of cassava has increased due to the starch-processing factory construction in the Limpopo
Province. This and whitefly transmission as well as infected cassava stakes has brought about the
prevalence of EACMV, the recombinant EACMV-UG variant, and the more recent SACMV in SA.
Mixed infections and recombination has also caused an increase in symptom severity and greater
incidence of cassava begomoviruses in SA (Berry and Rey, 2001).
1.3 Towards Improving Cassava-Based Systems
1.3.1 Host-Pathogen Interactions
Evolution of Plant-Pathogen Interactions
Close communication between a plant and a pathogen is encountered upon contact between the two
organisms. Generally, plants are able to detect the presence of a pathogen and mount appropriate defense
responses. Pathogens in turn, focus on colonization and utilization of host resources. However, due to the
high co-evolution of plant and pathogen species, a particular pathogen species may circumvent plant
defenses, or plants may adapt in such a way that successful pathogens may be blocked by adaptive
responses. During the infection process, a shifting in the plant’s metabolism results in a mixture of disease
resistance responses and disease susceptibility responses (Wan et al., 2002).
It was proposed that pathogens have evolved virulence on a particular host plant resulting in a compatible
reaction. When a host is able to specifically recognize and resist infection of the pathogen, selection then
favours evolution and spread of the host (i.e. modification of a host receptor to specifically recognize an
avirulent gene product). However, the pathogen may respond by mutating its avirulence gene (becoming
virulent) resulting in susceptibility, with the host requiring new resistance (R) gene specificities for
defense. Gene-for-gene evolution between host and pathogen is therefore constantly evolving with a

23 diverse array of avirulence (avr) genes found in different pathogen races as well as in R genes found in
different host species (Staskawicz et al., 1995).
Plants are able to defend themselves against viruses in a mechanism known as post-transcriptional gene
silencing (PTGS). In turn, viruses are able to suppress PTGS. This was observed in potato virus Y
whereby a helper component proteinase (HC-Pro) blocks PTGS in tissues where silencing has already
been established. On the other hand, viruses such as cucumber mosaic virus (Cmv2b) encoding a 2b
protein is able to prevent PTGS initiation at growing tips of the plant. Both HC-Pro and 2b proteins are
therefore important for virulence and systemic spread throughout the plant. These virus-suppression
mechanisms therefore provide another form of a pathogen overcoming plant defense responses. This
mechanism compares to other pathogens that may accumulate avirulence (avr) genes to escape
recognition from plants in gene-for-gene resistance mechanisms (Li et al., 1999).
In gene for gene resistance, R genes are able to detect specific pathogen races through recognition of Avr
proteins (pathogen-encoded). Some pathogens are therefore able to eliminate these Avr proteins to avoid
detection by the plant, unless required for pathogen fitness (Feys and Parker, 2000).
Resistance (Incompatibility)
Plants are continuously threatened by a vast number of potential pathogens. In order to counter the attack
by pathogens, intricate plant defense mechanisms have evolved to recognize and respond to invading
pathogens (Mysore and Ryu, 2004).
A broad spectrum of plant defense molecules are activated upon pathogen detection. This early response is
controlled by plant disease resistance (R) genes. R genes encode proteins that either directly or indirectly
recognize pathogen Avr proteins in a plant defense mechanism known as gene-for-gene disease resistance.
A host plant that carries an R gene will give the pathogen that carries the corresponding avr gene an
avirulent phenotype (Staskawicz et al., 1995; Bent, 1996; Li et al., 1999; Tang et al., 1999; Feys and
Parker, 2000; Dangl and Jones, 2001; Feys et al., 2001). It has been hypothesized that R proteins “guard”
plant proteins targeted by the pathogen Avr proteins. These R proteins therefore trigger the hypersensistive
response (HR) and other defense related responses upon R-avr detection (Glazebrook, 2001).

24
Induction of the plants defense responses leading to the HR is initiated by elicitor molecules produced by
the pathogen which are recognized by the plant. Upon recognition, a cascade of host genes are activated
leading to induction of the HR (Staskawicz et al., 1995). The HR is associated with rapid necrosis of plant
cells at the site of invasion resulting in local containment of the pathogen, rendering the infection
unsuccessful (Li et al., 1999; Feys and Parker, 2000).
Yu et al. 1998, suggested that defense responses not involved in gene-for gene resistance are often
activated at a lower level without initiation of a programmed HR (cell death). These defense responses are
therefore less effective in preventing pathogen growth. It has been shown that although a strong
association exists between HR cell death and gene-for-gene resistance, gene-for-gene interactions are still
possible without HR cell death. This was observed in an Arabidopsis mutant, dnd1 that did not develop an
HR in response to the avirulent pathogen, P. syringae, while exhibiting gene-for-gene restriction to
pathogen growth. It was therefore suggested that an HR may strengthen, or enhance stimulation in gene-
for-gene interactions, therefore providing more of a complete restriction of pathogen growth (Yu et al.,
1998).
Early changes within the plant associated with localized resistance responses (HR) include:- reactive
oxygen intermediates (ROI) resulting from an oxidative burst, alterations in cell wall structure, signalling
molecule accumulation, nitric oxide (NO) production, endogenous salicyclic acid (SA) increase, and the
transcriptional activation of defense-related genes, including those encoding pathogenesis-related (PR)
proteins (Feys et al., 2001). Similarly, uninfected portions of the plant also establish a heightened
resistance throughout the plant against subsequent challenge. This is known as systemic acquired
resistance (SAR), acting effectively against a broad spectrum of pathogens. SAR is a long-lasting form of
resistance which requires the phenolic signalling molecule, SA. Plants are also able to express a set of PR
proteins during the onset of SAR. Alternatively, a different form of systemic resistance, induced systemic
resistance (ISR), also exists. This form of resistance is independent of SA, requiring plant growth
hormones such as jasmonic acid (JA) and ethylene (ET), which are effective against a broad spectrum of
pathogens (Feys and Parker, 2000). A given pathogen can cause a physiological state of elevated
defensiveness and potentiation of the defense activation machinery by SAR and ISR (related in function

25 but act independently), resulting in stronger and more rapid responses to subsequent infections (Wan et
al., 2002).
There are many examples of avr and R gene specificities found in fungi, bacteria and viruses.
Cladosporium fulvum is an extracellular growing fungal pathogen that contains Avr4 and Avr9 genes
encoding pre-proteins that become small secreted peptides which are able to elicit R gene-dependent
defense responses. The type III secretory system encoded by bacterial Hrp gene cluster (required for HR
induction and pathogenesis) is required for movement of Avr proteins in plant cells and is responsible for
the recognition event of the bacterial avr gene products and corresponding plant R gene products
occurring inside plant cells (Li et al., 1999). Generally, for most cloned bacterial avr genes, the Avr
protein itself is the elicitor which when injected into the plant encodes hydrophilic proteins lacking signal
sequences, not inducing an HR. Viral Avr-R recognition occurs inside plant cells as viruses enter through
existing wounds and replicate intracellularly, encoding genes for replication, movement and
encapsidation. The coat protein, RNA replicase, or movement protein are all avirulence determinants. This
has been observed in tobacco mosaic virus (TMV) in which the Avr protein for which a matching R gene,
N, has been cloned. This N gene has been putatively identified as a cytoplasmic protein belonging to the
nucleotide binding site, leucine rich repeat (NBS-LRR) family of resistance genes (Li et al., 1999). RCY1
has recently been cloned from Arabidopsis ecotype C24 which confers resistance to cucumber mosaic
virus (CMV) strain Y (Takahashi et al., 2002). This gene encodes a CC-NBS-LRR (CC, coiled coil
domain) protein which is allelic to both RPP8 and HRT. RPP8 and HRT have been shown to be resistant
against Peronospora parasitica and turnip crinkle virus (McDowell et al., 1998; Cooley et al., 2000).
Host and Nonhost Resistance
Two types of resistance have been proposed to exist. The first type of resistance is referred to as host
resistance and is cultivar or accession specific. The second type of resistance, a less understood
mechanism is referred to as nonhost resistance which provides resistance against pathogens for all
members of a plant species. A nonhost pathogen therefore is a pathogen that cannot cause disease on a
nonhost plant. The most common and durable form of plant resistance is nonhost resistance of an entire
plant species to a specific parasite or pathogen (Scholthof, 2001). Host resistance therefore involves gene-
for-gene resistance (R-avr) involving products of single R genes specifically acting directly or indirectly
with elicitors produced by avr genes of pathogens. A less understood nonhost resistance is therefore still

26 unclear as to why a fully virulent pathogen on one plant species does not cause disease on others
(Mysore and Ryu, 2004). Nonspecific resistance mechanisms (not mediated by R genes) may therefore
involve pathogens capable of inducing a broad spectrum of defense responses to overcome infection. The
plant environment, however, may not be compatible for the pathogen or may not have sufficient
machinery to enable pathogen growth and spread. This is non-host resistance, restricting the pathogen to a
limited host range (Scholthof, 2001).
Basal Resistance and Tolerance
Another phenomenon in resistant and susceptible responses is that susceptible hosts possess what is called
“basal resistance”, an innate defense response that limits but does not stop pathogen growth. Unlike the
HR in gene-for-gene resistance occurring at the site of infection, this response results in cell death at the
site of infection, which is preceded by a spreading of chlorosis as well as a secondary necrosis in
surrounding, uninfected tissue. As with the resistance responses, susceptible responses also undergo
changes in gene expression such as reactive oxygen (ROS) production and cell wall composition, the only
difference in the susceptible response is that these changes are delayed. Effective resistance is therefore
dependent on the speed in which induced defense reactions occurs in susceptible (compatible) and
resistant (incompatible) interactions (O´Donnell et al., 2003).
This is all dependent on how quickly the pathogen can replicate and cause disease or how fast the plant
may respond with corresponding levels of defenses. Immediate recognition by a plant of an invasive
pathogen (as in gene-for-gene resistance) results in a rapid defense mechanism (such as an HR).
Susceptibility (disease) results when the pathogen recognition is not rapid enough to mount the
appropriate defense responses required to block pathogen infection. After an HR (resistance) or a
successful infection (susceptibility) has been initiated, SAR is induced by the plant to prevent infection
from spreading further or to prevent a secondary infection from occurring, resulting from a broad
spectrum of pathogens (Dong, 1998). It has been hypothesized that the host may therefore suppress
disease in an incompatible response in a regulated manner or alternatively, the host may not immediately
recognize the pathogen and induce effective resistance responses, resulting in disease. Disease symptoms
are not always associated with pathogen growth, thus in the absence of symptoms, pathogen growth may
still be observed in a process referred to as tolerance (O´Donnell et al., 2003).

27
Studies on compatible interactions may explain why certain plants develop mild symptoms (tolerance),
while others suffer severe symptoms sometimes leading to plant death. Most of the disease problems are
caused by systemic infections which explain the need to study compatible interactions in plants and
pathogens (Scholthof, 2001).
Susceptibility (Compatibility)
Virulent pathogens are able to infect particular plant species or cultivars, reinforcing their highly
specialized ability to cause disease. Successful disease formation depends on the pathogen’s ability to
actively suppress or avoid plant defense responses therefore inducing susceptibility in a host that would
normally be either resistant or tolerant to the pathogen (Abramovitch and Martin, 2004). A susceptible
reaction is the result of the plant not being able to detect the pathogen, or if detected, the pathogen is able
to cope with plant defense mechanisms. Alternatively, the response may either not be activated or
activated too late leading to spread of the pathogen (Venisse et al., 2002). Examples of pathogenicity
factors include small molecule suppressors from phytopathogenic fungi, phytopathogenic bacteria
containing type III effectors and toxins, as well as post-transcriptional gene silencing suppression by plant
viruses (Abramovitch and Martin, 2004).
O’Donnell et al. 2003, suggested that a susceptible host plays a vital role in the interaction with a virulent
pathogen due to its participation in basal resistance and disease symptom development. Two signaling
intermediates, ethylene (ET) and salicyclic acid (SA) have been found to play a role in both susceptible
and resistant responses of hosts to pathogens (O´Donnell et al., 2003). Increased levels of ET and SA in
the Arabidopsis Xanthomonas campestris pv. campestris (Xcc) compatible interaction proved that these
two signals are essential in disease symptom production (O´Donnell et al., 2003).
Virus infections in plants
Disease in plants is caused by a compatible interaction between a plant and a virus resulting from the
expression of specific host and viral genes. Disease components in a host-virus interaction can therefore
be studied individually or in combination by exploring genetic variation between the two genomes of both
a plant and pathogen (Cecchini et al., 1998). Susceptibility is the final outcome once a virus has

28 successfully completed genome replication, local cell-to-cell movement and vasculature dependent
long-distance movement in the host plant (Carrington and Whitham, 1998). Disease results when the
preformed plant defenses are inappropriate, the plant does not detect the pathogen, or activated defense
responses are ineffective (Hammond-Kosack and Jones, 1996). Host plant cells therefore do not die but
retain large quantities of virus, thus supporting a complete infection “cycle” and allowing progressive
spread of the virus to adjacent tissue. The appearance of symptoms is the final result of virus infection in
susceptible tissues (Maule et al., 2002). Symptom development requires extensive changes in gene
expression resulting in stunting, vein-clearing, mosaics and chlorosis (Geri et al., 2004). Symptoms
therefore represent structural and physiological changes at the cellular level resulting in whole plant
physiology changes such as reduced growth and development (Maule et al., 2002).
Once viruses have mechanically disrupted the cell wall and plasma membrane, they remain within the
symplast until they move into the plasmodesmata where they continue to infect cells. The virus then
continually moves to adjacent tissue, progressively spreading either to most or even all of the susceptible
tissue, resulting in the appearance of symptoms. Symptoms such as reduced growth and development of
the plant are visible due to the physiological and structural changes in the plant caused by the virus (Maule
et al., 2002).
1.3.2 Arabidopsis as a Model Plant System for Host-Pathogen Interactions
Arabidopsis as a Model Plant System
Arabidopsis thaliana is a member of the mustard family (Cruciferae or Brassicaceae), naturally distributed
throughout Europe, Asia, and North America (Meinke et al., 1998). Arabidopsis has many attributes as a
model plant system. It has a rapid generation time where its entire life cycle is completed in 6 weeks,
starting from seed germination, rosette fromation, main stem and flowering development to seed
maturation. It is small in size, with a rosette diameter ranging from 2 to 10cm with mature plants reaching
15 to 20cm in height (Meinke et al., 1998). Apart from its short generation time and small size, it also has
a high efficiency of transformation, having the smallest genome among higher plant species (125Mb)
(Mysore et al., 2001).

29 The model plant system, Arabidopsis has been chosen in many studies because its’ entire genome has
been sequenced, making expressed sequence tags (ESTs), gene expression databases and cDNA
microarrays readily available. Progress in plant development and physiological response discoveries has
thus been attained which is not possible in less-characterized plant systems (Horvath et al., 2003). For
example, Arabidopsis cDNA microarrays have been used to compare gene expression patterns in non-
model plant systems such as wild oat (Avena fatua), poplar (Populus deltoidsies), and leafy spurge
(Euphorbia esula) to identify common signaling pathways and conserved genes that contribute to
transcriptome functions in less-characterized plant systems (Horvath et al., 2003).
Arabidopsis in Host-Pathogen Interactions
Arabidopsis-virus interactions
Arabidopsis has been used to identify general changes in plant gene expression by a variety of pathogens.
This study investigated changes in gene expression upon induction of five different positive-stranded
RNA viruses. These viruses included: turnip vein clearing tobamovirus (TVCV), oilseed rape tobamovirus
(ORMV), potato virus X potexvirus (PVX), cucumber mosaic cucumovirus (CMV), and turnip mosaic
potyvirus (TuMV). Findings from this study confirmed that plant RNA viruses elicit general plant stress
responses either specifically or non-specifically, causing an increase in stress- and defense-associated
genes. Promoter analysis of co-regulated genes revealed that viruses also may activate uncharacterized
signalling pathways in susceptible hosts leading to the common changes in gene expression (Whitham et
al., 2003).
Gene expression profiles of A. thaliana ecotype Shahdara have been investigated in both inoculated and
systemically Tobacco mosaic virus (TMV) infected leaf tissues, identifying a diverse array of functional
proteins such as transcription factors, antioxidants, metabolic enzymes and transporters (Golem and
Culver, 2003). Arabidopsis has also been used in transgenic studies whereby a viral pathogenic
determinant was transgenically expressed in Arabidopsis in order to develop new strategies for mutant
plant pathogenic loci screening (Geri et al., 1999). Studies involving the geminivirus, Beet curly top virus
(BCTV) were shown to differ in their ability to infect certain ecotypes of Arabidopsis. A series of
reciprocal crosses between the resistant ecotypes Ms-O and Pr-O with the susceptible ecotype Col-O were
carried out. F1 plants from both crosses accumulated viral DNA and developed symptoms, thus indicating

30 that resistance was not due to a dominant gene, but to a single, recessive locus. The primary finding
identified the first single resistance plant locus associated with geminiviruses (Lee et al., 1994).
Bacterial and fungal-Arabidopsis interactions
The transcriptome of Arabidopsis have been investigated after infection with the bacterial pathogen
Pseudomonas syringae pv. tomato, during an HR. This study was conducted in order to relate the changes
observed at four time points, to monitor the change in genes from a housekeeping function to defense
metabolism (Scheideler et al., 2002). Disease resistance responses associated with regulatory pathways
have been monitored in Arabidopsis after inoculation with an incompatible fungal pathogen, Alternaria
brassicicola. Findings illustrated that considerable interactions among these pathways exists, especially
between salicyclic acid (SA) and methyl jasmonate (MJ) (Schenk et al., 2000). Arabidopsis as a model
plant system has therefore contributed widely to the complicated network of biochemical and regulatory
interactions that occur in host-pathogen interactions.
Disease resistance genes in Arabidopsis
Arabidopsis has been extensively used to study the signaling pathways and structural features of resistance
(R) genes. Sequence comparisons have revealed that R genes show extensive conservation in structure, all
containing leucine-rich repeats (LRRs), a protein domain associated with protein-protein interactions, and
ligand binding. Mapping of the Arabidopsis genome has enabled R gene identification based on
interactions with a variety of pathogens. These include: Erysiphe cichoracearum and Erisyphe
cruciferarum (RPW loci), Albugo candida (RAC loci), Peronospora parasitica (RPP loci), caulimovirus
(CAR1) and Pseudomonas syringae (RPS loci). An Arabidopsis CIC-YAC (Yeast Artificial
Chromosome) library was used to identify the position of diseases resistance homologs on the Arabidopsis
genome. Map positions have therefore correlated with the disease resistance loci RPS5, RAC1, RPP5,
CAR1, RPP7, PPW2, RPP1, RPP10, RPP14, RPP5, RPP4, RPS2, RPW6, HRT, RPS4, RPP8, RPP21,
RPP22, RPP23, RPP24 and TTR1. To date, 21 resistance gene loci have been mapped, 12 of which
belonging the RPP loci (Speulman et al., 1998).

31 1.4 Analysis “Tools” for Host-Pathogen Interaction Studies
1.4.1 Analysis of Host-Pathogen Interactions through Microarray Technology
Gene Expression Techniques
Functional roles of gene products are determined through gene expression patterns that vary among
diverse biological processes (Rishi, 2002). In order to understand how gene products function, it is
important to know where and when a gene is expressed and how the expression level is affected. Genes
do, however, have an additive function of working together, therefore expression levels of these large
gene numbers can be monitored through gene expression studies. Microarrays therefore provide insight
into how functional pathways and cellular components work together to regulate and carry out cellular
processes (Lipshutz et al., 1999).
Currently, differential expression between two sets of conditions are carried out utilizing techniques such
as Northern blot analysis, serial analysis of gene expression (SAGE), differential display (DD) and dotblot
analysis (van Hal et al., 2000; Rishi, 2002). The current problem with these techniques is that large
numbers of genes can not be analyzed in parallel. Problems which arise are: a limited number of mRNAs
may only be studied simultaneously using Northern blot analysis. SAGE requires extensive DNA
sequencing which is technically difficult and involves complex sample preparation and is very laborious.
Simultaneous detection of multiple differences in gene expression is possible with DD, however,
screening is not based on identity but in mRNA length. Likewise, this method is not quantitative, allowing
a limited number of conditions for comparative purposes (van Hal et al., 2000).
DNA microarray technology has the potential to overcome these limitations, as differences in mRNA
abundance between two differing sets of conditions are determined simultaneously on a large scale. This
provides valuable information on the regulation and expression patterns of thousands of genes at the
molecular level (Rishi, 2002).

32 Types of Microarrays
Two forms of microarrays exist, namely complementary DNA (cDNA) microarrays and oligonucleotide
microarrays. cDNA microarrays are usually generated from genomic DNA, cDNA libraries or subtracted
library clones, selecting unique clones which are amplified by the polymerase chain reaction (PCR) using
vector-specific primers (Rishi, 2002). Expressed sequence tags (ESTs) are predominantly used in
microarray analysis which consists of partial sequences taken from a cDNA clone corresponding to an
mRNA sequence, ideally 150bp or more (Adams et al., 1991). More than 71% of GenBank entries as well
as 40% of individual nucleotides in the database use ESTs as a source of sequence information (Hegde et
al., 2000).
Oligonucleotide microarrays consist of synthetic oligonucleotides, not more than 80 nucleotides in length.
This small oligonucleotide length enables greater specificity among members of gene families
(Wullschleger and Difazio, 2003). Affymetrix oligonucleotide microarrays consist of 25mer
oligonucleotides, directly synthesized on the array surface in parallel using a process called
photolithography. Internal controls are required for this array as non-specific hybridization patterns may
arise from such a small oligonucleotide array (Rishi, 2002).
Manufacturing of Microarrays
There are two main methods for manufacturing DNA microarrays. Firstly, this consists of a
photolithography based synthesis method of oligonucleotides on a solid surface. High density microarrays
of more than 250 000 spots per cm2 can be manufactured using this method, producing a large number of
identified spots per array. The downfall to this array is that it has no flexibility in design and is expensive
(van Hal et al., 2000). The second method in the manufacturing of DNA microarrays is DNA micro-
dispensing which involves aliquoting a small volume (minimum of 50pl) of DNA solution onto a solid
surface. Micro-dispensing machines may either be active or passive dispensers. The DNA solution in
passive dispensers is applied with multiple pins spotting the surface of the array. Either solenoid valves or
piezoelectric delivery is used in active dispensing where no direct surface contact occurs. The surface for
which DNA sequences are fixed, are either glass or membrane (van Hal et al., 2000). Glass slides used are
either poly-L-Lysine or aminosilane coated (Hegde et al., 2000).

33 Preparation of Microarrays
Microarrays are constructed with DNA sequences immobilized on a glass slide. Sample preparation
entails: cDNA synthesis of two different samples from extracted mRNAs, labeling of the two fluorescent
dyes (usually Cyanine dyes) to the cDNA, and hybridization to the immobilized probes (known cDNA
sequences) on the surface of the array where competitive binding of the cDNA target (unknown, labelled
cDNA) to the probe takes place. The slides are then washed and scanned whereby fluorescence
measurements are made, enabling transcript level ratio determination for each gene on the array (Rishi et
al., 2002; Wullschleger and Difazio, 2003). The abundance of target molecules and/or the binding
efficiency between the probe and target molecules are determined through the strength of signal of each
fluorescent dye which is quantitatively determined through a laser scanner or charge-coupled device
(CCD) (Zhu, 2003). The abundance and/or binding abilities of hundreds to thousands of DNA probes to
complementary DNA or RNA target molecules on a solid surface may therefore be monitored
simultaneously through the use of DNA microarray technology (Zhu, 2003).
Application of Microarrays
cDNA microarrays have become the predominant method of choice in gene expression studies and have
been used in a variety of biological processes (Zhu, 2003). These processes include: plant disease
resistance and environmental stress responses, circadian rhythm maintenance, nitrate assimilation,
photomorphogenesis signalling, as well as in fruit and seed development (Aharoni and Vorst, 2002;
Donson et al., 2002). A particular study conducted by Horvath et al., 2003 cDNA microarrays were
utilized for species such as wild oat (Avena fatua), poplar (Populus deltoidsies), and leafy spurge
(Euphorbia esula) with limited genomic information. Comparisons of gene expression patterns enabled
identification of common signaling pathways and conserved genes, which was not previously possible
without cDNA microarrays (Horvath et al., 2003).
Additionally, microarrays have been used in many applications involving qualitative differences between
plants exposed to temperature, drought and aluminium toxicity, as well as in spatial and temporal changes
in gene expression associated with fibre and root elongation, in cotton and maize. Studies on plants
response to oxidative stress and metabolic changes induced by carbon dioxide concentrations have also
been carried out through microarray analysis. Global studies of gene expression in plants have also been

34 initiated through the completion of the Arabidopsis thaliana genome sequencing project (Wullschleger
and Difazio, 2003).
Because of the vast amount of data that is generated from gene expression studies, microarrays are used in
a number of different processes. These include annotating genes to functional pathways, analyzing the
biochemical processes leading to a disease state, and gene function identification as possible drug targets
(Reynolds, 2002).
Advantages of gene expression microarrays include: (i) transcript abundance of thousands of genes may
be measured at once; (ii) a tight connection between expression patterns of a gene and gene product exists.
This gene product contributes to fitness due to the fact that genes are expressed in specific cells under
specific conditions; (iii) information from transcript profiling may be obtained from promoters which
control expression of a gene. Therefore, by altering the level of transcription of specific genes,
information such as identity, environment and internal state of a cell may be obtained; (iv) gene
expression studies may also reveal what a cell is composed of from the genes that are expressed in that
cell, gaining insight into underlying biochemical and regulatory systems (Brown and Botstein, 1999).
DNA microarrays therefore allow the simultaneous screening of large gene numbers. A higher sensitivity
is also achieved due to the small size of the array, and a smaller amount of starting material is required for
each array because of this parallel screening of large gene numbers compared to conventional techniques
(van Hal et al., 2000).
1.4.2 Agrobacterium-Mediated Gene Transfer (Agroinoculation) of SACMV into
Arabidopsis
One of the problems encountered by begomoviruses, in particular SACMV, is that they cannot be
transmitted mechanically by rubbing healthy plants with virus-infected leaf sap. This is because, in nature,
SACMV is transmitted by the whitefly, Bemisia tabaci, which delivers the virus directly into the plant’s
vascular system. One approach for virus introduction into a plant host without the use of the insect vector
is by agroinoculation. This is a form of mechanical inoculation in which Agrobacterium tumefaciens cells

35 are transformed with a full-length copy of the virus genome which is injected into the plant (Leiser et
al., 1992; Mayo et al., 2000).
Agrobacterium tumefaciens is a soil-born pathogen well-known for its ability for trans-kingdom DNA
transfer (Ward and Zambryski, 2001; Eckardt, 2004). Besides its natural ability to transform host plants
with foreign DNA, it also causes crown gall disease on several important crop species such as grapevines,
stone fruit, and nut trees (Eckardt, 2004).
Agrobacterium has a tumour-inducing (Ti) plasmid which contains a specific DNA fragment called
transferred DNA (T-DNA), which is delimited by a left and right T-DNA border (25bp direct repeats)
(Tzfira and Citovsky, 2002). It is within this T-DNA region that foreign DNA is inserted which is then
transferred to the plant cell and integrated into the plant genome (de la Riva, 1998). The process involves
Agrobacterium VirD1 and VirD2 proteins which are induced by host signals where both T-DNA borders
are nicked, resulting in a single stranded transfer strand (T-strand). A channel is then formed by the VirD4
and VirB4 proteins where the T-strand and several Vir proteins are exported into the cytoplasm of the host
cell. Once integrated, a T-DNA transport complex (T-complex) is formed consisting of one VirD2
molecule covalently attached to the 5´end of the T-strand (coated with many VirE2 molecules), which is
then translocated into the host nucleus with the aid of VirD2 and VirE2 proteins. This entire process
requires both host factors and bacterial Vir proteins for successful transformation of plant cells (Tzfira and
Citovsky, 2002).
Two different strategies are utilized for foreign gene introduction into the T-DNA region. These involve
an indirect method of cloning whereby the gene of interest in cis is cloned on the same plasmid as the vir
genes (co-integrative vectors); or the gene of interest is cloned into the T-DNA region on a separate
plasmid from the vir genes (trans-acting vir genes), also known as binary vectors (Gelvin, 2003).
Grimsley et al. 1996, were the first to describe a transformation system for dicotyledonous plants with
cloned viral DNA from Agrobacterium tumefaciens to plants via the Ti plasmid using Cauliflower mosaic
virus (CaMV). This study showed that viral DNA was infectious once excised from the bacterial vector, as

36 it was able to replicate and systemically infect the plant. Geminiviruses have been successfully
introduced using agroinoculation methods into different host tissue types. These include: host leaf discs,
mainly using model plant systems such as Nicotiana spp., germinating seeds, and whole plants, based on
direct injection of transformed bacterial cultures into the plant vascular system (Pico et al., 2001).
It has been documented in many studies that cloned geminivirus DNAs are infectious as tandemly
repeated copies present on a Ti plasmid and delivered into plants via agroinoculation (Grimsley et al.,
1986; Hayes et al., 1988; Stenger et al., 1990). Geminiviral partial tandem repeats are constructed and
inserted into the T-DNA region of a binary vector. This construct is then introduced into A.tumefaciens
and released into the plant genome through mechanism described previously (Jacob et al., 2003). The
release of infectious unit-length circular replicative viral genomes into plants from the partial tandem
repeats may be explained by two mechanisms. Either intramolecular homologous recombination within
the tandem viral genome repeats which result from a single cross-over event (occurring at random
locations) leads to the release of circular dsDNA (Stenger et al., 1991), or consequently, when the viral
origin of replication is duplicated, the viral replication-associated protein replicates the full-length viral
genome from the T-DNA region containing the partial tandem repeat portion (Stenger et al., 1991).
Agroinoculation has also been used to infect dicotyledonous plants with African cassava mosaic virus
(ACMV) and Tomato golden mosaic virus (TGMV) as well as monocotyledonous plants with Maize
streak virus (MSV), Digitaria streak virus and Wheat dwarf virus. Agroinoculation of Beet curly top virus
(BCTV) has successfully been introduced into N. benthamiana and D. stramonium (Briddon et al., 1989).
Plants where agroinoculation with SACMV have been successful are from the species Phaseolus vulgaris,
Malva parviflora, and cassava (Manihot esculanta Crantz) (Berrie et al., 2001).
1.4.3 Validation of Microarray Results through Real-Time RT-PCR
Comparison of Real-Time RT-PCR to Conventional Quantitative Methods
Differences in gene expression may be validated with methods such as Northern blot hybridization and
RNase protection assays. These methods are however, time- consuming, and require large amounts of
RNA. Another method of choice is reverse transcription (RT) followed by the polymerase chain reaction
(PCR). This method requires a smaller amount of RNA but quantification relies on endpoint analysis of

37 the PCR product. Real-time RT-PCR on the other hand also uses smaller quantities of RNA but product
accumulation is determined during the log-linear (exponential) phase of the reaction (Rajeevan et al.,
2001). Data produced from the log-linear phase is thus more accurate than end-point PCR, and in addition,
constant amplification efficiency is achieved allowing a more precise determination of starting material
(Roche Applied Science Technical Note, www.roche-applied-science.com/lightcycler/). Reliable and
rapid quantification results are thus achieved through its high sensitivity and ability to identify and
quantify small changes in gene expression and rare transcripts (Pfaffl, 2001).
The Process Involved in Quantitative Real-time RT-PCR
RNA is reverse transcribed into single-stranded complementary DNA (cDNA) through the retroviral
enzyme, reverse transcriptase [either Moloney murine leukemia virus (MMLV-RT) or avian
myeoblastosis virus (AMV-RT)]. First strand cDNA synthesis is initiated by an oligonucleotide primer
which anneals to the RNA, where the reverse transcriptase (having RNA dependent DNA polymerase
activity) extends the cDNA toward the 5'end of the mRNA. Primers involved in this process may either be
non-specific such as hexamer primers (which bind to all RNAs present) and deoxythymidine residues
[oligo(dT)] (annealing to the polyadenylated 3' tail on the mRNA) or specific (gene-specific). Sequence-
specific primers are used to increase specificity especially in cases where messages are rare. This
eliminates the possibility of spurious transcripts when elevated RT reaction temperatures are used
(Freeman, 1999).
Once the RNA is reverse transcribed into a single cDNA strand, PCR is carried out in a three step process
involving denaturation, annealing and elongation. Two distinct phases occur during a PCR reaction. This
includes the exponential phase and plateau phase. The exponential phase involves cDNA denaturation,
primer binding and strand extension, occurring in early to middle cycles, lasting from ten to twenty cycles.
The amount of starting material dictates the amount of cycles before a reaction enters the
exponential phase. The plateau phase results when components of the reaction mixture becomes limiting.
This may be due to the competition of cDNA for primers and DNA amplification product concentration
increases to the extent that single-stranded products may re-anneal to each other rather than to the primers.
Inhibitors may also accumulate in this phase, along with a depletion of nucleotides and primers, resulting
in a less predictable quantification reaction (Freeman, 1999). The five major chemistries used in real-time
RT PCR are: - DNA-binding fluorophores, Linear oligoprobes, 5' Nuclease oligoprobes, Hairpin
38 oligoprobes and self-fluorescing amplicon. These may be classified into amplicon sequence specific or
non-specific methods of detection (Mackay et al., 2002).
The fluorescent detection format used in this study was hybridization probes. The naming convention for
“probes” and “targets” are switched for real-time PCR in comparison to microarrays. This probe method is
for specific product identification that uses two oligonucleotide probes, labelled with different marker
dyes (e.g. Fluorescein and LightCycler (LC) -Red 640). These donor and acceptor dyes hybridize to the
target sequences on the amplified DNA fragment in a head-to-tail arrangement. This arrangement results
with the dyes falling in close proximity to each other causing excitation of the donor dye (Fluorescein) by
the external light source (LED source), passing on part of its excitation energy to the acceptor dye (LC-
Red 640). This fluorophore then emits measurable light at a different wavelength at the end of each
annealing step. The hybridization probe is then released during elongation, resulting in a double-stranded
PCR product (Roche Molecular Biochemicals Technical Note, www.roche-applied-
science.com/lightcycler/).
Data Analysis
Data may be analyzed in two ways in quantitative real-time RT-PCR, namely: - absolute quantification
and relative quantification. The exact transcript copy number is determined from absolute quantification
where the input copy number is obtained by relating the PCR signal to a standard curve. Relative
quantification is determined through gene expression changes in a target sample relative to a reference
sample. A reference sample is usually a housekeeping gene (for example, GAPDH, ß-actin, B2-
microglobulin, and rRNA). The purpose of these housekeeping genes is to normalize the PCR samples to
account for the experimental variation in the amount of RNA added to the RT reactions (Livak and
Schmittgen, 2001). A housekeeping gene is an “unchanged” gene that is not differentially expressed (i.e.
neither up-regulated nor down-regulated) throughout the plant genome.

39 1.5 Objectives and Specific Aims
Geminiviruses are emerging plant pathogens, severely affecting important food crops worldwide. In sub-
Saharan Africa, continued movement of infected stakes, recombination, and whiteflies has led to the
introduction of highly diverse begomovirus strains and species (Berry and Rey, 2001). In SA, cassava is
grown by subsistence farmers and also by large-scale commercial farmers for starch production. It does
however, suffer major crop losses due to Cassava Mosaic Disease (CMD) caused by SACMV (Berry and
Rey, 2001). SACMV and plant virus diseases in general are very difficult to control as mechanisms of
virus pathogenicity within a host are poorly understood (Golem and Culver, 2003). This brings about the
need for development of effective virus disease control strategies. Currently, the approach in controlling
SACMV in SA involves pathogen-derived resistance (PDR). This approach involves genetic engineering,
where transgenes containing virus-derived sequences are expressed in crop plants. An alternative to this
approach is to identify the plants response to an invading pathogen, elucidating the basic underlying
mechanisms involved in both resistant and susceptible host responses to pathogens, so that host-derived
genes can be exploited in developing resistant germplasm.
Cassava is not a well characterized plant system due to its large genome of 36 chromosomes. The model
plant system, Arabidopsis, was therefore selected for gene expression studies as its entire genome has
been successfully sequenced, making expression databases and expressed sequence tags (EST’s) readily
available (Horvath et al., 2003).
The overall objective of this study was to identify differentially expressed Arabidopsis genes in
response to SACMV infection using microarrays.
The specific aims of this study were:
(i) To determine if Arabidopsis was resistant or susceptible to SACMV infection on a phenotypic
level.
(ii) To investigate host-pathogen interactions at the molecular level utilizing microarray technology,
since it was previously unknown whether Arabidopsis was a non-host or a susceptible host for
SACMV infection. An infectivity study needed to be conducted to identify differentially
expressed Arabidopsis genes in response to SACMV infection.

40
CHAPTER 2
MATERIALS AND METHODS
Section A-Infectivity Study
An overview of the procedure used in this study can be seen in Figure 2.1, with the methodology
performed for Section A shown in Figure 2.2.
2.1 Plant Growth
Arabidopsis thaliana (ecotype Columbia-0) and Nicotiana benthamiana (N. benthamiana) seeds were
planted in seed trays containing thirty peat pellets (Jiffy Products International), covered with plastic wrap
and placed at 4°C for 3 days to eliminate dormancy and ensure uniform germination. These plants were
then transferred to growth chambers (Specht Scientific) operating at 22°C under a 10h photoperiod in a
humid environment at an intensity of 100µ�m-2 sec-1. In order to acclimatize the plants, two-to-three
cuttings were made in the plastic covering ten days after planting. This procedure was repeated daily for
ten days in order to maintain humidity and avoid air flow around the plants. Once acclimatized, the plastic
covering was removed and plants were fertilized and watered as required, until ready for virus
inoculations.

41
Plant Growth
Virus Inoculations Agroinoculation
Symptom Development Resistant or Susceptible
Confirmation of Symptoms Total Nucleic Acid (TNA) Extraction PCR- Core Coat Protein (CCP) Primers Real-Time PCR (AC1) Primers
RNA Extractions Concentration Purity Checking
Degradation Contamination
Microarray Labelling- Cy5 & Cy3 dyes Hybridization- cDNA probe to target Washing Scanning
Data Analysis GenePix-Gridding & Flagging MIDAS-Normalization MEV-T-Test & HCL Clustering TAIR-Gene Annotation & Function
Validation of Microarray Results Relative Quantification Real-Time RT-PCR
Figure 2.1 Schematic representation of overall methodology used in this study
A
B
C

42
Arabidopsis Plant Growth
Virus Inoculations (Agroinoculation) SACMV Dimers
Symptom Development Resistant OR Susceptible
Confirmation of Symptoms TNA Extraction PCR (CCP Primers) Real-Time PCR
- - -
- - - -
Agrobacterium tumefaciens
DNA A DNA B
Figure 2.2 Schematic representation of methodology performed in section (A) showing: Plant Growth, Virus Inoculations, Symptom Development and Symptom Confirmation
A
Inject into crown of rosette
43 2.2 Virus Inoculations (Agroinoculation) Five-week-old Arabidopsis plants were co-inoculated with 23-24µl of full-length head-to-tail SACMV
DNA A and DNA B dimers, mobilized into Agrobacterium tumefaciens strain C58C1 (pMP90)
(constructed by L.Berrie) by the adapted agroinoculation method of Hayes et al. 1988, injected into the
crown of the rosette. Two Agrobacterium cultures (one containing SACMV DNA A and the other
SACMV DNA B) were incubated at 30ºC until an optical density (OD) of ± 0.4 was reached. One
milliliter aliquots of each culture was pelleted at 8000 rpm, washed in sterile water, and spun at 8000 rpm.
Each culture was then resuspended in 200�l Luria Bertani Broth and mixed together. Two biological
replicates were conducted, in each biological replicate, sixty Arabidopsis and ten tobacco (N.
benthamiana) plants were inoculated at the ten- to-twelve leaf stage using a Hamilton syringe. Control
plants were mock-inoculated with filtered sterilized water (negative control). Tobacco plants (positive
control) were inoculated with 10µl of virus suspension three times along the stem from bottom to top.
It was imperative that consistency between biological replicates was maintained, therefore virus
inoculations and harvesting of leaves were done at the same time of day (differences in gene expression
will be observed between replicates if consistency is not maintained).

44 2.3 Confirmation of Symptoms
2.3.1 Total Nucleic Acid Extraction (TNA)
TNA was extracted from symptomatic Arabidopsis plants according to the CTAB
(cetyltrimethylammonium bromide) method of Doyle and Doyle (1987). Fifty milligram young leaf
samples were ground in liquid nitrogen and TNA was extracted by the addition of 0.5ml pre-heated CTAB
extraction buffer (2% CTAB, 20mM EDTA, 1.4M NaCl, 100mM Tris pH 8.0) and �-mercaptoethanol (to
a final concentration of 0.1% v/v). The aqueous layer containing the TNA was extracted using
chloroform:isoamyl (24:1) in a two step process and the nucleic acids precipitated with an equal volume
of isopropanol. The pellet was then washed with 70% ice-cold ethanol, vacuum dried and resuspended in
12�l 1XTE buffer (10mM Tris pH 8.0, 1mM EDTA) containing 20�g/ml RNase A. TNA extractions were
then examined and viewed for concentration determination by electrophoresis on a 1% agarose gel run at
80V.
2.3.2 Polymerase Chain Reaction (PCR)
PCR using degenerate core coat protein (CCP) primers was carried out in order to confirm SACMV
infection in Arabidopsis plants. The CCP primers consisted of the following sequences: AC1048
(5�GGRTTDGARGCATGHGTACATG3�) and AV514 (5�GCCCWTGTAYAGRAAGCCMAG3�) (Wyatt
and Brown, 1996). Between 40-90ng TNA was added to each reaction consisting of 2.5mM MgCl2,
200�M of each dNTP, 0.001% gelatin, 0.5% Tween-20, 0.1 volumes Taq buffer and 2.5 units Taq DNA
polymerase (Roche) of which 20pmoles of each primer was added, making up a final reaction volume of
50�l. Amplification was carried out utilizing the MyCycler™ Thermal Cycler (Bio-Rad) with cycling
conditions programmed for 1 cycle at 95°C for 5 min, followed by 35 cycles at 95°C for 1 min, 55°C for 1
min, and 72°C for 1 min, this was followed by a 10 min extension at 72°C.

45 2.3.3 Absolute Quantitative Real-Time PCR
A standard curve was constructed using 5 known concentrations (in duplicate) of plasmid SACMV DNA
A. Copy numbers of the standards were calculated, (Xg/µl DNA / [plasmid length in basepairs x 660]) x
Avogadros’s number x 10-12. Standard curves based on Crossing Points cycles (CP) for a 10-fold dilution
series ranged from 1.54x10⁸ molecules/µl to 1.54x10⁴ molecules/µl. Plasmid DNA A and total nucleic
acid (TNA) samples extracted from Arabidopsis leaf tissues at 13dpi and 35dpi were quantified on the
LightCycler (Roche Applied Science) using Quant-iT™ PicoGreen® dsDNA Reagent (Invitrogen). The
primer pair; (5� GGC TAG TTC CCG GAT TAC AT 3�; 5� GAC AAG GAC GGA GAC ACC 3�) was
designed to bind to a 150bp region of the AC1 gene on SACMV DNA A. Quantitative PCR was
performed using the LightCycler® FastStart DNA Master SYBR Green I kit (Roche Applied Science).
Each sample was prepared in LightCycler capillaries containing an optimal MgCl2 concentration of 4mM,
0.5µM of each primer, and 2µl of LightCycler FastStart DNA Master SYBR Green I (10x conc), and 2µl
sample DNA. Cycling conditions consisted of an activation mode of 95°C for 10 min. Then 32
amplification cycles run at 95°C for 5 sec, 60°C for 10 sec, and 72°C for 10 sec for a single acquisition
(fluorescence detection at 520nm at the end of the elongation phase for each cycle). A melting curve was
then performed by heating to 95°C, cooling to 65°C for 30 sec, and slowly heating to 95°C at 0.1°C/s with
continuous measurement of fluorescence at 520nm. A final cooling step was carried out at 40°C for 10
sec.
Section B-Microarrays
A schematic overview of methodology performed for Section B may be seen in Figure 2.3.
2.4 RNA Extractions
Two independent biological replicates were carried out, each containing four technical replicates. For each
biological replicate, total RNA was extracted from pooled (20 to 25 plants) SACMV-infected and healthy

46 Arabidopsis plants at 35 days post-inoculation (dpi), using Tri® Reagent (Sigma) according to a
modified method originally described by Chomczynski and Sacchi (1987).
One gram of plant tissue was ground in liquid nitrogen with a mortar and pestle and transferred to a 15ml
solution containing Tri® Reagent (Sigma). Samples were then incubated at 60°C for 5 min followed by
centrifugation at 8750 rpm for 10 min at 4°C. The supernatant was then treated with 3 ml of chloroform,
vortexed for 15 sec, left at room temperature (RT) for 2-3 min and centrifuged at 8100 rpm at 4°C for 15
min. The aqueous phase was carefully pipetted into a clean screw-cap centrifuge tube and precipitated by
adding isopropanol and 0.8M Sodium Citrate/1.2M NaCl, half volume of aqueous phase of each. The
tubes were then mixed by gentle inversion and incubated for 19 min at RT, followed by another
centrifugation step at 8100 rpm for 10 min. The RNA pellet was washed with 75% ethanol, centrifuged at
8100 rpm at 4°C for 10 min and resuspended in 100µl of sterile water (Sabax water for injections, Adcock
Ingram) containing 1µl (20U/µl) RNase Inhibitor (SUPERase.In™, Ambion).
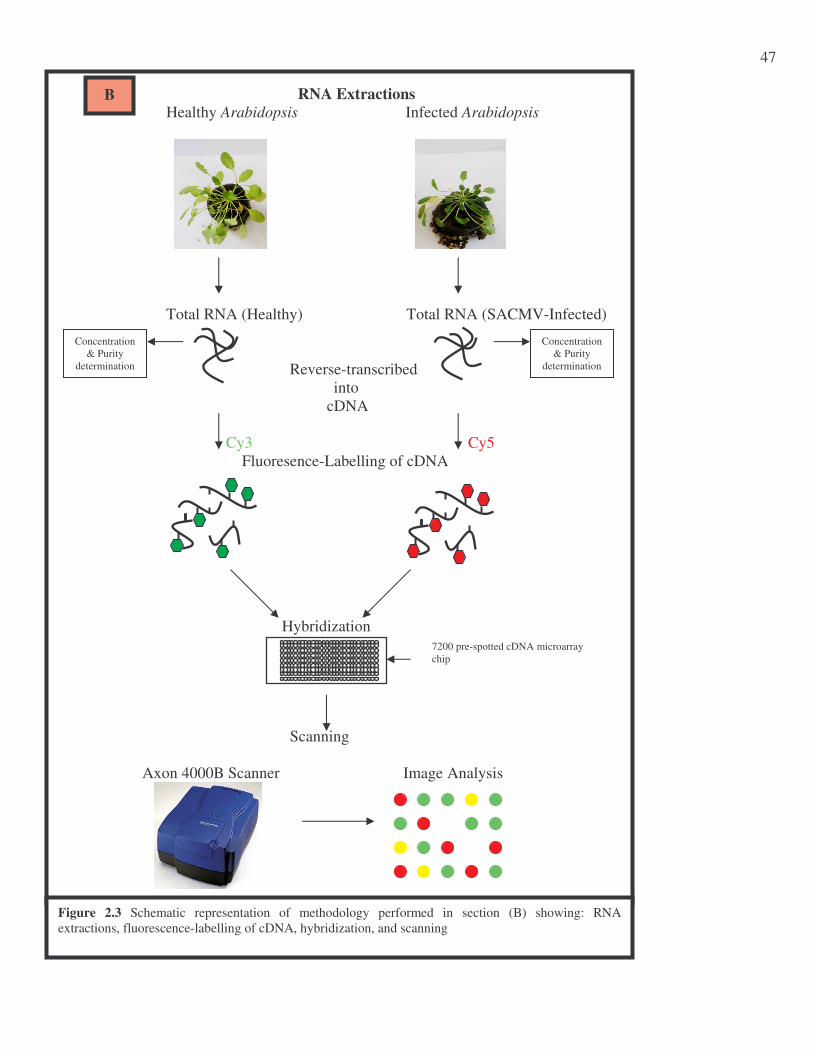
47
RNA Extractions Healthy Arabidopsis Infected Arabidopsis
Total RNA (Healthy) Total RNA (SACMV-Infected) Reverse-transcribed into cDNA Cy3 Cy5 Fluoresence-Labelling of cDNA Hybridization Scanning Axon 4000B Scanner Image Analysis
7200 pre-spotted cDNA microarray chip
Concentration & Purity
determination
Concentration & Purity
determination
Figure 2.3 Schematic representation of methodology performed in section (B) showing: RNA extractions, fluorescence-labelling of cDNA, hybridization, and scanning
B

48 2.4.1 Purification and Quantification of RNA
In order to purify the RNA samples, the RNeasy Mini Protocol for RNA cleanup (Qiagen) was performed
according to manufacturer’s instructions (RNeasy ® Mini Handbook, Qiagen). For concentration
determination, both healthy and SACMV-infected RNA samples were diluted 500X and measured
spectrophotometrically (Ultraspec 3000, Pharmacia Biotech) using quartz cuvettes to a total volume of
1ml. Purity and concentration readings were taken at A260/A280.
Calculations for spec readings were determined as follows:
Concentration of RNA sample = spectrophotometric conversion X A260 X dilution factor
= x �g/ml
Total yield = concentration X volume of sample in milliliters
= x �g
2.4.2 PCR
In order to determine if contaminating DNA was present in the RNA samples, PCR was carried out using
ubiquitin primers (Inqaba). The ubiqitin primer sequences were designed as follows: - UB Forward
(5�ATTTCTCAAAATCTTAAAAACTT3�) and UB Reverse (5�TGATAGTTTTCCCAGTCAAC3�).
Either 60ng of Arabidopsis TNA (positive control), or 40ng-100ng of RNA samples to be tested were
added to a reaction mixture containing 0.5µM of each primer, 1.5mM MgCl2, 0.5% Tween 20, 0.001%
gelatine, 200µM dNTPs and 2.5U Taq DNA Polymerase (Roche) to make up a final reaction of 50µl.
Amplification was carried out utilizing the MyCycler™ Thermal Cycler (Bio-Rad) with cycling
conditions of DNA denaturation and Taq DNA Polymerase activation for 2 min at 95°C, and then 35
cycles of denaturation for 30 sec at 95°C, annealing for 30 sec at 55°C and extension for 60 sec at 72°C.
The amplification products were examined by electrophoresis on a 1% agarose gel stained with ethidium
bromide (EtBr) to a final concentration of 10µg/µl in a 0.5M TBE (Tris-Borate EDTA) electrophoresis
buffer containing 50µg of EtBr run at 80V.

49 2.5 Labeling, Hybridization, Scanning and Washing
2.5.1 Fluorescent Target Preparation
Pre-spotted Arabidopsis Mendelbio L35 chip sets containing 7200 (6912 samples with 288 repeats) cell-
signalling and some defense-related genes were received from Capar (Cape array opportunities)
(www.capar.uct.ac.za) and stored in a dessicator at RT until ready for use. Fluorescence-labelled cDNA
targets were prepared from SACMV-infected and healthy Arabidopsis total RNA (50�g) by indirect
incorporation of amino allyl-dUTP (AA-dUTP) labelled cyanine dyes (Cy5 and Cy3) using the CyScribe
Post-Labeling Kit (Amersham Biosciences) according to the manufacturer’s instructions.
Briefly, this consisted of a two step process whereby, firstly, AA-dUTP was incorporated into the RNA
template during cDNA synthesis. Unincorporated AA-dUTP was removed and remaining AA-dUTP
cDNA was then purified using the PCR purification kit protocol obtained from the QIAquick® Spin
Handbook (Qiagen). Modifications to the protocol involved replacing the phosphate wash (PB) buffer
(Qiagen supplied) with a freshly prepared phosphate wash buffer (5mM KPO4, pH8.0, 80% Ethanol-
EtOH). The cDNA was eluted with phosphate elution buffer (4mM KPO4, pH 8.5) replacing phosphate
elution buffer (EB) (Qiagen supplied). The reaction was incubated at 42°C for 1.5 hrs, then treated with
2�l (2.5M) NaOH and incubated at 37°C for 15 min. To each reaction, 10�l (2M) HEPES was added for
neutralization to occur.
The next step involved chemical labeling of the Cy3 and Cy5 NHS-esters to the AA-dUTP modified
cDNA. The reaction was then incubated in the dark (due to the light sensitivity of the dyes) for 60 min.
After CyDye labeling, 15�l (4M) Hydroxylamine was added to each coupling reaction and incubated in
the dark for 15 min to inactivate any unreacted CyDye NHS-ester molecules. Purification of synthesized
targets and removal of unincorporated CyDye molecules was then carried out using the PCR purification
kit protocol obtained from the QIAquick® Spin Handbook (Qiagen) according to the manufacturer’s
instructions. Modifications to the protocol were as follows: 35�l (100nM) NaOAC, pH5.2 was added to
the reaction mix prior to step one. The step was repeated a total of four times. Once the required 30�l of

50 buffer EB (Qiagen supplied) was added to the centre of the column, an incubation step for 5 min at RT
was carried out.
2.5.2 Hybridization
(Modified from UCT (www.capar.uct.ac.za) and UP (http://microarray.up.ac.za)
Printed slides were treated in a preheated solution containing 3.5X SSC (Sigma), 0.2% SDS (Sigma), and
1% BSA (Roche) for 20 min at 60°C, followed by a rinsing step in DEPC treated, RNase free water. The
slides were then dried using the ArrayIt™ Brand Microarray High-speed Centrifuge (MHC) for 8 seconds
and then placed in a locally manufactured four slide hybridization chamber (Hyb-Up) for target to probe
hybridization.
2.5.3 Target Preparation
For each slide, 30�l of Cy3 and Cy5 dyes were combined (final reaction volume of 60�l) and dried down
in a Speed Vac Concentrator (Savant) to 30�l. The target pair was then resuspended in a 35�l
hybridization solution containing 50% deionized formamide (Sigma), 25% hybridization buffer
(Amersham), and 25% sterile water (Sabax water for injections, Adcock Ingram). The target solution was
then denatured at 92°C for 2 min and placed on ice immediately. Coverslips were sprayed with
compressed air and lowered onto the array area. In order to create a humid environment, 10�l of sterile
water was added to each well in the chamber (20�l total), sealed and covered in foil (light-tight), and
incubated at 42°C for 16h in a water bath.
2.5.4 Washing
Hybridized slides were washed in a low stringency buffer containing 1.0X SSC (Sigma) and 0.2% SDS
(Sigma) for 4min at 42°C, then in a high stringency buffer containing 0.1X SSC (Sigma), 0.2% SDS
(Sigma) for 4 min at 42°C (repeated), and 0.1X SSC for 1min at RT (repeated twice). Slides were then
rinsed in DEPC treated, RNase free water a few times and dried with the MHC (ArrayIt™).

51 2.5.5 Scanning
Axon Instruments GenePix 4000B array scanner using GenePix Pro version 5.1 was used to scan the
hybridized arrays at the African Centre for Gene technologies (ACGT) Microarray Facility, University of
Pretoria, South Africa (http://microarray.up.ac.za). Grids were constructed (service supplied by
Microarray Facility) and manually adjusted (by user) to ensure optimal spot recognition. Measurements of
fluorescence and local background fluorescence for each spot were calculated. Local background
fluorescence was subtracted from the fluorescence intensity on each array. Spots with low signal intensity,
covered in dust particles, saturated spots and spots with high background areas were flagged for exclusion
from downstream analysis (Figure 2.4).
Section C-Data Analysis
A schematic overview of methodology performed for Section C may be seen in Figure 2.4.
2.6 Data Analysis
In order for microarray files to be analyzed in TIGR MIDAS and TIGR MEV(MultiExperiment Viewer)
[The Institute for Genomic Research (TIGR), Rockville, Md; http://www.tigr.org/software], data created
in GenePix (.gpr) files was converted to a tab-delimited (.mev) file using TIGR Express Converter
(version 1.4.1) (TIGR, http://www.tigr.org/software). This is a file transformation tool that reads
microarray data from a variety of file formats, generating files suitable for MIDAS and MEV programs.

52 Data Analysis
GenePix Version 5.1 Gridding and Flagging of Spots
MIDAS LOWESS Normalization SD Regularization Flip Dye Consistency Checking
MEV (MultiExperiment Viewer) + TAIR T-Test (99% CI) HCL Clustering
Validation of Microarray Results Relative Quantification Real-Time RT-PCR
Gene
Annotation +
Function
C
Target Reference
Figure 2.4 Schematic representation of methodology performed in section (C) showing data analysis using: GenePix version 5.1, MIDAS, MEV, TAIR, and Relative Quantification Real-Time RT-PCR

53 2.6.1 MIDAS-Normalization
Normalization procedures were carried out utilizing the TIGR MIDAS software. Four sets of dye-swap
experiments (8 slides in total) were normalized simultaneously in MIDAS, correcting for experimental
errors within and between repeated hybridizations. To correct for intraslide variation, a locally weighted
linear regression (LOWESS) algorithm was applied with a smoothing parameter set at 0.33 (33%) on a
block-by-block basis. The Cy5 channel intensity was adjusted by the calculated LOWESS factor.
2.6.2 Standard Deviation (SD) Regularization
SD regularization was then applied to the data set to scale channel intensities of each spot so that the spots
within each block of a slide had the same spread (SD for log2Cy5/Cy3). Cy5 was the channel intensity
selected for adjustment by the calculated SD regularization factor for all spots within each block of each
slide.
2.6.3 Flip-dye Consistency Checking
In order to show consistencies between flip-dye replicates, the flip-dye consistency parameter was
applied. The SD cut option was carried out which excluded spots within a SD below or above 2. These
spots were marked as flip-dye inconsistent and intensities set to zero, excluding them from downstream
analysis.
2.6.4 Virtual Trim
The virtual trim option was applied to include “bad” spots in the output files but set to zero to distinguish
them from “good” spots thereby maintaining original spot numbers.

54 2.6.5 MEV-T-test, HCL Clustering and TAIR
Normalized and scaled data was then imported into TIGR MEV for differential gene expression analysis.
A t-test was carried out selecting p-values based on the t-distribution, set with an overall alpha (no
correction) critical p-value of 0.01 (99%). The mean value tested against was zero as log2 transformed data
was used for gene expression analysis. Hierarchical Clustering (HCL) was applied to cluster genes based
on average linkage clustering according to Euclidean distance parameters. Genes with log2 values above
0.5 or below -0.5 were selected for further analysis and annotation on The Arabidopsis Information
Resource (TAIR) (http://www.arabidopsis.org), which is a comprehensive database and web-based
information retrieval, analysis and visualization program.
2.7 Validation of Microarray Results Using Real-Time RT- PCR
First strand cDNA was synthesized in a total volume of 20�l containing 1�g of total RNA using the 1st
Strand cDNA Synthesis Kit for RT-PCR (AMV) (Roche) according to the manufacturer’s instructions.
PCR amplifications were carried out using probes and primer sets listed in Table 2.1, (designed by
Roche). A master mix
cocktail was prepared for each gene using the LightCycler FastStart DNA Master Hybridization Probe Kit
(Roche) according to manufacturer’s instructions. To this reaction, 0.2�M of each probe (LC Red and
Fluorescein), 0.5�M of each primer (forward and reverse), and 100ng of cDNA was added to obtain a
final reaction volume of 20�l. A negative control was run with each sample by replacing template cDNA
with PCR-grade water.
Relative quantification real-time RT-PCR reactions were performed on the LightCycler 2.0 System
(Roche Applied Science) with thermal cycling conditions consisting of an initial activation step of 95°C
for 10 min, followed by a cycling step repeated 40 times consisting of 95°C for 10 sec, 60°C for 10 sec,
and 72°C for 10 sec with a single fluorescence measurement. A melting curve analysis was then carried
out at 95°C for 0 sec, 45°C for 30 sec, and 95°C for 0 sec at a heating rate of 0.1°C per second and a
continuous fluorescence measurement. A final cooling step was then carried out at 40°C for 30 sec.

55 Crossing Points (CP) were then determined with the LightCycler software version 4.0 (Roche Applied
Science). This is the point at which the fluorescence of the product rises above background fluorescence.
Four genes were analyzed and normalized with a selected reference gene shown to be constitutively
expressed from microarray analyses.
Calculations were determined as a function of the PCR reaction efficiency of 2 ( this value corresponds to
a perfect doubling of PCR production with each cycle). The following equation was thus applied to
determine relative quantification of the target gene versus the reference gene (Pfaffl, 2001):
Ratio = (Etarget)�CPtarget(control-sample)
(Eref)�CPref(control-sample)
Etarget = real-time PCR efficiency of a target gene transcript
Eref = real-time PCR efficiency of a reference gene transcript
�CP target = CP deviation of control minus the sample of the target gene transcript
�CP ref = CP deviation of control minus the sample of the reference gene transcript

56 Table 2.1 Primer and Probe Sequences used for Relative Quantification Real-Time RT-PCR
Gene Name Primer/Probe Melting
Temperature
(Tm in°C)
No. of
bases
Primer Sequence
(5`-3`)
AGP6 Primer set F 52.4 19 GCA CGT CAA TTT GTC GTT T
R 58.4 22 GAA GAG GCC GAA GAT GAT TTA G
AGP6 Probe set FL 61.8 21 GCT CCA ACT GCC ACA ACC AAG-Fluo
LC Red 66.3 25 LC Red 640-TCC TTC AGC TCC AAC CAA GGC TCC-Pho
Carbamoyl Primer
set
F 57.9 21 CCG GAA CCT TGT CAG AGA TTA
R 55.2 17 GCT TCG AAC TCT GCA GC
Carbamoyl Probe
set
FL 62.1 22 GAA GAA GTC CGT ACC AAG CGG A-Fluo
LC Red 68.3 35 LC Red 640-TCT CTA GGA GTT GTT CCA TCT TAC AAG AGA
GTG GA-Pho
Dynamin Primer set F 52.8 17 AGG TCT TGA ACC TTC GC
R 56.0 18 CTC TCA GGC TCC ACA GTA
Dynamin Probe set FL 61.8 21 GGG AAC TAA AGC CGT GGA GCA-Fluo
LC Red 67.0 33 LC Red 640-CAA TGC AA CAG TCA AAT CTT CTA GGA TTC
CGC-Pho
Peroxidase Primer
set
F 55.3 20 ACA TAC GAT TGG AGT AGC GA
R 55.3 20 GAA ATA TTG TTG TCA CCG CC
Peroxidase Probe
set
FL 64.8 26 TAA CCA ACC AGA CGA GAC GCT AGA GA-Fluo
LC Red 68.3 35 LC Red 640-TCT TAC TAC TAT GGT CTC AGG TCA ATT TGT
CCA CC-Pho
WD-40 Primer set F 55.9 21 TTG ATT GGA ATC CTC ATG ACG
R 58.4 22 GGA GAC CAC TGA ACA CAA AGA A
WD-40 Probe set FL 62.7 24 CAA CAC TGT CCG GTT GTT TGA TCG-Fluo
LC Red 64.9 27 LC Red 640-GGA AGC TTA CCG CTA ATG GAG TTG GTT-Pho

57
CHAPTER 3
RESULTS
3.1 Symptom Development
Agroinoculation was used as the method for inoculation since some geminiviruses such as SACMV are
not mechanically transmissible and whitefly inoculation facilities were not available. It should be noted
that Agrobacterium was used as a transformation vector only in this study, and may stimulate transient
expression changes when inoculated into the plant but it is unlikely to cause symptom expression at 35
dpi. This present study assessed the reaction of Arabidopsis to disease caused by SACMV by monitoring
the progression of SACMV replication from inoculation to symptom development by scoring symptoms
phenotypically and using absolute quantitative real-time PCR. No symptoms were observed between 0-14
and 14-21 dpi. Symptoms of stunting began to emerge in 26 of the 30 infected plants, between 21-28dpi,
but no typical leaf curl and yellowing was observed. SACMV-infected N.benthamiana (tobacco) plants,
used as a positive control, displayed characteristic symptoms such as leaf curling, crinkling and chlorosis
(Figure 3.1 C). Stunting of the entire plant was also observed (Figure 3.1 B) as seen compared to the
healthy control (Figure 3.1 A). From 28-35 dpi, some of the infected Arabidopsis plants in both biological
replicates began to display typical geminivirus symptoms such as severe leaf curl, deformation and
reduction in size (Figure 3.2 D and Figure 3.3 F). A slightly yellow mosaic pattern was also observed in a
minority of infected plants (4 of the 30 plants) (Figure 3.2 C). Infected plants appeared flaccid, diameter
of rosettes were smaller than healthy controls (Figure 3.2 A and Figure 3.3A) and the plants were reduced
in height (Figure 3.3 B, D). In addition, infected Arabidopsis plants in biological replicate 1 (BR1)
showed little or no inflorescence formation (Figure 3.2 A) which was clearly visible in all healthy control
plants (Figure 3.2 B).

58
A B
C
Figure 3.1 Showing (A) Healthy N.benthamiana (mock-inoculated control); (B) Infected N.benthamiana. Typical symptoms observed is the stunting of plants; (C) Infected N.benthamiana leaves showing stunting, leaf curling, crinkling, and chlorosis.

59
A B
C D
Figure 3.2 BR1 showing (A) Typical symptom such as stunting of the entire plant; (B) Healthy Arabidopsis; (C) Yellowing and distortion of young SACMV-infected leaves; (D) Leaf deformation.

60
A B
C D
E F
Figure 3.3 BR2 showing (A) and (C), Healthy Arabidopsis; (B) and (D) Typical symptom such as stunting of the entire plant, infected plants appear flaccid, diameter of rosettes are smaller than healthy controls and the plants are reduced in height; F) Severely reduced leaf size compared to (E) healthy leaf.

61 3.2 Confirmation of SACMV Infection
3.2.1 Total Nucleic Acid Extraction (TNA)
Concentrations were determined on a 1% agarose gel using MassRuler™ DNA Ladder (2ng-150ng)
(Fermentas Life Sciences) which have been calibrated for DNA concentration determination.
Concentration(s) for BR 1 (samples 3 and 4) were 15ng/�l and may be seen in Figure 3.4 A, lane 5 and 6.
BR 2 (sample 4) was also 15 ng/�l and may be seen in Figure 3.5 A, lane 6.
3.2.2 PCR
The expected ~550bp core coat protein (CCP) primer region of SACMV was successfully amplified using
CCP degenerate primers specific for begomoviruses. Because SACMV had not previously been tested in
Arabidopsis, a concentration gradient was constructed to determine at what concentration SACMV would
amplify at in BR 1. It was ascertained that using 34ng (sample 1) was not sufficient for PCR amplification
(Figure 3.4 B, lane 5) whereas, 42.5ng (sample 2) and 51ng (sample 3) was optimal for ~550bp band
amplification (Figure 3.4 B, lane 6 and 7). The positive control used was cassava TNA infected with East
African cassava mosaic virus (EACMV) (45ng) (Figure 3.4 B, lane 3). The negative control showed no
amplification as expected (Figure 3.4 B, lane 8). Optimal concentrations were determined for PCR band
amplification in BR 1, therefore no concentration gradient was required for BR 2. The resulting ~550bp
CCP region was successfully amplified
from concentrations of 42.5ng and 51ng, respectively (Figure 3.5 B, lanes 5 and 6). The positive control
used was also cassava TNA infected with EACMV (45ng) (Figure 3.5 B, lane 3) and no band
amplification visible in the negative control (Figure 3.5 B, lane 7).

62 3.23 Absolute Quantification Real-Time PCR
Absolute quantitative real-time PCR showed that an increase in virus titer correlated with fully susceptible
Arabidopsis tissues. The virus titer levels of fully symptomatic plants at 35 dpi were approximately 3-fold
higher (14522 virus copies/100ng of TNA) than at 13dpi (845 virus copies/100ng of TNA) where no
symptoms were visible. The predicted PCR product length of 150 bp was confirmed by both the melting
curve analysis (data not shown) and agarose gel electrophoresis (figure 3.6 B) as a single product was
amplified. The standard curve was constructed by plotting the log of known plasmid SACMV DNA-A
concentrations against crossing point values showing an error of 0.0255 and efficiency of 2.087 (Figure
3.6 A).

63
Lane 2 3 4 5 6 7 8
Bp 805 514 468
TNA
Lane 2 3 4 5 6 7 8
[ ] (ng) 45
30
15
550bp
B
Figure 3.4 BR1 showing a 1% agarose gel of (A) TNA extracted from SACMV-infected Arabidopsis leaf samples, lane 5 and 6. Lane 2, 15�l MassRuler™ DNA Ladder (Fermentas Life Sciences) and (B) Amplification of the ~550bp CCP fragment from SACMV-infected Arabidopsis leaves. Lane 2, Pst1-� DNA marker; Lane 3, EACMV positive control; Lane 4 and 5, Empty; Lane 6 and 7, Infected Arabidopsis; Lane 8, Negative control.
A

64
Lane 2 3 4 5 6 7
Lane 2 3 4 5 6 7
[ ] ng
30
15
550bp
TNA
Bp 600 500 400
A
B
Figure 3.5 BR2 showing a 1% agarose gel of (A) TNA extracted from SACMV-infected Arabidopsis leaf samples, lane 6. Lane 2, 15�l MassRuler™ DNA Ladder (Fermentas Life Sciences) and (B) Amplification of the ~550bp CCP fragment from SACMV-infected Arabidopsis leaves. Lane 2, 15�l MassRuler™ DNA Ladder (Fermentas Life Sciences); Lane 3, EACMV positive control; Lane 4, Empty; Lane 5 and 6, Infected Arabidopsis DNA; Lane 7, Negative control.

65
Figure 3.6 (A) Standard curve obtained from plotting log of known DNA concentrations of plasmid SACMV DNA-A (1.54E8-1.54E4 copies/µl) against Cp values obtained from real-time quantitative PCR; (B) 1% Agarose gel showing the 150 bp end-point PCR product at 13 dpi (lane3) and 35 dpi (lane4). Negative control (lane 5). O�GeneRuler100bp DNA Ladder (Fermentas Life Sciences) (lane 2).
Lane 2 3 4 5 Bp 200 100
150 bp
B
1.54E4*
1.54E5*
1.54E6*
1.54E7*
1.54E8*
A
*Units: copies/µl

66 3.3 RNA Extractions
3.3.1 Concentration and Purity Determination
For each biological replicate, 20-25 healthy and SACMV-infected Arabidopsis leaves were pooled
separately, successfully isolating between 350�g to 430�g (3.50�g/�l – 4.26�g/�l) of total RNA
respectively for microarray analyses (50�g of total RNA is required per labelling reaction for array
hybridizations) (Table 3.1). The purity of total RNA was determined by A260/A280 ratios, revealing purity
ratios of between 1.9 and 2.3. A high degree of purity was therefore observed among the RNA samples for
both healthy and SACMV-infected Arabidopsis total RNA in each biological replicate (Table 3.1).
Table 3.1: RNA concentration and purity determination for each biological replicate
Sample Concentation (�g/�l) Purity (1.9-2.3)
BR1
Healthy RNA
Infected RNA
4.26
3.60
2.06
2.10
BR2
Healthy RNA
Infected RNA
3.56
3.62
1.94
1.94

67 3.3.2 RNA Formaldehyde Gel Electrophoresis
A 1% formaldehyde agarose gel revealed intact, non-degraded total RNA in both biological replicates
(Figure 3.7 A, lane 4 and 5, and Figure 3.8 A, lane 3 and 4), indicating that no degradation had occurred.
Distinct 25S and 18S rRNA bands demonstrated high quality, intact total RNA.
3.3.3 PCR
Results obtained from PCR analysis revealed that no contaminating plant DNA was present in the RNA
samples (Figure 3.6 B, lanes 4-11 and Figure 3.7 B, lanes 4-11). Only positive band amplification was
observed, which was expected (Figure 3.6 B, lane 3 and Figure 3.7 B, lane 3). Furthermore, band
amplification was also not observed in the negative controls (Figures 3.6 B, lane 12 and 3.7 B, lane 12).

68 Lane 2 3 4 5 6
Bases 3.638 2.608 1.908 955
Lane 2 3 4 5 6 7 8 9 10 11 12
25S 18S
Bp 1093 805
Figure 3.7 BR1 (A) 1% MOPS/Formaldehyde gel electrophoresis of healthy Arabidopsis RNA (8.52�g), lane 4. SACMV-infected Arabidopsis RNA (7.20�g), lane 5. Lane 2, 3�l RNA Marker (Promega); B) 1% agarose gel showing band amplification of Arabidopsis DNA using ubiquitin primers (positive control), lane 3. Lanes 4-7, healthy Arabidopsis total RNA. Lanes 8-11, SACMV-infected Arabidopsis total RNA. Lane 12, negative control. Lane 2, Pst1-� DNA marker.
A
B

69
Lane 2 3 4 5 6 7 8
Bases 3.638 2.608 1.908 955
Lane 2 3 4 5 6 7 8 9 10 11 12
25S 18S
3.4 Microarrays
Bp 1093
805
Figure 3.8 BR2 (A) 1% MOPS/Formaldehyde gel electrophoresis of healthy Arabidopsis RNA (3.56�g), lane 3; SACMV-infected Arabidopsis RNA (3.62�g), lane 4; Lane 1, 3�l RNA Marker (Promega); B) 1% agarose gel showing band amplification of Arabidopsis DNA using ubiquitin primers (positive control), lane 3. Lanes 4-7, healthy Arabidopsis total RNA. Lanes 8-11, SACMV-infected Arabidopsis total RNA. Lane 12, negative control. Lane 2, Pst1-� DNA marker.
A
B

70 3.4 Microarrays
3.4.1 Locally Weighted Scatterplot Smoothing (LOWESS)
Normalization
Ratio-Intensity (R-I) scatter plots were created from eight complete hybridizations of the Arabidopsis
7200 cDNA microarray chips, consisting of two biological replicates (independent RNA) named BR1 and
BR2. Within each biological replicate, 2 technical replicates (pooled RNA) each with dye-swap
experiments (totalling 4 technical replicates in each biological replicate) were constructed.
Fluorescence intensities were measured from both channels (i.e. Cy5 and Cy3), displaying log2 (Cy5/Cy3)
ratios for each spot as a function of the log10 (Cy5*Cy3) product intensities (Figure 3.9 and 3.10). Raw
data generated from GenePix is indicated by the pre-processed scatter plots for each biological replicate.
From figures 2.9 and 2.10 (indicated in blue), it may be seen that these spots are deviating from zero,
indicating a systematic dependence on intensity, and showing an even greater variation at lower
intensities. LOWESS was therefore applied to remove intensity dependent dye-specific artifacts in the log2
(ratios). This algorithm subtracted the average ratio from the experimentally observed ratio, producing a
balanced distribution of expression ratios around zero, independent of intensity (Figure 3.9 and 3.10,
shown in post-normalization plots, red). Similar patterns of expression were also observed among
LOWESS normalized signal intensity ratios among the technical replicates in BR1, distributed around a
mean of zero (Figure 3.9, indicated in red). This was also observed among the technical replicates in BR2,
also centered around a mean of zero after LOWESS normalization (Figure 3.10, shown in red).
Differences among BR1 and BR2 indicate tightly packed profiles in BR1 (Figure 3.9) as opposed to BR2
(Figure 3.10) suggesting more variation in gene expression in

71
Log
2[I(
a)/I
(b)]
Log
2[I(
a)/I
(b)]
L
og2[
I(a)
/I(b
)]
Log
2[I(
a)/I
(b)]
9.0 4.5
0.0
-4.5
-9.0
10.0 5.0
0.0
-5.0
-10.0
10.0 5.0
0.0
-5.0
-10.0
10.0 5.0
0.0
-5.0
-10.0
11.0 5.5
0.0
-5.5
-11.0
9.0 4.5
0.0
-4.5
-9.0
10.0 5.0
0.0
-5.0
-10.0
10.0 5.0
0.0
-5.0
-10.0
10.0 5.0
0.0
-5.0
-10.0 4.0 6.8 9.6 12.4 15.0
Log10[I(a).I(b)]
Log
2[I(
a)/I
(b)]
4.0 6.8 9.6 12.4 15.0 Log10[I(a).I(b)]
Log
2[I(
a)/I
(b)]
5.0 7.5 10.0 12.5 15.0 Log10[I(a).I(b)]
5.0 7.5 10.0 12.5 15.0 Log10[I(a).I(b)]
5.0 7.5 10.0 12.5 15.0 Log10[I(a).I(b)]
5.0 7.5 10.0 12.5 15.0 Log10[I(a).I(b)]
5.0 7.5 10.0 12.5 15.0 Log10[I(a).I(b)]
5.0 7.5 10.0 12.5 15.0 Log10[I(a).I(b)]
Log
2[I(
a)/I
(b)]
L
og2[
I(a)
/I(b
)]
Pre-normalization RI Plot Slide 2 Post-normalization RI Plot
Pre-normalization RI Plot Slide 3 Post-normalization RI Plot
Pre-normalization RI Plot Slide 4 Post-normalization RI Plot
Pre-normalization RI Plot Slide 1 Post-normalization RI Plot
Figure 3.9 BR1 LOWESS pre- (blue) and post (red) normalization ratio-intensity (RI) plots.

72
6.0 3.0
0.0
-3.0
-6.0
6.0 3.0
0.0
-3.0
-6.0
6.0 3.0
0.0
-3.0
-6.0
5.0 2.5
0.0
-2.5
-5.0
5.0 2.5
0.0
-2.5
-5.0
8.0 4.0
0.0
-4.0
-8.0
8.0 4.0
0.0
-4.0
-8.0
8.0 4.0
0.0
-4.0
-8.0
2.5 5.0 7.5 10.0 15.0 Log10[I(a).I(b)]
2.5 5.0 7.5 10.0 15.0 Log10[I(a).I(b)]
1.0 3.3 5.6 7.9 15.0 Log10[I(a).I(b)]
1.0 3.3 5.6 7.9 15.0 Log10[I(a).I(b)]
0.0 2.5 5.0 7.5 10.0 Log10[I(a).I(b)]
0.0 2.5 5.0 7.5 10.0 Log10[I(a).I(b)]
0.0 2.5 5.0 7.5 10.0 Log10[I(a).I(b)]
0.0 2.5 5.0 7.5 10.0 Log10[I(a).I(b)]
Log
2[I(
a)/I
(b)]
L
og2[
I(a)
/I(b
)]
Log
2[I(
a)/I
(b)]
L
og2[
I(a)
/I(b
)]
Log
2[I(
a)/I
(b)]
Log
2[I(
a)/I
(b)]
Log
2[I(
a)/I
(b)]
Log
2[I(
a)/I
(b)]
Pre-normalization RI Plot Slide 5 Post-normalization RI Plot
Pre-normalization RI Plot Slide 6 Post-normalization RI Plot
Pre-normalization RI Plot Slide 7 Post-normalization RI Plot
Pre-normalization RI Plot Slide 8 Post-normalization RI Plot
Figure 3.10 BR2 LOWESS pre- (blue) and post (red) normalization ratio-intensity (RI) plots.

73 BR2 after normalization. BR2 was more successful in terms of balancing fluorescence intensities, as less systematic errors were removed from BR2 (average input spots among 4 slides, 7200 and output spots 7038), as computed by the program, revealing a loss of 162 spots. BR1 contained more systematic errors as post-normalization output spots was 5652 from an input of 7200 spots (1548 spot loss) (Figure 3.9 and 3.10).
3.4.2 Standard Deviation (SD) Regularization
After LOWESS normalization, scale adjustment was required by SD regularized normalization as log
ratios now centred around zero have slightly different spreads (Figure 3.11 and 3.12, shown in pink).
Differences in spread among the 32 blocks in one array may result in misidentification in genes that are
differentially expressed in infected tissue when compared to healthy controls. An average SD block log-
ratio was therefore computed for all 32 blocks on each array (each block containing 225 spots). After SD
regularization was applied, log ratios became evenly distributed on each array, resulting in each block
having the same SD for log2 (Cy5/Cy3) distribution (Figure 3.11 and 3.12, indicated in green).
From Figure 3.13 it may be seen that scatter plot smoother LOWESS was constructed to identify intensity
and spatial normalization problems, calculating SD before (Figure 3.13, black) and after LOWESS
correction (Figure 3.13, purple). It was observed that after SD regularization, SD values were decreased
(Figure 3.13, purple). Only a small number of outliers outside 3 SD from the mean was observed,
suggesting that the distribution of log2 (ratio) values were not deviating badly from the mean of zero
(Figure 3.13, purple).

74
0 1 2 3 4 5 6 7 8 9 10 11 12 13 14 15 16 17 18 19 20 21 22 23 24 25 26 27 28 29 30 31 32
Block
0 1 2 3 4 5 6 7 8 9 10 11 12 13 14 15 16 17 18 19 20 21 22 23 24 25 26 27 28 29 30 31 32
Block
0 1 2 3 4 5 6 7 8 9 10 11 12 13 14 15 16 17 18 19 20 21 22 23 24 25 26 27 28 29 30 31 32
Block
1 2 3 4 5 6 7 8 9 10 11 12 13 14 15 16 17 18 19 20 21 22 23 24 25 26 27 28 29 30 31 32
Block
1 2 3 4 5 6 7 8 9 10 11 12 13 14 15 16 17 18 19 20 21 22 23 24 25 26 27 28 29 30 31 32
Block
1 2 3 4 5 6 7 8 9 10 11 12 13 14 15 16 17 18 19 20 21 22 23 24 25 26 27 28 29 30 31 32
Block
1 2 3 4 5 6 7 8 9 10 11 12 13 14 15 16 17 18 19 20 21 22 23 24 25 26 27 28 29 30 31 32
Block
1 2 3 4 5 6 7 8 9 10 11 12 13 14 15 16 17 18 19 20 21 22 23 24 25 26 27 28 29 30 31 32
Block
7.9 4.6 2.8 1.0
-0.8 -2.6 -4.4 -6.2 -8.0
5.8 4.2 2.6 1.0
-0.6 -2.2 -3.8 -5.4 -7.0
Log
-rat
io
9.0 7.2 5.4 3.6 1.8 -1.8 -3.6 -5.4 -7.2 -9.0
7.4 5.2 3.0 0.8
-1.4 -3.6 -5.8 -8.0
LO
G-R
AT
IO
10.0 8.0 6.0 4.0 2.0
-2.0 -4.0 -6.0 -8.0 -10.0
9.0 7.2 5.4 3.6 1.8
-1.8 -3.6 -5.4 -7.2 -9.0
9.0 7.2 5.4 3.6 1.8
-1.8 -3.6 -5.4 -7.2 -9.0
9.0 7.2 5.4 3.6 1.8
-1.8 -3.6
-5.4 -7.2 -9.0
Log
-rat
io
Log
-rat
io
Log
-rat
io
Log
-rat
io
Log
-rat
io
Log
-rat
io
Log
-rat
io
Pre-normalization Box Plot Slide 1 Post-normalization Box Plot
Pre-normalization Box Plot Slide 2 Post-normalization Box Plot
Pre-normalization Box Plot Slide 3 Post-normalization Box Plot
Pre-normalization Box Plot Slide 4 Post-normalization Box Plot
Figure 3.11 BR1 Box Plots displaying the intensity log-ratio distribution for each of the 32 blocks on an array before (pink) and after (green) scale normalization.

75
1 2 3 4 5 6 7 8 9 10 11 12 13 14 15 16 17 18 19 20 21 22 23 24 25 26 27 28 29 30 31 32
Block
1 2 3 4 5 6 7 8 9 10 11 12 13 14 15 16 17 18 19 20 21 22 23 24 25 26 27 28 29 30 31 32
Block
1 2 3 4 5 6 7 8 9 10 11 12 13 14 15 16 17 18 19 20 21 22 23 24 25 26 27 28 29 30 31 32
Block
0 1 2 3 4 5 6 7 8 9 10 11 12 13 14 15 16 17 18 19 20 21 22 23 24 25 26 27 28 29 30 31 32
Block
1 2 3 4 5 6 7 8 9 10 11 12 13 14 15 16 17 18 19 20 21 22 23 24 25 26 27 28 29 30 31 32
Block
0 1 2 3 4 5 6 7 8 9 10 11 12 13 14 15 16 17 18 19 20 21 22 23 24 25 26 27 28 29 30 31 32
Block
1 2 3 4 5 6 7 8 9 10 11 12 13 14 15 16 17 18 19 20 21 22 23 24 25 26 27 28 29 30 31 32
Block
1 2 3 4 5 6 7 8 9 10 11 12 13 14 15 16 17 18 19 20 21 22 23 24 25 26 27 28 29 30 31 32
Block
1 2 3 4 5 6 7 8 9 10 11 12 13 14 15 16 17 18 19 20 21 22 23 24 25 26 27 28 29 30 31 32
Block
1 2 3 4 5 6 7 8 9 10 11 12 13 14 15 16 17 18 19 20 21 22 23 24 25 26 27 28 29 30 31 32
Block
6.0 4.8 3.6 2.4 1.2
-1.2 -2.4 -3.6 -4.8 -6.0
5.0 4.0 3.0 2.0 1.0
-1.0 -2.0 -3.0 -4.0 -5.0
5.0 4.0 3.0 2.0 1.0
-1.0 -2.0 -3.0 -4.0 -5.0
5.0 4.0 3.0 2.0 1.0
-1.0 -2.0 -3.0 -4.0 -5.0
4.6 3.4 2.2 1.0 -0.2
-1.4 -2.6 -3.4 -5.0
4.6 3.0 -1.4
-0.2 -1.8 -3.4 -5.0
4.6 3.4 2.2 1.0 -0.2
-1.4 -2.6 -3.4 -5.0
4.8 3.4 2.0 0.6
- 0.8 -2.2 -3.6 -5.0
Log
-rat
io
Log
-rat
io
Log
-rat
io
Log
-rat
io
Log
-rat
io
Log
-rat
io
Log
-rat
io
Log
-rat
io
Pre-normalization Box Plot Slide 5 Post-normalization Box Plot
Pre-normalization Box Plot Slide 6 Post-normalization Box Plot
Pre-normalization Box Plot Slide 7 Post-normalization Box Plot
Pre-normalization Box Plot Slide 8 Post-normalization Box Plot
Figure 3.12 BR2 Box Plots displaying the intensity log-ratio distribution for each of the 32 blocks on an array before (pink) and after (green) scale normalization.

76
4.0 6.8 9.6 12.4 15.0 Log10[I(a).I(b)]
11.0
5.5
0.0
-5.5
-11.0
Log
2[I(
a)/I
(b)]
9.0
4.5
0.0
-4.5
-9.0
Log
2[I(
a)/I
(b)]
3.0 5.8 8.6 11.4 15.0 Log10[I(a).I(b)]
9.0
4.5
0.0
-4.5
-9.0
4.0 6.8 9.6 12.4 15.0 Log10[I(a).I(b)]
10.0
5.0
0.0
-5.0
-10.0
Log
2[I(
a)/I
(b)]
Log
2[I(
a)/I
(b)]
5.0 7.5 10.0 12.5 15.0
Log10[I(a).I(b)]
6.0
3.0
0.0
-3.0
-6.0
0.0 2.5 5.0 7.5 10.0
Log10[I(a).I(b)]
Log
2[I(
a)/I
(b)]
5.0
2.5
0.0
-2.5
-5.0
0.0 2.5 5.0 7.5 10.0
Log10[I(a).I(b)]
Log
2[I(
a)/I
(b)]
6.0
3.0
0.0
-3.0
-6.0
0.0 2.5 5.0 7.5 10.0
Log10[I(a).I(b)]
Log
2[I(
a)/I
(b)]
8.0
4.0
0.0
-4.0
-8.0
Log
2[I(
a)/I
(b)]
0.0 2.8 5.6 8.4 10.0
Log10[I(a).I(b)]
Post-normalization SD RI Plot (Slide 1) Post-normalization SD RI Plot (Slide 2)
Post-normalization SD RI Plot (Slide 3) Post-normalization SD RI Plot (Slide 4)
Post-normalization SD RI Plot (Slide 5) Post-normalization SD RI Plot (Slide 6)
Post-normalization SD RI Plot (Slide 7) Post-normalization SD RI Plot (Slide 8)
Figure 3.13 Standard deviation (SD) normalization RI plots before SD regularization (Black) and after regularization (Purple).

77 3.4.3 Flip-Dye Consistency Checking
Flip- dye consistency checking was performed on flip-dye replicates. Log2 (Cy5/Cy3) values formed a
“sphere” centred around zero (Figure 3.14). From Figure 3.14, it may be seen that data points greater than
2 SD from the mean were eliminated using outlier criterion (black, representing poor quality spots in one
or both replicates), resulting in a much tighter dataset (light blue). Flip-dye replicate consistency checking
therefore reduced variability between flip-dye replicates (Figure 3.14, seen in light blue). Before replicate
filtering was applied, a number of outliers was observed (Figure 3.14, in black) which was filtered (Figure
3.14, light blue) resulting in a better correlation between flip-dye replicates. Flip-dye inconsistent values
were then adjusted to zero and excluded. The overall consistency between the flip-dye pair was described
by the confidence factor (cf) and dispersion factor (df). Cfs for the SD cut-off range of ±2 SD should be
very close to 95%, if log2 values follow a normal distribution. Results indicated that the cf for pair 1 was
0.94 (94%), pair 2 was 0.94 (94%), pair 3 was 0.95 (95%) and pair 4 was 0.96 (96%) indicating that the
log2 values for each flip-dye pair do follow a normal distribution as a value close to 95% was obtained for
each flip-dye pair. Dfs are those percentages of spots having log2 values not between -1 and 1. Df differs
to cf in that the distribution of log2 values is not taken into account. The percentage of spots having more
than 2 fold ratio inconsistencies between replicate pairs was therefore calculated. Results obtained a
dispersion factor of 0.39 (39%) for pair 1, 0.53 (53%) for pair 2, 0.20 (20%) for pair 3, and 0.47 (47%) for
pair 4. Flip-dye replicate pair 2 and 4 resulted in a high df, indicating that close to or including half the
spots had a 2-fold ratio inconsistency between replicate pairs. Remaining flip-dye consistent data was then
merged as one dataset and used in downstream analysis. From Figure 3.14, it was observed that the output
number of spots was 4948 for Slide pair 1, 4351 for Slide pair 2, 6564 for Slide pair 3, and 6689 for Slide
pair 4.

78
-7.5 -6.5 -5.5 -4.5 -3.5 -2.5 -1.5 -0.5 0.5 1.5 2.5 3.5 4.5 5.5 6.5
Log2[I(b)/I(a)] [Slide 1]
8.0 7.0
6.0 5.0 4.0 3.0 2.0 1.0 0.0 -1.0 -2.0 -3.0 -4.0 -5.0 -6.0 -7.0 -8.0 -9.0
Log
2[I(
a)/I
(b)]
[Slid
e 2]
8.0
7.0
6.0
5.0 4.0
3.0
2.0 1.0
0.0
-1.0
-2.0
-3.0 -4.0
-5.0
-6.0 -7.0
Log
2[I(
a)/I
(b)]
[Slid
e 4]
-8.0 -7.0 -6.0 -5.0 -4.0 -3.0 -2.0 -1.0 0.0 1.0 2.0 3.0 4.0 5.0 6.0 7.0 8.0 9.0
Log2[I(b)/I(a)] [Slide 3]
4.5 4.0 3.5 3.0 2.5 2.0 1.5 1.0 0.5 0.0 -0.5 -1.0 -1.5 -2.0 -2.5 -3.0 -3.5 -4.0
-4.5
Log
2[I(
a)/I
(b)]
[Slid
e 6]
-4.0 -3.5 -3.0 -2.5 -2.0 -1.5 -1.0 -0.5 0.0 0.5 1.0 1.5 2.0 2.5 3.0 3.5 4.0 4.5 5.0
Log2[I(b)/I(a)] [Slide 5]
-5.5 -4.5 -3.5 -2.5 -1.5 -0.5 0.0 0.5 1.5 2.5 3.5 4.5
Log2[I(b)/I(a)] [Slide 7]
6.5 5.5 4.5 3.5 2.5 1.5 0.5
0.0
-0.5
-1.5
-2.5
-3.5 -4.5
Log
2[I(
a)/I
(b)]
[Slid
e 8]
Post-filtering Diagnostic Plot (Slide Pair 1) Post-filtering Diagnostic Plot (Slide Pair 2)
Post-filtering Diagnostic Plot (Slide Pair 3) Post-filtering Diagnostic Plot (Slide Pair 4)
Output data number: 4948 Output data number: 4351
Output data number: 6564 Output data number: 6689
CF : 0.94 DF : 0.39
CF : 0.94 DF : 0.53
CF : 0.95 DF : 0.20
CF : 0.96 DF : 0.47
Figure 3.14 Flip-dye consistency checking for I (b)/I (a) ratios or (Cy5/Cy3) ratios. Black indicates data before replicate filtering and blue shows filtered data resulting in a better correlation between the flip-dye pair.

79 3.4.4 MEV and TAIR
Results from the one-sample t-test carried out at the 99% confidence interval (CI) in TIGR MEV
(http://www.tigr.org/software), identified 86 differentially expressed genes. Genes were considered
differentially expressed if ratios (Cy5/Cy3) deviated from a mean of 0. Hierarchical clustering (HCL)
analysis revealed that from the 86 differentially expressed genes, 48 genes were shown to be up-regulated
and 38 down-regulated (Figure 3.15). Gene ratios were considered significant if calculated t values
exceeded the tabulated t values with respect to their relative degrees of freedom (df) at P = 0.01 (Table 3.2
and 3.3). Significant genes with a mean log2 value above 0.5 or below -0.5 were therefore selected for
further analysis and are displayed in Table 3.3.
Table 3.2 Probability (P) of exceeding the critical value (selected values taken from Clarke, 1994).
df P = 0.1 0.05 0.02 0.01 0.002 0.001
1
2
3
4
6.314
2.920
2.353
2.132
12.706
4.303
3.182
2.776
31.821
6.965
4.541
3.747
63.657
9.925
5.841
4.604
318.31
22.327
10.214
7.173
636.62
31.598
12.924
8.610

80 Table 3.3 Differential up or down-regulated genes in SACMV-infected Arabidopsis based on mean log2 ratios above 0.5 or below 0.5.
Gene Acc No.
Description t-Ratio
df Log2 value
Locus Identifier
Description/Putative involvement/Activity
AC011698 putative T-complex protein 1, theta subunit (TCP-1-Theta) 8.40 3 0.5 At3g03960.1 DNA recombination, DNA repair, branched chain family amino acid biosynthesis, glycerol metabolism, cellular protein metabolism
D88377 ATP SYNTHASE EPSILON CHAIN, MITOCHONDRIAL >dbj|BAA13602.1|
12.30 2 0.5 At1g51650.1 ATP synthesis coupled proton transport
D85339 hydroxypyruvate reductase [Arabidopsis thaliana] 12.61 3 0.5 At1g68010.1 Oxidoreductase activity, acting on the CH-OH group of donors, NAD or NADP as acceptor
PROTEASOME ALPHA SUBUNIT (MULTICATALYTIC ENDOPEPTIDASE COMPLEX ALPHA
6.04 3 0.9 At5g35590
Endopeptidase activity, threonine endopeptidase activity
ELONGATION FACTOR 1-ALPHA (EF-1-ALPHA) >pir||S06724 translation
618.84 1 1.0 At1g07920.1
Amino acid metabolism, protein biosynthesis, translational elongation, selenocysteine incorporation protein biosynthesis, translational elongation, translational termination, selenocysteine incorporation
AC006931 putative MAP kinase [Arabidopsis thaliana] 6.62 3 0.6 At2g42880.1, At5g10630.1
MAP kinase activity Catalysis of the phosphorylation of proteins. Mitogen-activated protein kinase; a family of protein kinases that relay signals from the plasma membrane to the nucleus.
X98804 peroxidase ATP18a [Arabidopsis thaliana] 6.85 3 0.6 At1g44970.1 Response to oxidative stress, often resulting from exposure to high levels of reactive oxygen species, e.g. superoxide anions, hydrogen peroxide (H2O2), and hydroxyl radicals.
AC002332 unknown protein [Arabidopsis thaliana] 6.54 3 0.7 Many Several putative functions
AC008263 ESTs gb|AA042183 and gb|R86825 come from this gene 8.82 3 0.8 At1g74880.1 Encodes subunit NDH-O of NAD(P)H:plastoquinone dehydrogenase complex (Ndh complex) present in the thylakoid membrane of chloroplasts. This subunit is thought to be required for Ndh complex assembly
AC009177 putative sugar transporter [Arabidopsis thaliana]
9.25 3 0.8 At3g05150.1 Carbohydrate transport, inorganic anion transport, ion transport, organic anion transport, phosphate transport, transport, ATP synthesis coupled electron transport
probable cytochrome b PA4430 [imported] - Pseudomonas aeruginosa
13.15 2 0.7 metabolism
AC006931 En/Spm-like transposon protein [Arabidopsis thaliana]
109.86 1 0.8 At2g42840 Encodes a putative extracellular proline-rich protein is exclusively expressed in the L1 layer of vegetative, inflorescence and floral meristems and the protoderm of organ primordia. structural constituent of cell wall
hypothetical protein A_TM018A10.2 - Arabidopsis thaliana
10.52 2 -1.1 At4g00950
Regulation of transcription
AC005169 putative ribosomal protein L28 [Arabidopsis thaliana] 7.07 3 -1.0 At2g19730 Protein biosynthesis
AB018107 GDSL-motif lipase/hydrolase-like protein [Arabidopsis]
5.86 3 -0.7 At5g37690 Has catalytic activity. Located in endomembrane system.Members of the endomembrane system pass materials through each other or though the use of vesicles
AP001306 emb|CAB10291.1~gene_id:MKA23.7~similar to unknown protein
8.43 3 -0.8 At3g22160.1 VQ motif-containing protein, contains PF05678: VQ motif
U93215 Putative VP1/AB13 family regulatory protein (A.thaliana) 7.96 3 -0.8 At2g30470 Protein ubiquitination, regulation of transcription ( DNA-dependent)
AC005727 putative membrane channel protein (Arabidopsis thaliana] 7.07 3 -0.8 At2g28900 Intracellular protein transport, protein transport
AC007369 Unknown protein (A.thaliana) 5.95 3 -0.5 Many Several putative functions
L34546 CALMODULIN-RELATED PROTEIN 3, TOUCH-INDUCED >gb|AAC37419.1|
94.43 1 -0.6 At2g41100 Encodes a calmodulin-like protein, with six potential calcium binding domains. Calcium binding shown by Ca(2+)-specific shift in electrophoretic mobility. Expression induced by touch and darkness. Expression may also be developmentally controlled.
hypothetical protein F13G24.110 - Arabidopsis thaliana
8.75 3 -0.5 At5g07910.1 Leucine-rich repeat family protein, contains leucine rich repeat (LRR) domains, Pfam:PF00560
aspartate--tRNA ligase homolog F6E21.100 - Arabidopsis thaliana
9.29 3 -0.7 At4g31180.1 tRNA aminoacylation for protein translation, asparaginyl-tRNA aminoacylation, aspartyl-tRNA aminoacylation, lysyl-tRNA aminoacylation
ketoconazole resistance protein - Arabidopsis thaliana
9.09 3 -0.6 At5g66040 Senescence-associated family protein, almost identical to ketoconazole resistant protein GI:928938 from (Arabidopsis thaliana) full-length cDNA: Ceres:101608
probable DNA-binding protein T27E13.1 - Arabidopsis thaliana
8.01 3 -0.5 Many Several putative functions
AC007197 dynamin-like protein [Arabidopsis thaliana] 6.16 3 -0.5 At2g14120 GTP binding, GTPase activity

81
(AC069159) 3'-5' exonuclease, putative [Arabidopsis thaliana] (AP001306) contains similarity to cell wall-plasma membrane linker homeobox protein - Arabidopsis thaliana >emb|CAB71045.1| (AL137898) hypothetical protein T22D6.110 - Arabidopsis thaliana (AC011698) putative T-complex protein 1, theta subunit (TCP-1-Theta) (AC001645) jasmonate inducible protein isolog [Arabidopsis thaliana] (AB020745) ligand-gated ion channel protein-like; glutamate (AB008266) gene_id:MHJ24.11~unknown protein [Arabidopsis thaliana] ATP SYNTHASE EPSILON CHAIN, MITOCHONDRIAL >dbj|BAA13602.1| (D88377) (D85339) hydroxypyruvate reductase [Arabidopsis thaliana] (AC006439) putative inorganic pyrophosphatase [Arabidopsis thaliana] ratio control 2 PEPTIDYL-PROLYL CIS-TRANS ISOMERASE, CHLOROPLAST PRECURSOR (PPIASE) (AC008017) Highly similar to receptor-like protein kinase [Arabidopsis] Unknown hypothetical protein F19F18.170 - Arabidopsis thaliana (AB017069) contains similarity to unknown (AL161491) hypothetical protein [Arabidopsis thaliana] (AL392174) putative protein [Arabidopsis thaliana] phosphate/triose-phosphate translocator precursor [imported] – unknown (AC009243) F28K19.24 [Arabidopsis thaliana] NULL
hypothetical protein - Arabidopsis thaliana >emb|CAB10485.1| (Z97342) (AJ224982) MAP3K epsilon protein kinase [Arabidopsis thaliana] (AC006283) unknown protein [Arabidopsis thaliana] (AC006438) unknown protein [Arabidopsis thaliana] (AC035249) unknown protein; 10-1710 [Arabidopsis thaliana] 60S RIBOSOMAL PROTEIN L37A >gb|AAD28753.1|AF127042_1 (AF127042) 60S (U40341) carbamoyl phosphate synthetase large chain [Arabidopsis] (AC002332) putative steroid dehydrogenase [Arabidopsis thaliana] RNA-binding protein homolog F18A5.250 - Arabidopsis thaliana hypothetical protein T9A21.110 - Arabidopsis thaliana >emb|CAA16798.1| (AC007109) putative surface protein [Arabidopsis thaliana] (AC023754) Unknown protein [Arabidopsis thaliana] (Z96936) NAP16kDa protein [Arabidopsis thaliana] (AC007259) glucose transporter [Arabidopsis thaliana] (AC022287) transfactor, putative [Arabidopsis thaliana] PROTEASOME ALPHA SUBUNIT (MULTICATALYTIC ENDOPEPTIDASE COMPLEX ALPHA ELONGATION FACTOR 1-ALPHA (EF-1-ALPHA) >pir||S06724 translation (AC006931) putative MAP kinase [Arabidopsis thaliana] (X98804) peroxidase ATP18a [Arabidopsis thaliana] (AC002332) unknown protein [Arabidopsis thaliana] (AC008263) ESTs gb|AA042183 and gb|R86825 come from this gene (AC009177) putative sugar transporter [Arabidopsis thaliana] probable formamidase (EC 3.5.1.49) F19F18.50 - Arabidopsis thaliana probable cytochrome b PA4430 [imported] - Pseudomonas aeruginosa (AC006931) En/Spm-like transposon protein [Arabidopsis thaliana] hypothetical protein A_TM018A10.2 - Arabidopsis thaliana (AC005917) putative SF21 protein {Helianthus annuus} [Arabidopsis (AC005169) putative ribosomal protein L28 [Arabidopsis thaliana] (AB018107) GDSL-motif lipase/hydrolase-like protein [Arabidopsis] (AP001306) emb|CAB10291.1~gene_id:MKA23.7~similar to unknown protein (U93215) putative VP1/ABI3 family regulatory protein [Arabidopsis] (AC005727) putative membrane channel protein [Arabidopsis thaliana] Unknown NULL ribosomal protein L18a, cytosolic - Arabidopsis thaliana (AJ012459) AGP6 protein [Arabidopsis thaliana] Ca2+-transporting ATPase (EC 3.6.1.38) T27I1.16 - Arabidopsis thaliana chlorophyll a/b-binding protein F28P10.130 - Arabidopsis thaliana (AC005917) putative WD-40 repeat protein [Arabidopsis thaliana] senescence-associated protein homolog T13J8.160 - Arabidopsis thaliana unknown hypothetical protein T17F15.230 - Arabidopsis thaliana alpha-expansin 2 [imported] - Triphysaria versicolor (AC018363) putative myo-inositol monophosphatase [Arabidopsis] SQUALENE MONOOXYGENASE 2 (SQUALENE EPOXIDASE 2) (SE 2) >pir||T51364 (AC007369) Unknown protein [Arabidopsis thaliana] ADP,ATP CARRIER PROTEIN 1 PRECURSOR (ADP/ATP TRANSLOCASE 1) (ADENINE) (AC034256) Contains similarity to extensin (atExt1) from Arabidopsis CALMODULIN-RELATED PROTEIN 3, TOUCH-INDUCED >gb|AAC37419.1| (L34546) hypothetical protein F13G24.110 - Arabidopsis thaliana unknown ASPARTATE AMINOTRANSFERASE, MITOCHONDRIAL PRECURSOR (TRANSAMINASE A) (AC009177) hypothetical protein [Arabidopsis thaliana] aspartate--tRNA ligase homolog F6E21.100 - Arabidopsis thaliana ketoconazole resistance protein - Arabidopsis thaliana probable DNA-binding protein T27E13.1 - Arabidopsis thaliana (AC007197) dynamin-like protein [Arabidopsis thaliana] Unknown (AB016879) gb|AAF02153.1~gene_id:MRB17.3~similar to unknown protein CALMODULIN-RELATED PROTEIN 2, TOUCH-INDUCED >gb|AAB82713.1| (AF026473) (AC008148) Hypothetical protein [Arabidopsis thaliana] hypothetical protein T26B15.12 - Arabidopsis thaliana >gb|AAC25938.1| (AC016041) F27J15.25 [Arabidopsis thaliana] >gb|AAG29738.1|AC084414_6
-2 1:1 2
Slid
ePai
r1
S
lideP
air2
S
lideP
air3
S
lideP
air4
BR1 BR2 T
R
Figure 3.15 Hierarchical Clustering of 86 differentially expressed SACMV-infected Arabidopsis genes. Yellow blocks represent up-regulation and blue blocks down-regulation. Gray blocks indicate missing data and black blocks show no differential gene expression. Each column represents a different hybridization experiment and each row represents a specific gene. BR=Biological Replicate. TR=Technical Replicate.

82 3.5 Real-time RT-PCR
Five differentially expressed genes (including the reference, AGP6 protein [AJ012459]) from biological
replicate 2 were randomly selected from the 86 differentially expressed genes (Figure 3.15) for relative
quantification real-time RT-PCR. Expression ratios were determined from crossing points from real-time
RT-PCR amplification plots of target versus reference genes (Figure 3.16 A). Microarray and real-time
RT-PCR were in agreement in terms of up- and down-regulated genes (three out of four), except for the
putative WD-40 repeat protein (AC005917) (Table 3.4). Therefore a 75% confirmation of these results
was obtained. Specificity of real-time RT-PCR products was determined by gel electrophoresis. Results
indicated that a single product was obtained with the desired amplicon length for each gene (Figure 3.16
B). Primer and probe sequences used for relative quantification real-time RT-PCR are depicted in Table
2.1.

83 Table 3.4 A comparison between ratios (from biological replicate 2) obtained from real-time RT-PCR
and microarray analysis
* Real-time RT-PCR and microarray expression values relative to the reference gene (1.00/0.93). Values above the reference gene represent
up-regulation and values below the reference gene, down-regulation.
Accession
No.
Gene Name Amplicon
length
(bp)
Real-time
RT-PCR
Expression
ratios
Relative
Expression
(Up-or down-
regulated)
Microarray
Expression
ratios
Relative
Expression
(Up-or down-
regulated)
AJ012459
Reference
AGP6 protein
197
1.00*
0.92*
X98804
Target
peroxidase
ATP18a
150
1.10
Up
1.63
Up
U40341 carbamoyl
phosphate
synthetase large
chain
181 1.43 Up 1.13 Up
AC005917 putative WD-40
repeat protein
160 1.45 Up 0.86 Down
AC007197 dynamin-like
protein
183 0.78 Down 0.72 Down

84
BP 500
AGP6 Peroxidase Carbamoyl WD-40 Dynamin H I H I H I H I H I
H = Healthy cDNA I = Infected cDNA
Lane 2 3 4 5 6 7 8 9 10 11 12
A
Figure 3.16 Relative quantification real-time RT-PCR showing: (A) an increase in fluorescence with PCR cycle number in amplification plots of both healthy and infected cDNA. The four target genes are represented on the left plot and the reference gene on the right plot; (B) Single products separated on a 1% agarose gel revealing expected fragment sizes. Selected base pair size of MassRuler™ DNA Ladder (Fermentas Life Sciences) is indicated on the left.
B

85
CHAPTER 4
DISCUSSION This study was conducted to investigate the effects of SACMV infection in fully susceptible Arabidopsis
at 35 dpi. Gene expression studies were conducted using cDNA microarrays to determine both direct and
indirect effects of virus replication in fully susceptible Arabidopsis plants. An infectivity study was
carried out to monitor disease symptoms as well as virus progression in infected plants.
Infectivity Study
Arabidopsis plants were observed to be fully symptomatic 35 dpi, although symptoms started appearing at
approximately 28 dpi. Symptoms such as stunting of the entire plant, leaf reduction and deformation were
observed in infected Arabidopsis from both biological replicates (Figure 3.2 A,C,D and Figure 3.3 B,D,F).
The infectivity and host range of SACMV was previously assessed using Agrobacterium-mediated
inoculation of Phaseolus vulgaris, Malva parviflora, and cassava (Manihot esculenta Crantz) with
SACMV; symptoms of leaf curl, chlorosis and stunting were observed (Berrie et al., 2001). These
findings correlate with symptoms observed in this study, indicating for the first time that Arabidopsis is a
susceptible host for SACMV infection. A previous study conducted with the geminivirus, Beet curly top
virus (BCTV), infecting Arabidopsis showed that different strains (Logan and California) of BCTV differ
in their pathogenicity characteristics on susceptible hosts. Arabidopsis plants infected with BCTV-Logan
were clearly symptomatic three- to- four weeks post-inoculation with symptoms such as leaf curling and
deformation, development of stunted and deformed inflorescence structures, and the accumulation of
anthocyanin pigments (Lee et al., 1994). The occurrence of chlorotic symptoms can be viewed as the
direct result of the plants attempt to rescue resources from infected tissues via basal resistance
mechanisms. It has been suggested that if chlorosis is absent in infected tissues, a loss of basal resistance
has occurred (O´Donnell et al., 2003). In our study, chlorosis was only observed in four of the thirty
infected Arabidopsis plants at 35 dpi. A high level of viral replication was noted in infected parts of the
leaf tissues, as observed from quantitative real-time PCR, showing an approximated 3-fold increase in
virus titer from 13 dpi to 35 dpi. This suggests that the plant is able to no longer rescue resources from
surrounding tissues, as more metabolites are diverted toward SACMV replication. A study conducted by

86 Nagar et al. 2002, showed that a high level of the geminivirus, TGMV, replication correlated with
symptom formation in N. benthamiana, indicating that a strong association between active viral DNA
accumulation and symptom development exists. Similarly, in a gene expression study conducted by
Golem and Culver 2003, of Tobacco mosaic virus (TMV) in Arabidopsis Shahdara at both 4 dpi and 14
dpi, a greater fold change in TMV-responsive genes was observed at the later time point, suggesting that
higher levels of TMV were present at 14 dpi.
Controlling systematic variation in microarrays
Two biological and four technical replicates (within each biological replicate) were carried out to reduce
inherent biological inconsistencies between plants so that variation in gene expression for statistics
calculation was a true reflection of SACMV infection and not just natural plant variation. Biological
replicates (independent biological sources) measure the natural biological variability and account for any
random variation used in sample preparation. Furthermore, evaluation of RNA integrity (Figures 3.7A and
3.8A), purity (Table 3.1), and ensuring that no contaminating plant DNA was present in the RNA samples
(Figures 3.7B and 3.8B) were critical to achieve optimal hybridization efficiency. Technical replicates
(pooled RNA samples) account for the natural and systematic variability carried out during experimental
procedures (Quackenbush, 2002). Stringent criteria were applied to all steps of data analysis.
Normalization was applied to all intensity data sets as microarray experiments are normally subjected to a
variety of random and systematic errors. These errors may arise from various sources such as dye labeling
efficiencies, heat and light sensitivities, as well as scanner settings (Leung and Cavalieri, 2003). In
particular, locally weighted linear regression (LOWESS) was the normalization method of choice for
microarray assays as it removes intensity-dependent dye-specific effects in log2 ratios (Yang et al., 2002).
In this study, LOWESS corrected all deviations from the expected behaviour for each data point in the R-I
plot by applying a local weighted linear regression by subtracting the average ratio from the
experimentally observed ratio. A balanced distribution of expression ratios around zero was produced
therefore reducing the dye-specific artifacts most commonly occurring at low-intensity data points.
Standard deviation (SD) regularization normalization was applied to scale the data points so that extreme
log ratios became evenly distributed. This algorithm corrects for systematic variation in the array,
including slight local differences in hybridization conditions across the array, slide surface variability, and

87 inconsistencies among the spotting pens applied (Yang et al., 2002). Flip dye consistency checking
filtered out genes whose mean and SD for each replica pair was greater or less than two from the mean
(Yang et al., 2002). Good quality spots in each replicate pair were combined and used for downstream
analysis.
Validation of microarray results with real-time RT-PCR
In order to confirm microarray results, an independent experiment was required to validate the results
obtained from microarray analyses. Real-time RT-PCR was chosen as an alternate quantitative method as
it is an extremely sensitive method for detecting and quantifying gene expression levels. It is also
particular suitable for quantifying low abundance mRNA and is also able to elucidate small changes in
mRNA expression levels (Pfaffl et al., 2002). This method was particularly suitable for this study as the
five genes (including the reference gene) selected from microarray analyses had low expression levels
(Table 3.4). Microarray and real-time RT-PCR were in excellent agreement in terms of up- and down-
regulated genes (four out of five), except for the putative WD-40 gene. Therefore an 75% confirmation in
these results was obtained. The discrepancy between the putative WD-40 gene in real-time RT-PCR (1.45)
and microarray results (0.86) could be due to an error occurring in the microarray result. Allen et al. 2000,
suggested that if redundant copies of the sequence on the microarray slide are present, then the fluorescent
signals corresponding to a specific mRNA target could be titrated out. This could explain why the putative
WD-40 gene was showing a down-regulated value in microarray results as opposed to up-regulated in
real-time RT-PCR. It doesn’t seem feasible that the error would lie in real-time RT-PCR as both the
primers and probes were specifically designed for each gene. It does not however, rule out this possibility
as there is never a 100% efficiency of RNA that is reverse transcribed into cDNA. According to Freeman
et al. 1999, most of the variability existing in real-time RT-PCR occurs during the RT step, implying that
the signal output may be variable in different reactions. However, due to the increase in transcripts in real-
time RT-PCR as opposed to the decrease in transcripts in microarray data, it is likely that the error lies in
the microarray result. If there was an efficiency problem in the real-time RT-PCR result, then the ratio
would be lower than the microarray value.

88 Identification of differentially expressed SACMV-responsive Arabidopsis genes
A one-sample t- test was performed at the 99% confidence interval to identify differentially expressed
genes by comparing the means of healthy versus infected Arabidopsis leaf tissues. Of the 86 differentially
expressed genes, 48 were shown to be up-regulated and 38 down-regulated (Figure 3.15). Gene groups
were hierarchically clustered by related regulation patterns and expression amplitudes. In this study, genes
with log2 ratios of above 0.5 or below -0.5 were selected for functional analysis (Table 3.3). A general
overview of selected genes such as the up-regulated ATP synthase epsilon chain (D88377), up-regulated
putative MAP kinase (AC006913), down-regulated putative membrane channel protein (AC005727), and
down-regulated probable DNA binding protein (T27E13.1) in Table 3.3 suggests that a variety of
metabolic processes in the Arabidopsis genome have been affected. According to Escaler et al. 2000, this
general induction and suppression of genes implies that viruses may induce common stress responses in
order to produce cellular responses sited for replication. Viruses may also suppress host gene expression
to avoid direct competition for host cellular factors to enable efficient viral gene expression and
replication.
Analysis of up-regulated genes
The majority of up-regulated genes in SACMV-infected Arabidopsis apppeared to be involved in a
general stress response of the host (Table 3.3). Genes such as the putative MAP kinase (AC006931)
showed up-regulation with a log2 value of 0.6. MAP kinases (mitogen-activated protein kinases) have
been implicated in both biotic and abiotic stress responses in plants. Abiotic stresses include
environmental stresses such as dehydration, salinity, chilling, and wounding. Biotic stresses on the other
hand, are caused by pathogen infection. Cumulatively, these factors affect the growth and metabolism of
the plant (Yuasa et al., 2001). MAP kinases have therefore been implicated as mediators in response to
abiotic or biotic sources for reactive oxygen species (ROS) such as superoxide, hydrogen peroxide, and
hydroxyl radicals, which are associated with a number of physiological disorders in plants (Yuasa et al.,
2001).
Likewise, in this study, another gene that was up-regulated, which is also associated with ROS, was
peroxidase ATP18a (X98804) (Table 3.3). Peroxidase is associated with the oxidative burst that is usually

89 induced within minutes of contact between a host and pathogen. ROIs act together with a number of
other signalling molecules which are important for activating defense in adjacent cells as well as in the
whole plant (Wan et al., 2002). In this study, a continuous up-regulation of peroxidase up to 35 dpi, may
suggest an attempt by the host plant, Arabidopsis, to mount some form of delayed basal defense response,
but this is insufficient or ineffective to prevent SACMV replication and disease development. Previous
studies have suggested that changes in gene expression, ROS production as well as cell wall composition
also occurs in susceptible responses, but these responses are delayed, reiterating that effective resistance is
dependent on the speed with which these responses are activated (O´Donnell et al., 2003).
A very interesting finding in this study was the up-regulated Elongation Factor 1-Alpha (EF-1-Alpha)
gene. This gene was found to have the highest log2 value of 1.0. In previous studies, EF-1-Alpha, along
with beta tubulin and importin, has been implicated in intra- and inter-cellular virus trafficking. Beta
tubulin (the building blocks of microtubules) has been implicated in cell-to-cell spread and cytoplasm-to-
nucleus movement of viruses (Fregene et al., 2004). This is an important association since geminivirus
DNA must move into the nucleus for replication to take place. EF-1-Alpha has been shown to deliver
aminoacyl-tRNA to ribosomes and is therefore an essential part of the translation machinery (Fregene et
al., 2004). It was also previously shown that the 3'-terminal stem-loop of West Nile virus binds to EF-1-
Alpha, incorporating it into the viral replication machinery (Cimarelli and Luban, 1999), and we can
therefore speculate that the up-regulation of this gene by SACMV may be acting in a similar manner as in
the case of West Nile virus. The faster SACMV is able to replicate, the more host cells become infected,
leaving Arabidopsis with less time to mount appropriate defense responses. Effective resistance is
dependent on the speed in which induced defense reactions occurs in susceptible (compatible) and
resistant (incompatible) interactions (O´Donnell et al., 2003). Alternatively, if EF-1-Alpha is not
incorporated into the viral replication machinery it may still assist in viral translation, enabling viral
replication in the host cell. EF-1-Alpha has recently been identified in cassava, the natural host for
SACMV, using SAGE analysis, in both resistant (TME3) and susceptible (TMS30555) cassava cultivars
(Fregene et al., 2004). This finding may have important implications for future studies in SACMV-
cassava interactions as this gene was found to be the most up-regulated gene in this study due to viral
infection, and has also been implicated as an essential part of the host translation machinery (Fregene et
al., 2004).

90 Down-regulated gene analysis
GDSL-motif lipase/hydrolase-like protein (AB018107) was shown to be down-regulated with a log2 value
of -0.7. It has been assigned to be putativley involved in protein ubiquitination, DNA repair, and zinc ion
binding. Particular attention was drawn to this protein’s involvement in protein ubiquitination. This
process is responsible for controlling protein abundance in the plant. Degradation of proteins thus occurs
via the ubiquitin 26S proteasome pathway, which is essential for entry into the S phase, sister chromatid
separation, and exit from mitosis (Skowyra et al., 1997). The ubiqitin (Ub)/26S proteasome pathway is the
main proteolytic pathway in eukaryotes. Ub serves to bind specific protein targets via an ATP-dependent
reaction cascade, where the 26S proteasome recognizes this Ub-protein pair, releasing Ub for rescue in the
cell. This cycle therefore removes abnormal proteins by performing a housekeeping function. We
therefore hypothesize that SACMV may be exerting a suppressive response to prevent its own coat protein
degradation. In addition we can speculate that by ubiquitin suppression, entry into the S phase can take
place where the virus can actively replicate. Previous studies have shown that Tomato golden mosaic
virus, along with inducing the expression and accumulation of proliferating cell nuclear antigen (PCNA;
processivity factor for DNA polymerase delta), also interferes with host cell cycle regulation (Hanley-
Bowdoin et al., 2004). This occurs through interaction with the retinoblastoma-related protein (pRBR)
which shifts mature cells to the S phase in the cell cycle, creating a more favourable cellular environment
for viral DNA synthesis (Egelkrout et al., 2002).
The protein F13G24.110 (Table 3.3) was found to be down-regulated by SACMV. This protein has been
identified as showing similarity to the leucine-rich repeat (LRR) family protein (At5g07910.1). LRR
proteins have been broadly identified in pathogen recognition with regards to intercellular/intracellular
receptors and disease resistance (Bent et al., 1994). The suppression of this LRR-related protein could
suggest a putative strategy of SACMV to avoid induction of a defense response in Arabidopsis. Host
repression during virus replication has also been observed in studies conducted with TMV in Arabidopsis
ecotype Shahdara (Golem and Culver, 2003), as well as with other RNA viruses such as Pea seed-borne
mosaic virus (PSbMV) (Wang and Maule, 1995; Aranda et al., 1996) and Cucumber mosaic virus (CMV)
(Havelda and Maule, 2000). In the TMV study, general gene repression was more evident in systemic
tissues at 14 dpi, compared to 4 dpi, while an increase in the amount of differentially expressed genes was
found at the 14 dpi time point. TMV responsive genes included those involved in transcription,
metabolism, signal transduction and stress, indicating that a range of host functions becomes affected
91 (Golem and Culver, 2003). This correlates with our study in that SACMV responsive genes were
involved primarily in metabolism, transcription, and transport. The recorded changes by SACMV in host
gene expression in fully symptomatic systemically infected Arabidopsis leaves at 35 dpi correlate to
highly active SACMV replication, reflected by a significant increase in virus titer.
Other genes of interest shown to be down-regulated included a putative membrane channel protein, and a
touch-related Calmodulin protein 3 (>gb|AAC37419.1|). These proteins have been implicated in plant
defense, in which an increase in ion fluxes has been observed across plasma membranes upon pathogen
recognition, activating downstream defense responses (Wan et al., 2002). In this study, Calmodulin down-
regulation could be a result of a decrease in host mRNA transcripts due to induced degradation by
SACMV. In studies conducted by Aranda et al. 1996, and Escaler et al. 2000b, heat shock protein 70
(HSP70) and polyubiquitin genes were shown to be upregulated whereas lipoxygenase and heat shock
cognate proteins were down-regulated. It is therefore suggested from these studies that degradation of
mRNAs may occur as part of a general host suppression strategy by plant viruses. It was also noted that
the down-regulated Ketoconazole Resistance protein (associated with senescence protein family) in
SACMV-infected Arabidopsis at 35 dpi was down-regulated. It is possible that SACMV might be exerting
a suppressive effect on these resistance proteins through mRNA degradation strategies in order to ensure
host support in replication. Host plant tissue senescence would not favour virus propagation. At 35 dpi,
SACMV-infected Arabidopsis showed distinct stunting (and chlorosis in a few selected plants), but no
evidence of leaf senescence was observed (Figure 3.3B). According to Maule et al., 2002, in order to
place virus gene expression at an advantage to host gene expression in a compatible host, a selective host-
gene shut-off strategy must be employed to enable virus replication.
Summary
The interaction between fully susceptible Arabidopsis ecotype Col-0 and SACMV was examined by
identifying plant genes that were differentially expressed through SACMV infection. An overall view of
this study suggests that similarities and differences exist among virus-host interactions due to the tissue
specificity of the virus, speed of infection as well as the timing of infection. This current study therefore
provided insight into some of the genes that were up- or down-regulated as a result of a general host or a
more viral specific host response due to SACMV infection in fully symptomatic Arabidopsis plants (at 35
92 dpi). Future studies will entail using time points to determine: if transient or long-lasting host gene
expression will result, monitor possible increases or decreases in gene expression between the different
time points, and to monitor gene expression patterns in a variety of host tissues. To our knowledge, this is
the first microarray study involving a DNA geminivirus interaction in a compatible host. These findings
therefore contribute to the limited knowledge of signalling mechanisms underlying plant-pathogen
interactions leading to disease development or resistance. Gene identification and function in signalling
pathways will eventually lead towards the engineering of tolerant plants. Tolerant plant varieties are able
to produce high plant yields even when infected with pathogens.
Future gene expression studies in cassava, the natural host for SACMV using microarrays
Sequence conservation or similarities has been shown to exist among plant families. The next step
involved in this area of research will entail utilizing SACMV-infected cassava cDNAs hybridized to
Arabidopsis cDNA microarray chips for homology detection. Possible identification and function of genes
may show similarities with genes already analyzed from this current study, providing underlying
mechanisms that may contribute to breeding resistant or tolerant cassava lines.
To date, only one dominant resistance gene has been isolated from cassava. The next objective of this
study will therefore entail suppressive subtractive hybridization (SSH) of a resistant and a susceptible
cassava line. Enriched cDNA fragments will then be cloned into a vector to create a cDNA library
containing only resistant or defense-related genes. These cDNAs will then be spotted onto an array
providing a platform where resistant cassava lines may be hybridized to the array, allowing possible
identification of resistance genes. Isolation of novel resistance genes will eventually lead to the underlying
mechanisms controlling genes in resistance pathways that naturally occur in crops. Functions may
therefore be assigned to novel resistance genes, which may eventually be used in cassava plant breeding
systems or in genetically modified cassava for crop improvement.

93
CHAPTER 5
REFERENCES Abramovitch, R.B. and Martin, G.B. (2004) Strategies used by bacterial pathogens to suppress plant
defenses. Current Opinion in Plant Biology 7: 356-364.
Adams, M.D., Kelley, J.M., Gocayne, J.D., Dubnick, M., Polymeropoulos, M.H., Xiao, H., Merril, C.R.,
Wu, A., Olde, B., Moreno, R.F., Kerlavage, A.R., McCombie, W.R. and Venter, J.C. (1991)
Complementary DNA sequencing: expressed sequence tags and human genome project. Science 252:
1651-1656.
Aharoni, A. and Vorst, O. (2001) DNA microarrays for functional plant genomics. Plant Molecular
Biology 48: 99-118.
Alleman, J. and Coertze, A.F. (1996) The Cultivation of Cassava. Vegetable and Ornamental Plant
Institute, Pretoria, 1-5.
Allen, T.D., Dawe, A.L. and Nuss, D.L. (2002) Use of cDNA microarrays to monitor transcriptional
responses of the chestnut blight fungus Cryphonectria parasitica to infection by virulence-attenuating
hypoviruses. Eukaryotic Cell 2(6): 1253-1265.
Anderson, J.V., Delseny, M., Fregene, M.A., Jorge, V., Mba, C., Lopez, C., Restrepo, S., Soto, M., Piegu,
B., Verdier, V., Cooke, R., Tohme, J. and Horvath, D.P. (2004) An EST resource for cassava and other
species of Euphorbiaceae. Plant Molecular Biology 56: 527-539.
Aranda, M.A., Escaler, M., Wang, D., and Maule, A.J. 1996. Induction of HSP70 and polyubiquitin
expression associated with plant virus replication. Proceedings of the National Academy of Sciences
93:15289-15293.

94 Arguella-Astorga, G., Lopez-Ochoa, L., Kong, L., Orozco, B.M., Settlage, S.B. and Hanley-Bowdoin,
L. (2004) A novel motif in geminivirus replication proteins interacts with the plant retinoblastoma-related
protein. Journal of Virology 4817-4826.
Bent, A.F., Kunkel, B.N.,Dahlbeck, D., Brown, K.L., Schmidt, R., Giraudat, J., Leung, J., Staskawicz,
B.J. 1994. RPS2 of Arabidopsis thaliana: a leucine-rich repeat class of plant disease resistance genes.
Science 265:1856-1860.
Bent, A.F. (1996) Plant Disease Resistance Genes: Function Meets Structure. The Plant Cell 8:1757-1771.
Berrie, L.C., Palmer, K.E., Rybicki, E.P. and Rey, M.E.C. (1998) Molecular characterization of a distinct
South African cassava infecting geminivirus. Archives of Virology 143:2253-2260.
Berrie LC, Rybicki EP, and Rey MEC (2001) Complete nucleotide sequence and host range of South
African cassava mosaic virus: Further evidence of recombination amongst begomoviruses. Journal of
General Virology 82: 53-58.
Berry, S. and Rey, M.E.C. (2001) Molecular evidence for diverse populations of cassava-infecting
begomoviruses in southern Africa. Archives of Virology 146:1795-1802.
Bock, K.R., Guthrie, E.J. and Meredith, G.C. (1978) Distribution, host range, properties and purification
of cassava latent virus, a geminivirus. Annals of Applied Biology 90: 361-367.
Bock, K.R. and Woods, R.D. (1983) Etiology of African cassava mosaic disease. Plant Disease 67: 944-
955.
Briddon, R.W., Watts, J., Markham, P.G. and Stanley, J. (1989) The coat protein of Beet curly top virus is
essential for infectivity. Virology 172:628-633.
Brown, P.O. and Botstein, D. (1999) Exploring the new world of the genome with DNA microarrays.
Nature Genetics (supplement) 21: 33-37.

95 Carrington, J.C. and Whitham, S.A. (1998) Viral invasion and host defense: strategies and counter-
strategies. Current Opinion in Plant Biology 1: 336-341.
Cecchini, E., Al-Kaff, N.S., Bannister, A., Giannakou, M.E., McCallum, D.G., Maule, A.J., Milner, J.J.
and Covey, S.M. (1998) Pathogenic interactions between variants of cauliflower mosaic virus and
Arabidopsis thaliana. Journal of Experimental Botany 49(321): 731-737.
Chomczynski, P. and Sacchi, N. (1987) Single-step method of RNA isolation by acid guanidinium
thiocyanate-phenol-chloroform extraction. Analytical Biochemistry 162: 156-159.
CIATa (Centro Internacional de Agricultura Tropical). (2001) Cassava: A Crop for Hard Times and
Modern Times. www.ciat.cgiar.org/ciatinfocus/pdf/cassavafocus.pdf.
Cimarelli, A., and Luban, J. 1999. Translation elongation factor 1-alpha interacts specifically with the
human immunodeficiency virus type 1 Gag polyprotein. Journal of General Virology (73)7:5388-5401.
Clarke, G.M. (1994) Statistics and experimental design. An introduction for biologists and biochemists.
John Wiley and Sons Inc, New York.
Cooley, M.B., Pathirana, S.,Wu, H-J., Kachroo, P. and Klessig, D.F. (2000) Members of the Arabidopsis
HRT/RPP8 family of resistance genes confer resistance to both viral and oomycete pathogens. The Plant
Cell 12: 663-676.
Dahniya, M.T. (1994) An Overview of Cassava in Africa. African Crop Science Journal 2(4): 337-343.
Dangl, J.L. and Jones, D.G. (2001) Plant pathogens and integrated defense responses to infection. Nature
411: 826-833.
de la Riva, G., González-Cabera, J., Vázquez-Pardrón, R. and Ayra-Pardo, C. (1998) Agrobacterium
tumefaciens: a natural tool for plant transformation. Electronic Journal of Biotechnology 1(3):118-133.
Dong, X. (1998) SA, JA, ethylene, and disease resistance in plants. Current Opinion in Plant Biology 1:
316-323.

96
Donson, J., Fang, Y., Espiritu-Santo, G., Xing, W., Salazar, A., Miyamoto, S., Armendarez, V. and
Volkmuth, W. (2002) Comprehensive gene expression analysis by transcript profiling. Plant Molecular
Biology 48: 75-79.
Doyle, J.J. and Doyle, J.L. (1987) A rapid isolation procedure for small quantities of fresh leaf tissue.
Phytochemical Bulletin 19:11-15.
Eckardt, N.A. (2004) Host proteins guide Agrobacterium-mediated plant transformation. The Plant Cell
16: 2837-2839.
Egelkrout, E.M., Mariconti, L., Settlage, S.B., Cella, R., Robertson, D. and Hanley-Bowdoin, L. (2002)
Two E2f elements regulate the proliferating cell nuclear antigen promoter differently during leaf
development. The Plant Cell 14:3225-3236.
El-Sharkawy, M.A. (2004) Cassava biology and physiology. Plant Molecular Biology 56: 481-501.
Escaler, M., Aranda, M.A., Thomas, C.L. and Maule, A.J. (2000a) Pea embryonic tissues show common
responses to the replication of a wide range of viruses. Virology 267: 318-325.
Escaler, M., Aranda, M.A., Roberts, I.M., Thomas, C.L., and Maule, A.J. (2000b) Acomparison between
virus replication and abiotic stress (heat) as modifiers of host gene expression in pea. Molecular Plant
Pathology 1(3):159-167.
Fauquet, C.M., Bisaro, D.M., Briddon, R.W., Brown, J.K., Harrison, B.D., Rybicki, E.P., Stenger, D.C.
and Stanley, J. (2003) Revision of taxonomic criteria for species demarcation in the family Geminiviridae,
an updated list of begomovirus species. Archives of Virology 148: 405-421.
Feys, B.J. and Parker, J.E. (2000) Interplay of signaling pathways in plant disease resistance. Trends in
Genetics 16(10): 449-455.

97 Feys, B.J., Moisan, L.J., Newman, M. and Parker, J.E. (2001) Direct interaction between the
Arabidopsis disease resistance signaling proteins, EDS1 and Pad4. The EMBO Journal 20(19): 5400-
5411.
Fondong, V.N., Pita, J.S., Rey, M.E.C., de Kochko, A., Beachy, R.N. and Fauquet, C.M. (2000) Evidence
of synergism between African cassava mosaic virus and a new double recombinant geminivirus infecting
cassava in Cameroon. Journal of General Virology 81: 287-297.
Freeman, W.M., Walker, S.J. and Vrana, K.E. (1999) Quantitative RT-PCR: pitfalls and potential.
Biotechniques 26: 112-125.
Fregene, M., Matsumura, H., Akano, A., Dixon, A. and Terauchi, R. (2004) Serial analysis of gene
expression (SAGE) of host-plant resistance to the cassava mosaic disease (CMD). Plant Molecular
Biology 56: 563-571
Gafni, Y. and Epel, B.L. (2002) The role of host and viral proteins in intra- and inter-cellular trafficking of
geminiviruses. Physiological and Molecular Plant Pathology 60:231-241.
Gelvin, S.B. (2003) Agrobacterium-mediated plant transformation: the biology behind the “gene-
jockeying” tool. Microbiology and Molecular Biology Reviews 67(1): 16-37.
Geri, C., Cecchini, E., Giannakou, M.E., Covey, S.N. and Milner, J.J. (1999) Altered patterns of gene
expression elicited by cauliflower mosaic virus (CaMV) infection and by a CaMV gene VI transgene.
Molecular Plant-Microbe Interactions 12(5): 377-384.
Geri, C., Love, A.J., Cecchini, E., Barrett, S.J., Laird, J., Covey, S.M. and Milner, J.J. (2004) Arabidopsis
mutants that suppress the phenotype induced by transgene-mediated expression of cauliflower mosaic
virus (CaMV) gene VI are less susceptible to CaMV-infection and show reduced ethylene sensitivity.
Plant Molecular Biology 56: 111-124.
Glazebrook, J. (2001) Genes controlling expression of defense responses in Arabidopsis – 2001 status.
Current Opinion in Plant Biology 4: 301-308.

98 Golem, S. and Culver, J.N. (2003) Tobacco mosaic virus induced alterations in the gene expression
profile of Arabidopsis thaliana. Molecular Plant-Microbe Interactions 16(8): 681-688.
Grimsley, N., Hohn, B., Hohn, T. and Walden, R. (1986) “Agroinfection,” an alternative route for viral
infection of plants by using the Ti plasmid. Proceedings of the National Academy of Sciences 83:3282-
3286.
Gutierrez, C. (1999) Geminivirus DNA replication. Cellular and Molecular Life Sciences 56: 313-329.
Gutierrez, C. (2000) DNA replication and cell cycle in plants: learning from geminiviruses. The EMBO
Journal 19(5): 792-799.
Gutierrez, C. (2002) Strategies for geminivirus DNA replication and cell cycle interference. Physiological
and Molecular Plant Pathology 60: 219-230.
Gutierrez, C., Ramirez-Parra, E., Castellano, M.M., Sanz-Burgos, A.P., Luque, A. and Missich, R. (2004)
Geminivirus DNA replication and cell cycle interactions. Veterinary Microbiology 98: 111-119.
Hammond-Kosack KE, and Jones JDG (1996) Resistance Gene-Dependent Plant Defense Responses. The
Plant Cell 8:1773-1791.
Hanley-Bowdoin, L., Settlage, S.B., and Robertson, D. (2004) Reprogramming plant gene expression: a
prerequisite to geminivirus DNA replication. Molecular Plant Pathology 5(2):149-156.
Harrison, B.D., Zhou, X., Otim-Nape, G.W., Liu, Y. and Robinson, D.J. (1997) Role of a novel type of
double infection in the geminivirus-induced epidemic of severe cassava mosaic in Uganda. Annals of
Applied Biology 131: 2437-2443.
Harrison, B.D. and Robinson, D.J. (2002) Green shoots of geminivirology. Physiological and Molecular
Plant Pathology 60: 215-218.
Havelda, Z. and Maule, A.J. (2000) Complex spatial responses to Cucumber mosaic virus infection in
susceptible Cucurbita pepo Cotyledons. The Plant Cell 12: 1975-1985.

99
Hayes, R.J., Coutts, H.A. and Buck, K.W. (1988) Agro-infection of Nicotiana spp. with cloned DNA of
Tomato golden mosaic virus. Journal of General Virology 69:1487-1496.
Hillocks, R.J. and Thresh, J.M. (2001) Cassava Mosaic and Cassava Brown Streak Virus Diseases in
Africa: A comparative guide to symptoms and aetiologies. Roots 7(1): 36-50.
Hegde, P., Qi, R., Abernathy, K., Gay, C., Dharap, S., Gaspard, R., Earl-Hughes, J., Snesrud, E., Lee, N.
and Quackenbush, J. (2000) A concide guide to cDNA microarray analysis. Biotechniques 29(3): 548-562.
Hong, Y.G., Robinson, D.J. and Harrison, B.D. (1993) Nucleotide sequence evidence for the occurrence
of three distinct whitefly-transmitted geminiviruses in cassava. Journal of General Virology 74: 2437-
2443.
Horvath, D.P., Schaffer, R., West, M. and Wisman, E. (2003) Arabidopsis microarrays identify conserved
and differentially expressed genes involved in shoot growth and development from distantly related plant
species. The Plant Journal 34: 125-134.
International Institute of Tropical Agriculture (IITA) (2001) Cassava Mosaic Disease pandemic mitigation
in East Africa. Third Quarterly Technical Report.
http://www.tropicalwhiteflyipmproject.cgiar.org/docs/ofdareport12.pdf.
Jacob, S.S., Vanitharani, A., Karthikeyan, S., Chincore, Y., Thillaichidambaram, P. and Veluthambi, K.
(2003) Mungbean yellow mosaic virus-Vi agroinfection by codelivery of DNA A and DNA B from one
Agrobacterium strain. Plant Disease 87(3): 247-251.
Kong, L. and Hanley-Bowdoin, L. (2002) A geminivirus replication protein interacts with a protein kinase
and a motor protein that display different expression patterns during plant development and infection. The
Plant Cell 14: 1817-1832.
Lee, S., Stenger, D.C., Bisaro, D.M. and Davis, K. (1994) Identification of loci in Arabidopsis that confer
resistance to geminivirus infection. The Plant Journal 6(4):525-535.

100 Legg, J.P., Thresh, J.M. (2000) Cassava mosaic virus disease in East Africa: a dynamic disease in a
changing environment. Virus Research 71: 135-149.
Leiser, R.M., Ziegler-Graff, V., Reutenauer, A., Herbach, E., Lemaire, O., Guilley, H., Richards, K. and
Jonard, G. (1992). Agroinfection as an alternative to insects for infecting plants with beet western yellows
luteovirus. Proceedings of the National Academy of Sciences 89:9136-9140.
Leung, Y.F. and Cavalieri, D. (2003) Fundamentals of cDNA microarray data analysis. Trends In
Genetics 19(11): 649-659.
Li, H, Lucy, A.P., Guo, H., Li, W., Ji, L., Wong, S. and Ding, S. (1999) Strong host resistance targeted
against a viral suppressor of the plant gene silencing defence mechanism. The EMBO Journal 18(10):
2683-2691.
Lipshutz, R., Fodor, S.P.A., Gingeras, T.R. and Lockhart, D.J. (1999) High density synthetic
oligonucleotide arrays. Nature genetics (supplement) 21:20-24.
Livak, K.J. and Schmittgen, T.D. (2001) Analysis of relative gene expression data using real-time
quantitative PCR and the 2-��CT method. Methods 25: 402-408.
Mathews, C. (2000) Cassava production by small holder farmers in Mpumalanga:A case study. Lowveld
Research unit, Department of Agriculture Conservation and Environment, P/Bag x11318, Nelspruit-1200.
Mackay, I.M., Arden, K.E. and Nitsche, A. (2002) Real-time PCR in virology. Nucleic Acids Research
30(6): 1292-1305.
Maule, A., Leh, V. and Lederer, C. (2002) The dialogue between viruses and hosts in compatible
interactions. Current Opinion in Plant Biology 5: 1-6.
Mayo, M., Ryabov, E., Fraser, G. and Taliansky, M. (2000) Mechanical transmission of Potato leafroll
virus. Journal of General Virology 81: 2791-2795.

101 McDowell, J., Dhandaydham, M., Long, T., Aarts, M., Goff, S., Holub, E. and Dangl, J. (1998)
Intragenic recombination and diversifying selection contribute to the evolution of downy mildew
resistance at the RPP8 locus of Arabidopsis. The Plant Cell 10: 1861-1874.
Meinke, D.W., Cherry, J.M., Dean, C., Rounsley, S.D. and Koornneef, M. (1998) Arabidopsis thaliana: a
model plant for genome analysis. Science 282: 662-682.
Mysore, K.S., Tuori, R.P. and Martin, G.B. (2001) Arabidopsis genome sequence as a tool for functional
genomics in tomato. Genome Biology 2(1):reviews1003.1-1003.4.
Mysore, K.S. and Ryu, C. (2004) Nonhost resistance: how much do we know? Trends in Plant Science
9(2): 97-104.
Nagar, S., Hanley-Bowdoin, L., and Robertson, D. (2002) Host DNA replication is induced by
geminivirus infection of differentiated plant cells. The Plant Cell 14:2995-3007.
Nestel, B. (1980) Optima 1: Cassava, A new outlook for an ancient crop. United Nations Food and
Agricultural Organisation, 53-68
O´Donnell, P.J., Schmelz, E.A., Moussatche, P., Lund, S.T., Jones, J.B. and Klee, H.J. (2003) Susceptible
to intolerance - a range of hormonal actions in a susceptible Arabidopsis pathogen response. The Plant
Journal 33: 245-257.
Olsen, K.M. (2004) SNPs, SSRs and inferences on casssava’s origin. Plant Molecular Biology 56: 517-
526.
Petty, I.T.D., Carter, S.C., Morra, M.R., Jeffrey, J.L. and Olivey, H.E. (2000) Bipartite geminivirus host
adaptation determined cooperatively by coding and noncoding sequences of the genome. Virology 277:
429-438.
Pfaffl, M.W. (2001) A new mathematical model for relative quantification in real-time RT-PCR. Nucleic
Acids Research 29(9): 2002-2007.

102 Pfaffl, M.W., Horgan, G.W. and Dempfle, L. (2002) Relative expression software tool (REST©) for
group-wise comparison and statistical analysis of relative expression results in real-time PCR. Nucleic
Acids Research 30(9): 1-10.
Picó, B., Ferriol, m., D�ez, M.J. and Vi�als, F.N. (2001) Agroinoculation methods to screen wild
Lycopersicon for resistance to Tomato yellow leaf curl virus. Journal of Plant Pathology 83(3): 215-220.
Pita, J.S., Fondong, V.N., Sangar, A., Otim-Nape, G.W., Ogwal, S. and Fauquet, C.M. (2001)
Recombination, pseudorecombination and synergism of geminiviruses are determinant keys to the
epidemic of severe cassava mosaic disease in Uganda. Journal of General Virology 82: 655-665.
Puonti-Kaerlas, J. (1998) Cassava Biotechnology. Biotechnology and Genetic Engineering Reviews 15:
329-364.
Quackenbush, J. (2002) Microarray data normalization and transformation. Nature Genetics Supplement
32: 496-501
Rajeevan, M.S., Vernon, S.V., Taysavang, N. and Unger, E.R. (2001) Validation of array-based gene
expression profiles by real-time (kinetic) RT-PCR. Journal of Molecular Diagnostics 3(1): 26-31.
Reynolds, M.A. (2002) Microarray technology, GEM microarrays and drug discovery. Journal of
Industrial Microbiology and Biotechnology 28:180-185.
Rishi, A.S., Nelson, N.D. and Goyal, A. (2002) DNA microarrays: gene expression profiling in plants.
Reviews in Plant Biochemistry and Biotechnology 1: 81-100.
Schenk, P.M., Kazan, K., Wilson, I., Anderson, J.P., Richmond, T, Somerville, S.C. and Manners, J.M.
(2000) Coordinated plant defense responses in Arabidopsis revealed by microarray analysis. Proceedings
of the National Academy of Sciences 97(21): 11655-11660.
Scholthof, H.B. (2001) Molecular plant-microbe interactions that cut the mustard. Plant Physiology 127:
1476-1483.
103 Selth, L.A., Randles, J.W. and Rezaian, M.A. (2004) Host responses to transient expression of
individual gebes encoded by Tomato leaf curl virus. .Molecular Plant-Microbe Interactions 17 (1):27-33.
Scheideler, M., Schlaich, N.L., Fellenberg, K., Beissbarth, T., Hauser, N.C., Vingron, M., Slusarenko, A.J.
and Hoheisel J.D. (2002) Monitoring the switch from housekeeping to pathogen defense in Arabidopsis
thaliana using cDNA microarrays. The Journal of Biological Chemistry 227(12):10555-10561.
Skowyra, D., Craig, K.L., Tyers, M., Elledge, S. and Harper, J.W. (1997) F-box proteins are receptors that
recruit phosphorylated substrates to the SCF ubiquitin-ligase complex. Cell 91: 209-219.
Speulman, E., Bouchez, D., Holub, E.B. and Beynon, J.L. (1998) Disease resistance gene homologs
correlate with disease resistance loci of Arabidopsis thaliana. The Plant Journal 14(4):467-474.
Staskawicz, B.J., Ausubel, F.M., Baker, B.J., Ellis, J.G. and Jones, J.D.G. (1995) Molecular genetics of
plant disease resistance. Science 268: 661-667.
Stenger, D.C., Carbonaro, D. and Duffus, J.E. (1990) Genomic characterization of phenotypic variants of
beet curly top virus. Journal of General Virology 71: 2211-2215.
Stenger, D.C., Revington, G.N., Stevenson, M.C. and Bisaro, D.M. (1991) Replicational release of
geminivirus genomes from tandemly repeated copies: evidence for rolling-circle replication of a plant
viral DNA. Proceedings of the National Academy of Sciences 88: 8029-8033.
Storey, H.H. (1936) Virus diseases of East African plants. VI. A progress report on studies of the diseases
of cassava. East African Agricultural Journal 2: 34-39.
Takahashi, H., Miller, J., Nozaki, Y., Sukamto, Takeda, M., Shah, J., Hase, S., Ikegami, M., Ehara, Y. and
Dinesh Kumar, S.P. (2002) Arabidopsis thaliana RPP8/HRT family resistance gene, conferring resistance
to cucumber mosaic virus requires salicyclic acid, ethylene and a novel signal transduction mechanism.
The Plant Journal 32: 655-667.
Tang, X., Xie, M., Kim, Y.J., Zhou, J., Klessig, D.F. and Martin GB (1999) Overexpression of Pto
Activates Defense Responses and Confers Broad resistance. The Plant Cell 11:15-29.

104 Trench, T.N. and Martin, M.M. (1985) An assessment of African Cassava Mosaic Disease in South
Africa and Swaziland. South African Journal of Plant Soil 2:169-170.
Tzfira, T. and Citovsky, V. (2002) Partners-in-infection:host proteins involved in the transformation of
plant cells by Agrobacterium. Trends in Cell Biology 12(3): 121-129.
van Hal, N.L.W., Vorst, O., van Houwelingen, A.M.M.L., Kok, E.T., Peijnenburg, A., Aharoni, A., van
Tunen, A.J. and Keijer, J. (2000) The application of DNA microarrays in gene expression analysis.
Journal of Biotechnology 78: 271-280.
Vanitharani, R., Chellappan, P., Pita, J.S. and Fauquet, C.M. (2004) Differential roles of AC2 and AC4 of
cassava geminiviruses in mediating synergism and suppression of posttranscriptional gene silencing.
Journal of Virology 9487-9498.
Venisse, J., Malnoy, M., Faize, M., Paulin, J. and Brisset, M. (2002) Modulation of defense responses of
Malus spp. during compatible and incompatible interactions with Erwinia amylovora. Molecular Plant-
Microbe Interactions 15(12): 1204-1212.
Wan, J., Dunning, F.M. and Bent, A.F. (2002) Probing plant-pathogen interactions and downstream
defense signaling using DNA microarrays. Functional and Integrative Genomics 2: 259-273.
Wang, D., and Maule, A.J. (1995) Inhibition of host gene expression associated with plant virus
replication. Science 267:229-231.
Ward, D.V. and Zambryski, P.C. (2001) The six functions of Agrobacterium VirE2. Proceedings of the
National Academy of Sciences 98(2): 385-386.
Whitham, S.A., Quan, S., Chang, H., Cooper, B., Estes, B. and Zhu, T. (2003) Diverse RNA viruses elicit
the expression of common sets of genes in susceptible Arabidopsis thaliana plants. The Plant Journal
33:271-283.
Wullschleger, S.D and Difazio, S.P. (2003) Emerging use of gene expression microarrays in plant
physiology. Comparative and Functional Genomics 4: 216-224.

105
Wyatt, S.D. and Brown, J.K. (1996) Detection of subgroup III geminivirus isolates in leaf extracts by
degenerate primers and polymerase chain reaction. Phytopathology 86:1288-1293.
Yang, I.V., Chen, E., Hasseman, J.P., Liang, W., Frank, B.C., Wang, S., Sharov, V., saeed, A.I., White, J.,
Li, J., Lee, N.H., Yeatman, T.J. and Quackenbush, J. (2002) Within the fold: assessing differential
expression measures and reproducibility in microarray assays. Genome Biology 3(11): 1-13.
Yu, I., Parker, J. and Bent, A.F. (1998) Gene-for-gene disease resistance without the hypersensitive
response in Arabidopsis dnd1 mutant. Proceedings of the National Academy of Sciences 95: 7819-7824.
Yuasa, T., Ichimura, K., Mizoguchi, T. and Shinozaki, K. (2001) Oxidative stress activates ATMPK6, an
Arabidopsis homologue of MAP kinase. Plant Cell Physiology 42(9): 1012-1016.
Zhou, X., Liu, Y., Calvert, L., Munoz, C., Otim-Nape, G.W., Robinso,n D.J. and Harrison, B.D. (1997)
Evidence that DNA-A of a geminivirus associated with severe cassava mosaic disease in Uganda has
arisen by interspecific recombination. Journal of General Virology 78: 2101-2111.
Zhou, X., Robinson, D.J., Harrison, B.D. (1998) Types of variation in DNA-A among isolates of East
African cassava mosaic virus from Kenya, Malawi and Tanzania. Journal of General Virology 79:2835-
2840.
Zhu, T. (2003) Global analysis of gene expression using gene chip microarrays. Current Opinion in Plant
Biology 6: 418-425.