gene expression profiles in human lymphocytes irradiated in vitro with low doses of gamma rays
TRANSCRIPT

BioOne sees sustainable scholarly publishing as an inherently collaborative enterprise connecting authors, nonprofit publishers, academic institutions, researchlibraries, and research funders in the common goal of maximizing access to critical research.
Gene Expression Profiles in Human Lymphocytes Irradiated In Vitro with LowDoses of Gamma RaysAuthor(s): Ana L. Fachin, Stephano S. Mello, Paula Sandrin-Garcia, Cristina M. Junta, Eduardo A.Donadi, Geraldo A. S. Passos, and Elza T. Sakamoto-HojoSource: Radiation Research, 168(6):650-665. 2007.Published By: Radiation Research SocietyDOI: http://dx.doi.org/10.1667/RR0487.1URL: http://www.bioone.org/doi/full/10.1667/RR0487.1
BioOne (www.bioone.org) is a nonprofit, online aggregation of core research in the biological, ecological, andenvironmental sciences. BioOne provides a sustainable online platform for over 170 journals and books publishedby nonprofit societies, associations, museums, institutions, and presses.
Your use of this PDF, the BioOne Web site, and all posted and associated content indicates your acceptance ofBioOne’s Terms of Use, available at www.bioone.org/page/terms_of_use.
Usage of BioOne content is strictly limited to personal, educational, and non-commercial use. Commercial inquiriesor rights and permissions requests should be directed to the individual publisher as copyright holder.

650
RADIATION RESEARCH 168, 650–665 (2007)0033-7587/08 $15.00� 2007 by Radiation Research Society.All rights of reproduction in any form reserved.
Gene Expression Profiles in Human Lymphocytes Irradiated In Vitro withLow Doses of Gamma Rays
Ana L. Fachin,a,1 Stephano S. Mello,a,1 Paula Sandrin-Garcia,a Cristina M. Junta,a Eduardo A. Donadi,b
Geraldo A. S. Passosa,c and Elza T. Sakamoto-Hojoa,d,2
a Departamento de Genetica e b Departamento de Clınica Medica, Faculdade de Medicina de Ribeirao Preto-USP; c Faculdade de Odontologia deRibeirao Preto-USP; and d Departamento de Biologia – Faculdade de Filosofia Ciencias e Letras de Ribeirao Preto-USP,
Universidade de Sao Paulo, Ribeirao Preto, SP, Brazil
Fachin, A. L., Mello, S. S., Sandrin-Garcia, P., Junta, C. M.,Donadi, E. A., Passos, G. A. S. and Sakamoto-Hojo, E. T.Gene Expression Profiles in Human Lymphocytes IrradiatedIn Vitro with Low Doses of Gamma Rays. Radiat. Res. 168,650–665 (2007).
The molecular mechanisms underlying responses to low ra-diation doses are still unknown, especially in normal lympho-cytes, despite the evidence suggesting specific changes thatmay characterize cellular responses. Our purpose was to an-alyze gene expression profiles by DNA microarrays in humanlymphocytes after in vitro irradiation (10, 25 and 50 cGy) with� rays. A cytogenetic analysis was also carried out for differ-ent radiation doses. G0 lymphocytes were irradiated and in-duced to proliferate for 48 h; then RNA samples were col-lected for gene expression analysis. ANOVA was applied todata obtained in four experiments with four healthy donors,followed by SAM analysis and hierarchical clustering. For 10,25 and 50 cGy, the numbers of significantly (FDR � 0.05)modulated genes were 86, 130 and 142, respectively, and 25,35 and 33 genes were exclusively modulated for each dose,respectively. We found CYP4X1, MAPK10 and ATF6 (10 cGy),DUSP16 and RAD51L1 (25 cGy), and RAD50, REV3L andDCLRE1A (50 cGy). A set of 34 significant genes was commonfor all doses; while SERPINB2 and C14orf104 were up-regu-lated, CREB3L2, DDX49, STK25 and XAB2 were down-reg-ulated. Chromosome damage was significantly induced fordoses �10 cGy (total aberrations) and �50 cGy (dicentrics/rings). Therefore, low to moderate radiation doses inducedqualitative and/or quantitative differences and similarities intranscript profiles, reflecting the type and extent of DNA le-sions. The main biological processes associated with modulat-ed genes were metabolism, stress response/DNA repair, cellgrowth/differentiation, and transcription regulation. The re-sults indicate a potential risk to humans regarding the devel-opment of genetic instability and acquired diseases. � 2007 by
Radiation Research Society
INTRODUCTION
In recent decades, many studies have demonstrated theclastogenic potential of ionizing radiation as well as its ca-
1 Equal contribution.2 Address for correspondence: Departamento Biologia, Faculdade de
Filosofia, Ciencias e Letras de Ribeirao Preto – USP, Av. Bandeirantes3900, 14040-901, Ribeirao Preto, SP, Brasil; e-mail: [email protected].
pacity to cause genomic instability in mammalian cells, butthe effects of low radiation doses are very difficult to detectby conventional methods. New investigative approacheswith more sensitivity and/or accuracy to evaluate the cel-lular stress response to low radiation doses are needed, es-pecially for human exposure.
Cytogenetic studies have demonstrated increased fre-quencies of chromosomal aberrations even for low levelsof chronic radiation exposure (1–5). Since chromosomalalterations are associated with cancer development, it is im-portant to determine the molecular alterations caused bylow levels of radiation exposure, either in vivo (exposedindividuals) or in vitro (cell cultures). In a previous study,Sakamoto-Hojo et al. (6) reported alterations in profiles ofgene expression, as evaluated by cDNA microarray, for hu-man lymphocytes from hospital workers chronically ex-posed to low radiation doses.
The responses of cells to radiation involve a complexnetwork of transduction signals and the interaction of manyprocesses. However, only in the last decade has the conceptof a coordinated DNA damage response integrating the pro-cesses underlying damage recognition, cell cycle check-points and DNA repair begun to be elucidated (7–9).
Studies of the profiles of gene expression using microar-ray analysis have demonstrated an up-regulation of genescontrolling the cell cycle, DNA repair processes, apoptosisand metabolism and genes playing roles in the maintenanceof the integrity of the genome after radiation-induced DNAdamage in mammalian cells (6, 10, 11). Different resultshave been obtained for sets of modulated genes, and thesedifferences have been attributed to the different experimen-tal conditions and types of cells. A few genes have consis-tently been found to be up-regulated in irradiated cells, suchas GADD45, CDKN1A and genes associated with the nu-cleotide excision repair pathway (12).
In this study, we examined the gene expression profilesof lymphocytes irradiated (before PHA stimulation) withlow to moderate doses (10, 25 and 50 cGy) of gamma raysand analyzed 48 h after irradiation. Although we conductedour experiments on cells in vitro, G0 lymphocytes can alsobe stimulated in vivo, reinforcing the importance of inves-

651GENE EXPRESSION IN IRRADIATED LYMPHOCYTES
tigating radiation effects in proliferating lymphocytes andthe persistence of these effects at longer times, especiallyin cells undergoing one or two cell divisions. Furthermore,evaluation at later times is an important issue, mainly inlow-dose experiments, since the preliminary (nonlethal)damage caused by ionizing radiation can lead to relevantsecondary aberrations or genomic instability. The presentresults indicate that radiation-responsive genes (showingup- or down-regulation) play a role in multiple biologicalprocesses and that even low radiation doses may inducetranscriptional changes in human lymphocytes. The differ-entially expressed genes can be investigated further to de-termine their potential for use as biomarkers of stress re-sponse mechanisms elicited by low doses of gamma rays.
MATERIALS AND METHODS
Blood Samples, Lymphocyte Culture and Irradiation
For cytogenetic analysis, blood samples were taken from four healthynonsmoking individuals aged 20–30 years old, and lymphocytes werecultured in RPMI 1640 medium supplemented with 20% fetal calf serum(Gibco), 0.2% phytohemagglutinin (Gibco) and penicillin/streptomycin(Sigma). The samples were irradiated with 2, 5, 10 and 50 cGy and 1Gy at a dose rate of 4.7 cGy/min (for doses �10 cGy) or 91 cGy/min(for 50 cGy and 1 Gy) using a 60Co source (Gammatron S-80 device,1.25 MeV, Siemens).
For gene expression experiments, peripheral blood samples were takenfrom four healthy nonsmoking individuals (aged 23–30 years old) withno history of previous exposure to radiation or chemicals. A total of fourindependent experiments were carried out by considering each donor asa repetition. Lymphocytes were separated by gradient density centrifu-gation with Ficoll-Hypaque (Sigma, St. Louis, MO). Resting G0 lympho-cytes from each donor were seeded in RPMI 1640 medium containing20% fetal bovine serum, and cell cultures were immediately irradiatedwith � rays (sham-irradiated, 10, 25 and 50 cGy) from a 60Co source ata dose rate of 1.18 Gy/min. Cell cultures were incubated at 37�C for 48h in the presence of 2% of phytohemagglutinin (PHA) (Gibco BRL).RNA extraction was performed 48 h after irradiation.
Informed consent was obtained from all individuals after approval ofthe study by the local Ethics Committee (University Hospital, Faculty ofMedicine, Ribeirao Preto, Sao Paulo University, SP, Brazil).
Cytogenetic Analysis
Lymphocyte cultures were incubated for 48 h at 37�C and treated withColcemid during the last 2 h. Chromosomal spreads were prepared bythe conventional method, i.e., hypotonic treatment for 5 min, followedby fixation with methanol/acetic acid 3:1, air-drying and Giemsa stainingfor conventional analysis. For doses �10 cGy, 300 to 500 cells wereanalyzed for the scoring of chromosomal aberrations, while for 50 cGyand 1 Gy, 100 to 300 cells were scored. Two different dose–responsecurves were constructed, one for all types of aberrations and one fordicentrics plus rings.
RNA Extraction and cDNA Microarray Analysis
Trizol reagent (Invitrogen, Carlsbad, CA) was used for total RNA ex-traction from irradiated and sham-irradiated lymphocyte cultures accord-ing to the manufacturer’s instructions. The integrity of the RNA sampleswas evaluated by denaturing agarose gel electrophoresis under standardconditions.
Analyses of the gene expression profiles of the irradiated lymphocytecultures and controls were carried out using glass slide microarrays con-
taining 4,500 sequences (spotted in duplicate) from the human IMAGEcDNA library Consortium (http://image.llnl.gov/image/), which was kind-ly provided by Dr. Catherine Nguyen (INSERM-CNRS, Marseille,France), and prepared according to the protocol described by Hegde etal. (13).
Microarrays were prepared using type 7 silanized glass slides (Amer-sham Biosciences, England) and a Generation III Array Spotter (Amer-sham-Molecular Dynamics) according to the manufacturer’s instructions.The cDNA complex probes were prepared from samples extracted fromirradiated and sham-irradiated lymphocytes, and reverse transcription wascarried out with 10 �g of total RNA/sample in the presence Cy3 or Cy5fluorochromes (CyScribe Post Labelling Kit, Amersham Biosciences) andoligo dT12–18 as primer. A pooled reference design was chosen so thatevery array was hybridized with the same reference sample (preparedfrom three different cell lines: U343 MG-a glioma, HeLa and Jurkat cells)labeled with Cy3, while the experimental samples (control or treated)were labeled with Cy5. The reference sample was then used in the nor-malization procedure.
Hybridizations were carried out for 15 h using an automated system(Automatic Slide Processor, Amersham Biosciences). Hybridization sig-nals were captured using a Generation III laser scanner (Amersham Bio-sciences).
Gene Expression Analysis
Image quantification was performed using the Spot software (http://spot.cmis.csiro.au/spot/, CSIRO, Australia). Filtering, normalization anddata analysis were performed by using the R statistical environment (14)according to the instructions with the KTH package (http://www.biotech.kth.se/molbio/microarray/userguide/usersguide.htm). The back-ground for each feature was subtracted from the foreground value. Fur-thermore, spots were evaluated by their circularity and median comparedto mean deviation, and those with irregular circularity or large differencesbetween mean and median values were considered as unreliable. Afterthose procedures, we applied the print-tip Lowess normalization methodand rescaling of the M values by the MAD value (Median AbsoluteDeviation) (15). The normalized data were exported to MEV format andanalyzed using MEV software (http://www.tm4.org/mev.html), which wasused to perform statistical analyses (ANOVA and SAM) and hierarchicalclustering. For clustering procedures, normalized genes were median-cen-tered. The information regarding gene location and biological functionswas obtained at S.O.U.R.C.E. (http://smd-www.stanford.edu/cgi-bin/source/sourceSearch) and NCBI (http://www.ncbi.nlm.nih.gov/). Modu-lated genes were also divided into functional groups using DAVID-NIH(http://david.abcc.ncifcrf.gov/) by comparing the modulated genes to thewhole human genome (16).
Quantitative Real-Time PCR (qPCR)
Quantitative real-time PCR was used to confirm the expression profilesfor two genes, XAB2 and RAD51L1. RNA samples used in cDNA mi-croarrays were treated with the Deoxyribonuclease I Amplification Gradekit (Invitrogen) to remove traces of DNA according to the manufacturer’sinstructions. The reverse transcription step was carried out with the Su-perscript III Reverse Transcriptase kit (Invitrogen) according to the man-ufacturer’s instructions using the DNase-treated RNA samples as a tem-plate. The integrity of the cDNA samples was tested by the amplificationof the endogenous actin-� (ACTB) gene and visualization by agarose gelelectrophoresis. qPCR was carried out using SYBR Green master mix(Applied Biosystems) and the ��Ct method (17). Each reaction had atotal volume of 25 �l, containing 9 �l of water, 12.5 �l of SYBR Green,1.25 �l (10 �M stock) of each forward and reverse primers (manufac-tured at Integrated DNA Technologies), and 1 �l of cDNA obtained fromthe RT-PCR reactions for each sample. The reactions were mounted in96-well polypropylene plates and covered with microplate adhesive. Thereactions were carried out in an Applied Biosystems 7500 Real-TimePCR System using the primer sets XAB2: forward 5�-AAT ATG CCA

652 FACHIN ET AL.
TABLE 1Significantly Expressed Genes Representing the Main Biological Processes (or Gene Function Categories)
Gene symbolUniGene
IDChromosome
locationRelative
expression Q value Function
10 cGyCYP4X1 Hs.439760 1p33 1.878 0.000 ER fatty acid metabolismATF6 Hs.492740 1q22-q23 1.458 0.034 ER stress-related/transcription factorFLJ16517/LIN28B Hs.23616 6q21 1.372 0.034 Cell cycle controlPPM1E Hs.245044 17q22 �1.104 0.034 Ser/Thr phosphatase/inhibit stress fiber break-
downGPR26 Hs.12751 10q26.2 �1.164 0.034 UnknownMAPK10 Hs.125503 4q22.1-q23 �1.232 0.034 MAPK family/apoptosis controlBAT3 Hs.440900 6p21.3 �1.508 0.034 Apoptosis controlCDCA5 Hs.434886 11q12.1 �1.558 0.017 Cell cycle progression/sister chromatid cohe-
sionCNKSR2 Hs.632794 Xp22.12 �1.763 0.032 Regulator of Ras signalingNFIA Hs.191911 1p31.3-p31.2 �1.766 0.020 Transcription factorEHMT1 Hs.495511 9q34.3 �2.045 0.034 Histone methyltransferase/cell cycle control
25 cGyRAD51L1 Hs.172587 14q23-q24.2 1.935 0.021 DNA repairMAP4K2 Hs.534341 11q13 1.341 0.036 Stress response/JNK pathway/Ser/Thr kinaseDUSP16 Hs.656821 12 1.245 0.036 Inactivation of MAPKADIPOR1 Hs.5298 1p36.13-q41 �1.334 0.034 Fatty acid oxidation
50 cGyRAD50 Hs.594427 5 1.258 0.013 DNA double-strand break repairDCLRE1C (Artemis) Hs.656065 10p13 �1.418 0.032 DNA crosslink repair protein 1CREV3L (Pol. Zeta) Hs.232021 6q21 �1.433 0.031 DNA repair/replicationBAG4 Hs.194726 8p12 �1.297 0.031 Apoptosis/anti-apoptosis
25 and 50 cGyPTPN1 Hs.417549 20q13.1-q13.2 1.686 (25) 0.023 (25) Protein amino acid dephosphorylation/signal
transduction2.289 (50) 0.000 (50)
BHC80 Hs.502458 11p11.2 1.684 (25) 0.019 (25) Regulation of transcription, DNA-dependent2.054 (50) 0.000 (50)
EPB41L3 Hs.213394 18p11.32 1.648 (25) 0.019 (25) Cortical actin cytoskeleton organization andbiogenesis
1.827 (50) 0.000 (50)SLC5A6 Hs.435735 2p23 1.545 (25) 0.019 (25) Sodium ion transport
1.522 (50) 0.020 (50)CREBBP Hs.459759 16p13.3 1.507 (25) 0.019 (25) Regulation of transcription, DNA-dependent/
signal transduction2.327 (50) 0.020 (50)
DNASE2 Hs.118243 19p13.2 1.479 (25) 0.018 (25) Apoptosis1.611 (50) 0.010 (50)
KIF13A Hs.189915 6p23 1.453 (25) 0.019 (25) Protein transport1.617 (50) 0.013 (50)
C2orf30 Hs.438336 2p16.2 �1.420 (25) 0.022 (25) Degradation of misfolded glycoproteins�1.556 (50) 0.016 (50)
MARK2 Hs.567261 11q12-q13 �1.349 (25) 0.032 (25) Protein kinase cascade/protein amino acidphosphorylation/cell differentiation
�1.418 (50) 0.031 (50)USP53 Hs.431081 4q26 �1.579 (25) 0.019 (25) Ubiquitin cycle
�1.388 (50) 0.031 (50)CDK2AP1 Hs.433201 12q24.31 �2.191 (25) 0.000 (25) S phase of mitotic cell cycle/negative regula-
tion of cell cycle/protein amino acid phos-phorylation/DNA-dependent DNA replica-tion
�1.817 (50) 0.031 (50)SNRPN Hs.564847 15q11.2 �2.915 (25) 0.031 (25) RNA splicing/spliceosome
�2.900 (50) 0.031 (50)

653GENE EXPRESSION IN IRRADIATED LYMPHOCYTES
TABLE 1Continued
Gene symbolUniGene
IDChromosome
locationRelative
expression Q value Function
10, 25 and 50 cGySERPINB2 Hs.594481 18q21.3 4.508 (10) 0.045 (10) Anti-apoptosis
2.888 (25) 0.019 (25)2.204 (50) 0.013 (50)
C14orf104 Hs.231761 14q22.1 2.219 (10) 0.028 (10) Unknown1.760 (25) 0.020 (25)1.772 (50) 0.011 (50)
CREB3L2 Hs.490273 7q34 �1.486 (10) 0.017 (10) Transcription regulation, DNA-dependent�1.517 (25) 0.000 (25)�1.616 (50) 0.000 (50)
DDX49 Hs.143187 19p12 �1.472 (10) 0.020 (10) ATP-dependent helicase activity�1.427 (25) 0.000 (25)�1.272 (50) 0.039 (50)
STK25 Hs.516807 2q37.3 �1.793 (10) 0.032 (10) Response to oxidative stress�1.410 (25) 0.043 (25)�1.403 (50) 0.041 (50)
XAB2 Hs.9822 19p13.2 �1.442 (10) 0.034 (10) DNA repair�1.496 (25) 0.017 (25)�1.362 (50) 0.032 (50)
Note. These genes were selected from the total number of modulated genes obtained by statistical analysis by SAM (FDR 0.05).
AGA CCT TGT ACC-3�, reverse 5�-GTT GAA CAT GTC ATA CTGCTG-3�; RAD51L1: forward 5�-GCT GAT CCT CCA GTA CCT-3�, re-verse 5�-TTT CCA TAG GCT TGA AGA ACC-3�; ACTB: forward 5�-TTG TTA CAG GAA GTC CCT TGC C-3�, reverse 5�-ATG CTA TCACCT CCC CTG TGT G-3�, with an annealing temperature near 60�C andan amplicon of 100–150 bp. The PCR conditions were preheating at 50�Cfor 2 min, 10 min at 95�C (denaturation step), followed by 40 cycles at95�C for 15 s and at 60�C for 60 s. The dissociation curves were set upas follows: 95�C for 15 s, 60�C for 20 s and 95�C for 15 s.
RESULTS
Cytogenetic analysis of lymphocyte cultures irradiatedwith doses between 10 cGy and 1 Gy allowed us to con-struct two different dose–response curves (Fig. 1) for alltypes of chromosomal aberrations and for dicentrics plusrings. Significant differences were found among differentgroups (P 0.001) by applying one-way ANOVA. Forindividual doses, significant values were obtained for doses�10 cGy with regard to total chromosomal aberrations, butfor dicentrics plus rings, significant values were observedfor doses �50 cGy, as analyzed by the t test. The dose–response curves fit a linear model, as expected for low-doseexposure in PHA-stimulated lymphocytes cultured for 48h, which is different from higher doses, which produce alinear-quadratic dose–response curve (18, 19).
Gene expression profiles were studied in lymphocytesirradiated with 10, 25 and 50 cGy. Statistical analysis wasfirst performed by ANOVA, and 289 genes were identifiedthat were significantly (uncorrected P � 0.10) modulatedin four experimental groups: cells irradiated with three dos-es (10, 25 and 50 cGy) and sham-irradiated controls. Thenthe SAM method was applied for those genes identified byANOVA, and pairwise comparisons were performed. Es-
tablishing an FDR threshold of 5% for doses of 10, 25 and50 cGy, the numbers of genes whose expressions was sig-nificantly (q 0.05) affected were 86 (19 up-regulated and67 down-regulated), 130 (77 up-regulated and 53 down-regulated), and 142 (62 up-regulated and 80 down-regulat-ed), respectively. Several genes representing different bio-logical functions that were found to be modulated for twoor three doses were chosen for further examination (Table1). The complete list of differentially expressed genes isavailable online (see Supplementary Information). For allstatistically significant genes, the magnitude of modulationranged from 1.14 to 4.51 and from �1.10 to �6.33 for up-and down-regulated genes, respectively.
To analyze the variations in the magnitudes of the chang-es among donors, the relative expression levels and stan-dard errors were plotted for each donor and each dose (Fig.2) for genes listed in Table 1, which were chosen based onthe statistical analysis, fold change and biological functions.Small differences in relative expression were observedamong the donors, except for 50 cGy. For this dose, oneindividual (donor A) had different relative expression, foreither induction or repression, compared with donors B, Cand D.
A Venn diagram was constructed to provide a quantita-tive representation of differences and similarities of ex-pression profiles obtained for different doses. A total of 25,35 and 33 exclusively modulated genes were found for dos-es of 10, 25 and 50 cGy, respectively (Fig. 3). Radiationresponses were more similar for the two highest doses (54common genes) than for 10 and 50 cGy (20 genes) or for10 and 25 cGy (7 genes). The list of genes associated withthe Venn diagram is presented in Table 2.

654 FACHIN ET AL.
FIG. 1. Dose–response relationship for the induction of chromosomalaberrations in peripheral lymphocytes cultured for 48 h. For total chro-mosomal aberrations and dicentrics plus rings, significant differenceswere found among the different groups (P 0.001) using one-way AN-OVA. Significant differences were observed for doses �10 cGy for totalchromosomal aberrations. For dicentrics plus rings, significant differenceswere observed for doses �50 cGy, as analyzed by a t test.
Within the set of exclusive genes for the dose of 10 cGy,we found CYP4X1, ATF6 transcription factor, GPR26 andMAPK10. For low to moderate doses, 25 and 50 cGy, 35and 33 genes were found to be significantly modulated (q� 0.05) and were exclusive for each dose, respectively.Among the exclusive genes, we found DUSP16 andRAD51L1 (25 cGy), RAD50, REV3L and DCLRE1C (50cGy). A high number of common genes (54) was obtainedfor doses of 25 and 50 cGy; some representative genesincluded CDK2AP1 (cell cycle/cell proliferation controller),DNASE2 (apoptosis regulator) and USP53, a gene thatplays a role in proteasome/protein metabolism. Several oth-er genes, such as CREBBP, DNASE2 and SLC5A6 (inducedgenes) and MARK2 (down-regulated gene), were also foundto be modulated significantly after irradiation with 25 and50 cGy.
For 10, 25 and 50 cGy, 34 common significantly radia-tion-responsive genes were found in irradiated lympho-cytes. Among them, SERPINB2 and C14orf104 were up-regulated, while CREB3L2, DDX49, STK25 and XAB2 weredown-regulated.
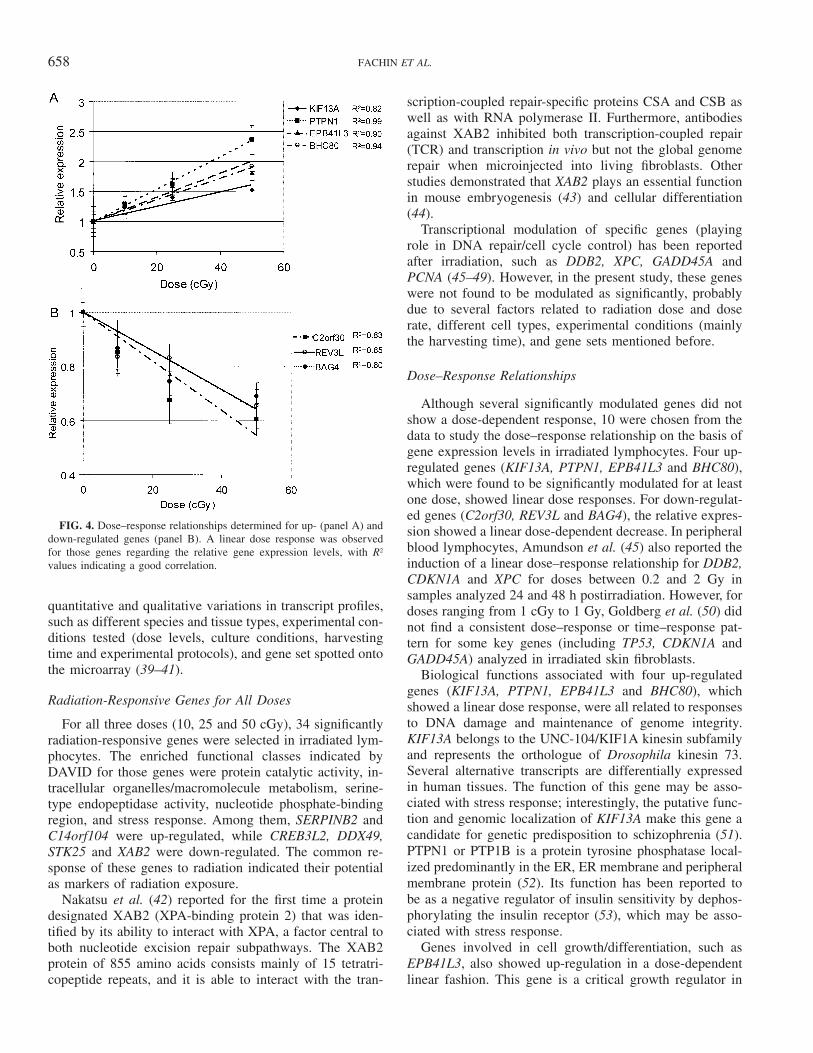
A linear regression analysis was performed to study thedose–response relationship of 10 modulated genes in irra-diated lymphocytes, although several significantly modu-lated genes did not show a dose-dependent response. Thesegenes were chosen from the data set: four up-regulatedgenes (KIF13A, PTPN1, EPB41L3 and BHC80), whichwere found to be significant for at least one dose, and threedown-regulated genes (C2orf30, REV3L and BAG4). Inboth cases and for most genes, we observed a linear doseresponse for the relative gene expression (Fig. 4A and B).
The biological functions attributed to the significantlymodulated gene set were analyzed by DAVID-NIH (16),the most relevant categories (at different levels) were thoserelated to protein metabolism, hydrolase/helicase activity,
MAP kinase cascade, transcription regulation, apoptosiscontrol and DNA repair/replication. Functional groupswhose annotated terms were significantly (P � 0.05) dif-ferent were selected for further comparisons among the ex-perimental groups (10, 25 and 50 cGy); for those functionalgroups, the six most significant terms were displayed (Table3).
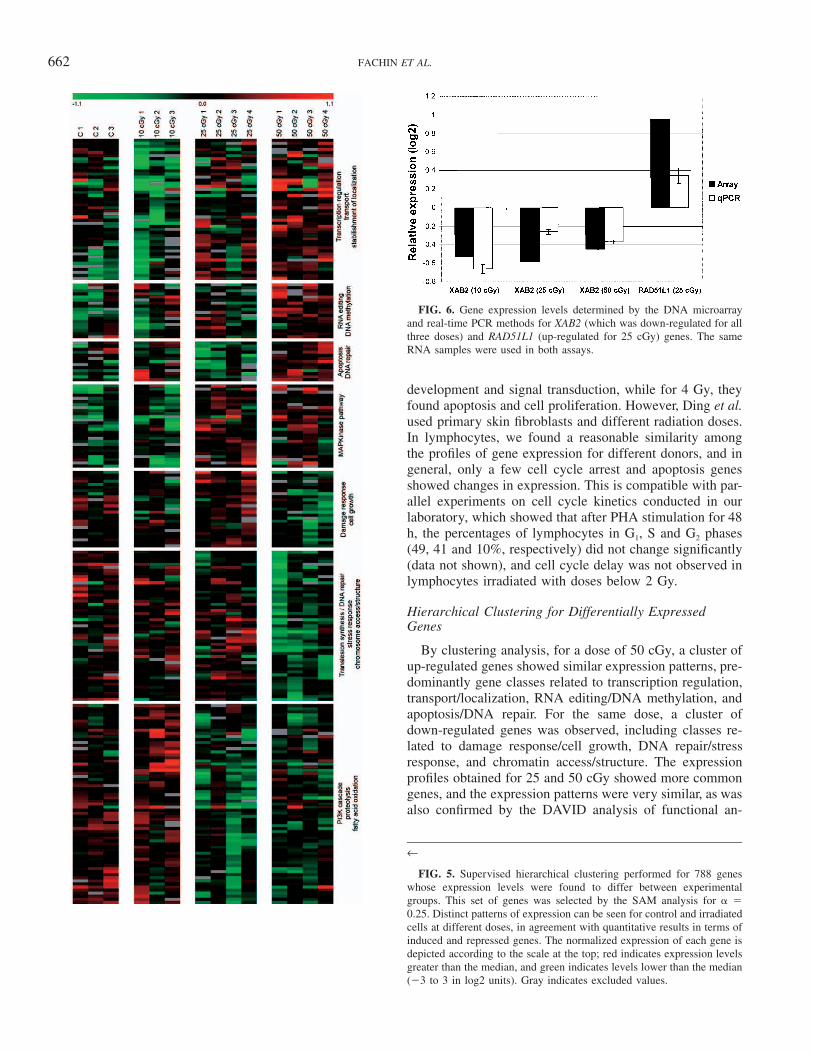
A supervised hierarchical clustering was performed for788 differentially expressed genes ( � 0.25) that werefound to differentiate the experimental groups (control, 10,25 and 50 cGy). Distinct patterns of expression profiles canbe seen for control and irradiated cells at different doses,which agrees with quantitative results in terms of inducedand repressed genes. By comparing the transcription pro-files among the radiation doses, both qualitative and quan-titative differences can be observed. Several clusters arecapable of identifying responsive genes and the respectivebiological processes within the range of doses from 10 to50 cGy (Fig. 5). There are groups of responsive genes forthe low dose of 10 cGy and other groups responsive tomoderate doses (25 and/or 50 cGy). The same clusters withgene names can be seen in the Supplementary Information.The expression patterns observed for 25 and 50 cGy weresimilar, since 54 significant genes were common betweenboth groups. Moreover, a cluster with several genes withsimilar expression profiles was observed for all three doses.
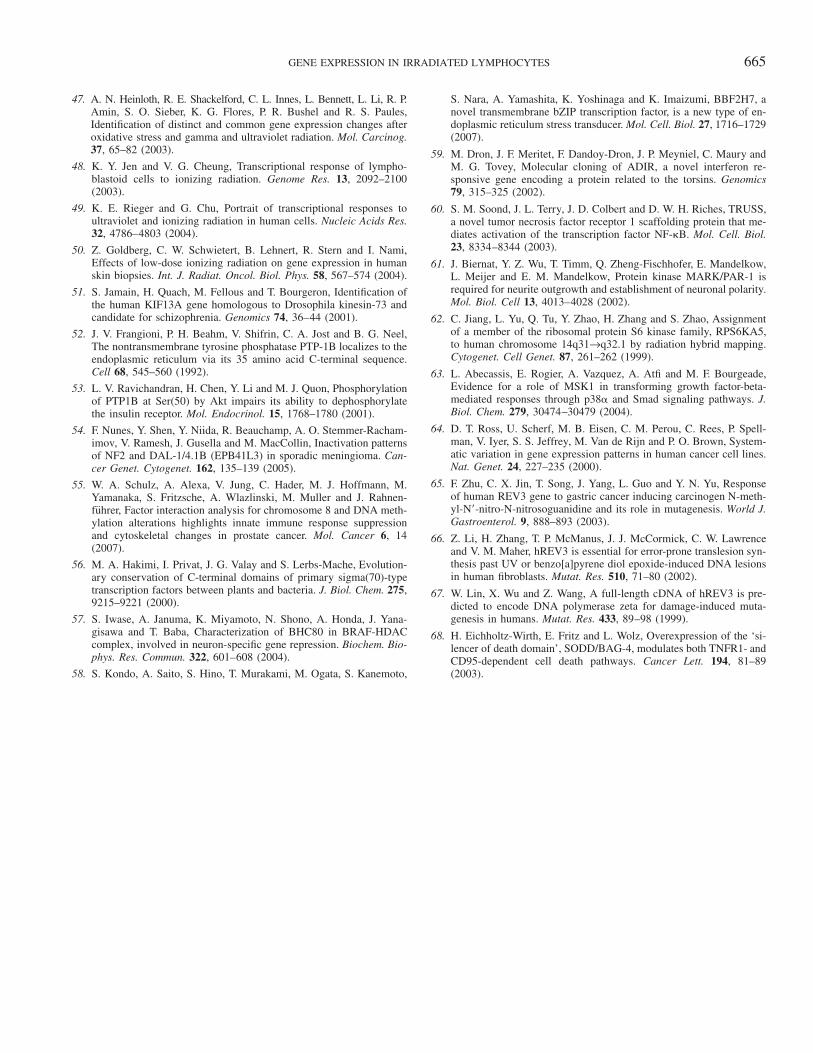
Using real-time PCR, we studied the expression of twogenes, XAB2 (relative expression: �1.44, �1.50 and�1.36; q values: 0.0345, 0.0175 and 0.0322, for 10, 25 and50 cGy, respectively), and RAD51L1 (relative expression:1.93 and q value: 0.021 for 25 cGy), using the same RNAsamples. The results showed a down-regulation of XAB2and an up-regulation of RAD51L1 relative to control levels,confirming the results obtained by the microarray method(Fig. 6).
DISCUSSION
Characterization of quantitative and qualitative differenc-es in the gene expression profiles of human cells is impor-tant. In the present study, we demonstrated that low to mod-erate (10–50 cGy) radiation doses produced significantchanges in the transcription profiles of several genes (orgene classes) in human lymphocytes analyzed 48 h afterirradiation.
To determine whether there was a relationship betweenthe induction of chromosome damage and alterations ingene expression profiles, we first carried out a cytogeneticanalysis of lymphocyte cultures irradiated with low to mod-erate radiation doses (2 cGy to 1 Gy). Significant changesin the yield of chromosomal aberrations were observed fordoses �10 cGy, while the frequencies of dicentrics plusrings were significantly increased for doses �50 cGy. Wemay assume that these results for chromosome damage canbe correlated with gene expression data for doses between10 and 50 cGy, since the difference in the indication of

655GENE EXPRESSION IN IRRADIATED LYMPHOCYTES
FIG. 2. Variations in gene expression in irradiated lymphocytes. The relative expression and standard errors for selected groups of genes wereplotted for each donor for each dose. The dashed line represents no change.
exclusive and common differentially expressed genes be-tween doses may be a consequence of qualitative and quan-titative differences in the mechanisms of induction and pro-cessing of DNA lesions, which are dependent on the radi-ation dose. For 10, 25 and 50 cGy, the numbers of signif-icantly (FDR 0.05) modulated genes were 86, 130 and142, respectively.
The variations in the relative expression among donorsdemonstrated small differences, except for 50 cGy, wheredonor A had a different relative expression, for either in-duction or repression, compared with donors B, C and D.Similarly, Coleman et al. (20) also demonstrated variabilityin the adaptive response to ionizing radiation among cellsof three lymphoblastoid cell lines derived from three dif-ferent individuals. This variability probably reflects theunique genetic background of each individual, which is rel-evant in studies of radiation responses and radiosensitivityin humans, especially in situations of low-dose exposure.
Low-Dose (10 cGy) Responsive Genes
Twenty-five genes were found modulated exclusively af-ter exposure to 10 cGy, as indicated by SAM. According
to the results of the DAVID-NIH analysis (16), genes mod-ulated at 10 cGy are involved in metabolism, stress re-sponse and cellular physiological processes. A more de-tailed analysis reveals that those genes are involved in cellcycle control, histone modification and unfolded protein re-sponse. All these processes can be associated with cellularresponses to DNA damage. Among this set of 25 genes,four (CYP4X1, ATF6, GPR26 and MAPK10) were chosenas representative of biological functions associated withstress response.
CYP4X1, an up-regulated gene at 10 cGy, belongs to anew subfamily of cytochrome P450 genes (CYPs), desig-nated as CYP4X1. It catalyzes the omega and omega 1 hy-droxylation of various fatty acids such as laurate, myristateand palmitate (21). Similar to other CYP family members,CYP4X1 may be involved in the activation and/or detoxi-fication of potential carcinogens and also in stress respons-es. For example, CYP1B1 was reported to be induced afterexposure to high doses (3.5 Gy) in fibroblasts (22). ATF6,which was induced in irradiated lymphocytes, is an endo-plasmic reticulum (ER) transmembrane glycoprotein and akey transcriptional activator of unfolded protein responses,

656 FACHIN ET AL.
FIG. 3. Venn diagram representing quantitative results obtained fordifferent doses in terms of numbers of modulated genes exclusively foreach dose or common genes between two or three doses. The data onexpression levels were analyzed by the SAM method (q � 0.05).
which allows mammalian cells to maintain cellular homeo-stasis under a variety of environmental and physiologicalstress conditions. ATF6 is a direct target of the proteasome-ubiquitin (Ub) pathway (23, 24). Under stress stimulus, un-folded and misfolded proteins can accumulate in the ER(25, 26), leading to ATF6 cleavage and release of its cy-toplasmic domain, which enters the nucleus, leading totranscription activation and other cellular responses (27,28). Therefore, the modulation of ATF6 may indicate thatthis gene is a potential marker of the stress response in-duced by 10 cGy radiation.
GPR26 was down-regulated at 10 cGy. Its gene productis one of the several different receptors for 5-hydroxytryp-tamine (serotonin), a biogenic hormone that functions as aneurotransmitter, and whose activity is mediated by G pro-teins. It is probably involved in anxiety and depression (29),but no functions related to stress response have been re-ported. Another down-regulated gene, MAPK10, encodes amember of the MAP kinase family of proteins, whose ex-pression is specific to a subset of neurons in the nervoussystem. This protein (JNK3) is a neuronal-specific form ofc-Jun N-terminal kinases (JNKs). Through its phosphory-lation and nuclear localization, this kinase plays regulatoryroles in the signaling pathways during neuronal apoptosisby phosphorylating a number of transcription factors, in-cluding ATF2. JNK3 is one of the downstream effectors of
the GTPase-regulated MAP kinase cascade, several mem-bers of which have been implicated in cognitive function(30). Its role may be related to stress response, similarly toother MAPK family members. MAPK10 was also previ-ously found to be up-regulated in lymphocytes from radi-ation workers (6).
Genes Responsive to Moderate Doses (25 and 50 cGy)
For low to moderate doses, 25 and 50 cGy, 35 and 33genes, respectively, were found significantly modulated (P� 0.05) and were exclusive for each dose. Among thosegenes were DUSP16 and RAD51L1 (exclusive for 25 cGy)as well as RAD50, REV3L and DCLRE1C (exclusive for 50cGy). RAD51L1 (RAD51B) gene was activated in cells ir-radiated with 25 cGy; this result was confirmed by real-time qPCR. It has been suggested that Rad51B andRAD51C function through interactions with the humanRad51 recombinase and play a crucial role in the homol-ogous recombinational (HR) repair pathway (31). TheRad51B protein may have a specific function in Hollidayjunction processing in the HR repair pathway in humans(32). In contrast, DCLRE1C was repressed by 50 cGy inirradiated lymphocytes. This gene participates in the NHEJ(non-homologous end joining) DSB repair pathway, in ad-dition to the KU subunits DNA-PKcs and XRCC4 (33–35).Other NHEJ genes were not found among the significantlyexpressed genes in the present study, suggesting that theNHEJ pathway probably occurs at the earliest times afterirradiation, as observed by others (36, 37). The repressionof DNA repair genes after radiation exposure has also beenreported by others (38), but whether the expression of thesegenes is under transcriptional or translational regulation isstill a matter of discussion.
For 25 and 50 cGy, 54 common modulated genes werefound in irradiated lymphocytes. The analysis provided byDAVID indicated an increased modulation of genes relatedto DNA metabolism/repair, negative regulation of physiolog-ical processes/apoptosis, hydrolase activity and ATPase/helicase activity. The set of selected genes includedCDK2AP1 (cell cycle/cell proliferation controller), DNASE2(apoptosis regulator) and USP53, a gene that plays a role inproteasome/protein metabolism. Several other genes, includ-ing CREBBP, MARK2 and SLC5A6, were also found to besignificantly induced or repressed after irradiation with 25and 50 cGy.
Some members of the same gene families were reportedpreviously by others as radiation-responsive. For example,Ding et al. (39) also identified the DUSP, SLC and SERPINgene families in fibroblasts, but the changes in gene ex-pression were greater at 2 cGy than at 4 Gy, suggestingthat some cellular pathways may be more sensitive to low-dose radiation. Experiments carried out in human fibro-blasts exposed to 50 cGy showed that members of the zincfinger protein (ZNF) family, REV3-like polymerase zetacatalytic subunit (REV3L) and DEAD (Asp-Glu-Ala-Asp)

657GENE EXPRESSION IN IRRADIATED LYMPHOCYTES
TABLE 2List of Genes Associated with the Venn Diagram Showing Significantly Modulated
Genes for Each Dose and Common Genes Found for Two or Three Radiation Doses
Dose Significantly modulated genes
10 cGy ARL10C CYP4X1 KIAA1076 IMAGE:23195ATF6 EHMT1 MAPK10 IMAGE:38803BAT3 FIJI6517 NFIA IMAGE:31023C9orf150 FTO PPM1E IMAGE:143702CDCA5 GPR26 RAI16 IMAGE:137301CNKSR2 KIAA0052 ZNF44 IMAGE:131799
IMAGE:14185425 cGy ADIPOR1 DUSP16 PFKFB2 ZNF229
BAMBI FLJ25477 RAD51L1 ZNF335C20orf11 KIAA1128 RBBP6 IMAGE:40963C20orf44 MAP4K2 RUNX1T1 IMAGE:38115C3orf4 MDS009 SCN2B IMAGE:35127COH1 MGC20235 SELT IMAGE:35311CXorf23 MTMR4 TEX27 IMAGE:21581DBT NET1 VEGF IMAGE:40038DGKA PCDHA6 YPEL5
50 cGy ALS2CR3 CHD2 GART RWDD1AP1GBP1 CNAP1 HYPB SEMA3AAPBA2 CNIH2 KCNK5 IMAGE:23686BAG4 DCLRE1C KIAA1510 IMAGE:31486C14orf106 DKFZP564B1023 KIT IMAGE:24587C1orf2 FLJ14503 NCBP2 IMAGE:131762CAP350 FLJ20345 RAD50 IMAGE:132466CCNH FPGT REV3L IMAGE:31859
IMAGE:2290810 and 25 cGy FLJ38991 SMAD4 TMPIT IMAGE:22099
HIST1H2BD PHF1 UNC5D10 and 50 cGy ADAMTSL2 DKFZP564D172 LOC389541 SPG20
AMMECR1 EFNB1 MRPL19 STK39ARHGEF7 EIF2B5 RASSF2 TRIM9BICD1 FLJ30707 SDF2 IMAGE:134969COL2A1 GCA SHANK2 IMAGE:134742
25 and 50 cGy ATP6AP2 EPB41L3 NRCAM IMAGE:31193BDH FLJ12986 NUDT3 IMAGE:41385BHC80 FLJ20397 PDE4C IMAGE:40720C14orf125 FTSJ2 PERLD1 IMAGE:139660C14orf133 GALNAC4S-6ST PIK3R1 IMAGE:39250C2orf30 GNPDA2 PME-1 IMAGE:39152CDK2AP1 HILS1 PSMB1 IMAGE:134394CMAS KIF13A PTPN1 IMAGE:139479CMIP LOC157860 SH2D3C IMAGE:141408COL6A2 LOC284615 SLC5A6 IMAGE:32620CREBBP MARK2 SNRPN IMAGE:143896DKFZP566D1346 MBD5 SPCS2 IMAGE:41137DNASE2 MEF2B TBXAS1DRAP1 MGC5508 USP53
10, 25 and 50 cGy BZRP MGC4796 SH2D4A IMAGE:23585C14orf104 OAZIN STK25 IMAGE:39528CREB3L2 PCSK5 TBCD IMAGE:34096CRY1 POGK TOR3A IMAGE:26737DDX49 PRPSAP1 TRPC4AP IMAGE:38328EPS8 PRSS15 TUSC4 IMAGE:136337LOC126520 RPS6KA5 XAB2 IMAGE:136991MAP2K1 SDK1 ZSCAN5 IMAGE:138228MGC35555 SERPINB2
box polypeptide (DDX) were also modulated (40), as in thepresent study. These results indicate several common genesor gene families that are responsive to ionizing radiation indifferent cell types, although the direction of transcriptional
modulation is not always coincident. In general, a consid-erable variability of transcriptional responses to ionizingradiation has been observed by different authors, and thereis a consensus regarding the main factors responsible for
658 FACHIN ET AL.
FIG. 4. Dose–response relationships determined for up- (panel A) anddown-regulated genes (panel B). A linear dose response was observedfor those genes regarding the relative gene expression levels, with R2
values indicating a good correlation.
quantitative and qualitative variations in transcript profiles,such as different species and tissue types, experimental con-ditions tested (dose levels, culture conditions, harvestingtime and experimental protocols), and gene set spotted ontothe microarray (39–41).
Radiation-Responsive Genes for All Doses
For all three doses (10, 25 and 50 cGy), 34 significantlyradiation-responsive genes were selected in irradiated lym-phocytes. The enriched functional classes indicated byDAVID for those genes were protein catalytic activity, in-tracellular organelles/macromolecule metabolism, serine-type endopeptidase activity, nucleotide phosphate-bindingregion, and stress response. Among them, SERPINB2 andC14orf104 were up-regulated, while CREB3L2, DDX49,STK25 and XAB2 were down-regulated. The common re-sponse of these genes to radiation indicated their potentialas markers of radiation exposure.
Nakatsu et al. (42) reported for the first time a proteindesignated XAB2 (XPA-binding protein 2) that was iden-tified by its ability to interact with XPA, a factor central toboth nucleotide excision repair subpathways. The XAB2protein of 855 amino acids consists mainly of 15 tetratri-copeptide repeats, and it is able to interact with the tran-
scription-coupled repair-specific proteins CSA and CSB aswell as with RNA polymerase II. Furthermore, antibodiesagainst XAB2 inhibited both transcription-coupled repair(TCR) and transcription in vivo but not the global genomerepair when microinjected into living fibroblasts. Otherstudies demonstrated that XAB2 plays an essential functionin mouse embryogenesis (43) and cellular differentiation(44).
Transcriptional modulation of specific genes (playingrole in DNA repair/cell cycle control) has been reportedafter irradiation, such as DDB2, XPC, GADD45A andPCNA (45–49). However, in the present study, these geneswere not found to be modulated as significantly, probablydue to several factors related to radiation dose and doserate, different cell types, experimental conditions (mainlythe harvesting time), and gene sets mentioned before.
Dose–Response Relationships
Although several significantly modulated genes did notshow a dose-dependent response, 10 were chosen from thedata to study the dose–response relationship on the basis ofgene expression levels in irradiated lymphocytes. Four up-regulated genes (KIF13A, PTPN1, EPB41L3 and BHC80),which were found to be significantly modulated for at leastone dose, showed linear dose responses. For down-regulat-ed genes (C2orf30, REV3L and BAG4), the relative expres-sion showed a linear dose-dependent decrease. In peripheralblood lymphocytes, Amundson et al. (45) also reported theinduction of a linear dose–response relationship for DDB2,CDKN1A and XPC for doses between 0.2 and 2 Gy insamples analyzed 24 and 48 h postirradiation. However, fordoses ranging from 1 cGy to 1 Gy, Goldberg et al. (50) didnot find a consistent dose–response or time–response pat-tern for some key genes (including TP53, CDKN1A andGADD45A) analyzed in irradiated skin fibroblasts.
Biological functions associated with four up-regulatedgenes (KIF13A, PTPN1, EPB41L3 and BHC80), whichshowed a linear dose response, were all related to responsesto DNA damage and maintenance of genome integrity.KIF13A belongs to the UNC-104/KIF1A kinesin subfamilyand represents the orthologue of Drosophila kinesin 73.Several alternative transcripts are differentially expressedin human tissues. The function of this gene may be asso-ciated with stress response; interestingly, the putative func-tion and genomic localization of KIF13A make this gene acandidate for genetic predisposition to schizophrenia (51).PTPN1 or PTP1B is a protein tyrosine phosphatase local-ized predominantly in the ER, ER membrane and peripheralmembrane protein (52). Its function has been reported tobe as a negative regulator of insulin sensitivity by dephos-phorylating the insulin receptor (53), which may be asso-ciated with stress response.
Genes involved in cell growth/differentiation, such asEPB41L3, also showed up-regulation in a dose-dependentlinear fashion. This gene is a critical growth regulator in

659GENE EXPRESSION IN IRRADIATED LYMPHOCYTES
TABLE 3Functional Groups for Gene Expression Data Obtained for Irradiated Lymphocytes as Analyzed by the
DAVID-NIH Analysis (16)
Dose Term origin Term Genes (%) P value
10 cGy Functional Group 1GOTERM�CC�ALL mitochondrion 8.20% 0.096SP�PIR�KEYWORDS mitochondrion 6.56% 0.142SP�PIR�KEYWORDS transit peptide 4.92% 0.164UP�SEQ�FEATURE transit peptide:Mitochondrion 4.92% 0.231Functional Group 2BIOCARTA h�mapkPathway:MAPKinase Signaling Pathway 4.92% 0.028GOTERM�MF�ALL ATP binding 14.75% 0.037SP�PIR�KEYWORDS atp-binding 11.48% 0.038GOTERM�MF�ALL ATP-dependent helicase activity 4.92% 0.038SP�PIR�KEYWORDS nucleotide-binding 13.11% 0.039GOTERM�MF�ALL adenyl nucleotide binding 14.75% 0.044Functional Group 3GOTERM�BP�ALL cellular process 70.49% 0.030GOTERM�CC�ALL intracellular membrane-bound organelle 34.43% 0.052GOTERM�CC�ALL membrane-bound organelle 34.43% 0.052SP�PIR�KEYWORDS nuclear protein 19.67% 0.094GOTERM�MF�ALL binding 62.30% 0.103GOTERM�CC�ALL intracellular organelle 36.07% 0.160
25 cGy Functional Group 1GOTERM�BP�ALL cellular physiological process 65.22% 0.001GOTERM�BP�ALL cellular process 70.65% 0.003GOTERM�BP�ALL macromolecule metabolism 35.87% 0.003GOTERM�MF�ALL catalytic activity 38.04% 0.003GOTERM�BP�ALL primary metabolism 50.00% 0.003GOTERM�CC�ALL intracellular membrane-bound organelle 38.04% 0.004Functional Group 2UP�SEQ�FEATURE nucleotide phosphate-binding region:ATP 10.87% 0.003GOTERM�MF�ALL ATP binding 14.13% 0.007GOTERM�MF�ALL ATPase activity, coupled 5.43% 0.030GOTERM�MF�ALL ATPase activity 5.43% 0.049GOTERM�MF�ALL ATP-dependent helicase activity 3.26% 0.069GOTERM�MF�ALL helicase activity 3.26% 0.119Functional Group 3GOTERM�BP�ALL macromolecule metabolism 35.87% 0.003UP�SEQ�FEATURE nucleotide phosphate-binding region:ATP 10.87% 0.003GOTERM�MF�ALL adenyl nucleotide binding 15.22% 0.003GOTERM�BP�ALL biopolymer metabolism 25.00% 0.004SP�PIR�KEYWORDS atp-binding 11.96% 0.005SP�PIR�KEYWORDS transferase 13.04% 0.006Functional Group 4SP�PIR�KEYWORDS hydrolase 11.96% 0.019GOTERM�MF�ALL hydrolase activity 17.39% 0.027GOTERM�MF�ALL hydrolase activity, acting on ester bonds 6.52% 0.130GOTERM�MF�ALL phosphoric ester hydrolase activity 4.35% 0.142GOTERM�MF�ALL phosphoric monoester hydrolase activity 3.26% 0.254Functional Group 5GOTERM�MF�ALL enzyme regulator activity 8.70% 0.015GOTERM�MF�ALL small GTPase regulator activity 3.26% 0.168GOTERM�MF�ALL GTPase regulator activity 3.26% 0.307Functional Group 6GOTERM�BP�ALL DNA metabolism 8.70% 0.028GOTERM�BP�ALL response to endogenous stimulus 4.35% 0.119GOTERM�BP�ALL DNA repair 3.26% 0.272GOTERM�BP�ALL response to DNA damage stimulus 3.26% 0.312Functional Group 7SP�PIR�KEYWORDS developmental protein 6.52% 0.025SP�PIR�KEYWORDS differentiation 3.26% 0.191GOTERM�BP�ALL development 11.96% 0.288GOTERM�BP�ALL cell differentiation 4.35% 0.385

660 FACHIN ET AL.
TABLE 3Continued
Dose Term origin Term Genes (%) P value
Functional Group 8SP�PIR�KEYWORDS nuclear protein 22.83% 0.005GOTERM�MF�ALL DNA binding 16.30% 0.045GOTERM�CC�ALL nucleus 25.00% 0.068GOTERM�MF�ALL nucleic acid binding 21.74% 0.074
GOTERM�BP�ALLnucleobase, nucleoside, nucleotide and nucleic acid
metabolism 23.91% 0.084SP�PIR�KEYWORDS DNA-binding 9.78% 0.166Functional Group 9SP�PIR�KEYWORDS developmental protein 6.52% 0.025GOTERM�BP�ALL negative regulation of cellular physiological process 7.61% 0.063GOTERM�BP�ALL negative regulation of physiological process 7.61% 0.072GOTERM�BP�ALL negative regulation of cellular process 7.61% 0.091GOTERM�BP�ALL negative regulation of biological process 7.61% 0.119GOTERM�BP�ALL negative regulation of apoptosis 3.26% 0.130Functional Group 1SP�PIR�KEYWORDS helicase 4.90% 0.002GOTERM�MF�ALL ATP-dependent helicase activity 4.90% 0.002GOTERM�MF�ALL helicase activity 4.90% 0.006SP�PIR�KEYWORDS ATP-binding 10.78% 0.009GOTERM�MF�ALL ATPase activity, coupled 5.88% 0.013SP�PIR�KEYWORDS hydrolase 11.76% 0.014
50 cGy Functional Group 2GOTERM�BP�ALL DNA metabolism 8.82% 0.016SP�PIR�KEYWORDS DNA repair 2.94% 0.070SP�PIR�KEYWORDS DNA damage 2.94% 0.086GOTERM�BP�ALL DNA repair 3.92% 0.104GOTERM�BP�ALL response to DNA damage stimulus 3.92% 0.130GOTERM�BP�ALL response to endogenous stimulus 3.92% 0.149GOTERM�BP�ALL response to stress 7.84% 0.288Functional Group 3GOTERM�BP�ALL macromolecule metabolism 35.29% 0.002GOTERM�BP�ALL protein metabolism 20.59% 0.254GOTERM�BP�ALL biopolymer modification 10.78% 0.334GOTERM�BP�ALL cellular macromolecule metabolism 18.63% 0.340GOTERM�BP�ALL cellular protein metabolism 17.65% 0.418GOTERM�BP�ALL protein modification 9.80% 0.438Functional Group 4SP�PIR�KEYWORDS structural protein 3.92% 0.011INTERPRO�NAME IPR008161:Collagen helix repeat 2.94% 0.034INTERPRO�NAME IPR008160:Collagen triple helix repeat 2.94% 0.073SP�PIR�KEYWORDS collagen 2.94% 0.077GOTERM�BP�ALL phosphate transport 2.94% 0.091Functional Group 5SP�PIR�KEYWORDS developmental protein 5.88% 0.036SP�PIR�KEYWORDS differentiation 3.92% 0.058GOTERM�BP�ALL cell differentiation 3.92% 0.449GOTERM�BP�ALL development 8.82% 0.689Functional Group 6GOTERM�BP�ALL macromolecule metabolism 35.29% 0.002GOTERM�BP�ALL cellular process 69.61% 0.006GOTERM�BP�ALL biopolymer metabolism 23.53% 0.008GOTERM�BP�ALL primary metabolism 46.08% 0.026SP�PIR�KEYWORDS nuclear protein 19.61% 0.027GOTERM�MF�ALL catalytic activity 35.29% 0.039Functional Group 7GOTERM�BP�ALL negative regulation of cellular physiological process 6.86% 0.092GOTERM�BP�ALL negative regulation of physiological process 6.86% 0.105GOTERM�BP�ALL anti-apoptosis 2.94% 0.122GOTERM�BP�ALL negative regulation of cellular process 6.86% 0.132GOTERM�BP�ALL negative regulation of apoptosis 2.94% 0.153GOTERM�BP�ALL negative regulation of programmed cell death 2.94% 0.154

661GENE EXPRESSION IN IRRADIATED LYMPHOCYTES
TABLE 3Continued
Dose Term origin Term Genes (%) P value
Functional Group 8SP�PIR�KEYWORDS transferase 11.76% 0.013GOTERM�MF�ALL transferase activity 14.71% 0.062SP�PIR�KEYWORDS phosphotransferase 3.92% 0.085
GOTERM�MF�ALLtransferase activity, transferring phosphorus-containing
groups 9.80% 0.090UP�SEQ�FEATURE mutagenesis site 8.82% 0.122
GOTERM�BP�ALLtransmembrane receptor protein tyrosine kinase signaling
pathway 2.94% 0.138GOTERM�BP�ALL phosphorus metabolism 7.84% 0.178GOTERM�BP�ALL phosphate metabolism 7.84% 0.178
Notes. GOTERM�BP�ALL, GOTERM�MF�ALL and GOTERM�CC�ALL: all levels of GO terms for biological processes (BP), molecularfunctions (MF) and cell components (CC), respectively. SP�PIR�KEYWORDS, SMART�NAME, UP�SEQ�FEATURE and INTERPRO�NAME:names/keywords of proteins or motifs, from Protein Information Resource (PIR), Simple Modular Architecture Research Tool (SMART), UNIPROT(UP) and InterPro databases. BIOCARTA: pathways of protein interactions.
the pathogenesis of meningiomas (54), and it has been dem-onstrated that the transcriptional modulation of EPB41L3can occur by promoter hypermethylation (55). Another up-regulated gene, BHC80, plays a role in development andtranscription regulation. This gene is a component of theBRAF-histone deacetylase complex (BHC) found in humancells (56, 57) and has the capacity to deacetylate histones,indicating that the regulation of neuron-specific genes mayoccur through the modulation of the chromatin structure.
For down-regulated genes (CREB3L2, C2orf30, MARK2,REV3L, RPS6KA5 and BAG4), biological functions are as-sociated with stress response, transcription control and neg-ative regulation of cell death. CREB3L2 (BBF2H7) encodesa transmembrane bZIP transcription factor that can be ex-pressed when unfolded proteins accumulate in the ER, andit is markedly induced at the translational level during ERstress, suggesting that the protein may play a role in pre-venting accumulation of unfolded proteins in damaged neu-rons (58). According to the authors, the induction ofCREB3L2 occurs at a translational level, but in the presentwork, this gene was transcriptionally down-regulated for10–50 cGy. However, other ER-related genes (TOR3A andTRPC4AP) were up-regulated at all doses and did not havea dose-dependent profile. The protein encoded by TOR3Ais a chaperone responsive to interferon (59), whileTRPC4AP encodes a scaffold protein associated with theTNF receptor and participates in the transport of proteinsfrom the cytosol to ER (60). As mentioned before, the pres-ent results suggest that changes in ER homeostasis can bea consequence of radiation exposure at low to moderatelevels.
Genes encoding members of ser/thr protein kinases, suchas MARK2 and RPS6KA5 (ribosomal protein S6 kinase, 90kDa, polypeptide 5), were also down-regulated in irradiatedlymphocytes. MARK2 is a MAP/microtubule affinity-reg-ulating kinase 2 EMK (ELKL Motif kinase) involved in thecontrol of cell polarity, microtubule stability, differentia-tion/cell growth, and phosphorylation of tau protein and is
enhanced in brain tissue from patients with Alzheimer dis-ease, causing the detachment of tau from microtubules (61).RPS6KA5 (MSK1) is required for the mitogen or stress-induced phosphorylation of the transcription factors CREB(camp response element-binding protein) and ATF1 (acti-vating transcription factor 1). It plays an essential role inthe control of transcriptional activity in response to TNF(62), and additional functions are associated with oxidativestress response, responses to external stimuli, histone phos-phorylation and proteolysis. RPS6KA5 has a role in TGF-�-mediated responses through p38 and Smad signalingpathways (63).
C2orf30 (Chromosome 2 open reading frame 30) wasalso down-regulated in irradiated lymphocytes. This genebelongs to OS9 family, and it may play a role in the ER-associated degradation of misfolded glycoproteins. Sincethis gene was differentially expressed in cells of severalhuman tumor cell lines and was amplified in sarcomas (64),its role seems to be closely associated with cancer progres-sion.
Other down-regulated genes play important roles in DNArepair/replication [REV3L: REV3-like, catalytic subunit ofDNA polymerase zeta (yeast)], and negative regulation ofcell death (BAG4: BCL2-associated athanogene 4). TheC-terminal part of REV3L could serve as the catalytic do-main during nucleotide polymerization, while its N-termi-nal part could provide sites for protein-protein interactionsduring translesion DNA synthesis (65, 66). Its ubiquitousexpression in various tissues is consistent with the role indamage-induced mutagenesis in humans (67). The BAG4gene product is a member of the BAG1-related protein fam-ily, which is an anti-apoptosis protein family. Furthermore,there is evidence that SODD/BAG4 is a silencer of TNFR1and a modulator of CD95 activity, regulating the balanceof both death-promoting and death-depressing signals (68).
In normal human fibroblasts, Ding et al. (39) found thatthe predominant biological responses after 2 cGy irradiationwere related to cell-cell signaling, DNA damage stimulus,
662 FACHIN ET AL.
FIG. 6. Gene expression levels determined by the DNA microarrayand real-time PCR methods for XAB2 (which was down-regulated for allthree doses) and RAD51L1 (up-regulated for 25 cGy) genes. The sameRNA samples were used in both assays.
←
FIG. 5. Supervised hierarchical clustering performed for 788 geneswhose expression levels were found to differ between experimentalgroups. This set of genes was selected by the SAM analysis for �0.25. Distinct patterns of expression can be seen for control and irradiatedcells at different doses, in agreement with quantitative results in terms ofinduced and repressed genes. The normalized expression of each gene isdepicted according to the scale at the top; red indicates expression levelsgreater than the median, and green indicates levels lower than the median(�3 to 3 in log2 units). Gray indicates excluded values.
development and signal transduction, while for 4 Gy, theyfound apoptosis and cell proliferation. However, Ding et al.used primary skin fibroblasts and different radiation doses.In lymphocytes, we found a reasonable similarity amongthe profiles of gene expression for different donors, and ingeneral, only a few cell cycle arrest and apoptosis genesshowed changes in expression. This is compatible with par-allel experiments on cell cycle kinetics conducted in ourlaboratory, which showed that after PHA stimulation for 48h, the percentages of lymphocytes in G1, S and G2 phases(49, 41 and 10%, respectively) did not change significantly(data not shown), and cell cycle delay was not observed inlymphocytes irradiated with doses below 2 Gy.
Hierarchical Clustering for Differentially ExpressedGenes
By clustering analysis, for a dose of 50 cGy, a cluster ofup-regulated genes showed similar expression patterns, pre-dominantly gene classes related to transcription regulation,transport/localization, RNA editing/DNA methylation, andapoptosis/DNA repair. For the same dose, a cluster ofdown-regulated genes was observed, including classes re-lated to damage response/cell growth, DNA repair/stressresponse, and chromatin access/structure. The expressionprofiles obtained for 25 and 50 cGy showed more commongenes, and the expression patterns were very similar, as wasalso confirmed by the DAVID analysis of functional an-

663GENE EXPRESSION IN IRRADIATED LYMPHOCYTES
notation (Table 3). Genes belonging to the MAP kinasepathway were grouped in the same cluster, showing acti-vation after irradiation with 25 and 50 cGy. In contrast, forboth doses, a gene cluster was characterized by the down-regulation of genes participating in PI3K cascade, proteol-ysis and fatty acid oxidation. Interestingly, among thesedown-regulated genes at 25 and 50 cGy, a sub-cluster ofgenes showed a marked up-regulation for 10 cGy, indicat-ing that differences and similarities in cell responses maybe a consequence of the kind of DNA lesions and the extentof DNA damage, which are dependent on the dose.
In general, these results indicate that radiation-responsivegenes play a role in multiple biological processes, and evenwithin a limited range of radiation doses (10 to 50 cGy),qualitative and quantitative differences can be observed intranscriptional profiles displayed by human lymphocytesgrown for one or two cell divisions after radiation exposure.There were groups of responsive genes for 10 cGy that didnot respond to 25 and 50 cGy, while other groups weremore responsive to 25 and/or 50 cGy, but they did notundergo transcriptional changes at 10 cGy.
According to Coleman et al. (20), the major cellularfunctions associated with low-dose (2 cGy) primary effectswere protein synthesis, metabolism and signal transduction.As demonstrated by those authors, in general, genes forprotein synthesis were up-regulated, while metabolismgenes were down-regulated; signal transduction genesshowed mostly down-regulation but had a more mixed re-sponse. The findings of increased transcript levels in a largenumber of protein synthesis genes are consistent with thesuggestion that protein biosynthesis is a fundamental re-sponse to low-dose radiation, and this was also seen in thepresent study. However, Coleman et al. (20) carried outtheir experiments with cells of lymphoblastoid cell lines,which are immortalized and already have a number of ge-netic alterations. These cells may show differences in re-sponses compared with primary fibroblasts or lymphocytesin transcriptional profiles in irradiated cells.
CONCLUSION
The present study showed the effectiveness of low tomoderate radiation doses in inducing transcriptional chang-es. Several genes that were found to be differentially ex-pressed in irradiated lymphocytes are involved in multiplecellular processes, including, stress response/DNA repair,cell growth/differentiation, transcription regulation, trans-port and metabolism, indicating an interconnection amongmetabolic processes and large number of stress responsemechanisms. These results also show that radiation-respon-sive genes play a role in multiple biological processes, andeven within a small range of radiation doses (10 to 50 cGy),qualitative and quantitative differences can be observed inthe transcriptional profiles of irradiated lymphocytes. Fur-thermore, transcriptional alterations are in agreement withthe results obtained in the cytogenetic analysis, since 10
and 50 cGy can induce a distinctive response in both pa-rameters. The present findings demonstrate the potentialrisk in humans for the development of genetic instabilityand acquired diseases as a consequence of radiation expo-sure. Many of these genes and/or gene products can beinvestigated further to determine their potential as bio-markers of stress response and to determine whether tran-script alterations are associated with protein changes.
SUPPLEMENTARY INFORMATION
Complete list of differentially expressed genes: http://dx.doi.org/10.1667/RR0487.1.s1.
ACKNOWLEDGMENTS
This research was supported by FAPESP (Fundacao de Amparo a Pes-quisa do Estado de Sao Paulo) Proc. No. 99/12135-9, 01/10995-2 (post-doctoral fellowship to ALF), 02/07314-6 (doctoral fellowship to SSM)and CNPq (Conselho Nacional de Desenvolvimento Cientıfico e Tecnol-ogico). We would like to thank Ms. Edenyse C. Bertucci and Mr. GustavoL. Barbi, for irradiation of blood samples, and Prof. Dr. Thomaz GhilardiNetto (Sector of Image Sciences and Medical Physics, HCFMRP-USP,HC-FMRPUSP).
Received: November 28, 2005; accepted: July 26, 2007
REFERENCES
1. S. Boutcher and T. Haas, External radiation doses to nuclear medicinetechnologists from procedures using 99mTc radiopharmaceuticals.Can. J. Radiogr. Radiother. Nucl. Med. 16, 161–165 (1985).
2. B. Nowak and J. Jankowski, Occupational exposure in operationalradiology. Pol. J. Occup. Med. Environ. Health 4, 169–174 (1991).
3. A. N. Jha and T. Sharma, Enhanced frequency of chromosome ab-errations in workers occupationally exposed to diagnostic X-rays.Mutat. Res. 260, 343–348 (1991).
4. J. F. Barquinero, L. Barrios, M. R. Caballin, R. Miro, M. Ribas, A.Subias and J. Egozcue, Cytogenetic analysis of lymphocytes fromhospital workers occupationally exposed to low levels of ionizingradiation. Mutat. Res. 286, 275–279 (1993).
5. R. S. Cardoso, S. Takahashi-Hyodo, P. Peitl, Jr., T. Ghilardi-Neto andE. T. Sakamoto-Hojo, Evaluation of chromosomal aberrations, mi-cronuclei, and sister chromatid exchanges in hospital workers chron-ically exposed to ionizing radiation. Teratog. Carcinog. Mutagen. 21,431–439 (2001).
6. E. T. Sakamoto-Hojo, S. S. Mello, E. Pereira, A. L. Fachin, R. S.Cardoso, C. M. Junta, P. Sandrin Garcia, E. A. Donadi and G. A. S.Passos, Gene expression profiles in human cells submitted to geno-toxic stress. Mutat. Res. 544, 403–413 (2003).
7. R. K. Schmidt-Ullrich, P. Dent, S. Grant, R. B. Mikkelsen and K.Valerie, Signal transduction and cellular radiation responses. Radiat.Res. 153, 245–257 (2000).
8. G. D. Wilson, Radiation and the cell cycle, revisited. Cancer Metas-tasis Rev. 23, 209–225 (2004).
9. E. T. Sakamoto-Hojo, S. S. Mello, C. L. Bassi, I. M. Merchi, A. L.Fachin, E. A. Donadi and G. A. S. Passos, Genomic instability: sig-naling pathways orchestrating the responses to ionizing radiation andcisplatin. In Genome Dynamics and Stability (D. Lankenau, Ed.), pp.423–452. Springer-Verlag, Berlin, Heidelberg, 2005.
10. S. A. Amundson and A. J. Fornace, Jr., Gene expression profiles formonitoring radiation exposure. Radiat. Prot. Dosimetry 97, 11–16(2001).

664 FACHIN ET AL.
11. E. Yin, D. O. Nelson, M. A. Coleman, L. E. Peterson and A. J.Wyrobek, Gene expression changes in mouse brain after exposure tolow-dose ionizing radiation. Int. J. Radiat. Biol. 79, 759–775 (2003).
12. A. R. Snyder and W. F. Morgan, Gene expression profiling after ir-radiation: Clues to understanding acute and persistent responses?Cancer Metastasis Rev. 23, 259 (2004).
13. P. Hegde, R. Qi, K. Abernathy, C. Gay, S. Dharap, R. Gaspard, J. E.Hughes, E. Snesrud, N. Lee and J. Quackenbush, A concise guide tocDNA microarray analysis. Biotechniques 29, 548–550, 552–544,556 passim (2000).
14. R. Ihaka and R. Gentleman, R: A language for data analysis andgraphics. J. Comput. Graph. Stat. 5, 299–314 (1996).
15. Y. H. Yang and T. Speed, Design issues for cDNA microarray ex-periments. Nat. Rev. Genet. 3, 579–588 (2002).
16. G. Dennis, Jr., B. T. Sherman, D. A. Hosack, J. Yang, W. Gao, H. C.Lane and R. A. Lempicki, DAVID: Database for Annotation, Visu-alization, and Integrated Discovery. Genome Biol. 4, P3 (2003).
17. K. J. Livak and T. D. Schmittgen, Analysis of relative gene expres-sion data using real-time quantitative PCR and the 2(���C(T))method. Methods 25, 402–408 (2001).
18. E. J. Hall, Radiobiology for the Radiologist, 5th ed. Lippincott Wil-liams & Wilkins, Philadelphia, 2000.
19. IAEA, Biological Dosimetry: Chromosomal Aberration Analysis forDose Assessment. IAEA, Vienna, 1986.
20. M. A. Coleman, E. Yin, L. E. Peterson, D. Nelson, K. Sorensen, J. D.Tucker and A. J. Wyrobek, Low-dose irradiation alters the transcriptprofiles of human lymphoblastoid cells including genes associatedwith cytogenetic radioadaptive response. Radiat. Res. 164, 369–382(2005).
21. U. Savas, M. H. Hsu, K. J. Griffin, D. R. Bell and E. F. Johnson,Conditional regulation of the human CYP4X1 and CYP4Z1 genes.Arch. Biochem. Biophys. 436, 377–385 (2005).
22. O. K. Rodningen, J. Overgaard, J. Alsner, T. Hastie and A. L. Bor-resen-Dale, Microarray analysis of the transcriptional response to sin-gle or multiple doses of ionizing radiation in human subcutaneousfibroblasts. Radiother. Oncol. 77, 231–240 (2005).
23. T. Murakami, S. I. Hino, A. Saito and K. Imaizumi, Endoplasmicreticulum stress response in dendrites of cultured primary neurons.Neuroscience 146, 1–8 (2007).
24. M. Hong, M. Li, C. Mao and A. S. Lee, Endoplasmic reticulum stresstriggers an acute proteasome-dependent degradation of ATF6. J. CellBiochem. 92, 723–732 (2004).
25. W. S. Chu, S. K. Das, H. Wang, J. C. Chan, P. Deloukas, P. Froguel,L. J. Baier, W. Jia, M. I. McCarthy and S. C. Elbein, Activatingtranscription factor 6 (ATF6) sequence polymorphisms in type 2 di-abetes and pre-diabetic traits. Diabetes 56, 856–862 (2007).
26. T. Namba, T. Ishihara, K. Tanaka, T. Hoshino and T. Mizushima,Transcriptional activation of ATF6 by endoplasmic reticulum stress-ors. Biochem. Biophys. Res. Commun. 355, 543–548 (2007).
27. K. Haze, H. Yoshida, H. Yanagi, T. Yura and K. Mori, Mammaliantranscription factor ATF6 is synthesized as a transmembrane proteinand activated by proteolysis in response to endoplasmic reticulumstress. Mol. Biol. Cell 10, 3787–3799 (1999).
28. J. Ye, R. B. Rawson, R. Komuro, X. Chen, U. P. Dave, R. Prywes,M. S. Brown and J. L. Goldstein, ER stress induces cleavage ofmembrane-bound ATF6 by the same proteases that process SREBPs.Mol. Cell 6, 1355–1364 (2000).
29. D. K. Lee, S. R. George and B. F. O’Dowd, Novel G-protein-coupledreceptor genes expressed in the brain: continued discovery of im-portant therapeutic targets. Expert Opin. Ther. Targets 6, 185–202(2002).
30. S. A. Shoichet, L. Duprez, O. Hagens, V. Waetzig, C. Menzel, T.Herdegen, S. Schweiger, B. Dan, E. Vamos and V. M. Kalscheuer,Truncation of the CNS-expressed JNK3 in a patient with a severe
developmental epileptic encephalopathy. Hum. Genet. 118, 559–567(2006).
31. Y. C. Lio, A. V. Mazin, S. C. Kowalczykowski and D. J. Chen,Complex formation by the human Rad51B and Rad51C DNA repairproteins and their activities in vitro. J. Biol. Chem. 278, 2469–2478(2003).
32. H. Yokoyama, H. Kurumizaka, S. Ikawa, S. Yokoyama and T. Shi-bata, Holliday junction binding activity of the human Rad51B pro-tein. J. Biol. Chem. 278, 2767–2772 (2003).
33. P. Jeggo and P. O’Neill, The Greek goddess, Artemis, reveals thesecrets of her cleavage. DNA Repair (Amst.) 1, 771–777 (2002).
34. P. Jeggo, B. Singleton, H. Beamish and A. Priestley, Double strandbreak rejoining by the Ku-dependent mechanism of non-homologousend-joining. C. R. Acad. Sci. III 322, 109–112 (1999).
35. P. Karran, DNA double strand break repair in mammalian cells. Curr.Opin. Genet. Dev. 10, 144–150 (2000).
36. T. Otomo, M. Hishii, H. Arai, K. Sato and K. Sasai, Microarrayanalysis of temporal gene responses to ionizing radiation in two glio-blastoma cell lines: up-regulation of DNA repair genes. J. Radiat.Res. (Tokyo) 45, 53–60 (2004).
37. G. S. Akerman, B. A. Rosenzweig, O. E. Domon, C. A. Tsai, M. E.Bishop, L. J. McGarrity, J. T. Macgregor, F. D. Sistare, J. J. Chenand S. M. Morris, Alterations in gene expression profiles and theDNA-damage response in ionizing radiation-exposed TK6 cells. En-viron. Mol. Mutagen. 45, 188–205 (2005).
38. H. P. Wang, X. H. Long, Z. Z. Sun, O. Rigaud, Q. Z. Xu, Y. C.Huang, J. L. Sui, B. Bai and P. K. Zhou, Identification of differen-tially transcribed genes in human lymphoblastoid cells irradiated with0.5 Gy of gamma-ray and the involvement of low dose radiationinducible CHD6 gene in cell proliferation and radiosensitivity. Int.J. Radiat. Biol. 82, 181–190 (2006).
39. L. H. Ding, M. Shingyoji, F. Chen, J. J. Hwang, S. Burma, C. Lee,J. F. Cheng and D. J. Chen, Gene expression profiles of normal hu-man fibroblasts after exposure to ionizing radiation: a comparativestudy of low and high doses. Radiat. Res. 164, 17–26 (2005).
40. S. Tachiiri, T. Katagiri, T. Tsunoda, N. Oya, M. Hiraoka and Y. Nak-amura, Analysis of gene-expression profiles after gamma irradiationof normal human fibroblasts. Int. J. Radiat. Oncol. Biol. Phys. 64,272 (2006).
41. S. A. Amundson, M. Bittner, Y. Chen, J. Trent, P. Meltzer and A. J.Fornace, Jr., Fluorescent cDNA microarray hybridization revealscomplexity and heterogeneity of cellular genotoxic stress responses.Oncogene 18, 3666–3672 (1999).
42. Y. Nakatsu, H. Asahina, E. Citterio, S. Rademakers, W. Vermeulen,S. Kamiuchi, J. P. Yeo, M. C. Khaw, M. Saijo and K. Tanaka, XAB2,a novel tetratricopeptide repeat protein involved in transcription-cou-pled DNA repair and transcription. J. Biol. Chem. 275, 34931–34937(2000).
43. R. Yonemasu, M. Minami, Y. Nakatsu, M. Takeuchi, I. Kuraoka, Y.Matsuda, Y. Higashi, H. Kondoh and K. Tanaka, Disruption of mouseXAB2 gene involved in pre-mRNA splicing, transcription and tran-scription-coupled DNA repair results in preimplantation lethality.DNA Repair (Amst.) 4, 479–491 (2005).
44. K. Ohnuma-Ishikawa, T. Morio, T. Yamada, Y. Sugawara, M. Ono,M. Nagasawa, A. Yasuda, C. Morimoto, K. Ohnuma and S. Mizutani,Knockdown of XAB2 enhances all-trans retinoic acid-induced cel-lular differentiation in all-trans retinoic acid-sensitive and -resistantcancer cells. Cancer Res. 67, 1019–1029 (2007).
45. S. A. Amundson, K. T. Do, S. Shahab, M. Bittner, P. Meltzer, J. Trentand A. J. Fornace, Jr., Identification of potential mRNA biomarkersin peripheral blood lymphocytes for human exposure to ionizing ra-diation. Radiat. Res. 154, 342–346 (2000).
46. V. G. Tusher, R. Tibshirani and G. Chu, Significance analysis ofmicroarrays applied to the ionizing radiation response. Proc. Natl.Acad. Sci. USA 98, 5116–5121 (2001).
665GENE EXPRESSION IN IRRADIATED LYMPHOCYTES
47. A. N. Heinloth, R. E. Shackelford, C. L. Innes, L. Bennett, L. Li, R. P.Amin, S. O. Sieber, K. G. Flores, P. R. Bushel and R. S. Paules,Identification of distinct and common gene expression changes afteroxidative stress and gamma and ultraviolet radiation. Mol. Carcinog.37, 65–82 (2003).
48. K. Y. Jen and V. G. Cheung, Transcriptional response of lympho-blastoid cells to ionizing radiation. Genome Res. 13, 2092–2100(2003).
49. K. E. Rieger and G. Chu, Portrait of transcriptional responses toultraviolet and ionizing radiation in human cells. Nucleic Acids Res.32, 4786–4803 (2004).
50. Z. Goldberg, C. W. Schwietert, B. Lehnert, R. Stern and I. Nami,Effects of low-dose ionizing radiation on gene expression in humanskin biopsies. Int. J. Radiat. Oncol. Biol. Phys. 58, 567–574 (2004).
51. S. Jamain, H. Quach, M. Fellous and T. Bourgeron, Identification ofthe human KIF13A gene homologous to Drosophila kinesin-73 andcandidate for schizophrenia. Genomics 74, 36–44 (2001).
52. J. V. Frangioni, P. H. Beahm, V. Shifrin, C. A. Jost and B. G. Neel,The nontransmembrane tyrosine phosphatase PTP-1B localizes to theendoplasmic reticulum via its 35 amino acid C-terminal sequence.Cell 68, 545–560 (1992).
53. L. V. Ravichandran, H. Chen, Y. Li and M. J. Quon, Phosphorylationof PTP1B at Ser(50) by Akt impairs its ability to dephosphorylatethe insulin receptor. Mol. Endocrinol. 15, 1768–1780 (2001).
54. F. Nunes, Y. Shen, Y. Niida, R. Beauchamp, A. O. Stemmer-Racham-imov, V. Ramesh, J. Gusella and M. MacCollin, Inactivation patternsof NF2 and DAL-1/4.1B (EPB41L3) in sporadic meningioma. Can-cer Genet. Cytogenet. 162, 135–139 (2005).
55. W. A. Schulz, A. Alexa, V. Jung, C. Hader, M. J. Hoffmann, M.Yamanaka, S. Fritzsche, A. Wlazlinski, M. Muller and J. Rahnen-fuhrer, Factor interaction analysis for chromosome 8 and DNA meth-ylation alterations highlights innate immune response suppressionand cytoskeletal changes in prostate cancer. Mol. Cancer 6, 14(2007).
56. M. A. Hakimi, I. Privat, J. G. Valay and S. Lerbs-Mache, Evolution-ary conservation of C-terminal domains of primary sigma(70)-typetranscription factors between plants and bacteria. J. Biol. Chem. 275,9215–9221 (2000).
57. S. Iwase, A. Januma, K. Miyamoto, N. Shono, A. Honda, J. Yana-gisawa and T. Baba, Characterization of BHC80 in BRAF-HDACcomplex, involved in neuron-specific gene repression. Biochem. Bio-phys. Res. Commun. 322, 601–608 (2004).
58. S. Kondo, A. Saito, S. Hino, T. Murakami, M. Ogata, S. Kanemoto,
S. Nara, A. Yamashita, K. Yoshinaga and K. Imaizumi, BBF2H7, anovel transmembrane bZIP transcription factor, is a new type of en-doplasmic reticulum stress transducer. Mol. Cell. Biol. 27, 1716–1729(2007).
59. M. Dron, J. F. Meritet, F. Dandoy-Dron, J. P. Meyniel, C. Maury andM. G. Tovey, Molecular cloning of ADIR, a novel interferon re-sponsive gene encoding a protein related to the torsins. Genomics79, 315–325 (2002).
60. S. M. Soond, J. L. Terry, J. D. Colbert and D. W. H. Riches, TRUSS,a novel tumor necrosis factor receptor 1 scaffolding protein that me-diates activation of the transcription factor NF-�B. Mol. Cell. Biol.23, 8334–8344 (2003).
61. J. Biernat, Y. Z. Wu, T. Timm, Q. Zheng-Fischhofer, E. Mandelkow,L. Meijer and E. M. Mandelkow, Protein kinase MARK/PAR-1 isrequired for neurite outgrowth and establishment of neuronal polarity.Mol. Biol. Cell 13, 4013–4028 (2002).
62. C. Jiang, L. Yu, Q. Tu, Y. Zhao, H. Zhang and S. Zhao, Assignmentof a member of the ribosomal protein S6 kinase family, RPS6KA5,to human chromosome 14q31→q32.1 by radiation hybrid mapping.Cytogenet. Cell Genet. 87, 261–262 (1999).
63. L. Abecassis, E. Rogier, A. Vazquez, A. Atfi and M. F. Bourgeade,Evidence for a role of MSK1 in transforming growth factor-beta-mediated responses through p38 and Smad signaling pathways. J.Biol. Chem. 279, 30474–30479 (2004).
64. D. T. Ross, U. Scherf, M. B. Eisen, C. M. Perou, C. Rees, P. Spell-man, V. Iyer, S. S. Jeffrey, M. Van de Rijn and P. O. Brown, System-atic variation in gene expression patterns in human cancer cell lines.Nat. Genet. 24, 227–235 (2000).
65. F. Zhu, C. X. Jin, T. Song, J. Yang, L. Guo and Y. N. Yu, Responseof human REV3 gene to gastric cancer inducing carcinogen N-meth-yl-N�-nitro-N-nitrosoguanidine and its role in mutagenesis. World J.Gastroenterol. 9, 888–893 (2003).
66. Z. Li, H. Zhang, T. P. McManus, J. J. McCormick, C. W. Lawrenceand V. M. Maher, hREV3 is essential for error-prone translesion syn-thesis past UV or benzo[a]pyrene diol epoxide-induced DNA lesionsin human fibroblasts. Mutat. Res. 510, 71–80 (2002).
67. W. Lin, X. Wu and Z. Wang, A full-length cDNA of hREV3 is pre-dicted to encode DNA polymerase zeta for damage-induced muta-genesis in humans. Mutat. Res. 433, 89–98 (1999).
68. H. Eichholtz-Wirth, E. Fritz and L. Wolz, Overexpression of the ‘si-lencer of death domain’, SODD/BAG-4, modulates both TNFR1- andCD95-dependent cell death pathways. Cancer Lett. 194, 81–89(2003).