gene expression array and snp array microarrays introduction to gene expression arrays data...
TRANSCRIPT

Gene expression array and SNP array
Microarrays
Introduction to gene expression arraysData pre-processing
SNPsCopy number abberationLoss of heterozygosityAssociation studies

An “old” technology - some predict microarrays will be replaced by deep sequencingCurrently – much cheaper/faster than sequencing; widely used
2005: first next-generation sequencing machine
http://www.microarraystation.com/dna-microarray-timeline/Timeline of DNA Microarray Developments 1991: Photolithographic printing (Affymetrix)1994: First cDNA collections are developed at Stanford1995: Quantitative monitoring of gene expression patterns with a
complementary DNA microarray.1996: Commercialization of arrays (Affymetrix)1997: Genome- wide expression monitoring in S. cerevisiae (yeast)2000: Portraits/ Signatures of cancer.2003: Introduction into clinical practices2004: Whole human genome on one microarray
2006: All exons measured on one microarray
Basics of microarrays

Basics of microarraysThey utilize the chemical binding between the four nucleotides.
A --- T, and C --- G. The DNA structure is formed through the binding:
http://content.answers.com/main/content/wp/en/f/f0/DNA_Overview.png

AATTCAGCATGGGCACATGCCCGCGTTAAGTCGTACCCGTGTACGGGCGC
Basics of microarrays

Two strategies:(1) One sample on each array
The amount is calculated from spot intensity.(2) Two samples, differentially labeled, on each array
The relative amount,
is given by the ratio between the fluorescence.reference
sample
CC
Amplified DNA segments fluorescence labeling hybridization on the array reading by photo scanner digitize into fluorescence values quantify amount of each target sequence
Basics of microarrays

Gene expression arrays
DNA(2 copies)
mRNA(multiple copies)
Protein(multiple copies)
geneexon
intron
Poly A tailStart codon
The amount of these guys matter! But they are hard to measure.
The amount of these guys is easy to measure. And it is positively correlated with the protein amount!

Gene expression array --- affymetrix
The Affymetrix platform is one of the most widely used.
http://www.affymetrix.com/

Gene expression arrays -- AffyHere we use the U133 system for illustration.
Some 20 probes per gene;Selected from the 3’ end of the gene sequence;Not necessarily evenly spaced --- sequence property matters;The probes are located at random locations on the chip;
TTAAGTCGTACCCGTGTACGGGCGC Target sequence
AATTCAGCATGGGCACATGCCCGCG Perfect match (PM) probeAATTCAGCATGGACACATGCCCGCG Mis-match (MM) probe

Gene expression array - affy
http://www.affymetrix.com/
The hope was that mismatch probes won’t bind the target sequence.
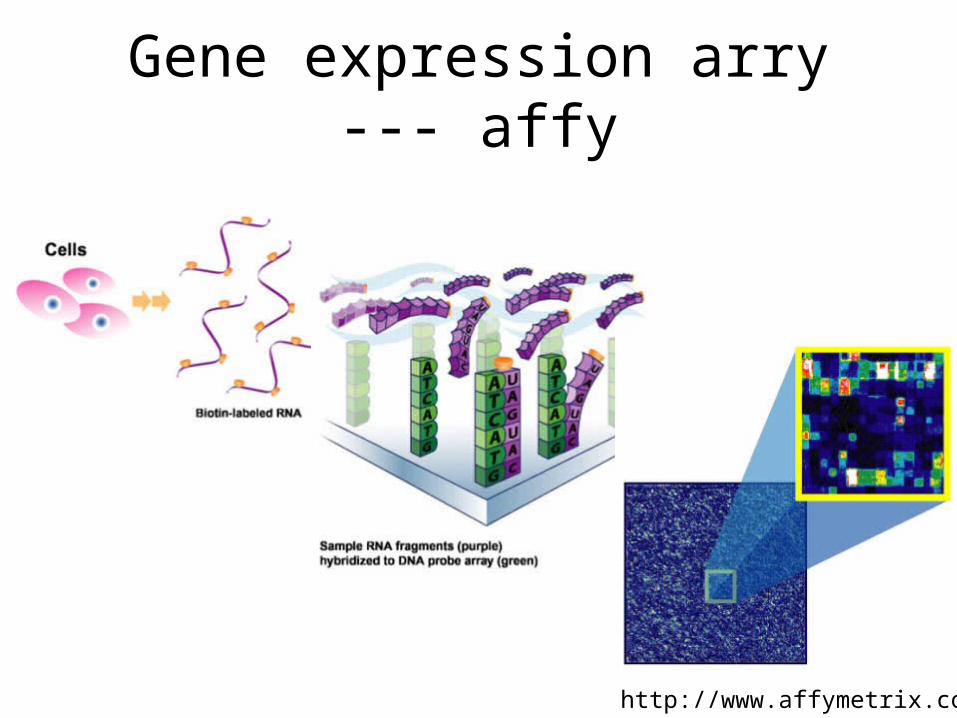
Gene expression arry --- affy
http://www.affymetrix.com/

Microarray data
?
We are going to focus on pre-processing for now.Downstream analyses are more in the realm of traditional statistics: multiple testing, clustering, classification……They are common across different high-throughput techniques.

Microarray dataIssues:
Background level variation caused by variations in overall RNA concentration in the sample, image reader, etc.
Within every probeset, each probe has different sensitivity/specificity, caused by cross-hybridization, different chemical properties etc.
Across chips, the fluorescence intensity-concentration response curve can be different, caused by variations in sample processing, image reader etc.

Affy data --- general strategyBackground correction (within chip)
Presence/absence call(within chip)
Normalization(across-chip)
Probe-set level expression value(within chip)
Probeset-level statistical analysis (combining chips)

Affy data --- general strategy
There are many processing methods. The most popular include:
MAS 5.0 (Affymetrix)Flawed. But it comes with the Affymetrix software.
Thus widely used by non-experts.
dChip (Cheng Li & Wing Wong)Good performance and versatile. Stand-alone
Windows application. Can handle arrays other than expression array.
RMA (Rafael Irizarry et al.)Good performance. Easily used in R/Bioconductor.

Affy data --- RMA Background correctionFor each array, assumes:
zeroat truncated-left ),(~ :Background
)(~ :Signal2
NB
ExpS
BSPM
lambda=1,miu=1,sigma=1 lambda=5, miu=1, sigma=1

Affy data --- RMA Background correctionFor each array, from the PM signal distribution, estimate the parameters, Find the overall mode by kernel density estimation; Find the miu and sigma from PM values lower than the overall mode (sample mean and sd) Find the lambda from PM values higher than the overall mode (1/(sample mean minus the overall mode))
then adjust the PM readings (s is PM signal; lambda is replaced by alpha in this expression):
See the derivation here: http://www.biochem.ucl.ac.uk/~harry/MAD/rma_bg.pdf

Affy data --- normalization*** This is also relevant to other array platforms !
To reduce chip effect, including non-linear effect.
Difficulty: the sample is different for each chip. We can’t match a gene in chip A to the same gene in chip B hoping they have the same intensity.
PMMM
Assumptions on the overall distributions of the signals on each chip are made. For example:
Some house-keeping genes don’t change;The overall distribution of concentrations don’t change;……

Affy data --- normalizationQuantile normalization --- match the quantiles between two chips.Assumes that the distribution of gene abundances is the same between samples.
xnorm = F2-1(F1(x)), x: value in the chip to be normalized
F1: distribution function in the chip to be normalized F2: distribution function in the reference chip
Nature Protocols 2, 2958 - 2974 (2007)

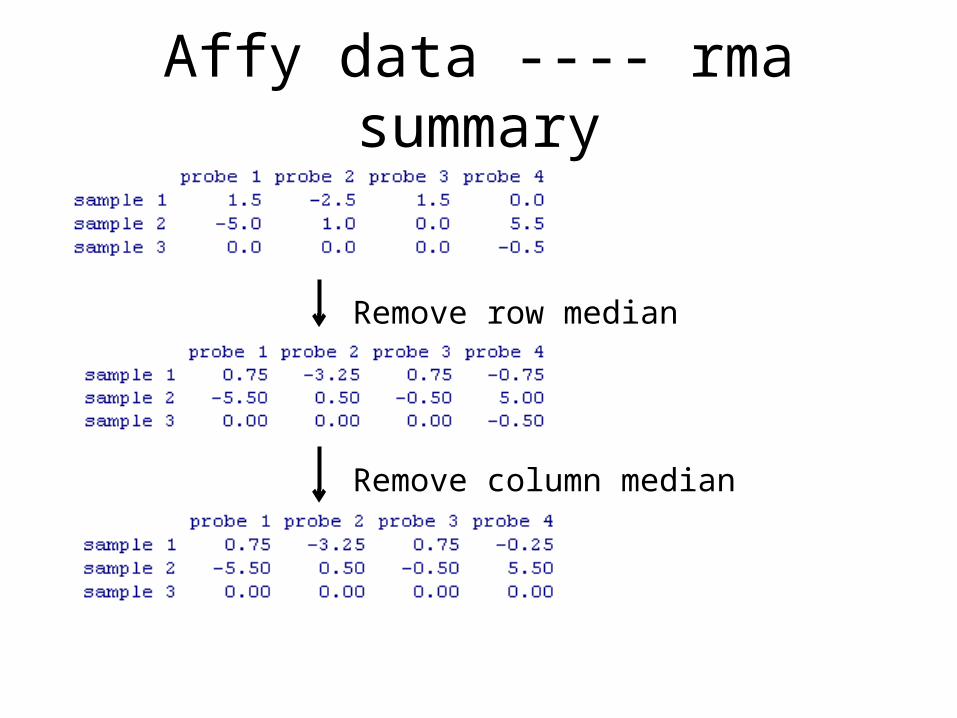
Affy data --- RMA summary
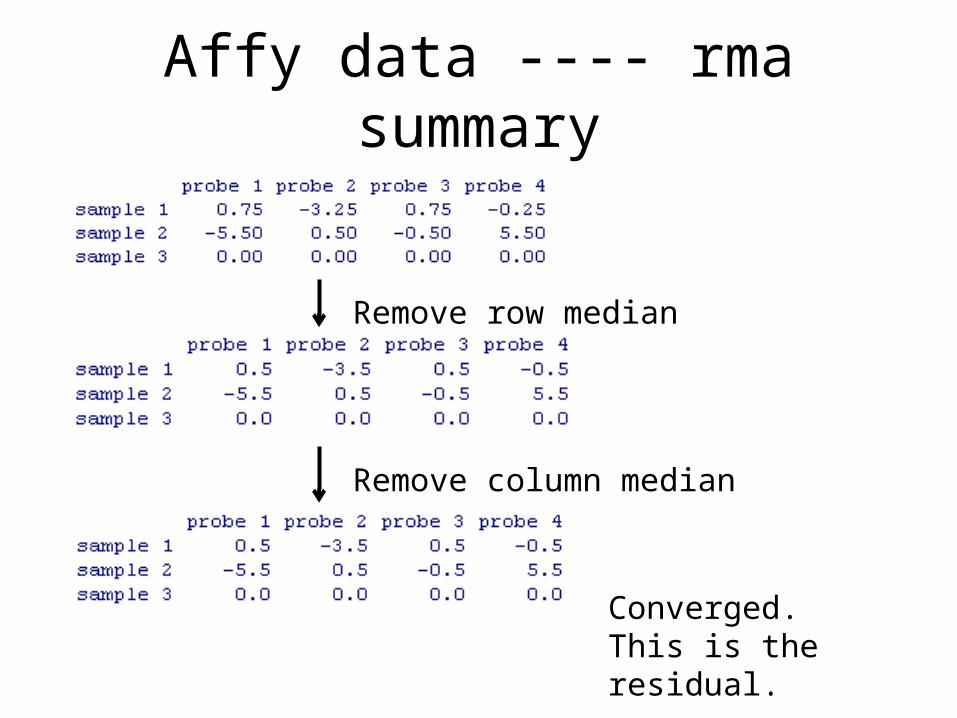
Model-fitting: Median Polish (robust against outliers)alternately removing the row and column medians
until convergenceThe remainder is the residual; After subtracting the residual, the row- and column-
medians are the estimates of the effects.

Affy data ---- rma summary
Remove row median
Remove column median
Affy data ---- rma summary
Remove row median
Remove column median
Affy data ---- rma summary
Remove row median
Remove column median
Converged. This is the residual.

Affy data ---- rma summary
* This reflects the assumption that probe effects have median zero.
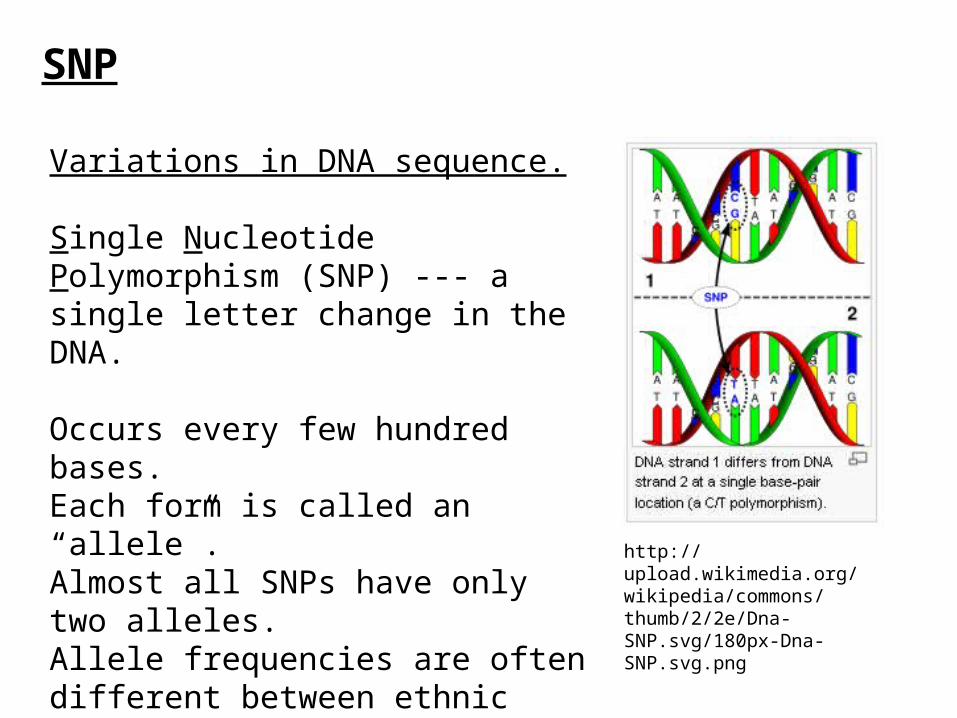
SNP
Variations in DNA sequence.
Single Nucleotide Polymorphism (SNP) --- a single letter change in the DNA.
Occurs every few hundred bases.Each form is called an “allele”.Almost all SNPs have only two alleles.Allele frequencies are often different between ethnic groups. http://upload.wikimedia.org/
wikipedia/commons/thumb/2/2e/Dna-SNP.svg/180px-Dna-SNP.svg.png

Correlations between SNPsWhy measure the SNP alleles?
http://www.evolutionpages.com/images/crossing_over.gif
DNA change in two ways during evolution:
Point mutation SNPs
RecombinationThis happens in large segments. Alleles of adjacent SNPs are highly dependent.
Haplotype: A group of alleles linked closely enough to be inherited mostly as a unit.

Why SNP?
This is on the homepage of the International Hapmap Projecthttp://www.hapmap.org/originhaplotype.html.en
Figure 1: This diagram shows two ancestral chromosomes being scrambled through recombination over many generations to yield different descendant chromosomes. If a genetic variant marked by the A on the ancestral chromosome increases the risk of a particular disease, the two individuals in the current generation who inherit that part of the ancestral chromosome will be at increased risk. Adjacent to the variant marked by the A are many SNPs that can be used to identify the location of the variant.
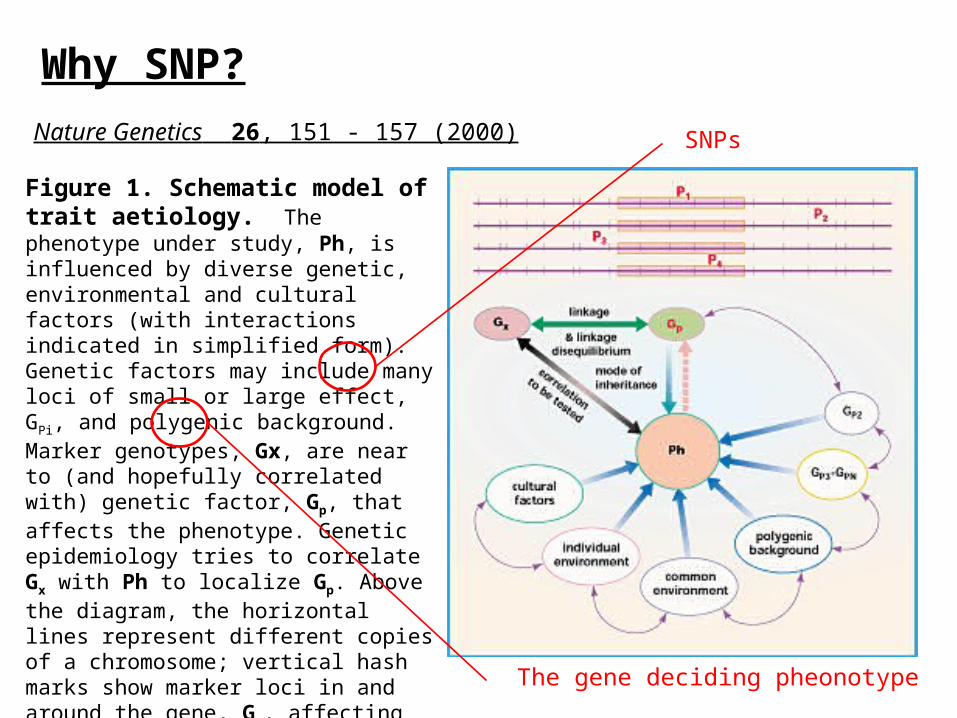
Why SNP?Nature Genetics 26, 151 - 157 (2000)
Figure 1. Schematic model of trait aetiology. The phenotype under study, Ph, is influenced by diverse genetic, environmental and cultural factors (with interactions indicated in simplified form). Genetic factors may include many loci of small or large effect, GPi, and polygenic background. Marker genotypes, Gx, are near to (and hopefully correlated with) genetic factor, Gp, that affects the phenotype. Genetic epidemiology tries to correlate Gx with Ph to localize Gp. Above the diagram, the horizontal lines represent different copies of a chromosome; vertical hash marks show marker loci in and around the gene, Gp, affecting the trait. The red Pi are the chromosomal locations of aetiologically relevant variants, relative to Ph.
SNPs
The gene deciding pheonotype
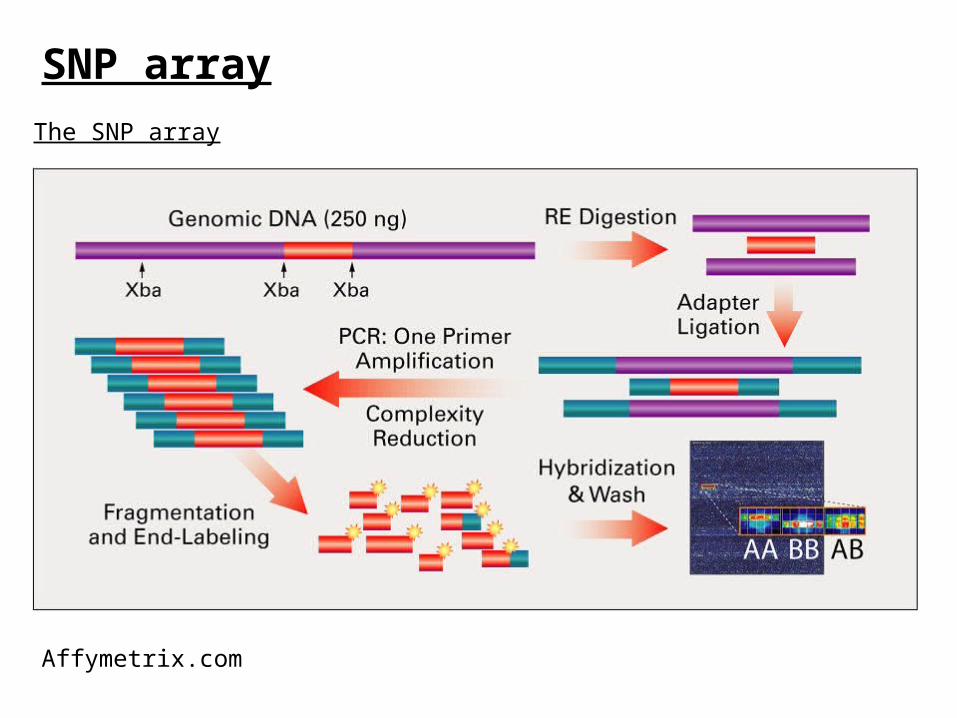
SNP arrayThe SNP array
Affymetrix.com
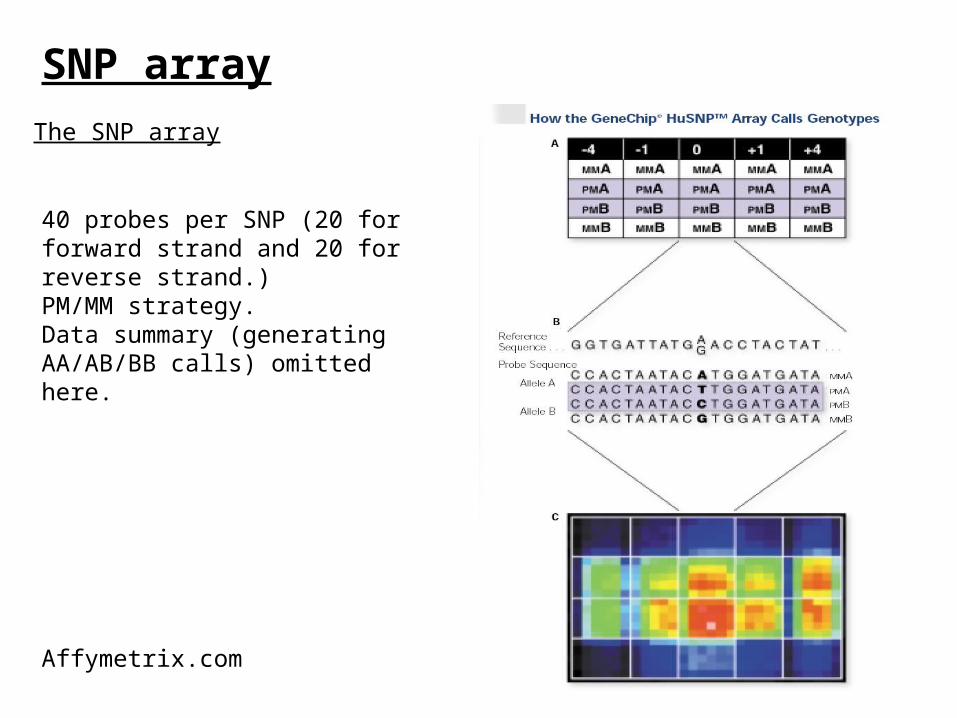
SNP arrayThe SNP array
Affymetrix.com
40 probes per SNP (20 for forward strand and 20 for reverse strand.)PM/MM strategy.Data summary (generating AA/AB/BB calls) omitted here.

SNP array
SNP array
Genotype calls
Association analysis
Linkage analysis
Loss of Heterozygosity
Signal strength Copy number abberation
CNA --- Background
Copy Number Aberration (CNA):
A form of chromosomal aberrationDeviation from the regular 2 copies for some
segments of the chromosomesOne of the key characteristics of cancer
CNA in cancer:
Reduce the copy number of tumor-suppressor genesIncrease the copy number of oncogenesPossibly related to metastasis
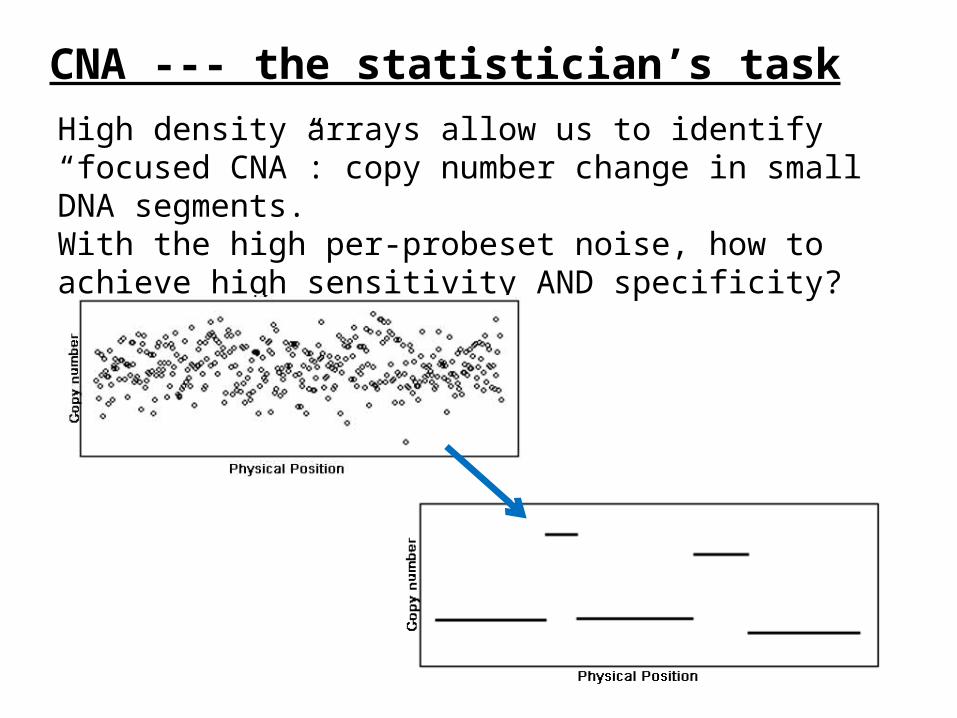
CNA --- the statistician’s taskHigh density arrays allow us to identify “focused CNA”: copy number change in small DNA segments.With the high per-probeset noise, how to achieve high sensitivity AND specificity?

CNA – maximizing sensitivity/specificity
Two approaches that complement each other:
Reducing noise at the single probeset level:
Based on dose-response (Huang et al., 2006) Based on sequence properties (Nannya et al., 2005)
Segmentation methods.
Smoothing; Hidden Markov Model-based methods; Circular Binary Segmentation … …

HMM data segmentation
Fridlyand et al. Journal of Multivariate Analysis, June 2004, V. 90, pp. 132-153
Amplified
Normal
Deleted
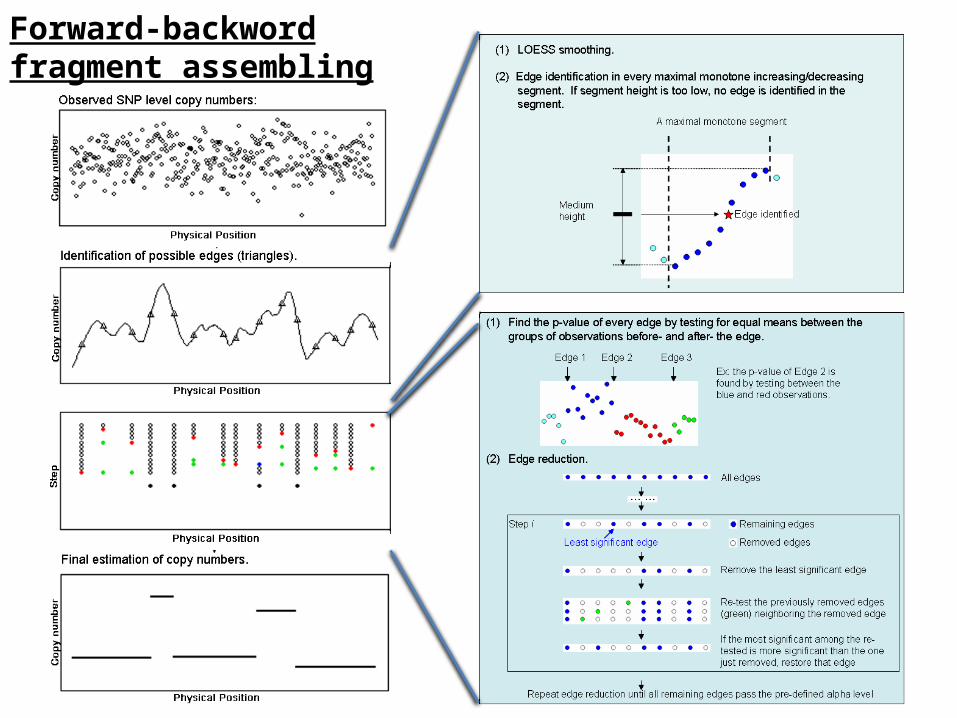
Forward-backword fragment assembling
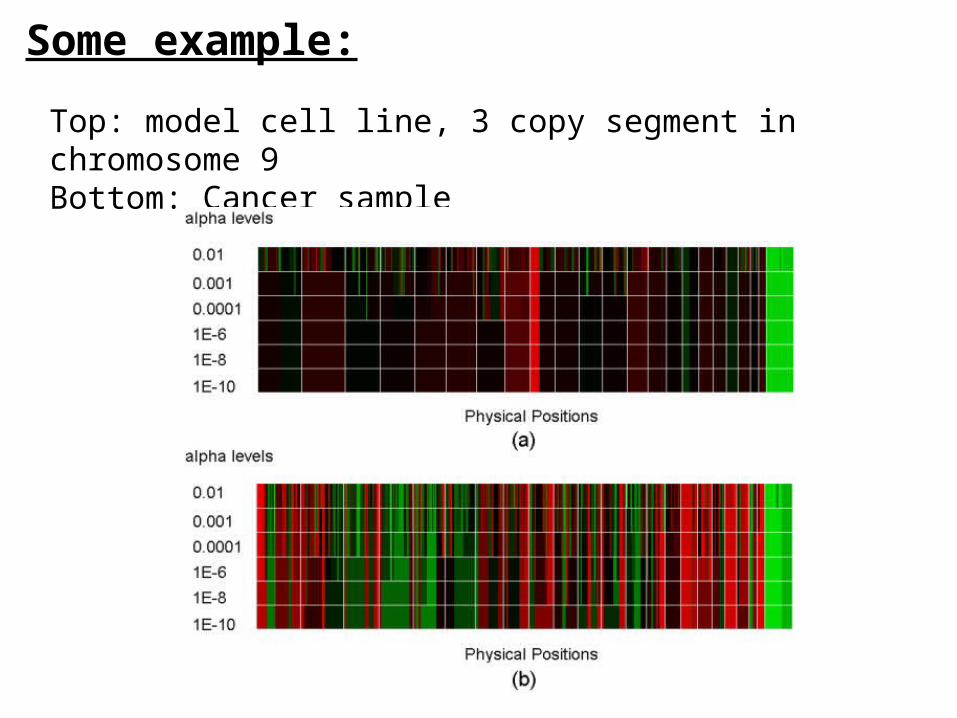
Some example:
Top: model cell line, 3 copy segment in chromosome 9Bottom: Cancer sample
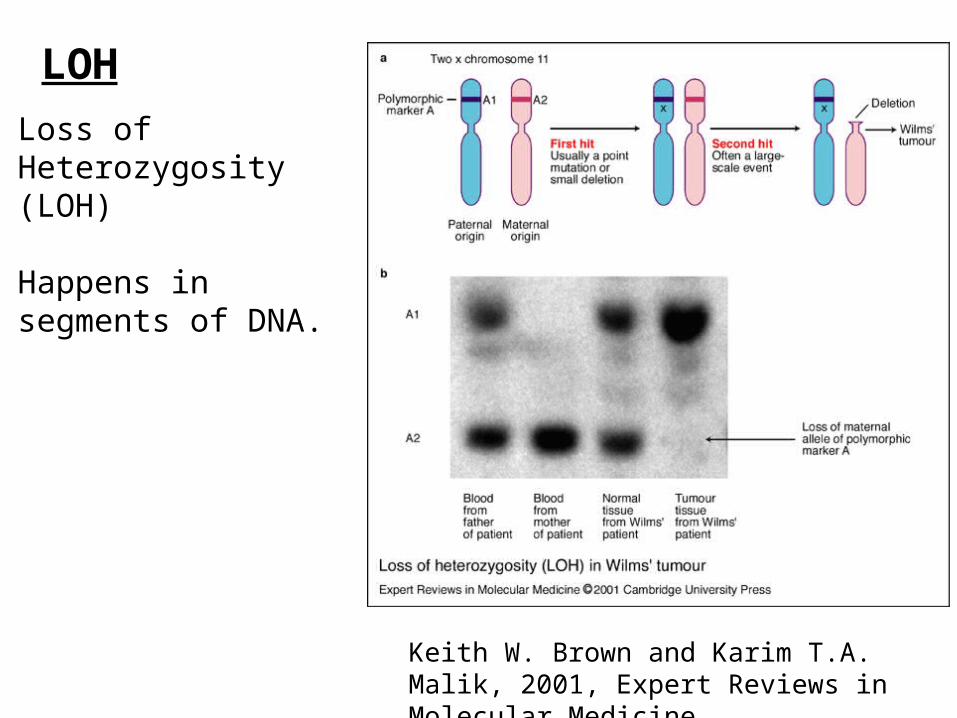
Keith W. Brown and Karim T.A. Malik, 2001, Expert Reviews in Molecular Medicine
LOHLoss of Heterozygosity (LOH)
Happens in segments of DNA.

Discov Med. 2011 Jul;12(62):25-32.
LOH
On SNP array, LOH will yield identical calls (AA or BB, rather than AB) for a number of consecutive SNPs.

GWAS
© Pasieka, Science Photo Libraryhttp://www.mpg.de/10680/Modern_psychiatry

Nature Genetics 41, 986 - 990 (2009)
GWAS
Genome-wide association study identifies variants in the ABO locus associated with susceptibility to pancreatic cancer

GWAS