gender differences in temperament: a...
TRANSCRIPT
Gender Differences in Temperament: A Meta-Analysis
Nicole M. Else-Quest, Janet Shibley Hyde, H. Hill Goldsmith, and Carol A. Van HulleUniversity of Wisconsin—Madison
The authors used meta-analytical techniques to estimate the magnitude of gender differences in meanlevel and variability of 35 dimensions and 3 factors of temperament in children ages 3 months to 13 years.Effortful control showed a large difference favoring girls and the dimensions within that factor (e.g.,inhibitory control: d � �0.41, perceptual sensitivity: d � �0.38) showed moderate gender differencesfavoring girls, consistent with boys’ greater incidence of externalizing disorders. Surgency showed adifference favoring boys, as did some of the dimensions within that factor (e.g., activity: d � 0.33,high-intensity pleasure: d � 0.30), consistent with boys’ greater involvement in active rough-and-tumbleplay. Negative affectivity showed negligible gender differences.
Keywords: gender differences, temperament, personality, meta-analysis
The question of gender differences in temperament is arguablyone of the most fundamental questions in gender differencesresearch in the areas of personality and social behavior. Temper-ament reflects biologically based emotional and behavioral con-sistencies that appear early in life and predict—often in conjunc-tion with other factors—patterns and outcomes in numerous otherdomains such as psychopathology and personality. Modern childtemperament theories have espoused various views about potentialgender differences in temperament, but the testing of these viewshas been inconclusive. Thus, the current study provides a quanti-tative review of the existing research on gender and temperament.
What Is Temperament?
In reviewing the literature on temperament, a primary challengelies in adopting a widely acceptable definition of the broad con-struct of temperament or of any of its component dimensions. Thehistory of the study of temperament and personality reveals severalthemes across various definitions, including a biological or con-stitutional basis, emphasis on longitudinal stability and cross-situational consistency, association with clinical risk, and multidi-mensional or multicategory nature (for an extensive review of thehistory of temperament research, see Strelau, 1998). Many modernscientific approaches to temperament are rooted in Allport’s
(1961) personality theory, which emphasized individual differ-ences in emotion:
Temperament refers to the characteristic phenomena of an individu-al’s nature, including his susceptibility to emotional stimulation, hiscustomary strength and speed of response, the quality of his prevailingmood, and all the peculiarities of fluctuation and intensity of mood,these being phenomena regarded as dependent on constitutionalmake-up, and therefore largely hereditary in origin. (p. 34)
Various modern temperament theories are grounded in clinicalpractice, psychometric approaches to individual differences,behavior-genetic findings, and psychophysiology (Campos, Bar-rett, Lamb, Goldsmith, & Sternberg, 1983). Despite the apparentvariability in their origins and methodological approaches, thetheories have common tenets (Goldsmith et al., 1987; Goldsmith &Rieser-Danner, 1986; Rothbart, Ahadi, & Evans, 2000; Shiner &Caspi, 2003). Most posit that temperament comprises severaldimensions of behavior, conceptualized as individual differencesappearing in infancy. Although methodological differences mayobscure the commonalities, these dimensions typically includeactivity, emotionality or emotional intensity, and approach orwithdrawal. The theories typically assert that these dimensions arerelatively stable across age, forming the basis for later personality.Theorists disagree, however, on the exact nature and number ofthese dimensions. Some emphasize emotional and regulatory be-haviors, whereas others emphasize the link to personality. Mostagree that temperamental traits have biological substrates and areheritable; there is also agreement that temperamental expression isinfluenced by environmental or contextual factors. Yet, opinionsregarding the specific roles of biological and environmental factorsare diverse.
Although our goal is not to provide an exhaustive review ofmodern approaches to childhood temperament, we outline belowthe three major theoretical and measurement traditions in theliterature. While other theoretical and measurement approaches totemperament exist, particularly some of European origin, thesethree have generated most of the research that allows an exami-nation of gender differences.
Nicole M. Else-Quest, Janet Shibley Hyde, H. Hill Goldsmith, and CarolA. Van Hulle, Department of Psychology, University of Wisconsin—Madison.
Carol A. Van Hulle is now at the Department of Health Sciences,University of Chicago.
This research was supported by the Graduate School and the Departmentof Psychology at the University of Wisconsin—Madison. Special thanks toColleen Moore for comments on an earlier version of this article. We thankLiza Hirsch, Eric Ritland, and Becky Haasch for their help photocopyingand coding articles. We also thank the many authors who provided data forthe meta-analysis.
Correspondence concerning this article should be addressed to NicoleM. Else-Quest, Department of Psychology, University of Wisconsin, 1202West Johnson Street, Madison, WI 53706. E-mail: [email protected]
Psychological Bulletin Copyright 2006 by the American Psychological Association2006, Vol. 132, No. 1, 33–72 0033-2909/06/$12.00 DOI: 10.1037/0033-2909.132.1.33
33

Behavioral Style: The Approach of Thomas and Chess(1977, 1980)
Contemporary American temperament research emerged withThomas and Chess’s (1977, 1980) landmark New York Longitu-dinal Study monographs (NYLS; see also, Thomas, Chess, Birch,Hertzig, & Korn, 1963). Their work specified a nine-dimensionmodel of temperament that conceptualized the how—rather thanthe what (i.e., ability and content) or why (i.e., motivation)—ofbehavior, known also as behavioral style. Nine temperament di-mensions emerged from inductive content analysis of interviewswith the parents of 22 children. The dimensions included activitylevel (i.e., motor activity), rhythmicity (i.e., predictability or reg-ularity of behavior), approach or withdrawal (i.e., response tonovelty), adaptability (i.e., response to alterations in environment),threshold of responsiveness (i.e., intensity of stimulation necessaryto evoke a reaction), intensity of reaction (i.e., the energy level ofa response), quality of mood (i.e., amount of pleasant or positivemood), distractibility (i.e., effectiveness of environmental stimu-lation in altering the child’s direction of behavior), and attentionspan and persistence (i.e., length of time and maintenance ofactivity pursued by the child). In addition, Thomas and Chess(1977) emphasized an interactionist approach that was consistentwith contemporary psychological theory, arguing, “Temperamentis influenced by environmental factors in its expression and evenin its nature as development proceeds” (p. 9). The NYLS alsointroduced the construct of difficult temperament, a cluster ofbehavioral styles that is difficult for a caregiver to manage and isreported to put children at risk for behavior problems. Thomas andChess’s methods categorized children as difficult, easy, or slow-to-warm-up. Bates (1980) expanded on the difficulty construct,which he conceptualized as comprising irregular biological func-tioning, poor adaptability, high emotionality, high fearfulness, andhigh frequency of fussing and crying.
Following in the Thomas and Chess tradition, other researchersdeveloped validated measurement scales, including the InfantTemperament Questionnaire (Carey, 1970; Revised Infant Tem-perament Questionnaire, Carey & McDevitt, 1978), the BehavioralStyle Questionnaire (McDevitt & Carey, 1978), the Infant Char-acteristics Questionnaire (Bates, Freeland, & Lounsbury, 1979),the Toddler Temperament Scale (Fullard, McDevitt, & Carey,1984), the Middle Childhood Temperament Questionnaire (Heg-vik, McDevitt, & Carey, 1982), the Temperament AssessmentBattery (Presley & Martin, 1994), and the Dimensions of Temper-ament Survey (Lerner, Palermo, Spiro, & Nesselroade, 1982;Revised Dimensions of Temperament Survey, Windle & Lerner,1986).
In spite of the ubiquitous presence of Thomas and Chess’s(1977) model in past and present temperament research, the be-havioral style approach has several limitations. Thomas and Chessdescribed their approach as an attempt to distinguish the how or thestylistic components of behavior from the why or motivationalaspects of behavior and the what or behavioral abilities. Yet, theapproach has had limited success in methodologically distinguish-ing these components (Shiner & Caspi, 2003). In addition, factoranalytic work suggests that a nine-dimensional model is not sup-ported by the behavioral style measurement tools (Presley &Martin, 1994). Instead, a four-dimensional model—including irri-table distress, social inhibition, activity, and attention—tends to
emerge from the research. The model also specifies that mood is acontinuum from negative to positive, despite evidence that positiveand negative mood are independent and distinct constructs (Roth-bart, 1981). This approach reflects Thomas and Chess’s lack ofemphasis on the emotional components of temperament, whichappear to be more substantial than the NYLS research indicated.
The Criterial Approach of Buss and Plomin (1975)
Buss and Plomin (1975) modified Thomas and Chess’s modelby framing temperament as a developmental precursor to adultpersonality. They described five inclusion criteria for temperamen-tal traits, specifying that traits be heritable, relatively stable duringchildhood, retained into adulthood, evolutionarily adaptive, andpresent in our phylogenetic relatives. Four broad temperamenttraits or dimensions emerged from these criteria, including emo-tionality (i.e., intensity of emotion), activity (i.e., quantity of motoractivity), sociability (i.e., closeness to others), and impulsivity(i.e., quickness vs. inhibition of response). These traits were mea-sured in Buss and Plomin’s (1975) Emotionality and SociabilityInventory and the Colorado Childhood Temperament Inventory(Rowe & Plomin, 1977), which also included the dimensions ofattention span and persistence, reaction to food, and soothability.
Recent research is consistent with Buss and Plomin’s proposalthat temperament is the precursor to adult personality. Rothbart etal.’s (2000) factor analytic work on temperament and personalityindicates moderate correlations between three temperament factorsand three of the Big Five personality factors. Specifically, negativeaffectivity (including fear, discomfort, and frustration) is linked toNeuroticism, effortful control (including attention focusing andshifting) is linked to Conscientiousness, and surgency (includinghigh-intensity pleasure, activity, and sociability) is linked toExtraversion.
The Psychobiological Approach of Rothbart (1981)
The third tradition purposefully includes motivation—the whyof behavior—in the temperament construct. The psychobiologicalapproach defines temperament as constitutionally based individualdifferences in reactivity and self-regulation (Rothbart & Derry-berry, 1981). In this definition, constitutional refers to the rela-tively enduring biological makeup of the individual, although it isinfluenced over the life span by heredity, maturation, and experi-ence, reactivity refers to excitability and responsivity, and self-regulation refers to the modulation of reactivity. This approachdiffers from the behavioral style approach in that temperamentrefers not to an isolated individual characteristic that is evident inall behaviors but rather to the context-specific expression of adisposition. Although this approach is psychobiological in concep-tualization, most measurement associated with the approach in-volves questionnaires and behavioral observations rather than bi-ological measures. Some of the dimensions assessed in thepsychobiological approach include falling reactivity or soothabil-ity, fear or distress to novelty, high- and low-intensity pleasure(i.e., amount of pleasure derived from high- and low-intensitystimuli, respectively), attention focusing and (purposeful) shifting,and perceptual sensitivity (i.e., awareness of subtle changes in theenvironment).
34 ELSE-QUEST, HYDE, GOLDSMITH, AND VAN HULLE

This approach began with Rothbart’s (1981) study of tempera-ment in infants, from which her Infant Behavior Questionnaire(IBQ) was developed. Later, she developed the Child BehaviorQuestionnaire (CBQ; Rothbart, Ahadi, & Hershey, 1994). Usingsimilar approaches, although with more emphasis on emotion,Goldsmith (1996) developed the Toddler Behavior AssessmentQuestionnaire to study temperament in toddlers.
Dimensions in the Context of Factors
Although the three dominant theories have conceptual similar-ities, attempts to demonstrate convergence of the measures asso-ciated with them have had limited success. Goldsmith, Rieser-Danner, and Briggs (1991) analyzed the convergent validity ofrelevant temperament questionnaires and found that correlationseven between measures of “congruent” traits from different ques-tionnaires lay in the range of .40–.70. This modest evidence ofconvergent validity is not likely a simple reflection of the poorpsychometric quality of the measurement tools. Rather, it probablyreflects to an important degree the different boundaries of con-structs in the different approaches (e.g., overlap among dimensionsof distractibility, attention shifting, and soothability), the prefer-ence for narrower versus broader constructs (e.g., assessment ofglobal negative mood vs. assessment of specific negative moodssuch as fear, anger, and sadness), as well as other similar issues.For the purpose of conducting a meta-analysis, developing a singlecomprehensive typology of temperament based on the existingresearch would be an ideal first step. Yet, such an effort would alsoyield several broad and imprecise constructs because of the meth-odological differences. Thus, we analyze dimensions within thethree dominant methodological approaches individually but inter-pret them jointly. We believe this is the best approach to meta-analysis, given the state of the temperament literature.
This meta-analysis frames the many dimensions of temperamentin three major factors: effortful control, negative affectivity, andsurgency. A review by Shiner and Caspi (2003) proposed a tem-perament and personality typology that helps to bridge the tem-perament and personality literatures. They argued that there arefour higher order personality constructs in children—extraversion,neuroticism, conscientiousness, and agreeableness—and that threeof these (all but agreeableness) map onto major temperamentfactors. Similarly, factor analytic work by Ahadi et al. (1993) andRothbart et al. (2000) supports a three-factor model of tempera-ment that includes effortful control, negative affectivity, and sur-gency. Effortful control, which is linked to the Big Five person-ality trait of Conscientiousness, includes dimensions such asattention focusing and purposeful shifting, perceptual sensitivity,persistence, and inhibitory control. It partially reflects lower orderpersonality traits such as attention, inhibitory control, and achieve-ment motivation. Negative affectivity is linked to the Big Five traitof Neuroticism and includes dimensions such as emotionality,sadness, difficultness, and distress to limits. It partially reflectslower order personality traits such as anxious distress and irritabledistress. Surgency is linked to the Big Five trait of Extraversionand includes dimensions such as activity, approach, sociability,and shyness (negatively loaded). It partially reflects lower orderpersonality traits of social inhibition, sociability, dominance, andenergy level. It is important to note that although there are linksbetween childhood temperament and adult personality, these are
theoretically distinct constructs that have not generated an inte-grated literature for our review. The overlap between personalityand temperament constructs is not sufficient to warrant collapsingthem into one construct. Thus, it would be inappropriate to con-sider personality measures of, for instance, anxious distress to besimply another way to measure the temperament dimension ofdistress to novelty. Such an approach would likely do more to blurthe boundaries between constructs than to create a comprehensiveview of both literatures. Instead, the current study aims to betterunderstand the body of literature that self-identifies as tempera-ment research.
Past Research on Gender Differences in Temperamentand Behavior
Narrative reviews reveal little evidence for gender differences intemperament in infancy, with some exceptions (e.g., Bates, 1987;Maccoby & Jacklin, 1974; Rothbart, 1986). In their landmarkwork, Maccoby and Jacklin (1974) used a narrative review todescribe the literature on gender differences in numerous behav-iors and attributes. They found that boys are more emotionallyvolatile than girls and that girls’ negative emotional responsesdecline more quickly with age. Regarding activity level, theyfound that boys tend to be more active than girls, and this differ-ence emerges after the first birthday and increases with age. Thisclaim was eventually substantiated in a meta-analysis of activity(Eaton & Enns, 1986), who estimated that the gender difference inactivity was moderate in magnitude (d � 0.49) and was associatedwith age such that the gender difference was smallest in infants (d� 0.29) and greatest in older children (d � 0.64). On the basis ofEaton and Enns’s (1986) findings, we expected a similar pattern inthe current review.
Smiling is often viewed as an indicator of positive affect (Roth-bart, 1981). Gender differences in smiling behavior have beenreported: Women smile more than men (d � 0.42; Hall & Hal-berstadt, 1986). A more recent meta-analysis replicated this find-ing in adolescents and adults (d � 0.41; LaFrance, Hecht, &Paluck, 2003). This gender difference appears to be situationspecific, such that when men and women were both observed incaregiving roles, the gender difference was smaller in magnitude(d � 0.26). If participants had a clear awareness that they werebeing observed, the gender difference was larger (d � 0.46) thanif they were not aware of being observed (d � 0.19). The magni-tude of the gender difference also depended on culture and age. Itis interesting that the earlier meta-analysis concluded that thegender difference in smiling is absent in children, suggesting thatthe difference develops in adolescence (Hall & Halberstadt, 1986).Although smiling can be an ambiguous social display, it is fre-quently an indicator of positive affect. The well-documented gen-der difference in depression (Nolen-Hoeksema, 1990; Twenge &Nolen-Hoeksema, 2002) that emerges in adolescence also suggeststhat insofar as childhood temperament is linked to later depression,boys may show more positive affect and/or less negative affectthan girls (L. A. Clark, Watson, & Mineka, 1994). Prior researchsuggests that we might find gender differences in smiling orpositive mood in the current meta-analysis but that the differenceswill be evident only in older children.
35GENDER DIFFERENCES IN TEMPERAMENT
Moderator Variables
Gender differences or similarities in temperament may be ac-centuated or attenuated by moderating factors such as the age ofthe child, the source of the temperament assessment (e.g., motheror teacher report), cultural and socioeconomic contexts, andwhether the children are drawn from a special population (e.g.,children at risk for behavioral disorders).
Age of Child
Narrative reviews reveal little evidence for gender differences intemperament in infancy (e.g., Bates, 1987; Maccoby & Jacklin,1974; Rothbart, 1986). One study indicated that in late adoles-cence, girls show more emotional reactivity than do boys (Bradley,Codispoti, Sabatinelli, & Lang, 2001). Maccoby and Jacklin(1974) noted that up to 18 months, boys and girls are ratedsimilarly in emotional upsets and frustration reactions. After 18months of age, however, boys show more negative emotionaloutbursts (Maccoby & Jacklin, 1974). A similar male increase isseen for activity level (Eaton & Enns, 1986).
The expression of temperament is subject to social and envi-ronmental influences. Socialization and maturation can influencethe developmental pattern of temperament in boys and girls. Giventhe evidence for differential socialization of boys and girls (Lytton& Romney, 1991; Maccoby, Snow, & Jacklin, 1984) and socialpressures to conform to gender roles, one might expect that genderdifferences in temperament would be largest in older childrenbecause older children will have been exposed to more cumulativesocialization than younger children. Alternatively, because biolog-ical factors can exert their influence at any point in development(Turkewitz & Devenny, 1993), age-moderated gender differencesare not necessarily due to socialization or environmental factors.
Temperament develops. Although temperament shows consid-erable temporal stability, its behavioral manifestation and themethods used to measure it must develop accordingly. For exam-ple, attention focusing is obviously greater for 7-year-olds than for3-month-olds. Such developmental differences must be accountedfor when designing measurement instruments, to account for bothchanging norms and changing behaviors. Moreover, there may bedifferent developmental patterns of temperament for boys andgirls. That is, gender differences may emerge or diminish over thecourse of temperament development. Differences may be minimalin infancy but increase through adolescence, or they may notemerge until children enter school and interact in peer groups.Thus, age of child was tested as a moderator of the magnitude ofgender differences in temperament.
Source of Temperament Assessment
To assess temperament, observational or behavioral measures aswell as parental, teacher, or self-reports of the child’s behavior areused. Although some researchers (e.g., Seifer, 2003) argue thatparental bias in reporting on child temperament is systematic,parents have an unrivaled amount of experience with their childrenand are potentially in the best position to report on temperament.Other researchers have added that the apparent validity problemswith parental report can be due to methodological flaws, such aspoorly written items or imperfect survey administration (Gold-
smith & Hewitt, 2003). In addition, parental reports of childbehavior show only modest correlations with teacher reports(Achenbach, McConaughy, & Howell, 1987). For these reasons,parental reports of temperament have been consistently challengedbut also consistently relied upon.
Because parents are the primary source of gender role social-ization in early childhood (Maccoby & Jacklin, 1974), their per-ceptions of their children’s behavior and temperament may bebiased by their gender role stereotypes. Yet, stereotyping tends toaffect judgment less as knowledge about others increases (Allport,1954; Weber & Crocker, 1983), so parents may be less prone tostereotyping than are teachers. Teachers are more likely to seechildren interacting in same-gender peer groups, where genderdifferences tend to be magnified (Maccoby, 1990). The source oftemperament assessment may moderate perceived gender differ-ences in temperament such that parental reports may be less sextyped than teacher ratings. Thus, source of temperament rating—parent report versus teacher or child report or laboratory observa-tion—was investigated as a possible moderator of gender differ-ences in temperament in the current meta-analysis.
Cultural and Socioeconomic Context
As with age, the cultural and socioeconomic context in whichchildren develop can shape the development of temperamentalcharacteristics (Kohnstamm, 1989). Several cross-cultural studieshave demonstrated temperament differences between children inEastern and Western cultures (e.g., Ahadi et al., 1993; Windle,Iwawaki, & Lerner, 1988). The extent to which a culture values oraccepts certain behaviors may drive the reinforcement and pun-ishment of behaviors, especially in the case of gender role norms.Socioeconomic contexts may also affect the development of tem-perament via risk for negative or stressful events or socializationexperiences. Thus, the cultural and socioeconomic contexts (e.g.,collectivistic vs. individualistic cultures, extreme poverty) of astudy’s sample were coded as potential moderators of genderdifferences in temperament.
Clinical or Community Samples
Children who are a part of a clinical population—for example,those with chronic medical or psychiatric conditions—are likely tohave more stressful and negative experiences than relativelyhealthy or typical children. In addition, biological factors related totemperament might be different in clinical populations. For thesereasons, gender differences in temperament within clinical popu-lations may be different from those in community samples. Thus,the nature of the sample (clinical or community) was coded as amoderator of gender differences in temperament.
Mean Differences and Variability
Although meta-analysis typically estimates mean differencesbetween two groups, the current study also estimated genderdifferences in variability. The “greater male variability” hypothesishas been suggested for gender differences in some behaviors (e.g.,Feingold, 1992). Yet, some studies indicate that although girlsexperience greater negative affect than boys, they also experiencegreater positive affect and an overall greater emotional intensity
36 ELSE-QUEST, HYDE, GOLDSMITH, AND VAN HULLE

(Grossman & Wood, 1993). This may reflect greater variability ingirls’ emotional experiences. Thus, the “greater female variability”hypothesis also seems appropriate for some dimensions oftemperament.
Goals of the Current Study
Do boys and girls differ in the mean levels of their temperamenttraits? If so, what is the magnitude of these differences? Whatvariables moderate these differences? Do boys and girls differ intheir variability in temperament? We used meta-analytical tech-niques to answer these questions.
Our first goal was to determine the pooled mean effect size ofgender differences in multiple dimensions of temperament. Next,the homogeneity of the effect sizes was computed to determine theneed for moderator analyses. Moderator analyses were then con-ducted to determine whether gender differences in temperamentwere moderated by variables such as age of child or source oftemperament information. Fourth, multiple regression analysis es-timated the relative influence of the moderators. Finally, meanvariance ratios between boys and girls on temperamental dimen-sions were computed to examine variability of temperament.
Method
Sample of Studies
Many databases are available for literature searches, including Psyc-INFO, Web of Science, and Medline. We chose to use PsycINFO becauseit fit the needs of the current study, insofar as it includes the mostcomprehensive coverage of psychological, psychiatric, and educationaljournals; unpublished dissertations; and edited books. Also, it allows usersto limit the search to samples of specific age groups and humans. Weconducted a computerized literature search of the term temperament, butwe did not include the term gender because it would have biased the searchtoward studies that reported significant gender differences. We did notsearch for specific temperament traits because most of those terms aresynonymous with other constructs that would not be appropriate for use inthis study. For example, negative affect as a temperamental trait is not thesame as negative affect as a mood state, although articles using eithermeaning would be found in a search for negative affect. In addition,because the goal of the current meta-analysis was to examine genderdifferences in the construct known in the psychological literature as tem-perament, only studies claiming to study temperament would be appropri-ate for use in this study. Search limits restricted the results to articlespublished in English between 1960 and 2002 and identified as empirical orlongitudinal studies. The search was also limited to articles with humansamples identified as neonatal, infancy, childhood, preschool age, or schoolage. The search resulted in 1,641 abstracts.
Abstracts were screened and included if they met the following criteria:(a) The study was empirical, (b) the sample included a total of 10 or moreparticipants, (c) the study measured temperamental traits or dimensions, (d)the sample included both boys and girls, and (e) the participants in thesample were between the ages of 3 months and 13 years. Abstracts did notalways provide information pertaining to these inclusion criteria. In suchcases, the articles were included to be reviewed in the next stage of thestudy.
Upon screening of the 1,641 citations from the original search, 1,204either met the aforementioned inclusion criteria or could not be excludedbased on the content of the abstract. These articles were photocopied.Dissertations were ordered via interlibrary loan and reviewed at the receiv-ing library. Following this second stage in the screening process, 260articles provided relevant and potentially eligible information for coding.
A typical study. For readers unfamiliar with the research area, weprovide sketches of two typical study designs. Kochanska, Murray, andCoy (1997) analyzed the role of inhibitory control in the development ofconscience in children. Data came from a longitudinal study on consciencedevelopment, in which a largely rural Iowa sample of 83 children and theirmothers were interviewed and observed. The children were assessed fourtimes in early childhood. Measures included a temperament questionnaire,the CBQ (Rothbart et al., 1994), as well as observational assessments of thenontemperamental constructs of moral conduct, moral cognition, and moralself. In another study, Halpern and Garcia-Coll (2000) compared 39full-term, small-for-gestational age infants and 30 full-term, average-for-gestational age infants on temperament at 4, 8, and 12 months of age. Theinfants were part of a longitudinal study of the developmental effects of afeeding intervention that took place during the first month of life. Mothersof the infants completed the Infant Characteristics Questionnaire (Bates etal., 1979) at each assessment.
Coding the Studies
If articles were deemed eligible but did not provide adequate informationfor coding (e.g., statistics necessary for effect size computation wereomitted) and were not more than 7 years old, we contacted the authors forthe information through e-mail. E-mail addresses were obtained from thearticle itself, from the Web directory of the authors’ academic institution,or from a Google search. We contacted first authors regarding 109 articles.Of those, 36 authors could not be reached, 44 did not respond to ourrequests, and 29 provided usable data. In addition, 3 authors provided datafrom unpublished studies.
Articles were excluded for the following reasons: (a) if adequate infor-mation for effect size computation or estimation was not provided and thestudy was older than 7 years, (b) if the articles or dissertations could not beobtained via interlibrary loan, (c) if the articles used measures or dimen-sions inconsistent with the three methodological approaches discussedearlier, and (d) if the studies sampled children on the basis of standing ontemperamental traits (e.g., the article only studied children who werecategorized as difficult).
To ensure independence of observations, we did not use any effect morethan once in the aggregation of effect sizes; effects from longitudinalstudies that reported data for one sample at multiple ages were includedonly once. For such studies, effects were chosen on the basis of theirpotential moderator variables to ensure adequate cases for moderatoranalysis. For example, if mother reports and teacher reports were bothprovided for a given sample and dimension, the teacher reports were usedbecause they were less frequently available, and the mother reports wereexcluded.
In sum, we obtained data from 205 studies, from which 1,758 effect sizeswere computed or estimated. Of those, 16 studies and 567 effect sizes weredropped because they reported results for dimensions and samples that hadalready been included. A total of 189 studies provided usable effect sizesincluded in the current meta-analysis. Of those, 136 were published studies,48 were unpublished dissertations, and 5 were unpublished data setsprovided by authors. See References for the list of studies used in theanalyses. See Tables 1, 2, and 3 for a listing of all effect sizes andaccompanying study information for the factors of effortful control, neg-ative affectivity, and surgency, respectively.
For each study, we coded the following information: (a) all statisticsregarding gender differences in temperament dimensions, including means,standard deviations, correlations, t tests, and F tests; (b) number of maleand female participants; (c) mean age of participants, or median age if onlyrange was reported; (d) temperament inventory or assessment used; (e)source of temperament information (e.g., mother, father, teacher, self, orlab observation); (f) population studied (e.g., community sample or specialpopulation); (g) socioeconomic status of sample (e.g., at least 85% lower,
(text continues on page 49)
37GENDER DIFFERENCES IN TEMPERAMENT

Table 1Effect Sizes and Moderator Variable Codes for the Factor of Effortful Control, Grouped by Framework
Study Dimension d VR NM NF Age Source Scale
Behavioral style
Anolik (1996) Distractibility �0.16 1.12 126 127 1 1 1Arbiter et al. (1999) Distractibility �0.36 0.61 19 17 2 1 17Arbiter et al. (1999) Distractibility �0.82 1.03 16 16 2 1 17Ballantine & Klein (1990) Distractibility �0.38 1.17 54 54 3 3 5Barclay (1987) Distractibility 0.21 0.96 23 23 3 3 14Barclay (1987) Distractibility 0.41 1.33 41 42 3 3 14Bournaki (1997) Distractibility 0.00a 43 51 3 1 11Cardell & Parmar (1988) Distractibility 0.29 0.65 54 26 3 3 14Cardell & Parmar (1988) Distractibility �0.13 0.74 23 12 3 3 14Carlson (1998) Distractibility 0.09 1.27 128 105 1 1 10DeVries & Sameroff (1984) Distractibility 0.00a 93 85 1 1 10DiBiase (1991) Distractibility 0.00a 25 18 1 1 10Dixon & Smith (2000) Distractibility 0.00a 22 20 2 1 17Erwin (2001) Distractibility 0.41 1.4 31 32 3 1 13Field et al. (1987) Distractibility 0.00a 13 13 1 1 10Fullard et al. (1984) Distractibility 0.16 161 148 1 1 17Gibson et al. (2000) Distractibility 0.41 0.96 31 30 1 1 18Gibson et al. (2000) Distractibility 0.00 1.37 34 31 1 1 18Gunn & Berry (1985) Distractibility 0.00a 21 16 2 1 17Hayes et al. (2001) Distractibility 0.00a 34 33 2 3 1Healy (1987) Distractibility 0.00a 36 40 2 1 17Hollis (1995) Distractibility 0.22 1.07 83 107 3 3 14Houck (1999) Distractibility �0.04 0.8 41 84 1 1 10Houldin (1988) Distractibility 0.00a 16 24 2 1 16Klein (1992) Distractibility 0.78 1.03 30 25 4 5 5Klein (1992) Distractibility 0.00 1.06 41 35 3 5 5Korner et al. (1985) Distractibility 0.00a 23 27 3 1 1Maziade, Boudreault, et al. (1984) Distractibility �0.33 0.76 176 159 1 1 10Maziade, Boudreault, et al. (1984) Distractibility 0.03 1.07 357 362 1 1 10Maziade, Cote, et al. (1984) Distractibility �0.16 0.89 318 321 3 1 12McClowry (1989) Distractibility 0.00a 43 33 3 1 11Melhuish et al. (1991) Distractibility 0.00a 115 115 1 1 10Mevarech (1985) Distractibility 0.00a 94 97 3 3 16K. J. Miller (2002) Distractibility 0.44 1.4 30 33 2 3 13M. Miller (2000) Distractibility �0.12 1.04 105 109 2 1 14Neu (1997) Distractibility 0.00a 54 30 3 1 1Neu (1997) Distractibility 0.00a 10 16 3 1 11Ottaviano et al. (1993) Distractibility 0.00a 193 207 3 1 18Ottaviano et al. (1997) Distractibility 0.63 1.12 186 150 3 3 16Paguio & Hollet (1991) Distractibility �0.70 0.97 15 23 2 1 14Pierrehumbert et al. (2000) Distractibility �0.79 1.25 19 20 3 1 12Porwancher (1991) Distractibility �0.20 2.25 60 59 2 1 12Puentes-Neuman (2000) Distractibility 0.09 1.36 44 44 2 1 17Sadeh et al. (1994) Distractibility 0.00a 19 16 2 1 16Sadeh et al. (1994) Distractibility 0.00a 37 26 2 1 16Sanson et al. (1985) Distractibility 0.07 1 1276 1164 1 1 10Schoen & Nagle (1994) Distractibility 0.44 1.15 61 91 2 3 14Schoen (1990) Distractibility 0.44 1.14 61 91 2 3 14Schor (1985) Distractibility 0.00a 58 21 3 1 1Sull (1995) Distractibility �0.28 1.11 38 51 2 1 1Von Bargen (1987) Distractibility �0.12 50 41 2 1 1Weissbluth (1984) Distractibility 0.00a 26 24 2 1 1Wertlieb et al. (1987) Distractibility 0.00a 79 79 3 1 11Wertlieb et al. (1987) Distractibility 0.00a 79 79 3 1 11Wertlieb et al. (1988) Distractibility 0.00a 73 67 3 1 11Yolton (1993) Distractibility 0.26 0.64 20 18 2 4 17Anolik (1996) Persistence �0.26 0.82 126 127 1 1 1Arbiter et al. (1999) Persistence �0.10 0.5 16 16 2 1 17Arbiter et al. (1999) Persistence �0.60 0.59 19 17 2 1 17Ballantine & Klein (1990) Persistence �0.30 1.31 54 54 3 3 5Ballantine & Klein (1990) Persistence 0.32 1.72 54 54 3 3 5Barclay (1987) Persistence �0.32 1.74 23 23 3 3 14Barclay (1987) Persistence �0.41 1.86 41 42 3 3 14Barron (1996) Persistence �0.26 19 19 2 1 5Cardell & Parmar (1988) Persistence 0.01 0.6 23 12 3 3 14
38 ELSE-QUEST, HYDE, GOLDSMITH, AND VAN HULLE
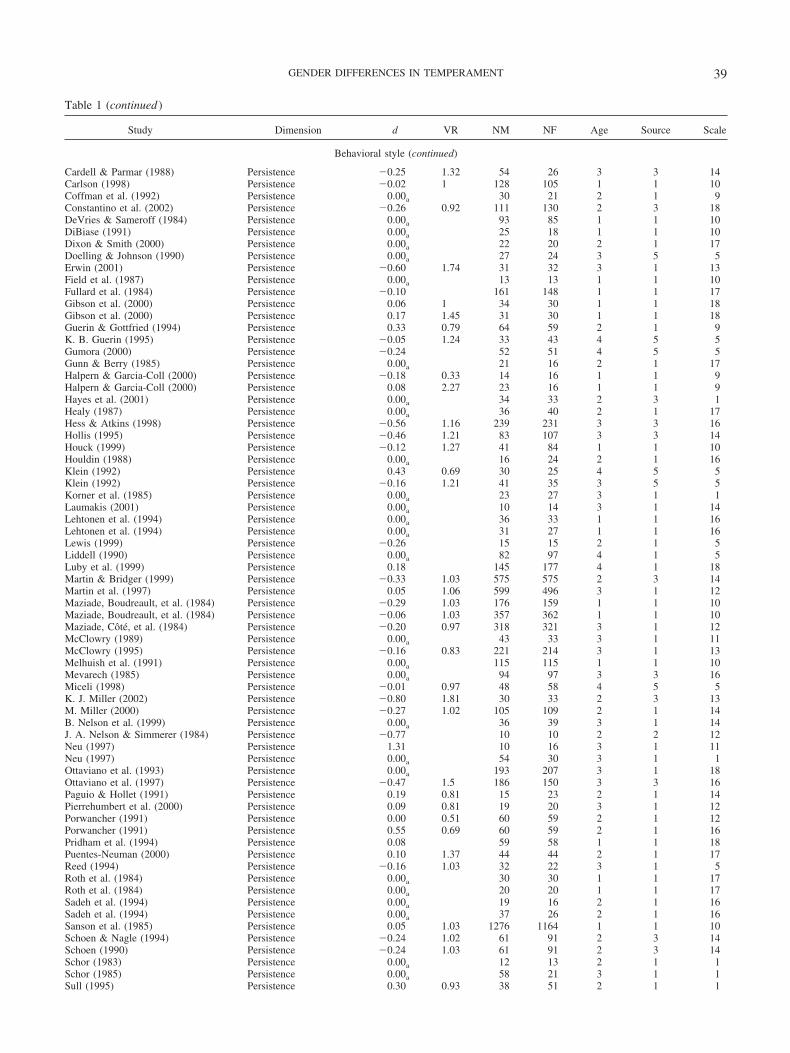
Table 1 (continued )
Study Dimension d VR NM NF Age Source Scale
Behavioral style (continued)
Cardell & Parmar (1988) Persistence �0.25 1.32 54 26 3 3 14Carlson (1998) Persistence �0.02 1 128 105 1 1 10Coffman et al. (1992) Persistence 0.00a 30 21 2 1 9Constantino et al. (2002) Persistence �0.26 0.92 111 130 2 3 18DeVries & Sameroff (1984) Persistence 0.00a 93 85 1 1 10DiBiase (1991) Persistence 0.00a 25 18 1 1 10Dixon & Smith (2000) Persistence 0.00a 22 20 2 1 17Doelling & Johnson (1990) Persistence 0.00a 27 24 3 5 5Erwin (2001) Persistence �0.60 1.74 31 32 3 1 13Field et al. (1987) Persistence 0.00a 13 13 1 1 10Fullard et al. (1984) Persistence �0.10 161 148 1 1 17Gibson et al. (2000) Persistence 0.06 1 34 30 1 1 18Gibson et al. (2000) Persistence 0.17 1.45 31 30 1 1 18Guerin & Gottfried (1994) Persistence 0.33 0.79 64 59 2 1 9K. B. Guerin (1995) Persistence �0.05 1.24 33 43 4 5 5Gumora (2000) Persistence �0.24 52 51 4 5 5Gunn & Berry (1985) Persistence 0.00a 21 16 2 1 17Halpern & Garcia-Coll (2000) Persistence �0.18 0.33 14 16 1 1 9Halpern & Garcia-Coll (2000) Persistence 0.08 2.27 23 16 1 1 9Hayes et al. (2001) Persistence 0.00a 34 33 2 3 1Healy (1987) Persistence 0.00a 36 40 2 1 17Hess & Atkins (1998) Persistence �0.56 1.16 239 231 3 3 16Hollis (1995) Persistence �0.46 1.21 83 107 3 3 14Houck (1999) Persistence �0.12 1.27 41 84 1 1 10Houldin (1988) Persistence 0.00a 16 24 2 1 16Klein (1992) Persistence 0.43 0.69 30 25 4 5 5Klein (1992) Persistence �0.16 1.21 41 35 3 5 5Korner et al. (1985) Persistence 0.00a 23 27 3 1 1Laumakis (2001) Persistence 0.00a 10 14 3 1 14Lehtonen et al. (1994) Persistence 0.00a 36 33 1 1 16Lehtonen et al. (1994) Persistence 0.00a 31 27 1 1 16Lewis (1999) Persistence �0.26 15 15 2 1 5Liddell (1990) Persistence 0.00a 82 97 4 1 5Luby et al. (1999) Persistence 0.18 145 177 4 1 18Martin & Bridger (1999) Persistence �0.33 1.03 575 575 2 3 14Martin et al. (1997) Persistence 0.05 1.06 599 496 3 1 12Maziade, Boudreault, et al. (1984) Persistence �0.29 1.03 176 159 1 1 10Maziade, Boudreault, et al. (1984) Persistence �0.06 1.03 357 362 1 1 10Maziade, Cote, et al. (1984) Persistence �0.20 0.97 318 321 3 1 12McClowry (1989) Persistence 0.00a 43 33 3 1 11McClowry (1995) Persistence �0.16 0.83 221 214 3 1 13Melhuish et al. (1991) Persistence 0.00a 115 115 1 1 10Mevarech (1985) Persistence 0.00a 94 97 3 3 16Miceli (1998) Persistence �0.01 0.97 48 58 4 5 5K. J. Miller (2002) Persistence �0.80 1.81 30 33 2 3 13M. Miller (2000) Persistence �0.27 1.02 105 109 2 1 14B. Nelson et al. (1999) Persistence 0.00a 36 39 3 1 14J. A. Nelson & Simmerer (1984) Persistence �0.77 10 10 2 2 12Neu (1997) Persistence 1.31 10 16 3 1 11Neu (1997) Persistence 0.00a 54 30 3 1 1Ottaviano et al. (1993) Persistence 0.00a 193 207 3 1 18Ottaviano et al. (1997) Persistence �0.47 1.5 186 150 3 3 16Paguio & Hollet (1991) Persistence 0.19 0.81 15 23 2 1 14Pierrehumbert et al. (2000) Persistence 0.09 0.81 19 20 3 1 12Porwancher (1991) Persistence 0.00 0.51 60 59 2 1 12Porwancher (1991) Persistence 0.55 0.69 60 59 2 1 16Pridham et al. (1994) Persistence 0.08 59 58 1 1 18Puentes-Neuman (2000) Persistence 0.10 1.37 44 44 2 1 17Reed (1994) Persistence �0.16 1.03 32 22 3 1 5Roth et al. (1984) Persistence 0.00a 30 30 1 1 17Roth et al. (1984) Persistence 0.00a 20 20 1 1 17Sadeh et al. (1994) Persistence 0.00a 19 16 2 1 16Sadeh et al. (1994) Persistence 0.00a 37 26 2 1 16Sanson et al. (1985) Persistence 0.05 1.03 1276 1164 1 1 10Schoen & Nagle (1994) Persistence �0.24 1.02 61 91 2 3 14Schoen (1990) Persistence �0.24 1.03 61 91 2 3 14Schor (1983) Persistence 0.00a 12 13 2 1 1Schor (1985) Persistence 0.00a 58 21 3 1 1Sull (1995) Persistence 0.30 0.93 38 51 2 1 1
39GENDER DIFFERENCES IN TEMPERAMENT

Table 1 (continued )
Study Dimension d VR NM NF Age Source Scale
Behavioral style (continued)
Vitaro et al. (2002) Persistence �0.10 1 2408 2251 3 1 5Von Bargen (1987) Persistence 0.10 50 41 2 1 1Wertlieb et al. (1987) Persistence 0.00a 79 79 3 1 11Wertlieb et al. (1987) Persistence 0.00a 79 79 3 1 11Wertlieb et al. (1988) Persistence 0.00a 73 67 3 1 11Wills et al. (2000) Persistence 0.06 0.81 410 484 4 5 5Wills et al. (2001) Persistence 0.28 0.93 922 952 4 5 5Yolton (1993) Persistence 0.25 0.59 20 18 2 4 17Zahr & El-Haddad (1998) Persistence 0.49 52 43 2 1 9
Criterial
Deater-Deckard et al. (2001) Attention �0.11 1.36 88 114 2 1 3Henderson et al. (2001) Attention �0.13 1.11 64 73 2 1 3Lengua et al. (1999) Attention �0.28 111 112 3 5 6Saudino et al. (1996) Attention �0.18 1 320 280 2 1 23Schmitz et al. (1996) Attention �0.37 0.92 109 92 3 3 3Schmitz et al. (1996) Attention �0.38 1.12 97 84 3 3 3Van Hulle (2001) Attention �0.31 1.27 269 271 3 3 3Yen & Ispa (2000) Attention �0.03 0.53 55 48 3 1 3
Psychobiological
Ackland (2001) Attention focusing 0.00a 25 25 2 1 16Ahadi et al. (1993) Attention focusing 0.04 1 221 246 3 1 2Ahadi et al. (1993) Attention focusing 0.15 1.2 59 94 3 1 2Auerbach et al. (2001) Attention focusing �0.01 0.88 30 31 1 1 8Carter et al. (1999) Attention focusing �0.03 0.97 43 44 1 1 8Clark et al. (1997) Attention focusing �0.11 1.06 256 262 1 1 8Denham et al. (2001) Attention focusing 0.01 1.37 52 45 2 2 2Dettling et al. (1999) Attention focusing �0.65 1.53 34 32 2 1 16Dettling et al. (1999) Attention focusing �0.43 1.13 31 22 3 1 2Dettling et al. (2000) Attention focusing �1.18 1.06 8 13 2 1 2Eisenberg et al. (2000) Attention focusing �0.30 1.02 102 97 3 3 2Eisenberg et al. (2000) Attention focusing �0.43 1.06 83 86 3 3 2Enns (1989) Attention focusing 0.24 1.29 45 46 1 1 8Garstein & Rothbart (2003) Attention focusing �0.10 0.91 155 165 2 1 7Gonzalez et al. (2001) Attention focusing �0.31 1.78 69 65 3 1 2Henderson et al. (2001) Attention focusing �0.16 0.48 69 71 1 1 8Kochanska et al. (1998) Attention focusing 0.05 1.37 56 56 1 2 8Miller (2002) Attention focusing �0.30 1 30 33 2 1 2Plunkett et al. (1989) Attention focusing 0.00a 42 29 2 1 8Putnam (2003) Attention focusing 0.08 1.52 57 57 2 1 7Schwebel (2001) Attention focusing �0.24 0.65 32 31 3 4 2Schwebel (2003) Attention focusing �0.24 1.19 28 28 2 3 2Schwebel et al. (1999) Attention focusing �0.29 1.41 51 49 2 3 2Schwebel & Plumert (1999) Attention focusing �0.29 0.91 30 29 3 1 2Stifter (1988) Attention focusing 0.00a 30 33 1 1 8Stifter & Jain (1996) Attention focusing �0.06 0.98 51 36 1 1 8Susman et al. (2001) Attention focusing �0.54 0.56 27 32 2 1 2Worobey (1998) Attention focusing 0.02 0.93 40 40 1 1 8Zahn-Waxler et al. (1996) Attention focusing �0.44 1.16 251 250 2 4 21Zimmermann (1998) Attention focusing 0.04 1.24 27 26 2 1 2Dettling et al. (1999) Attention shifting �0.24 1 34 32 2 1 16Dettling et al. (1999) Attention shifting �1.41 0.5 31 22 3 1 2Dettling et al. (2000) Attention shifting 0.57 0.77 8 13 2 1 2Eisenberg et al. (2000) Attention shifting �0.62 1.33 102 97 3 3 2Eisenberg et al. (2000) Attention shifting �0.81 1.61 83 86 3 3 2Garstein & Rothbart (2003) Attention shifting �0.08 0.97 155 165 2 1 7Putnam (2003) Attention shifting �0.01 1.23 57 57 2 1 7Schwebel & Plumert (1999) Attention shifting �0.34 0.94 30 29 3 1 2Schwebel (2001) Attention shifting �0.42 0.76 32 31 3 4 2Schwebel (2003) Attention shifting �0.10 1.31 28 28 2 3 2Schwebel et al. (1999) Attention shifting �0.33 0.98 51 49 2 3 2Susman (2001) Attention shifting 0.42 1.6 27 32 2 1 2Dettling et al. (1999) Effortful control �1.25 0.91 31 22 3 1 2Dettling et al. (1999) Effortful control �1.14 0.9 34 32 2 1 16Dettling et al. (2000) Effortful control �1.01 0.62 8 13 2 1 2Gunnar et al. (1997) Effortful control �1.45 2.1 14 12 2 1 2
40 ELSE-QUEST, HYDE, GOLDSMITH, AND VAN HULLE
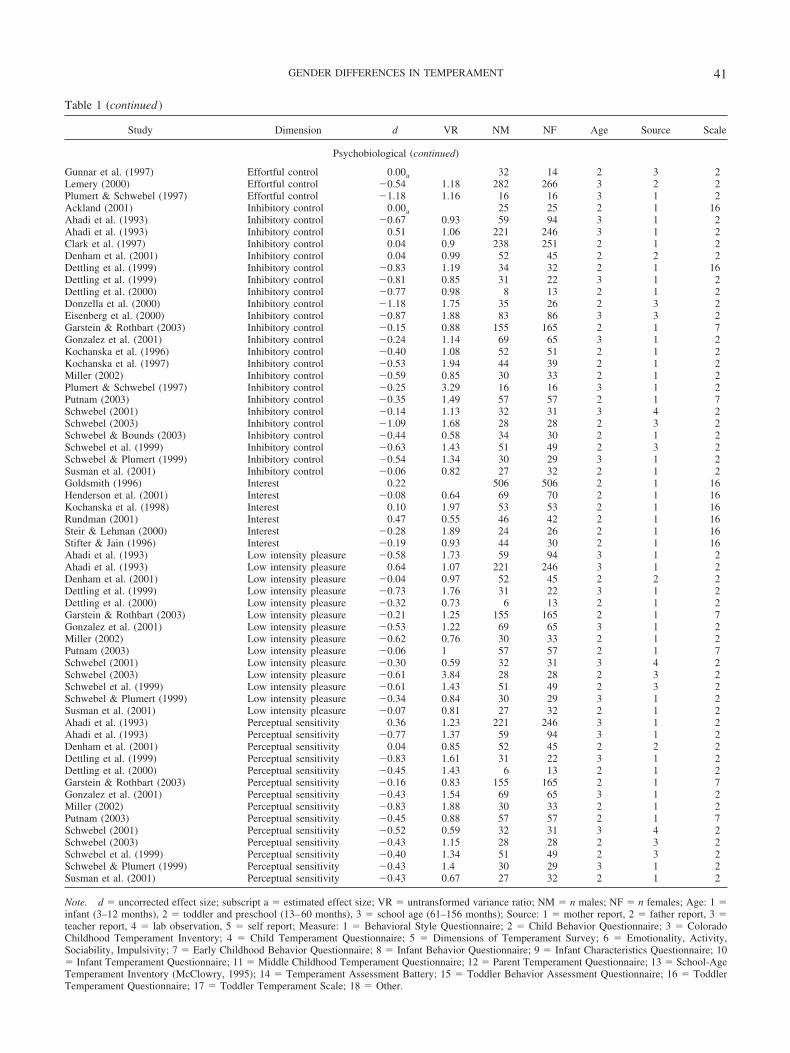
Table 1 (continued )
Study Dimension d VR NM NF Age Source Scale
Psychobiological (continued)
Gunnar et al. (1997) Effortful control 0.00a 32 14 2 3 2Lemery (2000) Effortful control �0.54 1.18 282 266 3 2 2Plumert & Schwebel (1997) Effortful control �1.18 1.16 16 16 3 1 2Ackland (2001) Inhibitory control 0.00a 25 25 2 1 16Ahadi et al. (1993) Inhibitory control �0.67 0.93 59 94 3 1 2Ahadi et al. (1993) Inhibitory control 0.51 1.06 221 246 3 1 2Clark et al. (1997) Inhibitory control 0.04 0.9 238 251 2 1 2Denham et al. (2001) Inhibitory control 0.04 0.99 52 45 2 2 2Dettling et al. (1999) Inhibitory control �0.83 1.19 34 32 2 1 16Dettling et al. (1999) Inhibitory control �0.81 0.85 31 22 3 1 2Dettling et al. (2000) Inhibitory control �0.77 0.98 8 13 2 1 2Donzella et al. (2000) Inhibitory control �1.18 1.75 35 26 2 3 2Eisenberg et al. (2000) Inhibitory control �0.87 1.88 83 86 3 3 2Garstein & Rothbart (2003) Inhibitory control �0.15 0.88 155 165 2 1 7Gonzalez et al. (2001) Inhibitory control �0.24 1.14 69 65 3 1 2Kochanska et al. (1996) Inhibitory control �0.40 1.08 52 51 2 1 2Kochanska et al. (1997) Inhibitory control �0.53 1.94 44 39 2 1 2Miller (2002) Inhibitory control �0.59 0.85 30 33 2 1 2Plumert & Schwebel (1997) Inhibitory control �0.25 3.29 16 16 3 1 2Putnam (2003) Inhibitory control �0.35 1.49 57 57 2 1 7Schwebel (2001) Inhibitory control �0.14 1.13 32 31 3 4 2Schwebel (2003) Inhibitory control �1.09 1.68 28 28 2 3 2Schwebel & Bounds (2003) Inhibitory control �0.44 0.58 34 30 2 1 2Schwebel et al. (1999) Inhibitory control �0.63 1.43 51 49 2 3 2Schwebel & Plumert (1999) Inhibitory control �0.54 1.34 30 29 3 1 2Susman et al. (2001) Inhibitory control �0.06 0.82 27 32 2 1 2Goldsmith (1996) Interest 0.22 506 506 2 1 16Henderson et al. (2001) Interest �0.08 0.64 69 70 2 1 16Kochanska et al. (1998) Interest 0.10 1.97 53 53 2 1 16Rundman (2001) Interest 0.47 0.55 46 42 2 1 16Steir & Lehman (2000) Interest �0.28 1.89 24 26 2 1 16Stifter & Jain (1996) Interest �0.19 0.93 44 30 2 1 16Ahadi et al. (1993) Low intensity pleasure �0.58 1.73 59 94 3 1 2Ahadi et al. (1993) Low intensity pleasure 0.64 1.07 221 246 3 1 2Denham et al. (2001) Low intensity pleasure �0.04 0.97 52 45 2 2 2Dettling et al. (1999) Low intensity pleasure �0.73 1.76 31 22 3 1 2Dettling et al. (2000) Low intensity pleasure �0.32 0.73 6 13 2 1 2Garstein & Rothbart (2003) Low intensity pleasure �0.21 1.25 155 165 2 1 7Gonzalez et al. (2001) Low intensity pleasure �0.53 1.22 69 65 3 1 2Miller (2002) Low intensity pleasure �0.62 0.76 30 33 2 1 2Putnam (2003) Low intensity pleasure �0.06 1 57 57 2 1 7Schwebel (2001) Low intensity pleasure �0.30 0.59 32 31 3 4 2Schwebel (2003) Low intensity pleasure �0.61 3.84 28 28 2 3 2Schwebel et al. (1999) Low intensity pleasure �0.61 1.43 51 49 2 3 2Schwebel & Plumert (1999) Low intensity pleasure �0.34 0.84 30 29 3 1 2Susman et al. (2001) Low intensity pleasure �0.07 0.81 27 32 2 1 2Ahadi et al. (1993) Perceptual sensitivity 0.36 1.23 221 246 3 1 2Ahadi et al. (1993) Perceptual sensitivity �0.77 1.37 59 94 3 1 2Denham et al. (2001) Perceptual sensitivity 0.04 0.85 52 45 2 2 2Dettling et al. (1999) Perceptual sensitivity �0.83 1.61 31 22 3 1 2Dettling et al. (2000) Perceptual sensitivity �0.45 1.43 6 13 2 1 2Garstein & Rothbart (2003) Perceptual sensitivity �0.16 0.83 155 165 2 1 7Gonzalez et al. (2001) Perceptual sensitivity �0.43 1.54 69 65 3 1 2Miller (2002) Perceptual sensitivity �0.83 1.88 30 33 2 1 2Putnam (2003) Perceptual sensitivity �0.45 0.88 57 57 2 1 7Schwebel (2001) Perceptual sensitivity �0.52 0.59 32 31 3 4 2Schwebel (2003) Perceptual sensitivity �0.43 1.15 28 28 2 3 2Schwebel et al. (1999) Perceptual sensitivity �0.40 1.34 51 49 2 3 2Schwebel & Plumert (1999) Perceptual sensitivity �0.43 1.4 30 29 3 1 2Susman et al. (2001) Perceptual sensitivity �0.43 0.67 27 32 2 1 2
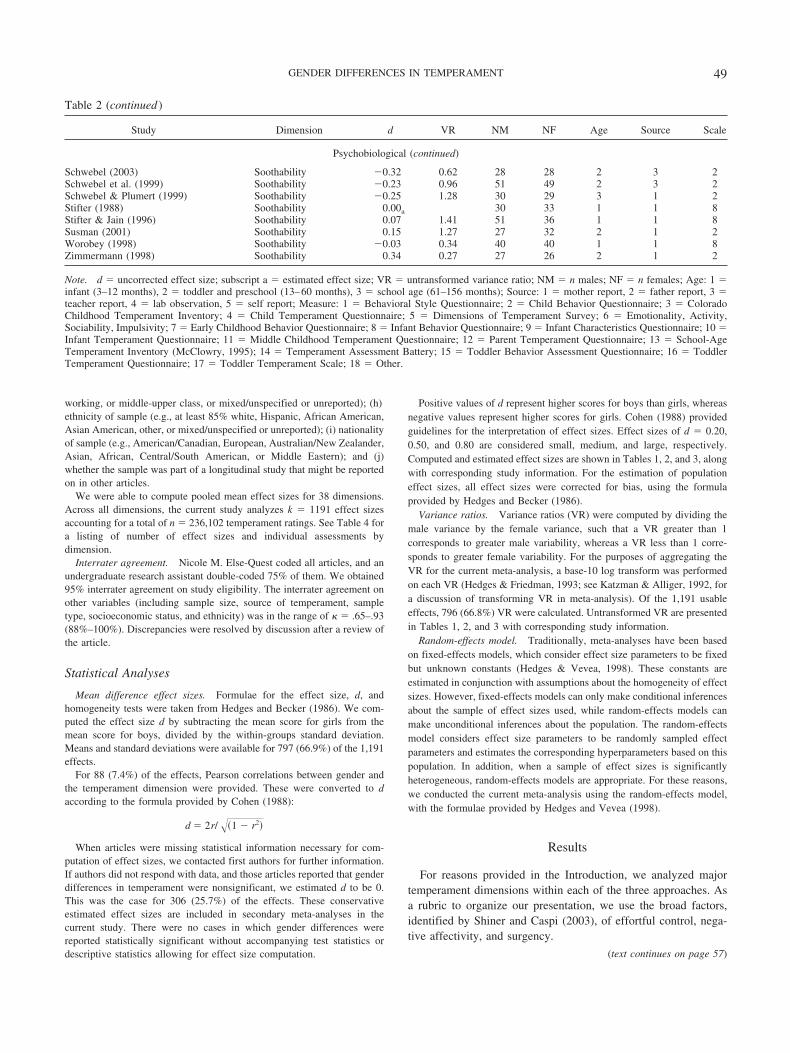
Note. d � uncorrected effect size; subscript a � estimated effect size; VR � untransformed variance ratio; NM � n males; NF � n females; Age: 1 �infant (3–12 months), 2 � toddler and preschool (13–60 months), 3 � school age (61–156 months); Source: 1 � mother report, 2 � father report, 3 �teacher report, 4 � lab observation, 5 � self report; Measure: 1 � Behavioral Style Questionnaire; 2 � Child Behavior Questionnaire; 3 � ColoradoChildhood Temperament Inventory; 4 � Child Temperament Questionnaire; 5 � Dimensions of Temperament Survey; 6 � Emotionality, Activity,Sociability, Impulsivity; 7 � Early Childhood Behavior Questionnaire; 8 � Infant Behavior Questionnaire; 9 � Infant Characteristics Questionnaire; 10� Infant Temperament Questionnaire; 11 � Middle Childhood Temperament Questionnaire; 12 � Parent Temperament Questionnaire; 13 � School-AgeTemperament Inventory (McClowry, 1995); 14 � Temperament Assessment Battery; 15 � Toddler Behavior Assessment Questionnaire; 16 � ToddlerTemperament Questionnaire; 17 � Toddler Temperament Scale; 18 � Other.
41GENDER DIFFERENCES IN TEMPERAMENT

Table 2Effect Sizes and Moderator Variable Codes for the Factor of Negative Affectivity, Grouped by Framework
Study Dimension d VR NM NF Age Source Scale
Behavioral style
Anolik (1996) Adaptability 0.11 0.86 126 127 1 1 1Arbiter et al. (1999) Adaptability �0.26 0.37 16 16 2 1 17Arbiter et al. (1999) Adaptability �0.19 1.38 19 17 2 1 17Ballantine & Klein (1990) Adaptability �0.19 1.03 54 54 3 3 5Barclay (1987) Adaptability �0.18 0.90 23 23 3 3 14Barclay (1987) Adaptability �0.69 1.97 41 42 3 3 14Cardell & Parmar (1988) Adaptability �0.25 0.91 23 12 3 3 14Cardell & Parmar (1988) Adaptability �0.18 1.85 54 26 3 3 14Carlson (1998) Adaptability 0.06 0.89 128 105 1 1 10Coffman et al. (1992) Adaptability 0.00a 30 21 2 1 9DeVries & Sameroff (1984) Adaptability 0.00a 93 85 1 1 10DiBiase (1991) Adaptability 0.00a 25 18 1 1 10Dixon & Smith (2000) Adaptability 0.00a 22 20 2 1 17Doelling & Johnson (1990) Adaptability 0.00a 27 24 3 5 5Fagan (1989) Adaptability �0.37 1.09 20 64 3 3 14Field et al. (1987) Adaptability 0.00a 13 13 1 1 10Fullard et al. (1984) Adaptability �0.06 161 148 1 1 17Gennaro et al. (1990) Adaptability 0.00a 45 55 1 1 9D. W. Guerin & Gottfried (1994) Adaptability 0.27 0.79 64 59 2 1 9K. B. Guerin (1995) Adaptability �0.26 1.64 33 43 4 5 5Gunn & Berry (1985) Adaptability 0.00a 21 16 2 1 17Halpern et al. (1994) Adaptability 0.00a 13 8 1 1 9Halpern, Garcia Coll, et al. (2001) Adaptability 0.58 39 33 1 1 9Hayes et al. (2001) Adaptability 0.00a 34 33 2 3 1Healy (1987) Adaptability 0.00a 36 40 2 1 17Hollis (1995) Adaptability �0.17 1.07 83 107 3 3 14Houck (1999) Adaptability �0.02 0.81 41 84 1 1 10Houldin (1988) Adaptability 0.00a 16 24 2 1 16H. A. Klein (1992) Adaptability �0.17 0.85 30 25 4 5 5H. A. Klein (1992) Adaptability �0.20 1.68 41 35 3 5 5Korner et al. (1985) Adaptability 0.00a 23 27 3 1 1Laumakis (2001) Adaptability 0.00a 10 14 3 1 14Liddell (1990) Adaptability 0.00a 82 97 4 1 5Martin et al. (1997) Adaptability �0.24 1.30 599 496 3 1 12Maziade, Boudreault, et al. (1984) Adaptability �0.24 0.93 176 159 1 1 10Maziade, Boudreault, et al. (1984) Adaptability �0.08 1.00 357 362 1 1 10Maziade, Cote, et al. (1984) Adaptability 0.00 0.92 318 321 3 1 12McClowry (1989) Adaptability 0.00a 43 33 3 1 11Melhuish et al. (1991) Adaptability 0.00a 115 115 1 1 10Mevarech (1985) Adaptability 0.00a 94 97 3 3 16K. J. Miller (2002) Adaptability �0.97 1.94 30 33 2 3 13M. Miller (2000) Adaptability 0.38 0.67 105 109 2 1 14Nelson et al. (1999) Adaptability 0.00a 36 39 3 1 14Nelson & Simmerer (1984) Adaptability �0.65 10 10 2 2 12Neu (1997) Adaptability 0.52 54 30 3 1 1Neu (1997) Adaptability 1.19 10 16 3 1 11Ottaviano et al. (1993) Adaptability 0.00a 193 207 3 1 18Ottaviano et al. (1997) Adaptability 0.00a 186 150 3 3 16Paguio & Hollet (1991) Adaptability �0.64 1.34 15 23 2 1 14Pierrehumbert et al. (2000) Adaptability �0.17 0.41 19 20 3 1 12Pridham et al. (1994) Adaptability 0.00 59 58 1 1 18Pridham et al. (1994) Adaptability 0.02 59 58 1 1 18Puentes-Neuman (2000) Adaptability 0.22 1.82 44 44 2 1 17Reed (1994) Adaptability 0.35 0.97 32 22 3 1 5Roth et al. (1984) Adaptability 0.00a 30 30 1 1 17Roth et al. (1984) Adaptability 0.00a 20 20 1 1 17Sadeh et al. (1994) Adaptability 0.00a 19 16 2 1 16Sadeh et al. (1994) Adaptability 0.00a 37 26 2 1 16Sanson et al. (1985) Adaptability �0.03 1.00 1276 1164 1 1 10Scher & Mayseless (2000) Adaptability 0.15 1.59 42 52 1 1 9Schoen (1990) Adaptability �0.03 1.04 61 91 2 3 14Schoen & Nagle (1994) Adaptability �0.03 1.04 61 91 2 3 14Schor (1983) Adaptability 0.00a 12 13 2 1 1Schor (1985) Adaptability 0.00a 58 21 3 1 1Simons (1983) Adaptability 0.51 0.80 22 18 1 1 10
42 ELSE-QUEST, HYDE, GOLDSMITH, AND VAN HULLE

Table 2 (continued )
Study Dimension d VR NM NF Age Source Scale
Behavioral style (continued)
Sull (1995) Adaptability 0.05 0.80 38 51 2 1 1Von Bargen (1987) Adaptability �0.06 50 41 2 1 1Weissbluth (1984) Adaptability 0.00a 26 24 2 1 1Wertlieb et al. (1987) Adaptability 0.00a 79 79 3 1 11Wertlieb et al. (1987) Adaptability 0.00a 79 79 3 1 11Wertlieb et al. (1988) Adaptability 0.00a 73 67 3 1 11Yolton (1993) Adaptability �0.05 1.43 20 18 2 4 17Zahr & El-Haddad (1998) Adaptability 0.54 52 43 2 1 9Berzirganian & Cohen (1992) Difficult 0.30 1.17 410 410 4 1 18Berzirganian & Cohen (1992) Difficult 0.30 1.25 410 410 2 1 18Berzirganian & Cohen (1992) Difficult 0.19 1.25 410 410 3 1 18Coffman et al. (1992) Difficult 0.00a 30 21 2 1 9Constantino et al. (2002) Difficult 0.64 1.25 111 130 2 3 18DiLalla (1998) Difficult �0.20 64 60 3 1 1Fagot & Gauvain (1997) Difficult 0.15 0.72 47 46 2 1 17Fagot & Leve (1998) Difficult �0.18 82 74 2 4 18Farver & Branstetter (1994) Difficult 0.39 26 26 2 1 1Fish (1998) Difficult �0.08 0.90 50 44 1 1 9Frodi (1983) Difficult 0.00a 19 21 1 1 10Gauvain & Fagot (1995) Difficult �0.45 0.67 11 15 2 1 17Gennaro et al. (1990) Difficult 0.00a 45 55 1 1 9Gibbins (2001) Difficult 0.05 1.02 131 105 2 3 9Gibson et al. (2000) Difficult �0.23 0.76 34 31 1 1 18Gibson et al. (2000) Difficult �0.05 1.08 31 30 1 1 18Gibson et al. (2000) Difficult �0.07 1.29 34 31 1 1 18Gibson et al. (2000) Difficult 0.03 1.97 31 30 1 1 18D. W. Guerin & Gottfried (1994) Difficult 0.03 1.00 64 59 2 1 9Halpern et al. (1994) Difficult 0.00a 13 8 1 1 9Halpern, Garcia Coll, et al. (2001) Difficult 0.61 39 33 1 1 9Hannan & Luster (1991) Difficult 0.20 302 300 2 1 18Hildebrandt & Cannan (1985) Difficult 0.00a 12 19 2 1 10Houck (1999) Difficult 0.15 0.88 41 84 1 1 10Lehtonen et al. (1994) Difficult 0.00a 36 33 1 1 16Lehtonen et al. (1994) Difficult 0.00a 31 27 1 1 16Luby et al. (1999) Difficult 0.58 145 177 4 1 18Martin et al. (1997) Difficult 0.05 1.03 1001 995 1 1 10McKim et al. (1999) Difficult �0.20 101 88 2 1 9Myers (1998) Difficult �0.14 0.95 132 71 4 1 5O’Callaghan (1999) Difficult 0.28 33 22 3 1 1Scher & Mayseless (2000) Difficult 0.10 1.10 44 52 1 1 9Vaughn et al. (1987) Difficult 0.00a 52 48 1 1 10Williams (1992) Difficult �0.07 1.05 19 19 1 1 10Wills & Stoolmiller (2002) Difficult �0.04 850 850 4 3 5Zahr & El-Haddad (1998) Difficult 0.65 52 43 2 1 9Anolik (1996) Intensity �0.14 0.97 126 127 1 1 1Arbiter et al. (1999) Intensity �0.08 1.30 19 17 2 1 17Arbiter et al. (1999) Intensity 0.02 2.80 16 16 2 1 17Barclay (1987) Intensity 0.39 0.93 23 23 3 3 14Barclay (1987) Intensity 0.68 1.37 41 42 3 3 14Bournaki (1997) Intensity �0.47 1.27 43 51 3 1 11Cardell & Parmar (1988) Intensity 0.04 0.76 23 12 3 3 14Cardell & Parmar (1988) Intensity 0.19 1.52 54 26 3 3 14Carlson (1998) Intensity 0.03 0.93 128 105 1 1 10DeVries & Sameroff (1984) Intensity 0.00a 93 85 1 1 10DiBiase (1991) Intensity 0.00a 25 18 1 1 10Dixon & Smith (2000) Intensity 0.00a 22 20 2 1 17Fagan (1989) Intensity 0.29 0.78 20 64 3 3 14Field et al. (1987) Intensity 0.00a 13 13 1 1 10Fitzpatrick (2001) Intensity 0.02 34 32 1 1 10Fullard et al. (1984) Intensity 0.04 161 148 1 1 17Garner & Power (1996) Intensity 0.00a 44 38 2 1 1Garner & Spears (2000) Intensity 0.00a 46 44 2 1 1Gunn & Berry (1985) Intensity 0.00a 21 16 2 1 17Halpern & Garcia-Coll (2000) Intensity 0.03 1.38 23 16 1 1 9Halpern & Garcia-Coll (2000) Intensity �0.64 1.69 14 16 1 1 9Halpern, Garcia Coll, et al. (2001) Intensity 0.00a 39 33 1 1 9Hayes et al. (2001) Intensity 0.00a 34 33 2 3 1Healy (1987) Intensity 0.00a 36 40 2 1 17
43GENDER DIFFERENCES IN TEMPERAMENT
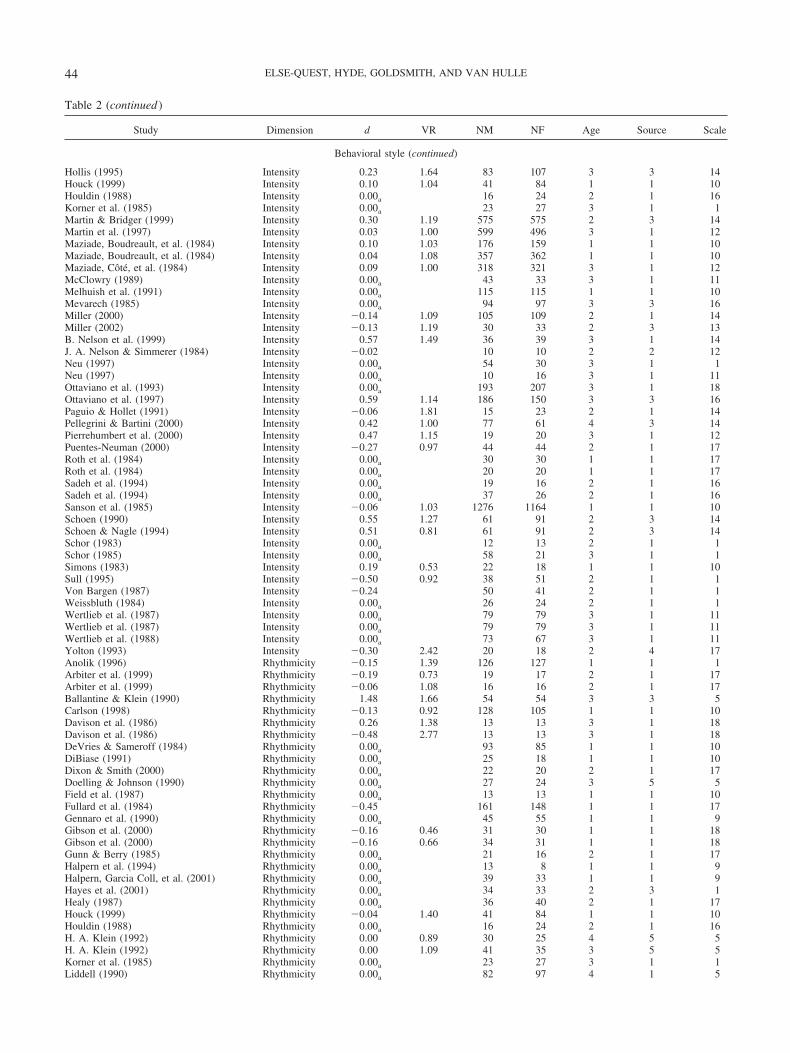
Table 2 (continued )
Study Dimension d VR NM NF Age Source Scale
Behavioral style (continued)
Hollis (1995) Intensity 0.23 1.64 83 107 3 3 14Houck (1999) Intensity 0.10 1.04 41 84 1 1 10Houldin (1988) Intensity 0.00a 16 24 2 1 16Korner et al. (1985) Intensity 0.00a 23 27 3 1 1Martin & Bridger (1999) Intensity 0.30 1.19 575 575 2 3 14Martin et al. (1997) Intensity 0.03 1.00 599 496 3 1 12Maziade, Boudreault, et al. (1984) Intensity 0.10 1.03 176 159 1 1 10Maziade, Boudreault, et al. (1984) Intensity 0.04 1.08 357 362 1 1 10Maziade, Cote, et al. (1984) Intensity 0.09 1.00 318 321 3 1 12McClowry (1989) Intensity 0.00a 43 33 3 1 11Melhuish et al. (1991) Intensity 0.00a 115 115 1 1 10Mevarech (1985) Intensity 0.00a 94 97 3 3 16Miller (2000) Intensity �0.14 1.09 105 109 2 1 14Miller (2002) Intensity �0.13 1.19 30 33 2 3 13B. Nelson et al. (1999) Intensity 0.57 1.49 36 39 3 1 14J. A. Nelson & Simmerer (1984) Intensity �0.02 10 10 2 2 12Neu (1997) Intensity 0.00a 54 30 3 1 1Neu (1997) Intensity 0.00a 10 16 3 1 11Ottaviano et al. (1993) Intensity 0.00a 193 207 3 1 18Ottaviano et al. (1997) Intensity 0.59 1.14 186 150 3 3 16Paguio & Hollet (1991) Intensity �0.06 1.81 15 23 2 1 14Pellegrini & Bartini (2000) Intensity 0.42 1.00 77 61 4 3 14Pierrehumbert et al. (2000) Intensity 0.47 1.15 19 20 3 1 12Puentes-Neuman (2000) Intensity �0.27 0.97 44 44 2 1 17Roth et al. (1984) Intensity 0.00a 30 30 1 1 17Roth et al. (1984) Intensity 0.00a 20 20 1 1 17Sadeh et al. (1994) Intensity 0.00a 19 16 2 1 16Sadeh et al. (1994) Intensity 0.00a 37 26 2 1 16Sanson et al. (1985) Intensity �0.06 1.03 1276 1164 1 1 10Schoen (1990) Intensity 0.55 1.27 61 91 2 3 14Schoen & Nagle (1994) Intensity 0.51 0.81 61 91 2 3 14Schor (1983) Intensity 0.00a 12 13 2 1 1Schor (1985) Intensity 0.00a 58 21 3 1 1Simons (1983) Intensity 0.19 0.53 22 18 1 1 10Sull (1995) Intensity �0.50 0.92 38 51 2 1 1Von Bargen (1987) Intensity �0.24 50 41 2 1 1Weissbluth (1984) Intensity 0.00a 26 24 2 1 1Wertlieb et al. (1987) Intensity 0.00a 79 79 3 1 11Wertlieb et al. (1987) Intensity 0.00a 79 79 3 1 11Wertlieb et al. (1988) Intensity 0.00a 73 67 3 1 11Yolton (1993) Intensity �0.30 2.42 20 18 2 4 17Anolik (1996) Rhythmicity �0.15 1.39 126 127 1 1 1Arbiter et al. (1999) Rhythmicity �0.19 0.73 19 17 2 1 17Arbiter et al. (1999) Rhythmicity �0.06 1.08 16 16 2 1 17Ballantine & Klein (1990) Rhythmicity 1.48 1.66 54 54 3 3 5Carlson (1998) Rhythmicity �0.13 0.92 128 105 1 1 10Davison et al. (1986) Rhythmicity 0.26 1.38 13 13 3 1 18Davison et al. (1986) Rhythmicity �0.48 2.77 13 13 3 1 18DeVries & Sameroff (1984) Rhythmicity 0.00a 93 85 1 1 10DiBiase (1991) Rhythmicity 0.00a 25 18 1 1 10Dixon & Smith (2000) Rhythmicity 0.00a 22 20 2 1 17Doelling & Johnson (1990) Rhythmicity 0.00a 27 24 3 5 5Field et al. (1987) Rhythmicity 0.00a 13 13 1 1 10Fullard et al. (1984) Rhythmicity �0.45 161 148 1 1 17Gennaro et al. (1990) Rhythmicity 0.00a 45 55 1 1 9Gibson et al. (2000) Rhythmicity �0.16 0.46 31 30 1 1 18Gibson et al. (2000) Rhythmicity �0.16 0.66 34 31 1 1 18Gunn & Berry (1985) Rhythmicity 0.00a 21 16 2 1 17Halpern et al. (1994) Rhythmicity 0.00a 13 8 1 1 9Halpern, Garcia Coll, et al. (2001) Rhythmicity 0.00a 39 33 1 1 9Hayes et al. (2001) Rhythmicity 0.00a 34 33 2 3 1Healy (1987) Rhythmicity 0.00a 36 40 2 1 17Houck (1999) Rhythmicity �0.04 1.40 41 84 1 1 10Houldin (1988) Rhythmicity 0.00a 16 24 2 1 16H. A. Klein (1992) Rhythmicity 0.00 0.89 30 25 4 5 5H. A. Klein (1992) Rhythmicity 0.00 1.09 41 35 3 5 5Korner et al. (1985) Rhythmicity 0.00a 23 27 3 1 1Liddell (1990) Rhythmicity 0.00a 82 97 4 1 5
44 ELSE-QUEST, HYDE, GOLDSMITH, AND VAN HULLE

Table 2 (continued )
Study Dimension d VR NM NF Age Source Scale
Behavioral style (continued)
Martin et al. (1997) Rhythmicity 0.09 1.05 599 496 3 1 12Maziade, Boudreault, et al. (1984) Rhythmicity �0.03 0.95 357 362 1 1 10Maziade, Boudreault, et al. (1984) Rhythmicity 0.03 1.05 176 159 1 1 10Maziade, Cote, et al. (1984) Rhythmicity 0.09 1.03 318 321 3 1 12McClowry (1989) Rhythmicity 0.00a 43 33 3 1 11Mednick et al. (1996) Rhythmicity 0.24 485 487 3 1 5Melhuish et al. (1991) Rhythmicity 0.00a 115 115 1 1 10Neu (1997) Rhythmicity 0.77 10 16 3 1 11Neu (1997) Rhythmicity 0.00a 54 30 3 1 1Ottaviano et al. (1993) Rhythmicity 0.00a 193 207 3 1 18Pierrehumbert et al. (2000) Rhythmicity �0.08 1.00 19 20 3 1 12Puentes-Neuman (2000) Rhythmicity 0.03 1.22 44 44 2 1 17Reed (1994) Rhythmicity 0.09 0.83 32 22 3 1 5Roth et al. (1984) Rhythmicity 0.00a 30 30 1 1 17Roth et al. (1984) Rhythmicity 0.00a 20 20 1 1 17Sadeh et al. (1994) Rhythmicity 0.00a 19 16 2 1 16Sadeh et al. (1994) Rhythmicity 0.00a 37 26 2 1 16Sanson et al. (1985) Rhythmicity �0.01 0.95 1276 1164 1 1 10Schor (1983) Rhythmicity 0.00a 12 13 2 1 1Schor (1985) Rhythmicity 0.53 1.50 58 21 3 1 1Simons (1983) Rhythmicity 0.04 0.10 22 18 1 1 10Sull (1995) Rhythmicity �0.38 0.85 38 51 2 1 1Vitaro et al. (2002) Rhythmicity 0.10 0.69 2408 2251 3 1 5Von Bargen (1987) Rhythmicity �0.12 50 41 2 1 1Wertlieb et al. (1987) Rhythmicity 0.00a 79 79 3 1 11Wertlieb et al. (1987) Rhythmicity 0.00a 79 79 3 1 11Wertlieb et al. (1988) Rhythmicity 0.00a 73 67 3 1 11Yolton (1993) Rhythmicity 0.47 1.78 20 18 2 4 17Zahr & El-Haddad (1998) Rhythmicity 0.26 52 43 2 1 9Anolik (1996) Threshold �0.22 1.04 126 127 1 1 1Arbiter et al. (1999) Threshold �0.23 0.31 16 16 2 1 17Arbiter et al. (1999) Threshold 0.17 1.38 19 17 2 1 17Bournaki (1997) Threshold 0.00a 43 51 3 1 11Carlson (1998) Threshold �0.26 1.19 128 105 1 1 10DeVries & Sameroff (1984) Threshold 0.00a 93 85 1 1 10DiBiase (1991) Threshold 0.00a 25 18 1 1 10Dixon & Smith (2000) Threshold 0.00a 22 20 2 1 17Field et al. (1987) Threshold 0.00a 13 13 1 1 10Fullard et al. (1984) Threshold �0.18 161 148 1 1 17Gibson et al. (2000) Threshold 0.19 1.11 31 30 1 1 18Gibson et al. (2000) Threshold 0.04 1.55 34 31 1 1 18Gunn & Berry (1985) Threshold 0.00a 21 16 2 1 17Halpern, Garcia Coll, et al. (2001) Threshold 0.00a 39 33 1 1 9Hayes et al. (2001) Threshold 0.00a 34 33 2 3 1Healy (1987) Threshold 0.00a 36 40 2 1 17Houck (1999) Threshold �0.03 1.13 41 84 1 1 10Houldin (1988) Threshold 0.00a 16 24 2 1 16Korner et al. (1985) Threshold 0.00a 23 27 3 1 1Martin et al. (1997) Threshold �0.29 1.18 599 496 3 1 12Maziade, Boudreault, et al. (1984) Threshold 0.01 0.97 176 159 1 1 10Maziade, Boudreault, et al. (1984) Threshold �0.04 1.25 357 362 1 1 10Maziade, Cote, et al. (1984) Threshold 0.24 1.19 318 321 3 1 12McClowry (1989) Threshold 0.00a 43 33 3 1 11Melhuish et al. (1991) Threshold 0.00a 115 115 1 1 10Mevarech (1985) Threshold 0.00a 94 97 3 3 16Miller (2002) Threshold �0.02 0.79 30 33 2 3 13Neu (1997) Threshold 0.00a 54 30 3 1 1Neu (1997) Threshold 0.00a 10 16 3 1 11Ottaviano et al. (1993) Threshold 0.00a 193 207 3 1 18Ottaviano et al. (1997) Threshold 0.00a 186 150 3 3 16Pierrehumbert et al. (2000) Threshold 0.20 2.85 19 20 3 1 12Porwancher (1991) Threshold 0.10 0.91 60 59 2 1 16Puentes-Neuman (2000) Threshold �0.49 1.10 44 44 2 1 17Sadeh et al. (1994) Threshold 0.00a 19 16 2 1 16Sadeh et al. (1994) Threshold 0.00a 37 26 2 1 16Sanson et al. (1985) Threshold �0.05 0.94 1276 1164 1 1 10Schor (1983) Threshold 0.00a 12 13 2 1 1Schor (1985) Threshold 0.00a 58 21 3 1 1
45GENDER DIFFERENCES IN TEMPERAMENT

Table 2 (continued )
Study Dimension d VR NM NF Age Source Scale
Behavioral style (continued)
Sull (1995) Threshold �0.53 0.67 38 51 2 1 1Vitaro et al. (2002) Threshold 0.03 1.00 2408 2251 3 1 5Von Bargen (1987) Threshold 0.12 50 41 2 1 1Wertlieb et al. (1987) Threshold 0.00a 79 79 3 1 11Wertlieb et al. (1987) Threshold 0.00a 79 79 3 1 11Wertlieb et al. (1988) Threshold 0.00a 73 67 3 1 11Yolton (1993) Threshold �0.15 1.10 20 18 2 4 17
Criterial
Adessky (1997) Emotionality �0.07 0.69 137 108 3 1 6Boer & Westenberg (1994) Emotionality 0.00a 122 107 3 2 6Braungart-Rieker et al. (1998) Emotionality 0.00 49 45 1 4 23Carpey (1990) Emotionality 0.18 0.77 60 58 2 1 6Deater-Deckard et al. (2001) Emotionality �0.25 1.02 88 114 2 1 3Dollberg (1995) Emotionality 0.00 84 98 2 1 6Gasman et al. (2002) Emotionality 0.17 1.04 107 84 3 3 6Grunau et al. (1994) Emotionality 0.00a 98 97 2 1 6Hagekull & Bohlin (1998) Emotionality 0.00a 63 60 2 1 3Henderson et al. (2001) Emotionality �0.13 0.69 64 73 2 1 3Hobson-Underwood (1989) Emotionality �0.30 1.35 46 50 3 5 6Krenn (1997) Emotionality 0.06 0.74 95 92 2 3 6Lengua et al. (1999) Emotionality 0.16 111 112 3 5 6Lengua et al. (2000) Emotionality 0.22 115 116 3 1 6Mathiesen & Tambs (1999) Emotionality �0.05 1.00 449 471 2 1 6Owens-Stively et al. (1997) Emotionality 0.30 1.00 25 27 2 1 6Owens-Stively et al. (1997) Emotionality �0.17 1.05 44 36 2 1 6Pilkington (1989) Emotionality 0.11 0.86 76 72 3 2 6Pilkington (1989) Emotionality 0.11 0.92 71 81 3 2 6Pilkington (1989) Emotionality 0.19 1.08 89 72 2 2 6Pitkin (1993) Emotionality 0.00a 147 120 2 1 6Pliner & Loewen (1997) Emotionality 0.39 0.62 22 21 3 1 6Pliner & Loewen (1997) Emotionality �0.14 0.96 19 23 3 1 6Pliner & Loewen (1997) Emotionality �0.13 0.96 18 20 3 1 6Pliner & Loewen (1997) Emotionality �0.57 1.41 19 20 3 1 6Schmitz et al. (1996) Emotionality 0.19 1.21 104 92 3 3 3Schmitz et al. (1996) Emotionality 0.24 1.28 97 84 3 3 3Schmitz et al. (1999) Emotionality 0.03 1.00 352 322 2 1 3Schwarz (2002) Emotionality 0.00 144 182 3 3 6Simpson & Stevenson-Hinde (1985) Emotionality 0.00a 24 17 2 1 19Simpson & Stevenson-Hinde (1985) Emotionality 0.00a 26 21 2 1 19Sullivan (1995) Emotionality �0.24 0.79 52 58 2 1 6Van Hulle (2001) Emotionality 0.08 1.03 269 271 3 3 3Von Bargen (1987) Emotionality �0.41 50 41 2 1 6Wills et al. (2001) Emotionality �0.12 0.87 922 952 3 5 6
Psychobiological
Ackland (2001) Anger & Frustration 0.00a 25 25 2 1 16Ahadi et al. (1993) Anger & Frustration 0.13 0.50 59 94 3 1 2Ahadi et al. (1993) Anger & Frustration 0.00 0.97 221 246 3 1 2Clark et al. (1997) Anger & Frustration �0.01 1.07 238 251 2 1 2Denham et al. (2001) Anger & Frustration �0.20 1.15 52 45 2 2 2Dettling et al. (1999) Anger & Frustration 0.18 0.62 34 32 2 1 16Dettling et al. (1999) Anger & Frustration 0.19 1.54 31 22 3 1 2Dettling et al. (2000) Anger & Frustration 0.00 2.31 8 13 2 1 2Garstein & Rothbart (2003) Anger & Frustration 0.00 0.87 155 165 2 1 7Goldsmith (1996) Anger & Frustration �0.04 506 506 2 1 16Gonzalez et al. (2001) Anger & Frustration �0.25 1.19 69 65 3 1 2Henderson et al. (2001) Anger & Frustration 0.07 0.69 69 70 2 1 16Kochanska et al. (1998) Anger & Frustration 0.14 1.18 52 52 2 2 16K. J. Miller (2002) Anger & Frustration 0.69 0.72 30 33 2 1 2Putnam (2003) Anger & Frustration 0.15 0.72 57 57 2 1 7Rundman (2001) Anger & Frustration �0.06 1.02 46 42 2 1 16Schwebel (2001) Anger & Frustration �0.18 0.86 32 31 3 4 2Schwebel (2003) Anger & Frustration 0.61 0.71 28 28 2 3 2Schwebel & Plumert (1999) Anger & Frustration 0.30 1.04 30 29 3 1 2Schwebel et al. (1999) Anger & Frustration 0.40 0.83 51 49 2 3 2Steir & Lehman (2000) Anger & Frustration �0.21 0.94 24 26 2 1 16
46 ELSE-QUEST, HYDE, GOLDSMITH, AND VAN HULLE
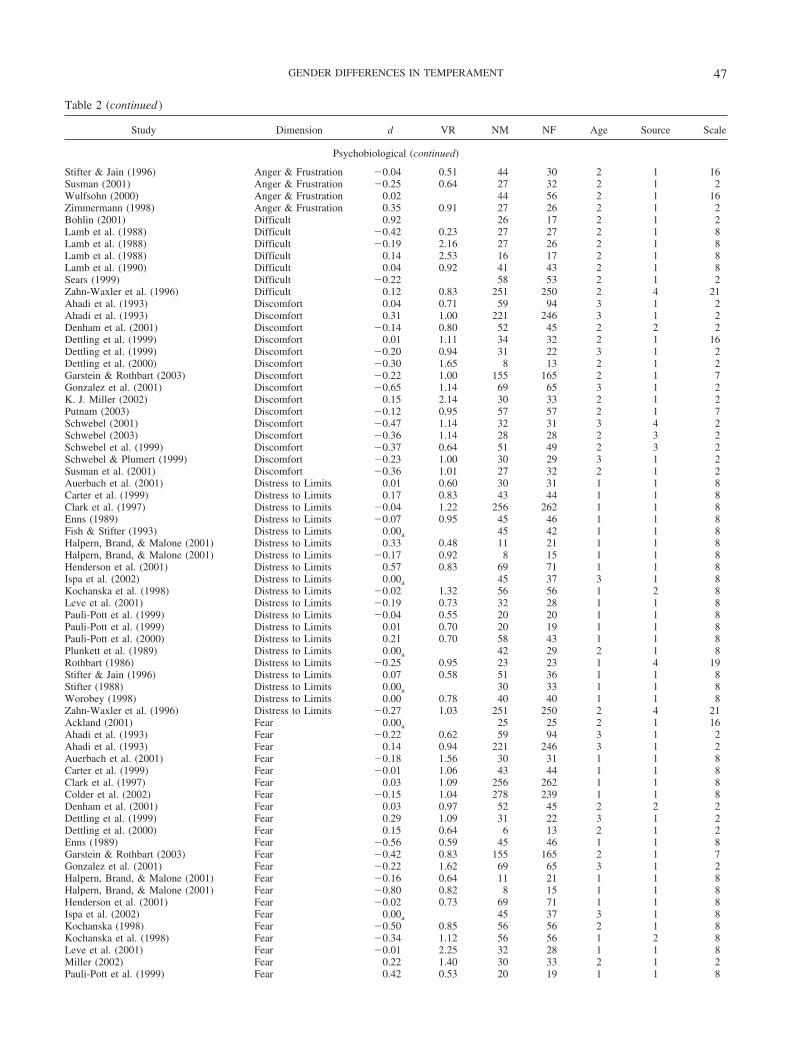
Table 2 (continued )
Study Dimension d VR NM NF Age Source Scale
Psychobiological (continued)
Stifter & Jain (1996) Anger & Frustration �0.04 0.51 44 30 2 1 16Susman (2001) Anger & Frustration �0.25 0.64 27 32 2 1 2Wulfsohn (2000) Anger & Frustration 0.02 44 56 2 1 16Zimmermann (1998) Anger & Frustration 0.35 0.91 27 26 2 1 2Bohlin (2001) Difficult 0.92 26 17 2 1 2Lamb et al. (1988) Difficult �0.42 0.23 27 27 2 1 8Lamb et al. (1988) Difficult �0.19 2.16 27 26 2 1 8Lamb et al. (1988) Difficult 0.14 2.53 16 17 2 1 8Lamb et al. (1990) Difficult 0.04 0.92 41 43 2 1 8Sears (1999) Difficult �0.22 58 53 2 1 2Zahn-Waxler et al. (1996) Difficult 0.12 0.83 251 250 2 4 21Ahadi et al. (1993) Discomfort 0.04 0.71 59 94 3 1 2Ahadi et al. (1993) Discomfort 0.31 1.00 221 246 3 1 2Denham et al. (2001) Discomfort �0.14 0.80 52 45 2 2 2Dettling et al. (1999) Discomfort 0.01 1.11 34 32 2 1 16Dettling et al. (1999) Discomfort �0.20 0.94 31 22 3 1 2Dettling et al. (2000) Discomfort �0.30 1.65 8 13 2 1 2Garstein & Rothbart (2003) Discomfort �0.22 1.00 155 165 2 1 7Gonzalez et al. (2001) Discomfort �0.65 1.14 69 65 3 1 2K. J. Miller (2002) Discomfort 0.15 2.14 30 33 2 1 2Putnam (2003) Discomfort �0.12 0.95 57 57 2 1 7Schwebel (2001) Discomfort �0.47 1.14 32 31 3 4 2Schwebel (2003) Discomfort �0.36 1.14 28 28 2 3 2Schwebel et al. (1999) Discomfort �0.37 0.64 51 49 2 3 2Schwebel & Plumert (1999) Discomfort �0.23 1.00 30 29 3 1 2Susman et al. (2001) Discomfort �0.36 1.01 27 32 2 1 2Auerbach et al. (2001) Distress to Limits 0.01 0.60 30 31 1 1 8Carter et al. (1999) Distress to Limits 0.17 0.83 43 44 1 1 8Clark et al. (1997) Distress to Limits �0.04 1.22 256 262 1 1 8Enns (1989) Distress to Limits �0.07 0.95 45 46 1 1 8Fish & Stifter (1993) Distress to Limits 0.00a 45 42 1 1 8Halpern, Brand, & Malone (2001) Distress to Limits 0.33 0.48 11 21 1 1 8Halpern, Brand, & Malone (2001) Distress to Limits �0.17 0.92 8 15 1 1 8Henderson et al. (2001) Distress to Limits 0.57 0.83 69 71 1 1 8Ispa et al. (2002) Distress to Limits 0.00a 45 37 3 1 8Kochanska et al. (1998) Distress to Limits �0.02 1.32 56 56 1 2 8Leve et al. (2001) Distress to Limits �0.19 0.73 32 28 1 1 8Pauli-Pott et al. (1999) Distress to Limits �0.04 0.55 20 20 1 1 8Pauli-Pott et al. (1999) Distress to Limits 0.01 0.70 20 19 1 1 8Pauli-Pott et al. (2000) Distress to Limits 0.21 0.70 58 43 1 1 8Plunkett et al. (1989) Distress to Limits 0.00a 42 29 2 1 8Rothbart (1986) Distress to Limits �0.25 0.95 23 23 1 4 19Stifter & Jain (1996) Distress to Limits 0.07 0.58 51 36 1 1 8Stifter (1988) Distress to Limits 0.00a 30 33 1 1 8Worobey (1998) Distress to Limits 0.00 0.78 40 40 1 1 8Zahn-Waxler et al. (1996) Distress to Limits �0.27 1.03 251 250 2 4 21Ackland (2001) Fear 0.00a 25 25 2 1 16Ahadi et al. (1993) Fear �0.22 0.62 59 94 3 1 2Ahadi et al. (1993) Fear 0.14 0.94 221 246 3 1 2Auerbach et al. (2001) Fear �0.18 1.56 30 31 1 1 8Carter et al. (1999) Fear �0.01 1.06 43 44 1 1 8Clark et al. (1997) Fear 0.03 1.09 256 262 1 1 8Colder et al. (2002) Fear �0.15 1.04 278 239 1 1 8Denham et al. (2001) Fear 0.03 0.97 52 45 2 2 2Dettling et al. (1999) Fear 0.29 1.09 31 22 3 1 2Dettling et al. (2000) Fear 0.15 0.64 6 13 2 1 2Enns (1989) Fear �0.56 0.59 45 46 1 1 8Garstein & Rothbart (2003) Fear �0.42 0.83 155 165 2 1 7Gonzalez et al. (2001) Fear �0.22 1.62 69 65 3 1 2Halpern, Brand, & Malone (2001) Fear �0.16 0.64 11 21 1 1 8Halpern, Brand, & Malone (2001) Fear �0.80 0.82 8 15 1 1 8Henderson et al. (2001) Fear �0.02 0.73 69 71 1 1 8Ispa et al. (2002) Fear 0.00a 45 37 3 1 8Kochanska (1998) Fear �0.50 0.85 56 56 2 1 8Kochanska et al. (1998) Fear �0.34 1.12 56 56 1 2 8Leve et al. (2001) Fear �0.01 2.25 32 28 1 1 8Miller (2002) Fear 0.22 1.40 30 33 2 1 2Pauli-Pott et al. (1999) Fear 0.42 0.53 20 19 1 1 8
47GENDER DIFFERENCES IN TEMPERAMENT

Table 2 (continued )
Study Dimension d VR NM NF Age Source Scale
Psychobiological (continued)
Pauli-Pott et al. (1999) Fear �0.07 2.02 20 20 1 1 8Pauli-Pott et al. (2000) Fear 0.03 0.89 58 43 1 1 8Plunkett et al. (1989) Fear 0.00a 42 29 2 1 8Putnam (2003) Fear �0.24 0.84 57 57 2 1 7Rothbart (1986) Fear �0.42 0.69 23 23 1 4 19Rundman (2001) Fear �0.01 1.08 46 42 2 1 16Schwebel & Plumert (1999) Fear 0.46 0.84 30 29 3 1 2Schwebel (2001) Fear �0.33 0.93 32 31 3 4 2Schwebel (2003) Fear �0.08 1.21 28 28 2 3 2Schwebel et al. (1999) Fear �0.26 1.00 51 49 2 3 2Stifter & Jain (1996) Fear �0.16 1.39 51 36 1 1 8Stifter (1988) Fear 0.00a 30 33 1 1 8Susman et al. (2001) Fear 0.09 0.60 27 32 2 1 2Worobey (1998) Fear �0.19 0.88 40 40 1 1 8Wulfsohn (2000) Fear �0.35 44 56 2 1 16Zahn-Waxler et al. (1996) Fear �0.14 0.63 251 250 2 4 21Dettling et al. (1999) Negative affectivity 0.01 0.70 34 32 2 1 16Dettling et al. (1999) Negative affectivity 0.02 1.90 31 22 3 1 2Dettling et al. (2000) Negative affectivity 0.31 2.29 8 13 2 1 2Donzella et al. (2000) Negative affectivity �0.32 0.93 35 26 2 3 2Gunnar et al. (1997) Negative affectivity 0.00a 14 12 2 1 2Gunnar et al. (1997) Negative affectivity 0.00a 32 14 2 3 2Lemery (2000) Negative affectivity �0.06 0.82 282 266 3 2 2Goldsmith (1996) Pleasure �0.30 506 506 2 1 16Henderson et al. (2001) Pleasure �0.03 0.74 69 70 2 1 16Kochanska et al. (1998) Pleasure �0.03 1.10 53 53 2 1 16Rundman (2001) Pleasure 0.20 1.37 46 42 2 1 16Steir & Lehman (2000) Pleasure �0.12 1.66 24 26 2 1 16Wulfsohn (2000) Pleasure 0.04 44 56 2 1 16Ahadi et al. (1993) Sadness �0.33 0.52 59 94 3 1 2Ahadi et al. (1993) Sadness 0.31 1.24 221 246 3 1 2Clark et al. (1997) Sadness �0.12 1.23 238 251 2 1 2Denham et al. (2001) Sadness �0.48 1.08 52 45 2 2 2Dettling et al. (1999) Sadness �0.17 0.86 34 32 2 1 16Dettling et al. (1999) Sadness �0.50 2.30 31 22 3 1 2Dettling et al. (2000) Sadness 0.74 1.73 8 13 2 1 2Garstein & Rothbart (2003) Sadness �0.02 1.35 155 165 2 1 7Gonzalez et al. (2001) Sadness �0.47 1.25 69 65 3 1 2Miller (2002) Sadness 0.40 1.49 30 33 2 1 2Putnam (2003) Sadness �0.10 1.93 57 57 2 1 7Schwebel (2001) Sadness �0.35 0.91 32 31 3 4 2Schwebel (2003) Sadness 0.08 1.15 28 28 2 3 2Schwebel et al. (1999) Sadness �0.11 0.91 51 49 2 3 2Schwebel & Plumert (1999) Sadness 0.00 1.03 30 29 3 1 2Susman et al. (2001) Sadness �0.04 1.27 27 32 2 1 2Ahadi et al. (1993) Soothability 0.00 0.55 59 94 3 1 2Ahadi et al. (1993) Soothability �0.12 1.04 221 246 3 1 2Auerbach et al. (2001) Soothability �0.12 0.89 30 31 1 1 8Carter et al. (1999) Soothability 0.19 1.34 43 44 1 1 8Clark et al. (1997) Soothability 0.09 1.31 256 262 1 1 8Crockenberg & Acredolo (1983) Soothability 1.12 28 28 1 1 8Denham et al. (2001) Soothability �0.09 0.80 52 45 2 2 2Dettling et al. (1999) Soothability �0.24 1.09 31 22 3 1 2Dettling et al. (2000) Soothability �0.06 1.56 6 13 2 1 2Enns (1989) Soothability 0.24 1.16 45 46 1 1 8Garstein & Rothbart (2003) Soothability 0.26 0.73 155 165 2 1 7Gonzalez et al. (2001) Soothability 0.47 0.81 69 65 3 1 2Halpern, Brand, & Malone (2001) Soothability �0.18 1.10 11 21 1 1 8Halpern, Brand, & Malone (2001) Soothability 0.16 1.15 8 15 1 1 8Henderson et al. (2001) Soothability �0.07 0.73 68 71 1 1 8Kochanska et al. (1998) Soothability 0.04 1.16 56 56 1 2 8Miller (2002) Soothability �0.21 1.07 30 33 2 1 2Pauli-Pott et al. (1999) Soothability �0.08 1.30 20 19 1 1 8Pauli-Pott et al. (1999) Soothability 0.58 1.56 20 20 1 1 8Pauli-Pott et al. (2000) Soothability �0.20 0.56 58 43 1 1 8Plunkett et al. (1989) Soothability 0.00a 42 29 2 1 8Putnam (2003) Soothability �0.05 1.03 57 57 2 1 7Schwebel (2001) Soothability 0.08 0.90 32 31 3 4 2
48 ELSE-QUEST, HYDE, GOLDSMITH, AND VAN HULLE
working, or middle-upper class, or mixed/unspecified or unreported); (h)ethnicity of sample (e.g., at least 85% white, Hispanic, African American,Asian American, other, or mixed/unspecified or unreported); (i) nationalityof sample (e.g., American/Canadian, European, Australian/New Zealander,Asian, African, Central/South American, or Middle Eastern); and (j)whether the sample was part of a longitudinal study that might be reportedon in other articles.
We were able to compute pooled mean effect sizes for 38 dimensions.Across all dimensions, the current study analyzes k � 1191 effect sizesaccounting for a total of n � 236,102 temperament ratings. See Table 4 fora listing of number of effect sizes and individual assessments bydimension.
Interrater agreement. Nicole M. Else-Quest coded all articles, and anundergraduate research assistant double-coded 75% of them. We obtained95% interrater agreement on study eligibility. The interrater agreement onother variables (including sample size, source of temperament, sampletype, socioeconomic status, and ethnicity) was in the range of � � .65–.93(88%–100%). Discrepancies were resolved by discussion after a review ofthe article.
Statistical Analyses
Mean difference effect sizes. Formulae for the effect size, d, andhomogeneity tests were taken from Hedges and Becker (1986). We com-puted the effect size d by subtracting the mean score for girls from themean score for boys, divided by the within-groups standard deviation.Means and standard deviations were available for 797 (66.9%) of the 1,191effects.
For 88 (7.4%) of the effects, Pearson correlations between gender andthe temperament dimension were provided. These were converted to daccording to the formula provided by Cohen (1988):
d � 2r/��1 � r2�
When articles were missing statistical information necessary for com-putation of effect sizes, we contacted first authors for further information.If authors did not respond with data, and those articles reported that genderdifferences in temperament were nonsignificant, we estimated d to be 0.This was the case for 306 (25.7%) of the effects. These conservativeestimated effect sizes are included in secondary meta-analyses in thecurrent study. There were no cases in which gender differences werereported statistically significant without accompanying test statistics ordescriptive statistics allowing for effect size computation.
Positive values of d represent higher scores for boys than girls, whereasnegative values represent higher scores for girls. Cohen (1988) providedguidelines for the interpretation of effect sizes. Effect sizes of d � 0.20,0.50, and 0.80 are considered small, medium, and large, respectively.Computed and estimated effect sizes are shown in Tables 1, 2, and 3, alongwith corresponding study information. For the estimation of populationeffect sizes, all effect sizes were corrected for bias, using the formulaprovided by Hedges and Becker (1986).
Variance ratios. Variance ratios (VR) were computed by dividing themale variance by the female variance, such that a VR greater than 1corresponds to greater male variability, whereas a VR less than 1 corre-sponds to greater female variability. For the purposes of aggregating theVR for the current meta-analysis, a base-10 log transform was performedon each VR (Hedges & Friedman, 1993; see Katzman & Alliger, 1992, fora discussion of transforming VR in meta-analysis). Of the 1,191 usableeffects, 796 (66.8%) VR were calculated. Untransformed VR are presentedin Tables 1, 2, and 3 with corresponding study information.
Random-effects model. Traditionally, meta-analyses have been basedon fixed-effects models, which consider effect size parameters to be fixedbut unknown constants (Hedges & Vevea, 1998). These constants areestimated in conjunction with assumptions about the homogeneity of effectsizes. However, fixed-effects models can only make conditional inferencesabout the sample of effect sizes used, while random-effects models canmake unconditional inferences about the population. The random-effectsmodel considers effect size parameters to be randomly sampled effectparameters and estimates the corresponding hyperparameters based on thispopulation. In addition, when a sample of effect sizes is significantlyheterogeneous, random-effects models are appropriate. For these reasons,we conducted the current meta-analysis using the random-effects model,with the formulae provided by Hedges and Vevea (1998).
Results
For reasons provided in the Introduction, we analyzed majortemperament dimensions within each of the three approaches. Asa rubric to organize our presentation, we use the broad factors,identified by Shiner and Caspi (2003), of effortful control, nega-tive affectivity, and surgency.
(text continues on page 57)
Table 2 (continued )
Study Dimension d VR NM NF Age Source Scale
Psychobiological (continued)
Schwebel (2003) Soothability �0.32 0.62 28 28 2 3 2Schwebel et al. (1999) Soothability �0.23 0.96 51 49 2 3 2Schwebel & Plumert (1999) Soothability �0.25 1.28 30 29 3 1 2Stifter (1988) Soothability 0.00a 30 33 1 1 8Stifter & Jain (1996) Soothability 0.07 1.41 51 36 1 1 8Susman (2001) Soothability 0.15 1.27 27 32 2 1 2Worobey (1998) Soothability �0.03 0.34 40 40 1 1 8Zimmermann (1998) Soothability 0.34 0.27 27 26 2 1 2
Note. d � uncorrected effect size; subscript a � estimated effect size; VR � untransformed variance ratio; NM � n males; NF � n females; Age: 1 �infant (3–12 months), 2 � toddler and preschool (13–60 months), 3 � school age (61–156 months); Source: 1 � mother report, 2 � father report, 3 �teacher report, 4 � lab observation, 5 � self report; Measure: 1 � Behavioral Style Questionnaire; 2 � Child Behavior Questionnaire; 3 � ColoradoChildhood Temperament Inventory; 4 � Child Temperament Questionnaire; 5 � Dimensions of Temperament Survey; 6 � Emotionality, Activity,Sociability, Impulsivity; 7 � Early Childhood Behavior Questionnaire; 8 � Infant Behavior Questionnaire; 9 � Infant Characteristics Questionnaire; 10 �Infant Temperament Questionnaire; 11 � Middle Childhood Temperament Questionnaire; 12 � Parent Temperament Questionnaire; 13 � School-AgeTemperament Inventory (McClowry, 1995); 14 � Temperament Assessment Battery; 15 � Toddler Behavior Assessment Questionnaire; 16 � ToddlerTemperament Questionnaire; 17 � Toddler Temperament Scale; 18 � Other.
49GENDER DIFFERENCES IN TEMPERAMENT
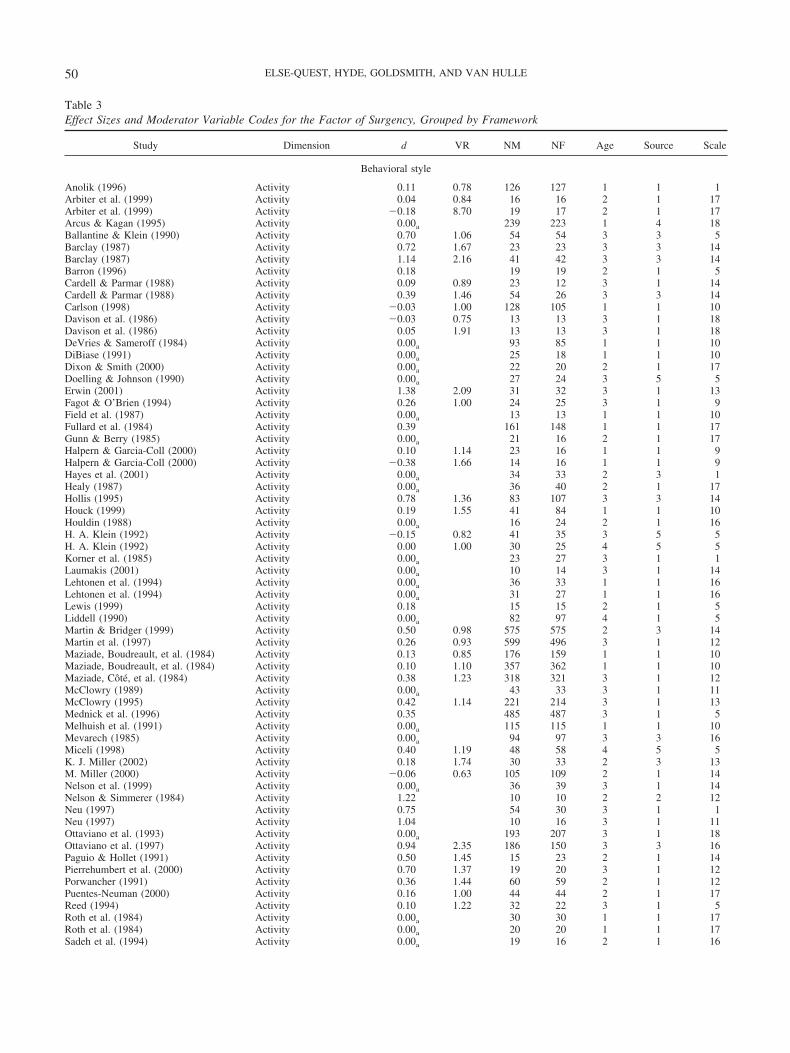
Table 3Effect Sizes and Moderator Variable Codes for the Factor of Surgency, Grouped by Framework
Study Dimension d VR NM NF Age Source Scale
Behavioral style
Anolik (1996) Activity 0.11 0.78 126 127 1 1 1Arbiter et al. (1999) Activity 0.04 0.84 16 16 2 1 17Arbiter et al. (1999) Activity �0.18 8.70 19 17 2 1 17Arcus & Kagan (1995) Activity 0.00a 239 223 1 4 18Ballantine & Klein (1990) Activity 0.70 1.06 54 54 3 3 5Barclay (1987) Activity 0.72 1.67 23 23 3 3 14Barclay (1987) Activity 1.14 2.16 41 42 3 3 14Barron (1996) Activity 0.18 19 19 2 1 5Cardell & Parmar (1988) Activity 0.09 0.89 23 12 3 1 14Cardell & Parmar (1988) Activity 0.39 1.46 54 26 3 3 14Carlson (1998) Activity �0.03 1.00 128 105 1 1 10Davison et al. (1986) Activity �0.03 0.75 13 13 3 1 18Davison et al. (1986) Activity 0.05 1.91 13 13 3 1 18DeVries & Sameroff (1984) Activity 0.00a 93 85 1 1 10DiBiase (1991) Activity 0.00a 25 18 1 1 10Dixon & Smith (2000) Activity 0.00a 22 20 2 1 17Doelling & Johnson (1990) Activity 0.00a 27 24 3 5 5Erwin (2001) Activity 1.38 2.09 31 32 3 1 13Fagot & O’Brien (1994) Activity 0.26 1.00 24 25 3 1 9Field et al. (1987) Activity 0.00a 13 13 1 1 10Fullard et al. (1984) Activity 0.39 161 148 1 1 17Gunn & Berry (1985) Activity 0.00a 21 16 2 1 17Halpern & Garcia-Coll (2000) Activity 0.10 1.14 23 16 1 1 9Halpern & Garcia-Coll (2000) Activity �0.38 1.66 14 16 1 1 9Hayes et al. (2001) Activity 0.00a 34 33 2 3 1Healy (1987) Activity 0.00a 36 40 2 1 17Hollis (1995) Activity 0.78 1.36 83 107 3 3 14Houck (1999) Activity 0.19 1.55 41 84 1 1 10Houldin (1988) Activity 0.00a 16 24 2 1 16H. A. Klein (1992) Activity �0.15 0.82 41 35 3 5 5H. A. Klein (1992) Activity 0.00 1.00 30 25 4 5 5Korner et al. (1985) Activity 0.00a 23 27 3 1 1Laumakis (2001) Activity 0.00a 10 14 3 1 14Lehtonen et al. (1994) Activity 0.00a 36 33 1 1 16Lehtonen et al. (1994) Activity 0.00a 31 27 1 1 16Lewis (1999) Activity 0.18 15 15 2 1 5Liddell (1990) Activity 0.00a 82 97 4 1 5Martin & Bridger (1999) Activity 0.50 0.98 575 575 2 3 14Martin et al. (1997) Activity 0.26 0.93 599 496 3 1 12Maziade, Boudreault, et al. (1984) Activity 0.13 0.85 176 159 1 1 10Maziade, Boudreault, et al. (1984) Activity 0.10 1.10 357 362 1 1 10Maziade, Cote, et al. (1984) Activity 0.38 1.23 318 321 3 1 12McClowry (1989) Activity 0.00a 43 33 3 1 11McClowry (1995) Activity 0.42 1.14 221 214 3 1 13Mednick et al. (1996) Activity 0.35 485 487 3 1 5Melhuish et al. (1991) Activity 0.00a 115 115 1 1 10Mevarech (1985) Activity 0.00a 94 97 3 3 16Miceli (1998) Activity 0.40 1.19 48 58 4 5 5K. J. Miller (2002) Activity 0.18 1.74 30 33 2 3 13M. Miller (2000) Activity �0.06 0.63 105 109 2 1 14Nelson et al. (1999) Activity 0.00a 36 39 3 1 14Nelson & Simmerer (1984) Activity 1.22 10 10 2 2 12Neu (1997) Activity 0.75 54 30 3 1 1Neu (1997) Activity 1.04 10 16 3 1 11Ottaviano et al. (1993) Activity 0.00a 193 207 3 1 18Ottaviano et al. (1997) Activity 0.94 2.35 186 150 3 3 16Paguio & Hollet (1991) Activity 0.50 1.45 15 23 2 1 14Pierrehumbert et al. (2000) Activity 0.70 1.37 19 20 3 1 12Porwancher (1991) Activity 0.36 1.44 60 59 2 1 12Puentes-Neuman (2000) Activity 0.16 1.00 44 44 2 1 17Reed (1994) Activity 0.10 1.22 32 22 3 1 5Roth et al. (1984) Activity 0.00a 30 30 1 1 17Roth et al. (1984) Activity 0.00a 20 20 1 1 17Sadeh et al. (1994) Activity 0.00a 19 16 2 1 16
50 ELSE-QUEST, HYDE, GOLDSMITH, AND VAN HULLE

Table 3 (continued )
Study Dimension d VR NM NF Age Source Scale
Behavioral style (continued)
Sadeh et al. (1994) Activity 0.00a 37 26 2 1 16Sanson et al. (1985) Activity 0.05 1.03 1276 1164 1 1 10Schoen & Nagle (1994) Activity 0.98 1.99 61 91 2 3 14Schoen (1990) Activity 0.98 2.01 61 91 2 3 14Schor (1983) Activity 0.00a 12 13 2 1 1Schor (1985) Activity 0.00a 58 21 3 1 1Sull (1995) Activity 0.56 0.80 38 51 2 1 1Vitaro et al. (2002) Activity �0.02 1.00 2408 2251 3 1 5Von Bargen (1987) Activity �0.16 50 41 2 1 1Weissbluth (1984) Activity 0.00a 26 24 2 1 1Wertlieb et al. (1987) Activity 0.00a 79 79 3 1 11Wertlieb et al. (1987) Activity 0.00a 79 79 3 1 11Wertlieb et al. (1988) Activity 0.00a 73 67 3 1 11Wills et al. (2000) Activity 0.11 0.91 410 484 4 5 5Wills et al. (2001) Activity 0.12 1.00 922 952 4 5 5Yolton (1993) Activity 0.33 1.84 20 18 2 4 17Anolik (1996) Approach �0.14 0.90 126 127 1 1 1Arbiter et al. (1999) Approach �0.52 0.56 16 16 2 1 17Arbiter et al. (1999) Approach �0.21 0.59 19 17 2 1 17Ballantine & Klein (1990) Approach 0.15 0.77 54 54 3 3 5Barclay (1987) Approach 0.20 0.68 23 23 3 3 14Barclay (1987) Approach �0.14 0.70 41 42 3 3 14Barron (1996) Approach 0.08 19 19 2 1 5Cardell & Parmar (1988) Approach �0.11 0.94 23 12 3 3 14Cardell & Parmar (1988) Approach 0.60 1.09 54 26 3 3 14Carlson (1998) Approach 0.04 0.93 128 105 1 1 10Davison et al. (1986) Approach 0.70 0.13 13 13 3 1 18Davison et al. (1986) Approach �0.31 2.26 13 13 3 1 18DeVries & Sameroff (1984) Approach 0.00a 93 85 1 1 10DiBiase (1991) Approach 0.00a 25 18 1 1 10Dixon & Smith (2000) Approach 0.00a 22 20 2 1 17Doelling & Johnson (1990) Approach 0.00a 27 24 3 5 5Fagan (1989) Approach �0.40 0.84 20 64 3 3 14Field et al. (1987) Approach 0.00a 13 13 1 1 10Fullard et al. (1984) Approach �0.58 161 148 1 1 17Gibson et al. (2000) Approach �0.30 1.07 34 31 1 1 18Gibson et al. (2000) Approach �0.09 1.55 31 30 1 1 18K. B. Guerin (1995) Approach �0.36 2.07 33 43 4 5 5Gunn & Berry (1985) Approach 0.00a 21 16 2 1 17Halpern et al. (1994) Approach 0.00a 13 8 1 4 18Hayes et al. (2001) Approach 0.00a 34 33 2 3 1Healy (1987) Approach 0.00a 36 40 2 1 17Hess & Atkins (1998) Approach �0.51 1.16 239 231 3 3 16Hollis (1995) Approach 0.02 1.12 83 107 3 3 14Houck (1999) Approach 0.08 1.14 41 84 1 1 10Houldin (1988) Approach 0.00a 16 24 2 1 16H. A. Klein (1992) Approach 0.00 0.73 30 25 4 5 5H. A. Klein (1992) Approach 0.00 1.09 41 35 3 5 5Korner et al. (1985) Approach 0.00a 23 27 3 1 1Lewis (1999) Approach 0.08 15 15 2 1 5Liddell (1990) Approach 0.00a 82 97 4 1 5Maziade, Boudreault, et al. (1984) Approach �0.41 0.86 176 159 1 1 10Maziade, Boudreault, et al. (1984) Approach �0.16 1.17 357 362 1 1 10Maziade, Cote, et al. (1984) Approach �0.11 0.91 318 321 3 1 12McClowry (1989) Approach 0.00a 43 33 3 1 11McClowry (1995) Approach �0.46 1.12 221 214 3 1 13Melhuish et al. (1991) Approach 0.00a 115 115 1 1 10Mevarech (1985) Approach 0.00a 94 97 3 3 16K. J. Miller (2002) Approach �0.62 1.04 30 33 2 3 13M. Miller (2000) Approach 0.36 0.70 105 109 2 1 14Nelson & Simmerer (1984) Approach 0.20 10 10 2 2 12Neu (1997) Approach 0.00a 54 30 3 1 1Neu (1997) Approach 0.00a 10 16 3 1 11Ottaviano et al. (1993) Approach 0.00a 193 207 3 1 18Ottaviano et al. (1997) Approach 0.00a 186 150 3 3 16Paguio & Hollet (1991) Approach �0.14 0.90 15 23 2 1 14Parritz (1996) Approach 0.00a 18 18 1 1 17Pierrehumbert et al. (2000) Approach 0.14 0.86 19 20 3 1 12
51GENDER DIFFERENCES IN TEMPERAMENT

Table 3 (continued )
Study Dimension d VR NM NF Age Source Scale
Behavioral style (continued)
Puentes-Neuman (2000) Approach �0.18 1.16 44 44 2 1 17Reed (1994) Approach 0.16 1.42 32 22 3 1 5Roth et al. (1984) Approach 0.00a 30 30 1 1 17Roth et al. (1984) Approach 0.00a 20 20 1 1 17Sadeh et al. (1994) Approach 0.00a 19 16 2 1 16Sadeh et al. (1994) Approach 0.00a 37 26 2 1 16Sanson et al. (1985) Approach �0.16 0.81 1276 1164 1 1 10Schoen (1990) Approach 0.13 0.68 61 91 2 3 14Schoen & Nagle (1994) Approach 0.13 0.69 61 91 2 3 14Schor (1983) Approach 0.00a 12 13 2 1 1Schor (1985) Approach 0.00a 58 21 3 1 1Simons (1983) Approach 0.11 0.71 22 18 1 1 10Sull (1995) Approach 0.08 0.52 38 51 2 1 1Vitaro et al. (2002) Approach 0.00 1.00 2408 2251 3 1 5Von Bargen (1987) Approach �0.16 50 41 2 1 1Wertlieb et al. (1987) Approach 0.00a 79 79 3 1 11Wertlieb et al. (1987) Approach 0.00a 79 79 3 1 11Wertlieb et al. (1988) Approach 0.00a 73 67 3 1 11Yolton (1993) Approach �0.49 0.96 20 18 2 4 17Anolik (1996) Mood �0.07 1.27 126 127 1 1 1Arbiter et al. (1999) Mood �0.05 0.52 16 16 2 1 17Arbiter et al. (1999) Mood �0.06 1.52 19 17 2 1 17Arcus & Kagan (1995) Mood 0.00a 239 223 1 4 18Arcus & Kagan (1995) Mood 0.00a 239 223 1 4 18Ballantine & Klein (1990) Mood 0.07 0.82 54 54 3 3 5Carlson (1998) Mood 0.04 0.91 128 105 1 1 10Davison et al. (1986) Mood �0.06 0.35 13 13 3 1 18Davison et al. (1986) Mood �0.25 0.76 13 13 3 1 18DeVries & Sameroff (1984) Mood 0.00a 93 85 1 1 10DiBiase (1991) Mood 0.00a 25 18 1 1 10Dixon & Smith (2000) Mood 0.00a 22 20 2 1 17Doelling & Johnson (1990) Mood 0.00a 27 24 3 5 5Field et al. (1987) Mood 0.00a 13 13 1 1 10Fullard et al. (1984) Mood �0.24 161 148 1 1 17K. B. Guerin (1995) Mood �0.65 2.19 33 43 4 5 5Gumora (2000) Mood �0.24 52 51 4 5 5Gunn & Berry (1985) Mood 0.00a 21 16 2 1 17Halpern et al. (1994) Mood 0.00a 13 8 1 4 18Hayes et al. (2001) Mood 0.00a 34 33 2 3 1Healy (1987) Mood 0.00a 36 40 2 1 17Hess & Atkins (1998) Mood �0.32 1.23 239 231 3 3 16Hess & Atkins (1998) Mood 0.32 1.56 239 231 3 3 16Houck (1999) Mood �0.01 1.54 41 84 1 1 10Houldin (1988) Mood 0.00a 16 24 2 1 16H. A. Klein (1992) Mood 0.34 0.71 30 25 4 5 5H. A. Klein (1992) Mood �0.57 1.78 41 35 3 5 5Korner et al. (1985) Mood 0.00a 23 27 3 1 1Laumakis (2001) Mood 0.00a 10 14 3 1 14Lehtonen et al. (1994) Mood 0.00a 36 33 1 1 16Lehtonen et al. (1994) Mood 0.00a 31 27 1 1 16Lengua et al. (2000) Mood �0.58 115 116 4 1 5Liddell (1990) Mood 0.00a 82 97 4 1 5Martin et al. (1997) Mood �0.04 1.13 599 496 3 1 12Maziade, Boudreault, et al. (1984) Mood �0.03 1.09 357 362 1 1 10Maziade, Boudreault, et al. (1984) Mood �0.23 1.12 176 159 1 1 10Maziade, Cote, et al. (1984) Mood �0.39 1.03 318 321 3 1 12McClowry (1989) Mood 0.00a 43 33 3 1 11McClowry (1995) Mood 0.09 0.86 221 214 3 1 13Melhuish et al. (1991) Mood 0.00a 115 115 1 1 10Mevarech (1985) Mood 0.00a 94 97 3 3 16Miceli (1998) Mood �0.35 1.21 48 58 4 5 5Miceli (1998) Mood 0.50 1.49 48 58 4 5 5Nelson & Simmerer (1984) Mood 0.20 10 10 2 2 12Neu (1997) Mood 0.77 10 16 3 1 11Neu (1997) Mood 0.00a 54 30 3 1 1Ottaviano et al. (1993) Mood 0.00a 193 207 3 1 18Ottaviano et al. (1997) Mood 0.41 1.54 186 150 3 3 16Pierrehumbert et al. (2000) Mood �0.40 1.22 19 20 3 1 12
52 ELSE-QUEST, HYDE, GOLDSMITH, AND VAN HULLE
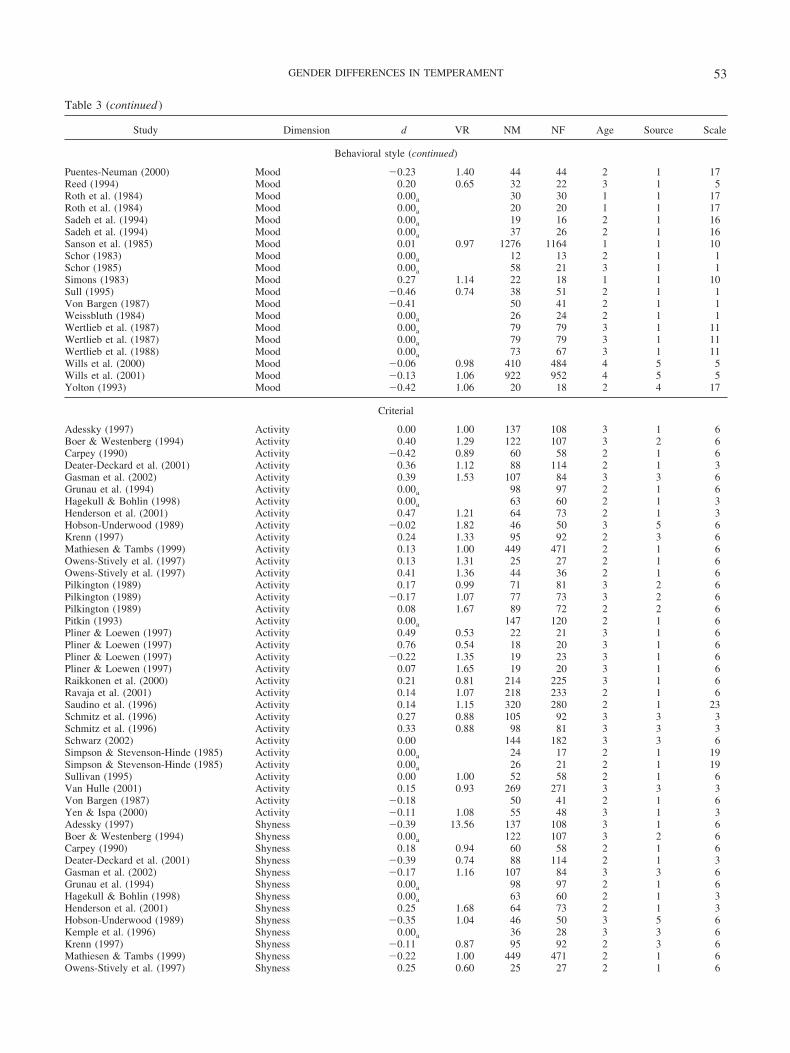
Table 3 (continued )
Study Dimension d VR NM NF Age Source Scale
Behavioral style (continued)
Puentes-Neuman (2000) Mood �0.23 1.40 44 44 2 1 17Reed (1994) Mood 0.20 0.65 32 22 3 1 5Roth et al. (1984) Mood 0.00a 30 30 1 1 17Roth et al. (1984) Mood 0.00a 20 20 1 1 17Sadeh et al. (1994) Mood 0.00a 19 16 2 1 16Sadeh et al. (1994) Mood 0.00a 37 26 2 1 16Sanson et al. (1985) Mood 0.01 0.97 1276 1164 1 1 10Schor (1983) Mood 0.00a 12 13 2 1 1Schor (1985) Mood 0.00a 58 21 3 1 1Simons (1983) Mood 0.27 1.14 22 18 1 1 10Sull (1995) Mood �0.46 0.74 38 51 2 1 1Von Bargen (1987) Mood �0.41 50 41 2 1 1Weissbluth (1984) Mood 0.00a 26 24 2 1 1Wertlieb et al. (1987) Mood 0.00a 79 79 3 1 11Wertlieb et al. (1987) Mood 0.00a 79 79 3 1 11Wertlieb et al. (1988) Mood 0.00a 73 67 3 1 11Wills et al. (2000) Mood �0.06 0.98 410 484 4 5 5Wills et al. (2001) Mood �0.13 1.06 922 952 4 5 5Yolton (1993) Mood �0.42 1.06 20 18 2 4 17
Criterial
Adessky (1997) Activity 0.00 1.00 137 108 3 1 6Boer & Westenberg (1994) Activity 0.40 1.29 122 107 3 2 6Carpey (1990) Activity �0.42 0.89 60 58 2 1 6Deater-Deckard et al. (2001) Activity 0.36 1.12 88 114 2 1 3Gasman et al. (2002) Activity 0.39 1.53 107 84 3 3 6Grunau et al. (1994) Activity 0.00a 98 97 2 1 6Hagekull & Bohlin (1998) Activity 0.00a 63 60 2 1 3Henderson et al. (2001) Activity 0.47 1.21 64 73 2 1 3Hobson-Underwood (1989) Activity �0.02 1.82 46 50 3 5 6Krenn (1997) Activity 0.24 1.33 95 92 2 3 6Mathiesen & Tambs (1999) Activity 0.13 1.00 449 471 2 1 6Owens-Stively et al. (1997) Activity 0.13 1.31 25 27 2 1 6Owens-Stively et al. (1997) Activity 0.41 1.36 44 36 2 1 6Pilkington (1989) Activity 0.17 0.99 71 81 3 2 6Pilkington (1989) Activity �0.17 1.07 77 73 3 2 6Pilkington (1989) Activity 0.08 1.67 89 72 2 2 6Pitkin (1993) Activity 0.00a 147 120 2 1 6Pliner & Loewen (1997) Activity 0.49 0.53 22 21 3 1 6Pliner & Loewen (1997) Activity 0.76 0.54 18 20 3 1 6Pliner & Loewen (1997) Activity �0.22 1.35 19 23 3 1 6Pliner & Loewen (1997) Activity 0.07 1.65 19 20 3 1 6Raikkonen et al. (2000) Activity 0.21 0.81 214 225 3 1 6Ravaja et al. (2001) Activity 0.14 1.07 218 233 2 1 6Saudino et al. (1996) Activity 0.14 1.15 320 280 2 1 23Schmitz et al. (1996) Activity 0.27 0.88 105 92 3 3 3Schmitz et al. (1996) Activity 0.33 0.88 98 81 3 3 3Schwarz (2002) Activity 0.00 144 182 3 3 6Simpson & Stevenson-Hinde (1985) Activity 0.00a 24 17 2 1 19Simpson & Stevenson-Hinde (1985) Activity 0.00a 26 21 2 1 19Sullivan (1995) Activity 0.00 1.00 52 58 2 1 6Van Hulle (2001) Activity 0.15 0.93 269 271 3 3 3Von Bargen (1987) Activity �0.18 50 41 2 1 6Yen & Ispa (2000) Activity �0.11 1.08 55 48 3 1 3Adessky (1997) Shyness �0.39 13.56 137 108 3 1 6Boer & Westenberg (1994) Shyness 0.00a 122 107 3 2 6Carpey (1990) Shyness 0.18 0.94 60 58 2 1 6Deater-Deckard et al. (2001) Shyness �0.39 0.74 88 114 2 1 3Gasman et al. (2002) Shyness �0.17 1.16 107 84 3 3 6Grunau et al. (1994) Shyness 0.00a 98 97 2 1 6Hagekull & Bohlin (1998) Shyness 0.00a 63 60 2 1 3Henderson et al. (2001) Shyness 0.25 1.68 64 73 2 1 3Hobson-Underwood (1989) Shyness �0.35 1.04 46 50 3 5 6Kemple et al. (1996) Shyness 0.00a 36 28 3 3 6Krenn (1997) Shyness �0.11 0.87 95 92 2 3 6Mathiesen & Tambs (1999) Shyness �0.22 1.00 449 471 2 1 6Owens-Stively et al. (1997) Shyness 0.25 0.60 25 27 2 1 6
53GENDER DIFFERENCES IN TEMPERAMENT

Table 3 (continued )
Study Dimension d VR NM NF Age Source Scale
Criterial (continued)
Owens-Stively et al. (1997) Shyness �0.01 2.41 44 36 2 1 6Pliner & Loewen (1997) Shyness �0.45 0.76 18 20 3 1 6Pliner & Loewen (1997) Shyness �0.31 0.88 22 21 3 1 6Pliner & Loewen (1997) Shyness 0.21 1.07 19 20 3 1 6Pliner & Loewen (1997) Shyness 0.06 1.46 19 23 3 1 6Rubin et al. (1999) Shyness 0.10 0.50 24 34 2 2 3Schmitz et al. (1999) Shyness �0.10 0.95 352 322 2 1 3Schwarz (2002) Shyness 0.00 144 182 3 3 6Simpson & Stevenson-Hinde (1985) Shyness 0.00a 24 17 2 1 19Simpson & Stevenson-Hinde (1985) Shyness 0.00a 26 21 2 1 19Van Hulle (2001) Shyness �0.11 1.04 264 218 2 1 3Von Bargen (1987) Shyness 0.37 50 41 2 1 6Adessky (1997) Sociability �0.10 1.06 137 108 3 1 6Boer & Westenberg (1994) Sociability 0.00a 122 107 3 2 6Carpey (1990) Sociability �0.15 0.88 60 58 2 1 6Deater-Deckard et al. (2001) Sociability 0.06 1.10 88 114 2 1 3Gasman et al. (2002) Sociability �0.06 1.00 107 84 3 3 6Grunau et al. (1994) Sociability 0.00a 98 97 2 1 6Hagekull & Bohlin (1998) Sociability 0.00a 63 60 2 1 3Henderson et al. (2001) Sociability �0.01 1.13 64 73 2 1 3Hobson-Underwood (1989) Sociability �0.02 0.89 46 50 3 5 6Krenn (1997) Sociability �0.04 0.88 95 92 2 3 6Mathiesen & Tambs (1999) Sociability 0.06 1.00 449 471 2 1 6Owens-Stively et al. (1997) Sociability 0.00 1.36 25 27 2 1 6Owens-Stively et al. (1997) Sociability 0.03 2.38 44 36 2 1 6Pilkington (1989) Sociability �0.16 0.75 72 82 3 2 6Pilkington (1989) Sociability 0.24 0.83 92 72 2 2 6Pilkington (1989) Sociability �0.16 1.20 76 73 3 2 6Pitkin (1993) Sociability 0.00a 147 120 2 1 6Pliner & Loewen (1997) Sociability 0.47 0.63 22 21 3 1 6Pliner & Loewen (1997) Sociability 0.42 0.73 18 20 3 1 6Pliner & Loewen (1997) Sociability �0.10 1.27 19 23 3 1 6Pliner & Loewen (1997) Sociability �0.77 1.63 19 20 3 1 6Schmitz et al. (1996) Sociability �0.09 0.62 86 69 3 3 3Schmitz et al. (1996) Sociability �0.16 1.08 85 80 3 3 3Schwarz (2002) Sociability 0.00 144 182 3 3 6Sullivan (1995) Sociability �0.36 1.44 52 58 2 1 6Van Hulle (2001) Sociability 0.12 0.77 269 271 3 3 3Von Bargen (1987) Sociability �0.47 50 41 2 1 6Wills et al. (2001) Sociability �0.18 1.21 922 952 3 5 6Wills & Stoolmiller (2002) Sociability �0.14 850 850 3 5 6
Psychobiological
Ahadi et al. (1993) Activity �0.55 1.02 221 246 3 1 2Ahadi et al. (1993) Activity 0.75 1.14 59 94 3 1 2Auerbach et al. (2001) Activity �0.12 0.98 30 31 1 1 8Carter et al. (1999) Activity 0.41 0.84 43 44 1 1 8Clark et al. (1997) Activity �0.06 0.97 256 262 1 1 8Colder et al. (2002) Activity 0.02 1.08 278 239 1 1 8Denham et al. (2001) Activity �0.21 1.52 52 45 2 2 2Dettling et al. (1999) Activity 0.64 0.65 34 32 2 1 16Dettling et al. (1999) Activity 0.88 0.94 31 22 3 1 2Dettling et al. (2000) Activity 0.55 0.94 8 13 2 1 2Enns (1989) Activity �0.29 0.74 45 46 1 1 8Garstein & Rothbart (2003) Activity 0.18 1.00 155 165 2 1 7Goldsmith (1996) Activity 0.16 506 506 2 1 16Gonzalez et al. (2001) Activity 0.36 0.85 69 65 3 1 2Henderson et al. (2001) Activity 0.15 0.77 69 71 1 1 8Kochanska et al. (1998) Activity �0.06 1.16 56 56 1 2 8K. J. Miller (2002) Activity 0.67 0.65 30 33 2 1 2Plumert & Schwebel (1997) Activity 0.66 1.28 16 16 3 1 2Plumert & Schwebel (1997) Activity 0.66 2.27 16 16 3 1 2Plunkett et al. (1989) Activity 0.00a 42 29 2 1 8Putnam (2003) Activity 0.37 0.87 57 57 2 1 7Rothbart (1986) Activity 0.13 0.79 23 23 1 4 19Rundman (2001) Activity 0.19 1.35 46 42 2 1 16Saudino & Eaton (1995) Activity 0.30 64 42 1 1 8
54 ELSE-QUEST, HYDE, GOLDSMITH, AND VAN HULLE
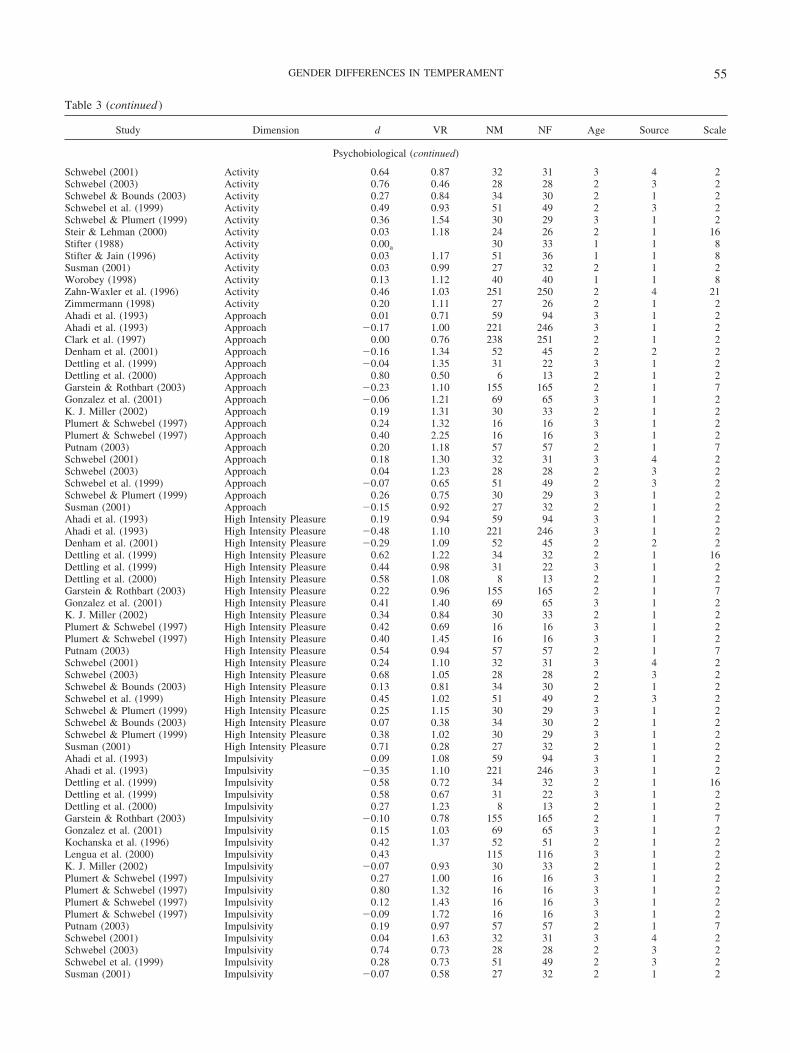
Table 3 (continued )
Study Dimension d VR NM NF Age Source Scale
Psychobiological (continued)
Schwebel (2001) Activity 0.64 0.87 32 31 3 4 2Schwebel (2003) Activity 0.76 0.46 28 28 2 3 2Schwebel & Bounds (2003) Activity 0.27 0.84 34 30 2 1 2Schwebel et al. (1999) Activity 0.49 0.93 51 49 2 3 2Schwebel & Plumert (1999) Activity 0.36 1.54 30 29 3 1 2Steir & Lehman (2000) Activity 0.03 1.18 24 26 2 1 16Stifter (1988) Activity 0.00a 30 33 1 1 8Stifter & Jain (1996) Activity 0.03 1.17 51 36 1 1 8Susman (2001) Activity 0.03 0.99 27 32 2 1 2Worobey (1998) Activity 0.13 1.12 40 40 1 1 8Zahn-Waxler et al. (1996) Activity 0.46 1.03 251 250 2 4 21Zimmermann (1998) Activity 0.20 1.11 27 26 2 1 2Ahadi et al. (1993) Approach 0.01 0.71 59 94 3 1 2Ahadi et al. (1993) Approach �0.17 1.00 221 246 3 1 2Clark et al. (1997) Approach 0.00 0.76 238 251 2 1 2Denham et al. (2001) Approach �0.16 1.34 52 45 2 2 2Dettling et al. (1999) Approach �0.04 1.35 31 22 3 1 2Dettling et al. (2000) Approach 0.80 0.50 6 13 2 1 2Garstein & Rothbart (2003) Approach �0.23 1.10 155 165 2 1 7Gonzalez et al. (2001) Approach �0.06 1.21 69 65 3 1 2K. J. Miller (2002) Approach 0.19 1.31 30 33 2 1 2Plumert & Schwebel (1997) Approach 0.24 1.32 16 16 3 1 2Plumert & Schwebel (1997) Approach 0.40 2.25 16 16 3 1 2Putnam (2003) Approach 0.20 1.18 57 57 2 1 7Schwebel (2001) Approach 0.18 1.30 32 31 3 4 2Schwebel (2003) Approach 0.04 1.23 28 28 2 3 2Schwebel et al. (1999) Approach �0.07 0.65 51 49 2 3 2Schwebel & Plumert (1999) Approach 0.26 0.75 30 29 3 1 2Susman (2001) Approach �0.15 0.92 27 32 2 1 2Ahadi et al. (1993) High Intensity Pleasure 0.19 0.94 59 94 3 1 2Ahadi et al. (1993) High Intensity Pleasure �0.48 1.10 221 246 3 1 2Denham et al. (2001) High Intensity Pleasure �0.29 1.09 52 45 2 2 2Dettling et al. (1999) High Intensity Pleasure 0.62 1.22 34 32 2 1 16Dettling et al. (1999) High Intensity Pleasure 0.44 0.98 31 22 3 1 2Dettling et al. (2000) High Intensity Pleasure 0.58 1.08 8 13 2 1 2Garstein & Rothbart (2003) High Intensity Pleasure 0.22 0.96 155 165 2 1 7Gonzalez et al. (2001) High Intensity Pleasure 0.41 1.40 69 65 3 1 2K. J. Miller (2002) High Intensity Pleasure 0.34 0.84 30 33 2 1 2Plumert & Schwebel (1997) High Intensity Pleasure 0.42 0.69 16 16 3 1 2Plumert & Schwebel (1997) High Intensity Pleasure 0.40 1.45 16 16 3 1 2Putnam (2003) High Intensity Pleasure 0.54 0.94 57 57 2 1 7Schwebel (2001) High Intensity Pleasure 0.24 1.10 32 31 3 4 2Schwebel (2003) High Intensity Pleasure 0.68 1.05 28 28 2 3 2Schwebel & Bounds (2003) High Intensity Pleasure 0.13 0.81 34 30 2 1 2Schwebel et al. (1999) High Intensity Pleasure 0.45 1.02 51 49 2 3 2Schwebel & Plumert (1999) High Intensity Pleasure 0.25 1.15 30 29 3 1 2Schwebel & Bounds (2003) High Intensity Pleasure 0.07 0.38 34 30 2 1 2Schwebel & Plumert (1999) High Intensity Pleasure 0.38 1.02 30 29 3 1 2Susman (2001) High Intensity Pleasure 0.71 0.28 27 32 2 1 2Ahadi et al. (1993) Impulsivity 0.09 1.08 59 94 3 1 2Ahadi et al. (1993) Impulsivity �0.35 1.10 221 246 3 1 2Dettling et al. (1999) Impulsivity 0.58 0.72 34 32 2 1 16Dettling et al. (1999) Impulsivity 0.58 0.67 31 22 3 1 2Dettling et al. (2000) Impulsivity 0.27 1.23 8 13 2 1 2Garstein & Rothbart (2003) Impulsivity �0.10 0.78 155 165 2 1 7Gonzalez et al. (2001) Impulsivity 0.15 1.03 69 65 3 1 2Kochanska et al. (1996) Impulsivity 0.42 1.37 52 51 2 1 2Lengua et al. (2000) Impulsivity 0.43 115 116 3 1 2K. J. Miller (2002) Impulsivity �0.07 0.93 30 33 2 1 2Plumert & Schwebel (1997) Impulsivity 0.27 1.00 16 16 3 1 2Plumert & Schwebel (1997) Impulsivity 0.80 1.32 16 16 3 1 2Plumert & Schwebel (1997) Impulsivity 0.12 1.43 16 16 3 1 2Plumert & Schwebel (1997) Impulsivity �0.09 1.72 16 16 3 1 2Putnam (2003) Impulsivity 0.19 0.97 57 57 2 1 7Schwebel (2001) Impulsivity 0.04 1.63 32 31 3 4 2Schwebel (2003) Impulsivity 0.74 0.73 28 28 2 3 2Schwebel et al. (1999) Impulsivity 0.28 0.73 51 49 2 3 2Susman (2001) Impulsivity �0.07 0.58 27 32 2 1 2
55GENDER DIFFERENCES IN TEMPERAMENT
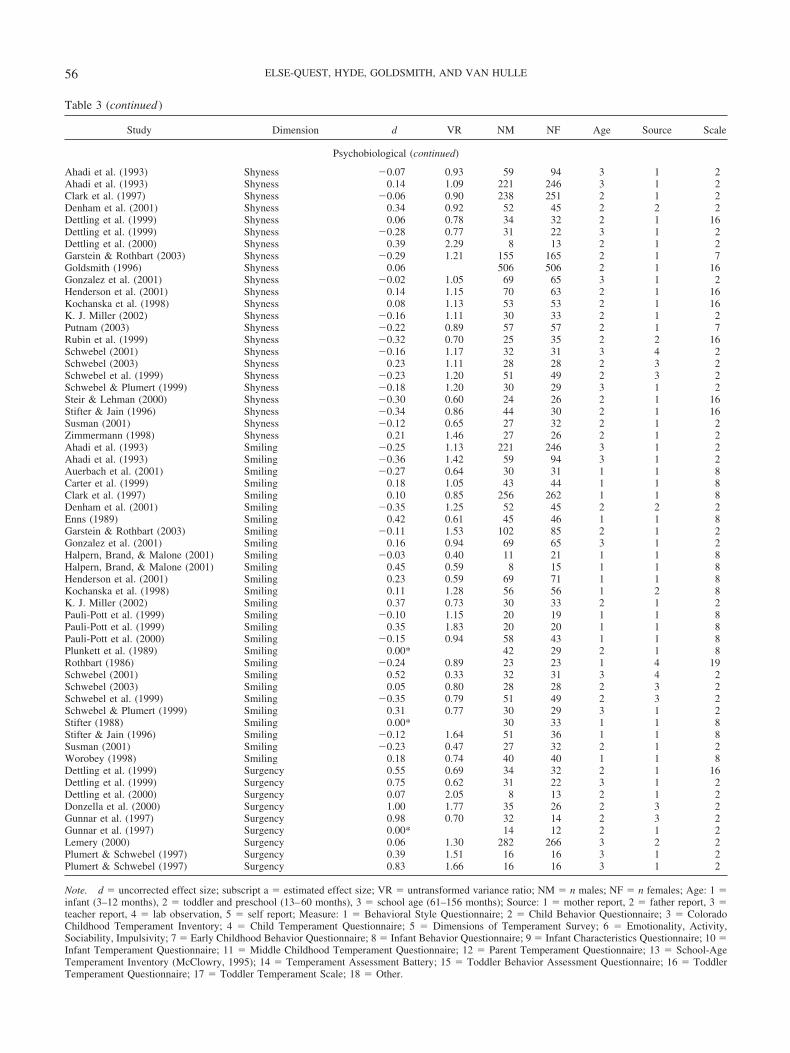
Table 3 (continued )
Study Dimension d VR NM NF Age Source Scale
Psychobiological (continued)
Ahadi et al. (1993) Shyness �0.07 0.93 59 94 3 1 2Ahadi et al. (1993) Shyness 0.14 1.09 221 246 3 1 2Clark et al. (1997) Shyness �0.06 0.90 238 251 2 1 2Denham et al. (2001) Shyness 0.34 0.92 52 45 2 2 2Dettling et al. (1999) Shyness 0.06 0.78 34 32 2 1 16Dettling et al. (1999) Shyness �0.28 0.77 31 22 3 1 2Dettling et al. (2000) Shyness 0.39 2.29 8 13 2 1 2Garstein & Rothbart (2003) Shyness �0.29 1.21 155 165 2 1 7Goldsmith (1996) Shyness 0.06 506 506 2 1 16Gonzalez et al. (2001) Shyness �0.02 1.05 69 65 3 1 2Henderson et al. (2001) Shyness 0.14 1.15 70 63 2 1 16Kochanska et al. (1998) Shyness 0.08 1.13 53 53 2 1 16K. J. Miller (2002) Shyness �0.16 1.11 30 33 2 1 2Putnam (2003) Shyness �0.22 0.89 57 57 2 1 7Rubin et al. (1999) Shyness �0.32 0.70 25 35 2 2 16Schwebel (2001) Shyness �0.16 1.17 32 31 3 4 2Schwebel (2003) Shyness 0.23 1.11 28 28 2 3 2Schwebel et al. (1999) Shyness �0.23 1.20 51 49 2 3 2Schwebel & Plumert (1999) Shyness �0.18 1.20 30 29 3 1 2Steir & Lehman (2000) Shyness �0.30 0.60 24 26 2 1 16Stifter & Jain (1996) Shyness �0.34 0.86 44 30 2 1 16Susman (2001) Shyness �0.12 0.65 27 32 2 1 2Zimmermann (1998) Shyness 0.21 1.46 27 26 2 1 2Ahadi et al. (1993) Smiling �0.25 1.13 221 246 3 1 2Ahadi et al. (1993) Smiling �0.36 1.42 59 94 3 1 2Auerbach et al. (2001) Smiling �0.27 0.64 30 31 1 1 8Carter et al. (1999) Smiling 0.18 1.05 43 44 1 1 8Clark et al. (1997) Smiling 0.10 0.85 256 262 1 1 8Denham et al. (2001) Smiling �0.35 1.25 52 45 2 2 2Enns (1989) Smiling 0.42 0.61 45 46 1 1 8Garstein & Rothbart (2003) Smiling �0.11 1.53 102 85 2 1 2Gonzalez et al. (2001) Smiling 0.16 0.94 69 65 3 1 2Halpern, Brand, & Malone (2001) Smiling �0.03 0.40 11 21 1 1 8Halpern, Brand, & Malone (2001) Smiling 0.45 0.59 8 15 1 1 8Henderson et al. (2001) Smiling 0.23 0.59 69 71 1 1 8Kochanska et al. (1998) Smiling 0.11 1.28 56 56 1 2 8K. J. Miller (2002) Smiling 0.37 0.73 30 33 2 1 2Pauli-Pott et al. (1999) Smiling �0.10 1.15 20 19 1 1 8Pauli-Pott et al. (1999) Smiling 0.35 1.83 20 20 1 1 8Pauli-Pott et al. (2000) Smiling �0.15 0.94 58 43 1 1 8Plunkett et al. (1989) Smiling 0.00* 42 29 2 1 8Rothbart (1986) Smiling �0.24 0.89 23 23 1 4 19Schwebel (2001) Smiling 0.52 0.33 32 31 3 4 2Schwebel (2003) Smiling 0.05 0.80 28 28 2 3 2Schwebel et al. (1999) Smiling �0.35 0.79 51 49 2 3 2Schwebel & Plumert (1999) Smiling 0.31 0.77 30 29 3 1 2Stifter (1988) Smiling 0.00* 30 33 1 1 8Stifter & Jain (1996) Smiling �0.12 1.64 51 36 1 1 8Susman (2001) Smiling �0.23 0.47 27 32 2 1 2Worobey (1998) Smiling 0.18 0.74 40 40 1 1 8Dettling et al. (1999) Surgency 0.55 0.69 34 32 2 1 16Dettling et al. (1999) Surgency 0.75 0.62 31 22 3 1 2Dettling et al. (2000) Surgency 0.07 2.05 8 13 2 1 2Donzella et al. (2000) Surgency 1.00 1.77 35 26 2 3 2Gunnar et al. (1997) Surgency 0.98 0.70 32 14 2 3 2Gunnar et al. (1997) Surgency 0.00* 14 12 2 1 2Lemery (2000) Surgency 0.06 1.30 282 266 3 2 2Plumert & Schwebel (1997) Surgency 0.39 1.51 16 16 3 1 2Plumert & Schwebel (1997) Surgency 0.83 1.66 16 16 3 1 2
Note. d � uncorrected effect size; subscript a � estimated effect size; VR � untransformed variance ratio; NM � n males; NF � n females; Age: 1 �infant (3–12 months), 2 � toddler and preschool (13–60 months), 3 � school age (61–156 months); Source: 1 � mother report, 2 � father report, 3 �teacher report, 4 � lab observation, 5 � self report; Measure: 1 � Behavioral Style Questionnaire; 2 � Child Behavior Questionnaire; 3 � ColoradoChildhood Temperament Inventory; 4 � Child Temperament Questionnaire; 5 � Dimensions of Temperament Survey; 6 � Emotionality, Activity,Sociability, Impulsivity; 7 � Early Childhood Behavior Questionnaire; 8 � Infant Behavior Questionnaire; 9 � Infant Characteristics Questionnaire; 10 �Infant Temperament Questionnaire; 11 � Middle Childhood Temperament Questionnaire; 12 � Parent Temperament Questionnaire; 13 � School-AgeTemperament Inventory (McClowry, 1995); 14 � Temperament Assessment Battery; 15 � Toddler Behavior Assessment Questionnaire; 16 � ToddlerTemperament Questionnaire; 17 � Toddler Temperament Scale; 18 � Other.
56 ELSE-QUEST, HYDE, GOLDSMITH, AND VAN HULLE

Effortful Control
Mean differences. Across all dimensions within the factor ofeffortful control, there were k � 200 computed effect sizes and k �58 estimated effect sizes. Meta-analysis was conducted on the setof computed effect sizes as well as on the set of computed andestimated effect sizes combined (k � 258). Nine dimensions, inaddition to the factor of effortful control, were examined forgender differences, for a total of 10 weighted mean effect sizes.Dimensions included distractibility and persistence from the be-havioral style approach; attention from the criterial approach; andattention focus, attention shifting, inhibitory control, interest, low-intensity pleasure, and perceptual sensitivity from the psychobio-logical approach. See Table 5 for mean weighted effect sizes, 95%
confidence intervals, sample sizes, and random effects homogene-ity statistics based on studies analyzing these dimensions. On thebasis of the k � 200 computed effect sizes, 8 of the 10 meanweighted effect sizes were significantly different from 0 ( p � .05).Notably, the gender difference in effortful control (analyzed as afactor in k � 6 studies) was very large, d � �1.01. Genderdifferences in attention, attention focus, and low-intensity pleasurewere significant and small in magnitude. Attention shifting andperceptual sensitivity displayed small to moderate gender differ-ences, and inhibitory control was moderate in magnitude. Allgender differences favored girls. For all dimensions, random ef-fects homogeneity statistics were nonsignificant; we concludedthat these samples of effect sizes were homogeneous and did notperform moderator analyses for them.
Table 4Number of Computed and Estimated Effect sizes (k) and Total Number of Individuals Assessed(n) for All Dimensions, Grouped by Factor
Approach Dimension k n
Effortful control
Behavioral style Distractibility 56 9,745Persistence 87 22,430
Criterial Attention span 9 2,187Psychobiological Attention focus 30 4,107
Attention shifting 12 1,279Effortful control 7 792Inhibitory control 23 2,876Interest 6 1,469Low intensity pleasure 14 1,757Perceptual sensitivity 14 1,757
Negative affectivity
Behavioral style Adaptability 73 11,956Difficulty 36 9,820Intensity 65 12,304Rhythmicity 56 15,354Threshold 46 14,254
Criterial Emotionality 35 8,475Psychobiological Anger/frustration 25 3,984
Difficulty 7 879Discomfort 15 1,825Distress to limits 20 2,321Fear 38 4,858Negative affectivity 7 821Pleasure 6 1,495Sadness 16 2,314Soothability 31 3,410
Surgency
Behavioral style Activity 80 22,065Approach 71 15,789Mood 68 15,767
Criterial Activity 33 6,791Shyness 25 4,720Sociability 29 8,632
Psychobiological Activity 36 5,636Approach 17 2,310High intensity pleasure 18 1,953Impulsivity 21 2,254Shyness 23 3,802Smiling 27 3,029Surgency 9 885
57GENDER DIFFERENCES IN TEMPERAMENT
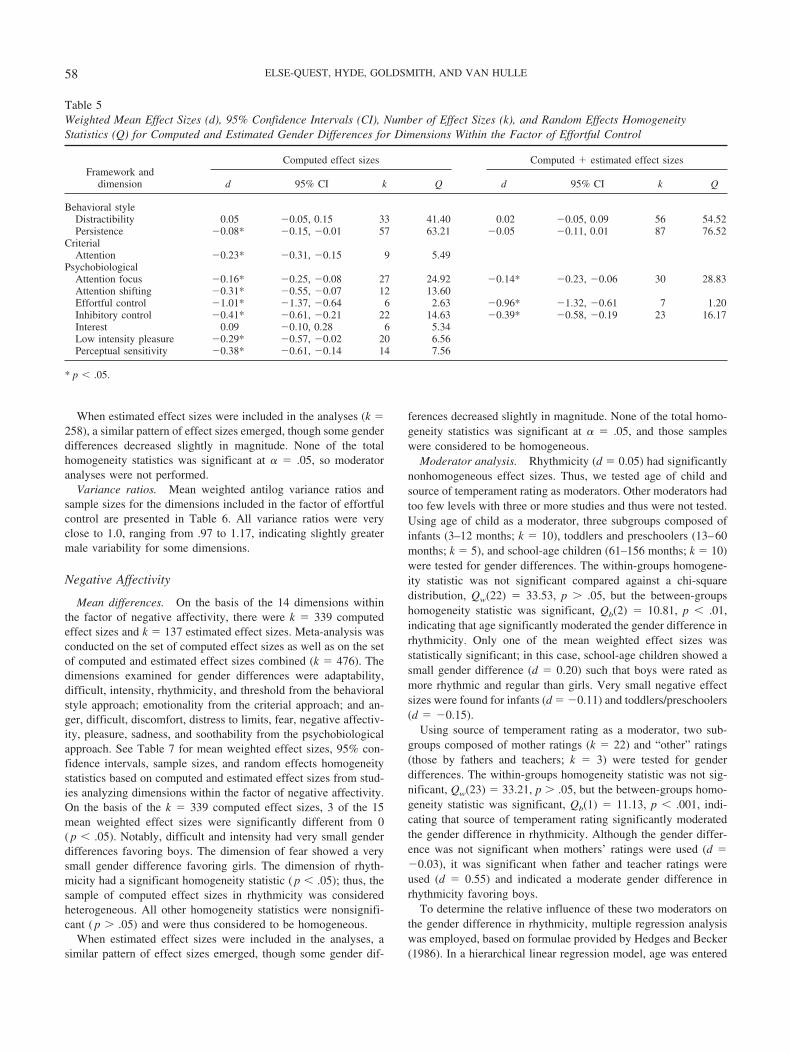
When estimated effect sizes were included in the analyses (k �258), a similar pattern of effect sizes emerged, though some genderdifferences decreased slightly in magnitude. None of the totalhomogeneity statistics was significant at � � .05, so moderatoranalyses were not performed.
Variance ratios. Mean weighted antilog variance ratios andsample sizes for the dimensions included in the factor of effortfulcontrol are presented in Table 6. All variance ratios were veryclose to 1.0, ranging from .97 to 1.17, indicating slightly greatermale variability for some dimensions.
Negative Affectivity
Mean differences. On the basis of the 14 dimensions withinthe factor of negative affectivity, there were k � 339 computedeffect sizes and k � 137 estimated effect sizes. Meta-analysis wasconducted on the set of computed effect sizes as well as on the setof computed and estimated effect sizes combined (k � 476). Thedimensions examined for gender differences were adaptability,difficult, intensity, rhythmicity, and threshold from the behavioralstyle approach; emotionality from the criterial approach; and an-ger, difficult, discomfort, distress to limits, fear, negative affectiv-ity, pleasure, sadness, and soothability from the psychobiologicalapproach. See Table 7 for mean weighted effect sizes, 95% con-fidence intervals, sample sizes, and random effects homogeneitystatistics based on computed and estimated effect sizes from stud-ies analyzing dimensions within the factor of negative affectivity.On the basis of the k � 339 computed effect sizes, 3 of the 15mean weighted effect sizes were significantly different from 0( p � .05). Notably, difficult and intensity had very small genderdifferences favoring boys. The dimension of fear showed a verysmall gender difference favoring girls. The dimension of rhyth-micity had a significant homogeneity statistic ( p � .05); thus, thesample of computed effect sizes in rhythmicity was consideredheterogeneous. All other homogeneity statistics were nonsignifi-cant ( p � .05) and were thus considered to be homogeneous.
When estimated effect sizes were included in the analyses, asimilar pattern of effect sizes emerged, though some gender dif-
ferences decreased slightly in magnitude. None of the total homo-geneity statistics was significant at � � .05, and those sampleswere considered to be homogeneous.
Moderator analysis. Rhythmicity (d � 0.05) had significantlynonhomogeneous effect sizes. Thus, we tested age of child andsource of temperament rating as moderators. Other moderators hadtoo few levels with three or more studies and thus were not tested.Using age of child as a moderator, three subgroups composed ofinfants (3–12 months; k � 10), toddlers and preschoolers (13–60months; k � 5), and school-age children (61–156 months; k � 10)were tested for gender differences. The within-groups homogene-ity statistic was not significant compared against a chi-squaredistribution, Qw(22) � 33.53, p � .05, but the between-groupshomogeneity statistic was significant, Qb(2) � 10.81, p � .01,indicating that age significantly moderated the gender difference inrhythmicity. Only one of the mean weighted effect sizes wasstatistically significant; in this case, school-age children showed asmall gender difference (d � 0.20) such that boys were rated asmore rhythmic and regular than girls. Very small negative effectsizes were found for infants (d � �0.11) and toddlers/preschoolers(d � �0.15).
Using source of temperament rating as a moderator, two sub-groups composed of mother ratings (k � 22) and “other” ratings(those by fathers and teachers; k � 3) were tested for genderdifferences. The within-groups homogeneity statistic was not sig-nificant, Qw(23) � 33.21, p � .05, but the between-groups homo-geneity statistic was significant, Qb(1) � 11.13, p � .001, indi-cating that source of temperament rating significantly moderatedthe gender difference in rhythmicity. Although the gender differ-ence was not significant when mothers’ ratings were used (d ��0.03), it was significant when father and teacher ratings wereused (d � 0.55) and indicated a moderate gender difference inrhythmicity favoring boys.
To determine the relative influence of these two moderators onthe gender difference in rhythmicity, multiple regression analysiswas employed, based on formulae provided by Hedges and Becker(1986). In a hierarchical linear regression model, age was entered
Table 5Weighted Mean Effect Sizes (d), 95% Confidence Intervals (CI), Number of Effect Sizes (k), and Random Effects HomogeneityStatistics (Q) for Computed and Estimated Gender Differences for Dimensions Within the Factor of Effortful Control
Framework anddimension
Computed effect sizes Computed � estimated effect sizes
d 95% CI k Q d 95% CI k Q
Behavioral styleDistractibility 0.05 �0.05, 0.15 33 41.40 0.02 �0.05, 0.09 56 54.52Persistence �0.08* �0.15, �0.01 57 63.21 �0.05 �0.11, 0.01 87 76.52
CriterialAttention �0.23* �0.31, �0.15 9 5.49
PsychobiologicalAttention focus �0.16* �0.25, �0.08 27 24.92 �0.14* �0.23, �0.06 30 28.83Attention shifting �0.31* �0.55, �0.07 12 13.60Effortful control �1.01* �1.37, �0.64 6 2.63 �0.96* �1.32, �0.61 7 1.20Inhibitory control �0.41* �0.61, �0.21 22 14.63 �0.39* �0.58, �0.19 23 16.17Interest 0.09 �0.10, 0.28 6 5.34Low intensity pleasure �0.29* �0.57, �0.02 20 6.56Perceptual sensitivity �0.38* �0.61, �0.14 14 7.56
* p � .05.
58 ELSE-QUEST, HYDE, GOLDSMITH, AND VAN HULLE
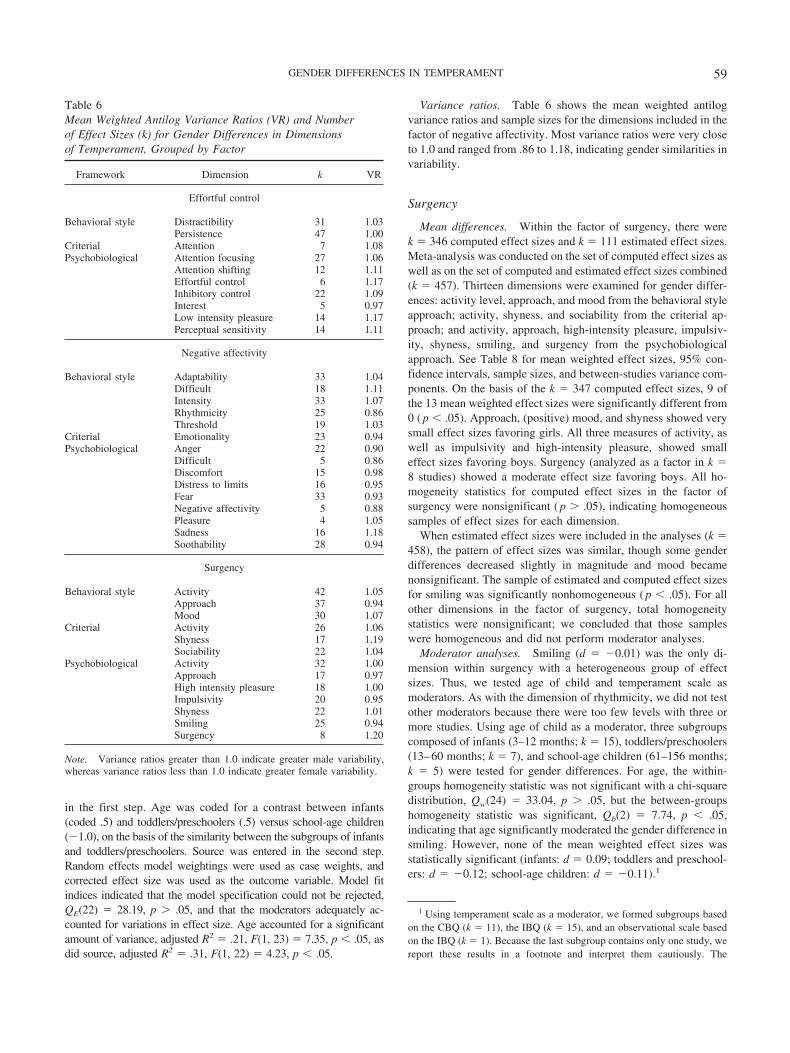
in the first step. Age was coded for a contrast between infants(coded .5) and toddlers/preschoolers (.5) versus school-age children(�1.0), on the basis of the similarity between the subgroups of infantsand toddlers/preschoolers. Source was entered in the second step.Random effects model weightings were used as case weights, andcorrected effect size was used as the outcome variable. Model fitindices indicated that the model specification could not be rejected,QE(22) � 28.19, p � .05, and that the moderators adequately ac-counted for variations in effect size. Age accounted for a significantamount of variance, adjusted R2 � .21, F(1, 23) � 7.35, p � .05, asdid source, adjusted R2 � .31, F(1, 22) � 4.23, p � .05.
Variance ratios. Table 6 shows the mean weighted antilogvariance ratios and sample sizes for the dimensions included in thefactor of negative affectivity. Most variance ratios were very closeto 1.0 and ranged from .86 to 1.18, indicating gender similarities invariability.
Surgency
Mean differences. Within the factor of surgency, there werek � 346 computed effect sizes and k � 111 estimated effect sizes.Meta-analysis was conducted on the set of computed effect sizes aswell as on the set of computed and estimated effect sizes combined(k � 457). Thirteen dimensions were examined for gender differ-ences: activity level, approach, and mood from the behavioral styleapproach; activity, shyness, and sociability from the criterial ap-proach; and activity, approach, high-intensity pleasure, impulsiv-ity, shyness, smiling, and surgency from the psychobiologicalapproach. See Table 8 for mean weighted effect sizes, 95% con-fidence intervals, sample sizes, and between-studies variance com-ponents. On the basis of the k � 347 computed effect sizes, 9 ofthe 13 mean weighted effect sizes were significantly different from0 ( p � .05). Approach, (positive) mood, and shyness showed verysmall effect sizes favoring girls. All three measures of activity, aswell as impulsivity and high-intensity pleasure, showed smalleffect sizes favoring boys. Surgency (analyzed as a factor in k �8 studies) showed a moderate effect size favoring boys. All ho-mogeneity statistics for computed effect sizes in the factor ofsurgency were nonsignificant ( p � .05), indicating homogeneoussamples of effect sizes for each dimension.
When estimated effect sizes were included in the analyses (k �458), the pattern of effect sizes was similar, though some genderdifferences decreased slightly in magnitude and mood becamenonsignificant. The sample of estimated and computed effect sizesfor smiling was significantly nonhomogeneous ( p � .05). For allother dimensions in the factor of surgency, total homogeneitystatistics were nonsignificant; we concluded that those sampleswere homogeneous and did not perform moderator analyses.
Moderator analyses. Smiling (d � �0.01) was the only di-mension within surgency with a heterogeneous group of effectsizes. Thus, we tested age of child and temperament scale asmoderators. As with the dimension of rhythmicity, we did not testother moderators because there were too few levels with three ormore studies. Using age of child as a moderator, three subgroupscomposed of infants (3–12 months; k � 15), toddlers/preschoolers(13–60 months; k � 7), and school-age children (61–156 months;k � 5) were tested for gender differences. For age, the within-groups homogeneity statistic was not significant with a chi-squaredistribution, Qw(24) � 33.04, p � .05, but the between-groupshomogeneity statistic was significant, Qb(2) � 7.74, p � .05,indicating that age significantly moderated the gender difference insmiling. However, none of the mean weighted effect sizes wasstatistically significant (infants: d � 0.09; toddlers and preschool-ers: d � �0.12; school-age children: d � �0.11).1
1 Using temperament scale as a moderator, we formed subgroups basedon the CBQ (k � 11), the IBQ (k � 15), and an observational scale basedon the IBQ (k � 1). Because the last subgroup contains only one study, wereport these results in a footnote and interpret them cautiously. The
Table 6Mean Weighted Antilog Variance Ratios (VR) and Numberof Effect Sizes (k) for Gender Differences in Dimensionsof Temperament, Grouped by Factor
Framework Dimension k VR
Effortful control
Behavioral style Distractibility 31 1.03Persistence 47 1.00
Criterial Attention 7 1.08Psychobiological Attention focusing 27 1.06
Attention shifting 12 1.11Effortful control 6 1.17Inhibitory control 22 1.09Interest 5 0.97Low intensity pleasure 14 1.17Perceptual sensitivity 14 1.11
Negative affectivity
Behavioral style Adaptability 33 1.04Difficult 18 1.11Intensity 33 1.07Rhythmicity 25 0.86Threshold 19 1.03
Criterial Emotionality 23 0.94Psychobiological Anger 22 0.90
Difficult 5 0.86Discomfort 15 0.98Distress to limits 16 0.95Fear 33 0.93Negative affectivity 5 0.88Pleasure 4 1.05Sadness 16 1.18Soothability 28 0.94
Surgency
Behavioral style Activity 42 1.05Approach 37 0.94Mood 30 1.07
Criterial Activity 26 1.06Shyness 17 1.19Sociability 22 1.04
Psychobiological Activity 32 1.00Approach 17 0.97High intensity pleasure 18 1.00Impulsivity 20 0.95Shyness 22 1.01Smiling 25 0.94Surgency 8 1.20
Note. Variance ratios greater than 1.0 indicate greater male variability,whereas variance ratios less than 1.0 indicate greater female variability.
59GENDER DIFFERENCES IN TEMPERAMENT

Variance ratios. Mean weighted antilog variance ratios andsample sizes for the dimensions included in the dimension ofsurgency are presented in Table 6. Most of the variance ratios werevery close to 1.0. Notably, the dimension of shyness showedgreater male variability; boys were 19% more variable thangirls on this dimension. Also, boys were 20% more variable onsurgency.
Discussion
The overall purpose of the current meta-analysis was to deter-mine the magnitude of gender differences in dimensions of tem-perament assessed by the three frameworks of Thomas and Chess(1977, 1980), Buss and Plomin (1975), and Rothbart (1981). Asecondary aim was to identify moderators of these differences andassess gender differences in variability on these dimensions. Gen-erally, we found evidence of only small gender differences intemperament although there were notable exceptions. For exam-ple, consistent gender differences favoring girls were found withinthe factor of effortful control, including a very large gender dif-ference in effortful control (as a factor analyzed in six studies).Also, several dimensions within surgency showed small to mod-erate gender differences favoring boys. These findings have im-plications for existing theories of gender development and genderdifferences in emotion, adjustment, and personality, which arediscussed below.
Effortful Control
The factor of effortful control is composed of attention regula-tion dimensions as well as inhibitory control and perceptual sen-sitivity. Thomas and Chess’s (1977, 1980) dimension of persis-tence, Buss and Plomin’s (1975) dimension of attention, andRothbart’s (1981) dimensions of attention focus and interest rep-
Table 7Weighted Mean Effect Sizes (d), 95% Confidence Intervals (CI), Number of Effect Sizes (k), and Random Effects HomogeneityStatistics (Q) for Computed and Estimated Gender Differences for Dimensions Within the Factor of Negative Affectivity
Framework
Computed effect sizes Computed � estimated effect sizes
d 95% CI k Q d 95% CI k Q
Behavioral styleAdaptability �0.03 �0.11, 0.05 42 54.85 �0.02 �0.07, 0.03 73 74.20Difficult 0.13* 0.04, 0.22 28 30.97 0.11* 0.03, 0.20 36 36.51Intensity 0.10* 0.01, 0.18 37 41.41 0.04 �0.01, 0.10 65 60.92Rhythmicity 0.05 �0.04, 0.13 30 49.59 0.03 �0.03, 0.09 56 63.03Threshold �0.07 �0.15, 0.02 21 17.21 �0.04 �0.08, 0.01 46 38.59
CriterialEmotionality 0.01 �0.05, 0.07 29 27.96 0.00 �0.05, 0.05 35 32.59
PsychobiologicalAnger 0.04 �0.04, 0.11 24 23.96 0.07 �0.07, 0.20 25 24.59Difficult 0.03 �0.22, 0.27 7 7.66Discomfort �0.17 �0.34, 0.00 15 9.04Distress to limits 0.01 �0.11, 0.14 16 12.16 0.00 �0.10, 0.10 20 16.20Fear �0.12* �0.20, �0.05 34 31.61 �0.11* �0.18, �0.04 38 36.78Negative affectivity �0.06 �0.20, 0.09 5 1.75 �0.05 �0.19, 0.08 7 1.80Pleasure �0.09 �0.27, 0.09 6 3.33Sadness �0.10 �0.24, 0.05 16 14.06Soothability 0.05 �0.05, 0.14 29 29.16 0.04 �0.04, 0.13 31 30.79
* p � .05.
within-groups homogeneity statistic was not significant compared againsta chi-square distribution, Qw(24) � 31.70, p � .05, but the between-groupshomogeneity statistic was significant, Qb(2) � 9.08, p � .05), indicatingthat scale significantly moderated the gender difference in smiling. One ofthe mean weighted effect sizes was statistically significant; when the CBQwas used, d � �0.12 ( p � .05). When the IBQ was used, the effect sizewas small, d � 0.09 (ns). The observational scale showed d � �0.24;however, this result was based on k � 1.
The differences between the IBQ and CBQ are confounded with age. Thatis, the IBQ was designed for infants and the CBQ for children ages 3–8 years.This is not a flaw of the meta-analysis but rather an artifact of Rothbart’s(1981) age-appropriate measurement tools. Multiple regression analysis wasused to determine the relative influences of age and scale on the genderdifference in smiling. In a hierarchical linear regression model, age wasentered in the first step and was coded for two orthogonal contrasts: (a) infants(coded 1) versus toddlers/preschoolers (�.5) and school-age children (�.5);and (b) toddlers (1) versus school-age children (–1; infants coded 0). Sourcewas entered in the second step and was coded for two orthogonal contrasts: (a)IBQ (coded –1) versus CBQ (1; observational scale coded 0), and (b) IBQ (.5)and CBQ (.5) versus the observational scale (�1). Random effects modelweightings were used as case weights, and corrected effect size was used as theoutcome variable. Model fit indices indicated that the model specificationcould not be rejected, QE(22) � 31.52, p � .05, and that the moderatorsadequately accounted for the variability in effect sizes. Neither age nor scaleaccounted for a significant amount of variance: for age, adjusted R2 � .12, F(2,24) � 2.81, p � .05; for scale, adjusted R2 � .09, F(2, 22) � 0.53, p � .05.However, the first age contrast (infants versus toddlers, preschoolers, andschool age children) accounted for significant variance (� � .14, z � 2.75) incorrected effect size; the second age contrast (toddlers/preschoolers versusschool age children) did not account for significant variability in effect size(� � �.02, z � �0.04). When scale was entered into the model, the first agecontrast was no longer significant (� � .06, z � 0.35). Neither the first scalecontrast (IBQ versus CBQ) nor the second scale contrast (IBQ and CBQversus observational scale) was significantly associated with corrected effectsize (� � �.07, z � �0.52; � � .18, z � 0.83, respectively).
60 ELSE-QUEST, HYDE, GOLDSMITH, AND VAN HULLE
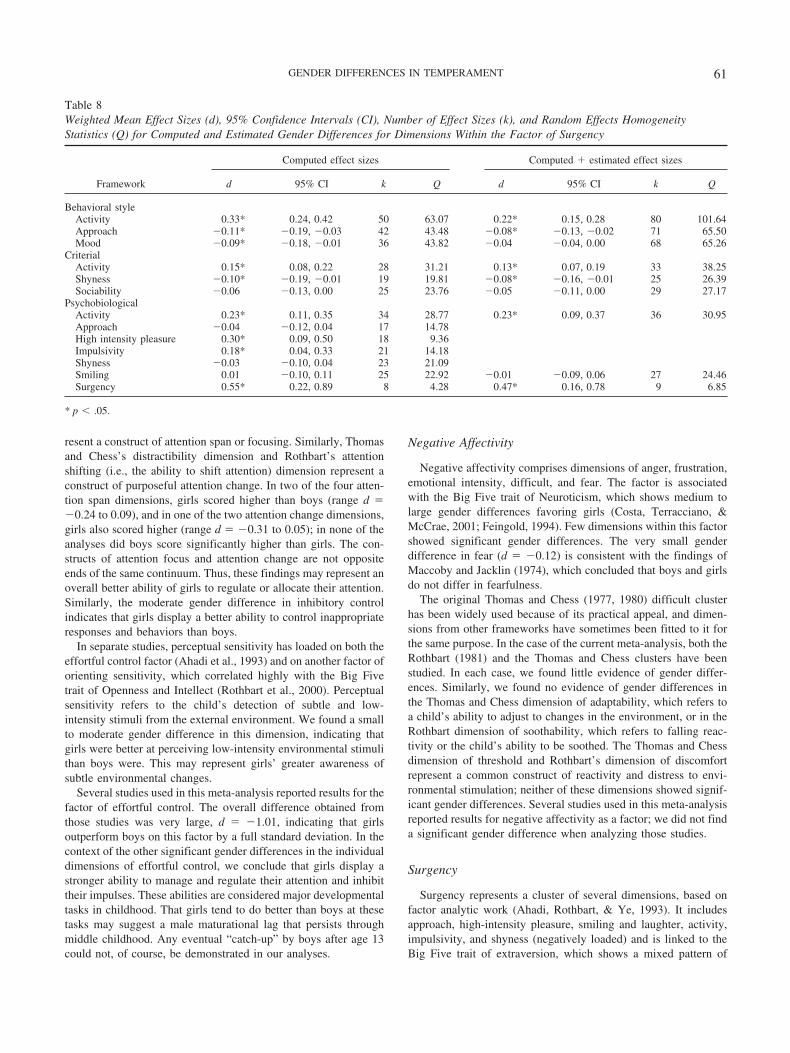
resent a construct of attention span or focusing. Similarly, Thomasand Chess’s distractibility dimension and Rothbart’s attentionshifting (i.e., the ability to shift attention) dimension represent aconstruct of purposeful attention change. In two of the four atten-tion span dimensions, girls scored higher than boys (range d ��0.24 to 0.09), and in one of the two attention change dimensions,girls also scored higher (range d � �0.31 to 0.05); in none of theanalyses did boys score significantly higher than girls. The con-structs of attention focus and attention change are not oppositeends of the same continuum. Thus, these findings may represent anoverall better ability of girls to regulate or allocate their attention.Similarly, the moderate gender difference in inhibitory controlindicates that girls display a better ability to control inappropriateresponses and behaviors than boys.
In separate studies, perceptual sensitivity has loaded on both theeffortful control factor (Ahadi et al., 1993) and on another factor oforienting sensitivity, which correlated highly with the Big Fivetrait of Openness and Intellect (Rothbart et al., 2000). Perceptualsensitivity refers to the child’s detection of subtle and low-intensity stimuli from the external environment. We found a smallto moderate gender difference in this dimension, indicating thatgirls were better at perceiving low-intensity environmental stimulithan boys were. This may represent girls’ greater awareness ofsubtle environmental changes.
Several studies used in this meta-analysis reported results for thefactor of effortful control. The overall difference obtained fromthose studies was very large, d � �1.01, indicating that girlsoutperform boys on this factor by a full standard deviation. In thecontext of the other significant gender differences in the individualdimensions of effortful control, we conclude that girls display astronger ability to manage and regulate their attention and inhibittheir impulses. These abilities are considered major developmentaltasks in childhood. That girls tend to do better than boys at thesetasks may suggest a male maturational lag that persists throughmiddle childhood. Any eventual “catch-up” by boys after age 13could not, of course, be demonstrated in our analyses.
Negative Affectivity
Negative affectivity comprises dimensions of anger, frustration,emotional intensity, difficult, and fear. The factor is associatedwith the Big Five trait of Neuroticism, which shows medium tolarge gender differences favoring girls (Costa, Terracciano, &McCrae, 2001; Feingold, 1994). Few dimensions within this factorshowed significant gender differences. The very small genderdifference in fear (d � �0.12) is consistent with the findings ofMaccoby and Jacklin (1974), which concluded that boys and girlsdo not differ in fearfulness.
The original Thomas and Chess (1977, 1980) difficult clusterhas been widely used because of its practical appeal, and dimen-sions from other frameworks have sometimes been fitted to it forthe same purpose. In the case of the current meta-analysis, both theRothbart (1981) and the Thomas and Chess clusters have beenstudied. In each case, we found little evidence of gender differ-ences. Similarly, we found no evidence of gender differences inthe Thomas and Chess dimension of adaptability, which refers toa child’s ability to adjust to changes in the environment, or in theRothbart dimension of soothability, which refers to falling reac-tivity or the child’s ability to be soothed. The Thomas and Chessdimension of threshold and Rothbart’s dimension of discomfortrepresent a common construct of reactivity and distress to envi-ronmental stimulation; neither of these dimensions showed signif-icant gender differences. Several studies used in this meta-analysisreported results for negative affectivity as a factor; we did not finda significant gender difference when analyzing those studies.
Surgency
Surgency represents a cluster of several dimensions, based onfactor analytic work (Ahadi, Rothbart, & Ye, 1993). It includesapproach, high-intensity pleasure, smiling and laughter, activity,impulsivity, and shyness (negatively loaded) and is linked to theBig Five trait of extraversion, which shows a mixed pattern of
Table 8Weighted Mean Effect Sizes (d), 95% Confidence Intervals (CI), Number of Effect Sizes (k), and Random Effects HomogeneityStatistics (Q) for Computed and Estimated Gender Differences for Dimensions Within the Factor of Surgency
Framework
Computed effect sizes Computed � estimated effect sizes
d 95% CI k Q d 95% CI k Q
Behavioral styleActivity 0.33* 0.24, 0.42 50 63.07 0.22* 0.15, 0.28 80 101.64Approach �0.11* �0.19, �0.03 42 43.48 �0.08* �0.13, �0.02 71 65.50Mood �0.09* �0.18, �0.01 36 43.82 �0.04 �0.04, 0.00 68 65.26
CriterialActivity 0.15* 0.08, 0.22 28 31.21 0.13* 0.07, 0.19 33 38.25Shyness �0.10* �0.19, �0.01 19 19.81 �0.08* �0.16, �0.01 25 26.39Sociability �0.06 �0.13, 0.00 25 23.76 �0.05 �0.11, 0.00 29 27.17
PsychobiologicalActivity 0.23* 0.11, 0.35 34 28.77 0.23* 0.09, 0.37 36 30.95Approach �0.04 �0.12, 0.04 17 14.78High intensity pleasure 0.30* 0.09, 0.50 18 9.36Impulsivity 0.18* 0.04, 0.33 21 14.18Shyness �0.03 �0.10, 0.04 23 21.09Smiling 0.01 �0.10, 0.11 25 22.92 �0.01 �0.09, 0.06 27 24.46Surgency 0.55* 0.22, 0.89 8 4.28 0.47* 0.16, 0.78 9 6.85
* p � .05.
61GENDER DIFFERENCES IN TEMPERAMENT
gender differences (Costa et al., 2001). In addition to studying thedimensions composing surgency, we also obtained 9 effect sizesfor the surgency factor and meta-analyzed the gender differencesin it. The results indicated that boys scored .5 standard deviationhigher than girls on surgency. We found a small positive genderdifference favoring boys in high-intensity pleasure, which repre-sents the amount of pleasure derived from high stimulus intensity,rate, complexity, novelty, and incongruity, and might includerough-and-tumble play or being in crowds of people.
The approach dimensions from Thomas and Chess’s (1977,1980) behavioral style framework and Rothbart’s (1981) psycho-biological framework both showed negligible gender differences.There are, at most, very small gender differences in smiling andpositive affect in middle childhood. Both the Rothbart dimensionof smiling and the Thomas and Chess dimension of positive moodshowed negligible gender differences. Gender differences in smil-ing were not significant at any age.
Shyness loads negatively on the factor of surgency, whereassociability loads positively. Both represent a general orientation orresponse to social interaction although shyness also contains acomponent of anxiety. Based on the meta-analyses of Rothbart’s(1981) shyness dimension and Buss and Plomin’s (1975) shynessand sociability dimensions, there is little evidence of gender dif-ferences. These results are consistent with Maccoby and Jacklin’s(1974) results for sociability.
In each of the three methodological frameworks, we found asmall but significant gender difference in activity level (range d �0.15–0.33). Although this estimate is lower than that obtained byEaton and Enns (1986), the general finding of greater male activitywas replicated. In addition, Eaton and Enns found that the differ-ence was small in magnitude in samples of infants, but moderateto large in samples of older children. Well over half of the samplesincluded in the current activity level meta-analysis were of chil-dren younger than 5 years; thus, it is not surprising that ourestimate is lower than Eaton and Enns’s.
Implications of the Findings
Findings of gender differences and similarities in temperamentare important in their own right, but the findings also hold impli-cations for models of gender role development and gender differ-ences in personality, emotion, and adjustment.
Gender role development. Maccoby’s (1990) theory of thedevelopment of gender-typed behaviors argues that gender differ-ences in individual characteristics, such as personality and tem-perament, are likely to be small. Gender differences in socialbehavior develop from social interaction, particularly from same-gender peer groups. In such groups, gender-specific interactionstyles and roles emerge. We found negligible effect sizes forgender differences in many dimensions of temperament, which isconsistent with Maccoby’s theory. Moreover, moderator analysesindicated that gender differences in rhythmicity and smiling weregreater in school-age children (who have had more cumulativeexposure to socialization in same-gender peer groups than toddlersand infants). Past research indicated that gender differences insome temperament dimensions (e.g., activity) increase with age(Maccoby & Jacklin, 1974; Eaton & Enns, 1986). This pattern ofresults can also be linked to possible evocative effects as describedby Scarr and McCartney (1983). That is, small gender differences
may be magnified by gender role socialization and social interac-tion such that larger differences are seen in older children. How-ever, in both rhythmicity and smiling, the direction of genderdifferences actually reversed after infancy, suggesting a morecomplicated developmental model.
In their meta-analysis, LaFrance et al. (2003) found a moderategender difference in smiling, d � �0.41, with girls and womensmiling more. The magnitude of the gender difference was highlydependent on the context, as described in the Introduction. Smilingis crucial in areas such as interpersonal interactions and impressionformation. For example, experimental research shows that ratersreact negatively to women who do not smile (Deutsch et al., 1987).Hall and Halberstadt (1986) found no gender differences in child-hood and hypothesized that the differences emerged in adoles-cence. That we found no significant gender difference in smiling isconsistent with that developmental pattern and with the notion thatthis gender difference results from gender role norms.
In the context of gender role norms, the findings for low- andhigh-intensity pleasure are not at all surprising and very consistentwith Maccoby’s (1998) theory. Girls and boys tend to preferplaying in same-gender peer groups, where low-intensity activities(e.g., playing house) and high-intensity activities (e.g., rough-and-tumble play) are likely to take place for girls and boys, respectively(Maccoby, 1990). Thus, gender differences in low- and high-intensity pleasure may be linked to activities that occur in same-gender peer play. This question was not tested in the currentmeta-analysis, but should be addressed in future research.
Gender differences in personality. Gender differences in tem-perament cannot be discussed without considering the evidence ongender differences in personality in adulthood. Past meta-analyses(Costa et al., 2001; Feingold, 1994) of gender differences inpersonality indicated that women score higher on facets of neu-roticism (ranging from d � 0.19–0.44) and agreeableness (ranged � 0.19–0.43), and on some facets of Extraversion, such aswarmth, gregariousness, and positive emotions (range d � 0.21–0.33), as well as on Openness, such as aesthetics, feelings, andactions (range d � 0.19–0.34). Men scored higher on two facetsof Extraversion, including assertiveness (d � 0.19–0.50) andexcitement seeking (d � 0.31–0.38), as well as on Openness,including fantasy (d � 0.12–0.16) and ideas (d � 0.16–0.32). Nosignificant gender differences were found on facets of conscien-tiousness in those studies.
Insofar as gender differences in personality are foreshadowed bygender differences in temperament, we expected to find thosegender differences in our meta-analysis. We predicted that tem-perament dimensions such as fear, sadness, discomfort, and frus-tration, as links to the personality factor of neuroticism, wouldshow gender differences favoring girls. The results provided sup-port for some links but not others; girls scored slightly higher onlyon measures of fear and discomfort. There were no other genderdifferences favoring girls in negative affectivity; in fact, boysscored higher on the difficulty and intensity components of neg-ative affectivity. The gender differences we found for effortfulcontrol in children did not foreshadow the lack of differences inadult conscientiousness (Costa et al., 2001; Feingold, 1994). Girlsconsistently scored higher than boys on the factor of effortfulcontrol, suggesting that this gender difference fades with develop-ment, or that the link from effortful control to conscientiousness isweak. For the temperament dimensions underlying extraversion
62 ELSE-QUEST, HYDE, GOLDSMITH, AND VAN HULLE
(the factor of surgency including high-intensity pleasure, sociabil-ity, and activity), the gender difference in high-intensity pleasure isconsistent with the difference in excitement seeking. The smallgender difference in impulsivity favoring boys can be comparedwith Feingold’s (1994) meta-analysis, which reported a negligiblegender difference in impulsiveness in adults. This indicates apotential developmental change in gender differences in impulsiv-ity, as both boys and girls improve in impulse control as they movetoward adulthood. In summary, patterns of gender differences andsimilarities in temperament bear little resemblance to patterns ofgender differences and similarities in adult personality.
Gender differences in emotion. We turn now to gender stereo-typing of emotions and the implications of this meta-analysis forthose patterns. Women are stereotyped as being more emotionalthan men. Specifically, they are stereotyped as experiencing andexpressing more distress, embarrassment, fear, guilt, and sad-ness—but also more happiness—than men (Plant, Hyde, Keltner,& Devine, 2000). Men are stereotyped as experiencing and ex-pressing more anger than women. Several lines of reasoning sug-gest a link between our findings of gender differences and simi-larities in temperament and the gender stereotyping of emotions.First, gender differences in temperament may represent the “kernelof truth” in gender stereotypes of emotion, such that small differ-ences exist, but are magnified by gender stereotypes. For example,the small gender differences in fear favoring girls may be magni-fied by stereotypes about feminine emotions.
Second, gender stereotypes of emotion may contribute to genderrole development, insofar as gender-stereotyped emotions fit gen-der norms, are socially appropriate, and are therefore encouraged.However, for emotions such as sadness and anger, which arefeminine and masculine emotions, respectively, we did not findsignificant gender differences. Maccoby et al. (1984) found that,although toddler-age boys and girls did not differ significantly ona measure of difficulty, mothers responded differently to difficultsons than to difficult daughters. That is, children’s emotionalbehavior may be responded to differently, on the basis of genderstereotypes. In such cases, one would expect that gender differ-ences would increase with age. However, we found no evidence ofgendered emotions varying with age, at least before adolescence.
A third potential link between gender differences in tempera-ment and stereotyping of emotion reflects measurement bias. Thatis, gender stereotypes of emotion may bias perceptions or reportsof gender differences in temperament. Adults are apt to judgeemotions in children a priori on the basis of knowledge of thechild’s gender (Stern & Karraker, 1989). Condry and Condry(1976) found that adults were more likely to characterize aninfant’s ambiguous response to a jack-in-the-box as angry if theythought the infant was a boy, but as fearful if they thought theinfant was a girl. Although this study lends support to the argumentthat perceptions of children’s behavior can be biased by genderstereotypes, these effects have not been consistently replicated(Maccoby & Jacklin, 1974; Stern & Karraker, 1989). Althoughsome research indicates that gender stereotypes are highly accurate(Hall & Carter, 1999), we found little evidence of gender differ-ences in temperament dimensions that reflect gender stereotypes ofemotion.
In addition to being stereotyped as expressing more emotion,research suggests that, indeed, women do express more emotionthan men (Kring & Gordon, 1998). Self-reports indicate that
women experience more sadness than men (Brody & Hall, 2000).Are there precursors to these effects in temperamental qualities inthe early years? The Buss and Plomin (1975) dimension of emo-tionality and the Rothbart (1981) dimensions of sadness and neg-ative affectivity showed no gender differences. Although girlswere more fearful, the difference was small (d � �0.12).
Brody’s (1997, 1999, 2000) theory of gender differences inemotional expression regards temperament as the root of women’spropensity to express more emotion than men. Specifically, thetheory contends that subtle gender differences in infant tempera-ment—namely, activity and sociability—elicit different socializa-tion patterns in girls and boys. Parents react to boys’ higheractivity and arousal by encouraging them to control and notexpress their emotions. Girls, who, according to Brody, are morelikely to be sociable and empathetic, are encouraged to expresstheir emotions fully. Thus, parents’ differential socialization oftheir sons and daughters serves to increase gender differences inemotional expression. However, there is little research testing thistheory of gender differences in emotion. Brody’s theory is akin toScarr and McCartney’s (1983) theory of evocative interactions inarguing that individual differences in behavior evoke social envi-ronments, which further shape the development of behavior. Bro-dy’s theory assumes small gender differences in activity andsociability favoring boys and girls, respectively. We found nogender difference in sociability, consistent with earlier conclusionsby Maccoby and Jacklin (1974). We did find small gender differ-ences in activity. Thus, the current study provides support for oneaspect, but not the other, of Brody’s theory.
Gender differences in adjustment. Links between tempera-ment and later adjustment are commonly observed. These links aretypically small to moderate in size, but highly replicable (Rothbart& Bates, 1998). Several approaches to the temperament-adjustment link have been proposed. Rothbart and Bates (1998)concentrated on statistical approaches implied by various waysthat temperament might be related to adjustment. Goldsmith, Le-mery, and Essex (2004) focused on ways that temperament mightconstitute liability to child psychopathology. Compas, Connor-Smith, and Jaser (2004) reviewed the potential links betweentemperament and depression in children and adolescents.
Here, we focus on the four models linking temperament toadjustment proposed by L. A. Clark et al. (1994). The vulnerabilitymodel suggests that temperament serves as a predisposition for adisorder, such that temperament plays a causal role in the devel-opment of psychopathology. The pathoplasty model proposes thattemperament can moderate the developmental course or expres-sion of psychopathology, without necessarily playing a directcausal role. The scar or complication model proposes that theexperience of psychopathology alters the development of temper-ament. The continuity model suggests that a psychological disorderindicates extreme levels of a temperament dimension; that is, thatthe disorder and temperament dimension reflect the same under-lying process.
Focusing on the vulnerability model, Shiner and Caspi (2003)proposed six ways that temperament can shape the development ofadjustment problems. They argued that temperament can affect (a)the child’s learning processes, (b) the way adults and peers respondto the child, (c) the way that the child interprets their own expe-riences (d) the way that the child compares himself or herself toothers (e) the choices the child makes in day-to-day environments
63GENDER DIFFERENCES IN TEMPERAMENT
and (f) the ways that the child manipulates or modifies theirenvironment. Thus, temperament and later adjustment may belinked in a number of ways that may or may not be causal. In caseswhere gender differences in adjustment have been observed, wewill juxtapose those reports with our meta-analytic findings todiscuss the linkages.
Some research supports the vulnerability model for the devel-opment of mood and anxiety disorders (L. A. Clark et al. 1994;Davidson, 1998; Klein & Shih, 1998). For example, L. A. Clark etal.’s (1994) tripartite theory argues that temperamental traits oflow positive affectivity and high negative affectivity may increaseone’s vulnerability to depression. Although the tripartite theorymade no specific claims about gender, it implies that we shoulddetermine whether gender differences in negative and positiveaffectivity exist in infancy and childhood. The gender difference indepression is among the most robust of findings in psychopathol-ogy research. In adulthood, twice as many women as men aredepressed (Kessler, McGonagle, Swartz, Blazer, & Nelson, 1993;Weissman & Klerman, 1977; Weissman, Leaf, Holzer, Myers, &Tischler, 1984). This gender difference emerges between 13 and15 years of age (Hankin et al., 1998). Thus, we would predict thatgirls should score lower on dimensions of positive affectivity orhigher on dimensions of negative affectivity.
That we found almost no evidence of gender differences innegative affectivity suggests that insofar as the tripartite theoryholds, the vulnerability model may differ for girls and boys. Thatis, negative affectivity might play a role in the development ofdifferent adjustment problems for boys and girls, such that nega-tive affectivity leads to anxiety and depression in girls and toexternalizing disorders in boys. Rothbart and Bates (1998) haveargued that different developmental processes may account forgender differences in adult constructs, such that “although reportsof sex differences in temperament in early development are rare,gender differences in adjustment are pervasive, so a differentprocess may link temperament and adjustment for girls and boys”(p. 155). Moreover, Rothbart et al.’s (1994) work on temperamentand social behavior found that the link between negative affectiv-ity and the internalizing emotions of guilt/shame and empathy heldonly for girls; in boys, negative affectivity was linked toaggression.
The other alternative following from the tripartite theory is thatgirls are lower in positive affect, which constitutes a vulnerabilityto depression. Our findings indicate that boys experience morehigh-intensity pleasure (d � 0.30), but this is balanced by girls’experience of more low-intensity pleasure (d � �0.29). TheThomas and Chess (1977, 1980) dimension of (positive) moodshows only a very small gender difference (d � �0.09). Futureresearch should sort out whether high-intensity or low-intensitypleasure is more predictive, negatively, of depression.
An alternative explanation for gender differences in depressionlies in variability. Even in the absence of average gender differ-ences, greater female variability would lead to more girls fallingabove the cutoff for high emotionality. Inspection of the varianceratios (see Table 6) shows boys to be more variable on theRothbart (1981) scale of sadness; the same is true for the Thomasand Chess (1977, 1980) scale of mood. Girls are more variable foremotionality using the Buss and Plomin (1975) scale. No consis-tent pattern of greater female variability emerges, again suggesting
that the origin of the gender difference in depression is unlikely tobe found in these dimensions of early childhood temperament.
Another possibility involves the gender difference in perceptualsensitivity. A sample item from the CBQ (Rothbart et al., 1994) is“How often did the child notice fabrics with a scratchy texture?” Ifgirls are more attuned to the fine details of their environment, theymay experience more stressors, simply because they notice morenegative events around them. They may be more adept at noticingnegative emotions displayed by important others in their environ-ment, such as parents, teachers, or peers. Consistent with thisfinding, other research has found evidence suggesting that girlsencode life events in more detail than do boys (Seidlitz & Diener,1998). For example, Davis (1999), in a series of experiments withchildren and undergraduates, found that girls consistently recalledmore childhood memories than did boys; moreover, they werefaster at accessing the memories, and the age of earliest memorywas younger for girls than for boys. The gender difference wasspecific to events associated with emotion but was consistentacross both positive and negative emotions. Over time, then, girlsmay accumulate more memories of emotional events, includingevents evoking negative emotions, and these contribute to depres-sion. The gender difference in perceptual sensitivity may also be aprecursor to the female advantage in decoding nonverbal cues inadulthood (Hall & Halberstadt, 1986).
Another link between temperament and adjustment may occurfor externalizing disorders. In the case of externalizing disorderssuch as antisocial behavior, attention problems, aggressive behav-ior, and substance abuse, boys are at increased risk (Bongers,Koot, van der Ende, & Verhulst, 2003; Lemery, Essex, & Smider,2002; Rosenfield, 2000). Given the gender differences in external-izing behaviors, we would predict gender differences in the di-mensions of the effortful control factor. In general, our resultssupport this link. The gender difference in the effortful controlfactor (on the basis of six studies) favored girls by one standarddeviation. In addition, we found consistent evidence of genderdifferences in the dimensions composing the factor of effortfulcontrol, most notably in attention regulation and inhibitory control.Low scores on these dimensions are associated with a greater maleincidence of attention and externalizing behavior problems, includ-ing aggression and delinquency (Bongers et al., 2003; Rosenfield,2000) and attention-deficit/ hyperactivity disorder (Nigg, Gold-smith, & Sachek, 2004).
The inability to regulate behavior and attention and to inhibitinappropriate responses is a key component of externalizing be-havior problems (Lahey, Moffitt, & Caspi, 2003; Lemery et al.,2002). Moreover, attention focusing, difficult temperament, anger,and inhibitory control are correlates of such behavior problems(Lemery et al., 2002; Skodol, 2000). Some longitudinal workindicates that the developmental pattern of antisocial or delinquentbehavior is different in boys and girls (Moffitt & Caspi, 2001).Boys are more likely to possess risk factors for life-course-persistent antisocial behavior, such as difficult temperament, hy-peractivity, and behavior problems, and girls are less likely todevelop life-course-persistent antisocial behavior (Moffitt &Caspi, 2001). Although there is some evidence of measurementconfounding between temperament and behavior problems, thelink remains after correcting for that confounding (Lemery et al.,2002). Some have argued that the link may be due to extremelevels of temperament constructs representing problem behavior
64 ELSE-QUEST, HYDE, GOLDSMITH, AND VAN HULLE

(Lemery et al., 2002), which is consistent with the continuitymodel of temperament and psychopathology. This argument im-plies that boys are more variable, occupying the extreme tails ofthe distribution more than girls. Moreover, the apparent inconsis-tency between the negligible gender difference in anger and frus-tration and the moderate gender difference in externalizing disor-ders raises the question of gender differences in variability. That is,boys might not differ from girls in their mean levels of anger, butboys might be more variable and more likely to score in the higherrange in anger. Yet, there is little evidence of greater male vari-ability on any of these dimensions.
It would be very satisfying to discover in early temperament theorigins of some of these important psychological gender differ-ences. The current meta-analysis, however, did not find patternsconsistent with adult patterns of gender differences in smiling oremotional expression. The gender difference in depression doesnot seem to be rooted in early gender differences in sadness ornegative affectivity. However, it might be related to the greaterperceptual sensitivity (i.e., awareness of subtle aspects of theenvironment) of girls. The gender differences in dimensions ofeffortful control are consistent with gender differences in exter-nalizing problems, and may indicate an important link in thegreater male incidence of aggression, delinquency, and attention-deficit/hyperactivity disorder.
Limitations and Strengths of the Data
Shifting standards in temperament ratings. To what extent areadults’ ratings of children’s temperament influenced by genderstereotypes? Although we typically think of stereotyping as exert-ing an assimilative effect, it can also produce contrast or even nulleffects. Insofar as different or “shifting” standards are used bydifferent raters, counterstereotypical effects can obscure real ef-fects (Biernat, 2003). That is, boys and girls may not be held to thesame standards by each temperament rater; for example, “fearful”for a boy may not mean the same thing as “fearful” for a girl. Thus,contrast or null effects may reflect shifting temperament ratingstandards and obscure real gender differences in temperament. Towhat extent is the current meta-analysis likely to reflect sucheffects? Temperament scales typically ask respondents to ratespecific behaviors, not to provide global assessments of traits.Items from the activity scales within each of the three approachesare illustrative. Measures within the criterial approach (e.g., Buss& Plomin, 1975) are fairly global, having parents rate their chil-dren on an item such as “Child is always on the go” using a scalefrom 1 (a little) to 5 (a lot). In the behavioral style approach (e.g.,Hegvik et al., 1982), parents rate their children on an item such as“Fidgets when he or she has to stay still” using a scale from 1(almost never) to 6 (almost always). Measures within the psycho-biological approach (e.g., Rothbart et al., 1994) have parents ratetheir children on an item such as “Moves about actively in house”using a scale from 1 (extremely untrue) to 7 (extremely true). Thus,the likelihood of an effect due to shifting standards seems lesslikely because these scales do not rely on global impressions andindividual or personal standards of temperament but rather on avariety of specific behaviors rated on reliable scales. The possi-bility that “real” gender differences are obscured because ofshifting standards, as well as the possibility of assimilative effects
of gender stereotyping, should be examined by temperamentresearchers.
Questionnaires versus behavioral observations. Although ev-ery effort was made to include behavioral observations and labo-ratory measures in the current study, only 43 of the 1,196 effectsizes obtained were based on behavioral observations. This illus-trates an overall greater reliance in the field on parent or teacherreport questionnaires. Behavioral observations and laboratorymeasures are considerably more expensive to administer, andfewer validated measures are available, so it is unsurprising thatthey are less common. Thus, the current study is based primarilyon parent and teacher reports of child temperament, and its validitydepends on the validity of questionnaire measures.
Moderator analyses and the random-effects model. Consistentwith guidelines set by Hedges and Becker (1986), moderatoranalyses were conducted only on dimensions with significantnonhomogeneity. However, because the random-effects model re-duces the between-studies variance (Q), the likelihood of signifi-cant nonhomogeneity of effect sizes is also reduced. We were ableto conduct moderator analyses on only 2 of 38 effects when usingthe random-effects model. For comparison, we analyzed the di-mension of high-intensity pleasure using the fixed-effects modeland found a significant (albeit smaller than with the random-effects model) gender difference favoring boys (d � 0.13) as wellas significant nonhomogeneity, Ht (18) � 72.50, p � .001. Age ofchild significantly moderated this gender difference such thattoddlers and preschoolers showed a larger gender difference (d �0.32) than school-age children (d � 0.02). Although the random-effects model relaxes the requirement of homogeneity of effectsizes, it reduces between-studies variance and thus limits theinstances in which moderator analyses can be justified.2
Publication bias. Meta-analyses have often been plagued by apublication bias, also known as the “file drawer problem,” inwhich studies with statistically significant findings are more likelyto be published than are studies with nonsignificant findings(Rosenthal, 1979; Hedges & Vevea, 1996). That is, the selection ofstudies is correlated with effect size magnitude, such that largereffects are overrepresented. One way to reduce publication bias isnot to restrict the computerized literature search to studies whoseresearch questions are similar to the questions asked in the meta-analysis. In the current study, we did not restrict our search tostudies of temperament and gender. Thus, many of the studiesincluded did not report or even examine gender differences butsimply studied temperament. Another way to reduce publicationbias is to include unpublished studies, such as dissertations. Thecurrent meta-analysis included 1,196 effect sizes from 191 studies,of which 342 effect sizes and 54 studies were unpublished. Thus,a strength of this study is the sizable proportion (28.6%) ofunpublished studies included in the analyses. Given that 47% ofour weighted mean effect sizes were negligible in size (d � 0.10),it is doubtful that our results would change significantly with theaddition of more studies with null findings. In sum, it is unlikelythat a substantial publication bias exists in the currentmeta-analysis.
2 Complete analyses using the fixed effects model and examining mod-erators can be obtained by contacting Nicole M. Else-Quest.
65GENDER DIFFERENCES IN TEMPERAMENT

Conclusions
The results of this meta-analysis indicated distinct patternswithin each of the three temperament factors. Effortful controlshowed consistent evidence of girls’ greater ability to regulateattention and impulses, consistent with boys’ greater incidence ofexternalizing behavior problems. The temperament factor of neg-ative affectivity showed only negligible gender differences, indi-cating that boys and girls do not differ in the extent to which theyare difficult, emotional, or soothable. The factor of surgencyshowed very small gender differences, generally indicating thatboys are slightly more active, less shy, and derive more pleasurethan girls from high-intensity stimuli. These findings have impor-tant implications for research on temperament, emotion, personal-ity, adjustment, and gender role development.
References
References marked with an asterisk indicate studies included in themeta-analysis.
Achenbach, T. M., McConaughy, S. H., & Howell, C. T. (1987). Child/adolescent behavioral and emotional problems: Implications of cross-informant correlations for situational specificity. Psychological Bulletin,101, 213–232.
*Ackland, P. (2001). Sense and socialization: The influence of tempera-ment and parenting on toddler guilt and compliance. (Doctoral disser-tation, Simon Fraser University, 2001. Dissertation Abstracts Interna-tional, 61, 3825.
*Adessky, R. (1997). The relationship of group and family experiences topeer rate aggression and popularity in middle class kindergarten chil-dren. (Doctoral dissertation, Concordia University, 1996). DissertationAbstracts International, 57, 4739.
*Ahadi, S. A., Rothbart, M. K., & Ye, R. (1993). Children’s temperamentin the US and China: Similarities and differences. European Journal ofPersonality, 7, 359–377.
Allport, G. W. (1954). The nature of prejudice. Oxford: Addison Wesley.Allport, G. W. (1961). Pattern and growth in personality. New York: Holt.*Anolik, G. (1996). Temperament and injury risk among three to five
year-old children. (Doctoral dissertation, Temple University, 1996).Dissertation Abstracts International, 56, 5192.
*Arbiter, E., Sato-Tanaka, R., Kolvin, I., & Leitch, I. (1999). Differencesin behaviour and temperament between Japanese and British toddlersliving in London: A pilot study. Child Psychology and PsychiatryReview, 4, 117–125.
*Arcus, D., & Kagan, J. (1995). Temperament and craniofacial variation inthe first two years. Child Development, 66, 1529–1540.
*Auerbach, J., Faroy, M., Ebstein, R., Kahana, M., & Levine, J. (2001).The association of the dopamine d4 receptor gene (DRD4) and theserotonin transporter promoter gene (5-HTTLPR) with temperament in12 month-old infants. Journal of Child Psychology and Psychiatry, 42,777–783.
*Ballantine, J. H., & Klein, H. A. (1990). The relationship of temperamentand adjustment in Japanese schools. Journal of Psychology, 124, 299–309.
*Barclay, L. K. (1987). Skill development and temperament in kindergar-ten children: A cross-cultural study. Perceptual and Motor Skills, 65,963–972.
*Barron, K. (1996). Determinants of maternal style in conversations aboutthe past: Effects of child individual differences. (Doctoral dissertation,University of Florida, 1996). Dissertation Abstracts International, 56,6415.
Bates, J. (1980). The concept of difficult temperament. Merrill-PalmerQuarterly, 26, 299–319.
Bates, J. E. (1987). Temperament in infancy. In J. D. Osofsky (Ed.),Handbook of infant development (pp. 1101–1149). New York: Wiley.
Bates, J. E., Freeland, C. A., & Lounsbury, M. L. (1979). Measurement ofinfant difficultness. Child Development, 50, 794–803.
*Berzirganian, S., & Cohen, P. (1992). Sex differences in the interactionbetween temperament and parenting. Journal of the American Academyof Child & Adolescent Psychiatry, 31, 790–801.
Biernat, M. (2003). Toward a broader view of social stereotyping. Amer-ican Psychologist, 58, 1019–1027.
*Boer, F., & Westenberg, P. M. (1994). The factor structure of the Bussand Plomin EAS Temperament Survey (parental ratings) in a Dutchsample of elementary school children. Journal of Personality Assess-ment, 62, 537–551.
*Bohlin, L. (2001). Determinants of young children’s leadership anddominance strategies during play. (Doctoral dissertation, Indiana Uni-versity, 2000). Dissertation Abstracts International, 61, 4282.
Bongers, I. L., Koot, H. M., van der Ende, J., & Verhulst, F. C. (2003). Thenormative development of child and adolescent problem behavior. Jour-nal of Abnormal Psychology, 112, 179–192.
*Bournaki, M. C. (1997). Correlates of pain-related responses to venipunc-ture in school age children. Nursing Research, 46, 147–154.
Bradley, M., Codispoti, M., Sabatinelli, D., & Lang, P. (2001). Emotionand motivation II: Sex differences in picture processing. Emotion, 1,300–319.
*Braungart-Rieker, J., Garwood, M. M., Powers, B. P., & Notaro, P. C.(1998). Infant affect and affect regulation during the Still-Face Paradigmwith mothers and fathers: The role of infant characteristics and parentalsensitivity. Developmental Psychology, 34, 1428–1437.
Brody, L. R. (1997). Gender and emotion: Beyond stereotypes. Journal ofSocial Issues, 53, 369–394.
Brody, L. R. (1999). Gender, emotion, and the family. Cambridge, MA:Harvard University Press.
Brody, L. R. (2000). The socialization of gender differences in emotionalexpression: Display rules, infant temperament, and differentiation. InA. H. Fischer (Ed.), Gender and emotion: Social psychological perspec-tives (pp. 24–47). Cambridge, England: Cambridge University Press.
Brody, L. R., & Hall, J. A. (2000). Gender, emotion, and expression. In M.Lewis & J. M. Haviland-Jones (Eds.), Handbook of emotions: Part IV:Social/personality issues (2nd ed., pp. 325–414). New York: GuilfordPress.
Buss, A. H., & Plomin, R. (1975). A temperament theory of personalitydevelopment. New York: Wiley.
Campos, J. J., Barrett, K., Lamb, M. E., Goldsmith, H. H., & Sternberg, C.(1983). Socioemotional development. In P. H. Mussen (Series Ed.),Handbook of child psychology: Vol. 2. Infancy and developmentalpsychobiology (4th ed., pp. 783–915). New York: Wiley.
*Cardell, C. D., & Parmar, R. S. (1988). Teacher perceptions of temper-ament characteristics of children classified as learning disabled. Journalof Learning Disabilities, 21, 497–502.
Carey, W. B. (1970). A simplified method for measuring infant tempera-ment. Journal of Pediatrics, 77, 188–194.
Carey, W. B., & McDevitt, S. C. (1978). Revision of the Infant Temper-ament Questionnaire. Pediatrics, 61, 735–739.
*Carlson, E. (1998). A prospective longitudinal study of attachment dis-organization/disorientation. Child Development, 69,1107–1128.
*Carpey, J. G. (1990). Genetic and environmental etiology of differentialtreatment of preschool aged children and its association with child’sbehavior. (Doctoral dissertation, University of Southern California,1990). Dissertation Abstracts International, 50, 3723.
*Carter, A., Little, C., Brigg-Gowan, M., & Kogan, N. (1999). The Infant-Toddler Social and Emotional Assessment (ITSEA): Comparing parentratings to laboratory observations of task mastery, emotion regulation,coping behaviors, and attachment status. Infant Mental Health Journal,20, 375–392.
66 ELSE-QUEST, HYDE, GOLDSMITH, AND VAN HULLE
Clark, L. A., Watson, D., & Mineka, S. (1994). Temperament, personality,and the mood and anxiety disorders. Journal of Abnormal Psychology,103, 103–116.
*Clark, R., Hyde, J. S., Essex, M. J., & Klein, M. H. (1997). Length ofmaternity leave and quality of mother-infant interactions. Child Devel-opment, 68, 364–383.
Cohen, J. (1988). Statistical power analysis for the behavioral sciences.Hillsdale, NJ: Erlbaum.
*Coffman, S., Levitt, M., Guacci-Franco, N., & Silver, M. (1992). Tem-perament and interactive effects: Mothers and infants in a teachingsituation. Issues in Comprehensive Pediatric Nursing, 15, 169–182.
*Colder, C. R., Mott, J. A., & Berman, A. S. (2002). The interactive effectsof infant activity level and fear on growth trajectories of early childhoodbehavior problems. Development and Psychopathology, 14, 1–23.
Compas, B. E., Connor-Smith, J., & Jaser, S. S. (2004). Temperament,stress reactivity, and coping: Implications for depression in childhoodand adolescence. Journal of Clinical Child and Adolescent Psychology,33, 21–31.
Condry, J. C., & Condry, S. (1976). Sex differences: A study of the eye ofthe beholder. Child Development, 47, 812–819.
*Constantino, J. N., Cloninger, C. R., Clarke, A. R., Hashemi, B., &Przybeck, T. (2002). Application of the seven factor model of person-ality to early childhood. Psychiatry Research, 109, 229–244.
Costa, P. T., Terracciano, A., & McCrae, R. R. (2001). Gender differencesin personality traits across cultures: Robust and surprising findings.Journal of Personality and Social Psychology, 81, 322–331.
*Crockenberg, S., & Acredolo, C. (1983). Infant temperament ratings: Afunction of infants, of mothers, or both? Infant Behavior and Develop-ment, 6, 61–72.
Davidson, R. J. (1998). Anterior electrophysiological asymmetries, emo-tion and depression: Conceptual and methodological conundrums. Psy-chophysiology, 35, 607–614.
Davis, P. J. (1999). Gender differences in autobiographical memory forchildhood emotional experiences. Journal of Personality and SocialPsychology, 76, 498–510.
*Davison, I. S., Faull, C., & Nicol, A. R. (1986). Temperament andbehaviour in six year-olds with recurrent abdominal pain: A follow-up.Journal of Child Psychology and Psychiatry and Allied Disciplines, 27,539–544.
*Deater-Deckard, K., Pike, A., Petrill, S., Cutting, A., Hughes, C., &O’Connor, T. (2001). Nonshared environmental processes in socialemotional development: An observational study of identical twin differ-ences in the preschool period. Developmental Science, 4, f1–f6.
*Denham, S., Mason, T., Caverly, S., Schmidt, M., & Hackney, R. (2001).Preschoolers at play: Co-socializers of emotional and social competence.International Journal of Behavior Development, 25, 290–301.
*Dettling, A., Gunnar, M., & Donzella, B. (1999). Cortisol levels of youngchildren in full-day childcare centers: Relations with age and tempera-ment. Psychoneuroendocrinology, 24, 519–536.
*Dettling, A., Parker, W., Lane, S., Sebanc, A., & Gunnar, M. (2000).Quality of care and temperament determine changes in cortisol concen-trations over the day for young children in childcare. Psychoneuroen-docrinology, 25, 819–836.
Deutsch, F. M., LeBaron, D., & Fryer, M. M. (1987). What is in a smile?Psychology of Women Quarterly, 11, 341–351
*DeVries, M. W., & Sameroff, A. J. (1984). Culture and temperament:Influence of infant temperament in three East African societies. Amer-ican Journal of Orthopsychiatry, 54, 83–96.
*DiBiase, R. (1991). Temperament and emotional expression in infancy: Ashort-term longitudinal study. (Doctoral dissertation, Temple University,1991). Dissertation Abstracts International, 51, 4615.
*DiLalla, L. F. (1998). Daycare, child, and family influences on preschool-ers’ social behaviors in a peer play setting. Child Study Journal, 28,223–244.
*Dixon, W., & Smith, P. (2000). Links between early temperament andlanguage acquisition. Merrill-Palmer Quarterly, 46, 417–440.
*Doelling, J. L., & Johnson, J. H. (1990). Predicting success in fosterplacement: The contribution of parent-child temperament characteris-tics. American Journal of Orthopsychiatry, 60, 585–593.
*Dollberg, D. G. (1995). The effects of adolescent mothers’ depression,social stress and support, and child temperament on maternal behaviorand child development. (Doctoral dissertation, Columbia University,1995). Dissertation Abstracts International, 56, 1696.
*Donzella, B., Gunnar, M., Krueger, W., & Alwin, J. (2000). Cortisol andvagal tone responses to competitive challenge in preschoolers: Associ-ations with temperament. Developmental Psychobiology, 37, 209–220.
Eaton, W. O., & Enns, L. R. (1986). Sex differences in motor activity level.Psychological Bulletin, 100, 19–28.
*Eisenberg, N., Fabes, R., Guthrie, I., & Reiser, M. (2000). Dispositionalemotionality and regulation: Their role in predicting quality of socialfunctioning. Journal of Personality and Social Psychology, 78, 136–146.
*Enns, L. R. (1989). Infant temperament, home environment and devel-opmental competence. (Doctoral dissertation, University of Manitoba,1989). Dissertation Abstracts International, 49, 4035.
*Erwin, H. (2001). Temperament dimensions of activity, attention, anddistractibility: Concepts and measures. (Doctoral dissertation, Universityof Maryland, College Park, 2000). Dissertation Abstracts International,61, 3464.
*Fagan, J. S. (1989). Maternal stress, child temperament, and behaviorproblems in preschoolers attending urban day care programs. (Doctoraldissertation, Columbia University, 1989). Dissertation Abstracts Inter-national, 49, 3506.
*Fagot, B. L., & Gauvain, M. (1997). Mother–child problem solving;Continuity through the early childhood years. Developmental Psychol-ogy, 33, 480–488.
*Fagot, B. I., & Leve, L. D. (1998). Teacher ratings of externalizingbehavior at school entry for boys and girls: Similar early predictors anddifferent correlates. Journal of Child Psychology and Psychiatry andAllied Disciplines, 39, 555–566.
*Fagot, B. I., & O’Brien, M. (1994). Activity level in young children:Cross-age stability, situational influences, correlates with temperament,and the perception of problem behaviors. Merrill-Palmer Quarterly, 40,378–398.
*Farver, J. M., & Branstetter, W. H. (1994). Preschoolers’ prosocialresponses to their peers’ distress. Developmental Psychology, 30, 334–341.
Feingold, A. (1992). The greater male variability controversy: Scienceversus politics. Review of Educational Research, 62, 89–90.
Feingold, A. (1994). Gender differences in personality: A meta-analysis.Psychological Bulletin, 116, 429–456.
*Field, T., Adler, S., Vega Lahr, N., Scafidi, F., & Goldstein, S. (1987).Temperament and play interaction behavior across infancy. Infant Men-tal Health Journal, 8, 156–165.
*Fish, M. (1998). Negative emotionality and positive/social behavior inrural Appalachian infants: Prediction from caregiver and infant charac-teristics. Infant Behavior and Development, 21, 685–698.
*Fish, M., & Stifter, C. A. (1993). Mother parity as a main and moderatinginfluence on early mother-infant interaction. Journal of Applied Devel-opmental Psychology, 14, 557–572.
*Fitzpatrick, M. (2001). Infant temperament and maternal socialization:Contributors to preschoolers’ emotional competence. (Doctoral disser-tation, University of California, Irvine, 2001). Dissertation AbstractsInternational, 62, 2973.
*Frodi, A. M. (1983). Attachment behavior and sociability with strangersin premature and full-term infants. Infant Mental Health Journal, 4,13–22.
*Fullard, W., McDevitt, S. C., & Carey, W. B. (1984). Assessing temper-
67GENDER DIFFERENCES IN TEMPERAMENT

ament in one- to three-year-old children. Journal of Pediatric Psychol-ogy, 9, 205–217.
*Garner, P., & Power, T. (1996). Pre-schoolers’ emotional control in thedisappointment paradigm and its relation to temperament, emotionalknowledge, and family expressiveness. Child Development, 67, 1406–1419.
*Garner, P., & Spears, F. (2000). Emotion regulation in low incomepreschoolers. Social Development, 9, 246–264.
*Garstein, M., & Rothbart, M. K. (2003). [Child temperament ratings].Unpublished raw data.
*Gasman, I., Purper-Ouakil, D., Michel, G., Mouren-Simeoni, M. C.,Bouvard, M., & Perez-Diaz, F. (2002). Cross-cultural assessment ofchildhood temperament: A confirmatory factor analysis of the FrenchEmotionality, Activity and Sociability (EAS) Questionnaire. EuropeanChild and Adolescent Psychiatry, 11, 101–107.
*Gauvain, M., & Fagot, B. (1995). Child temperament as a mediator ofmother-toddler problem solving. Social Development, 4, 257–276.
*Gennaro, S., Tulman, L., & Fawcett, J. (1990). Temperament in pretermand full-term infants at three and six months of age. Merrill-PalmerQuarterly, 36, 201–215.
*Gibbins, C. (2001). Factors affecting the development of externalizingbehavior problems from birth to 48 months. (Doctoral dissertation,Queen’s University, Kingston, 2001). Dissertation Abstracts Interna-tional, 61, 6736.
*Gibson, F., Ungerer, J., McMahon, C., Leslie, G., & W. B. Saunders, D.(2000). The mother-child relationship following in vitro fertilization:Infant attachment, responsivity, and maternal sensitivity. Journal ofChild Psychology and Psychiatry, 41, 1015–1023.
*Goldsmith, H. H. (1996). Studying temperament via construction of theToddler Behavior Assessment Questionnaire. Child Development, 67,218–235.
Goldsmith, H. H., Buss, A. H., Plomin, R., Rothbart, M. K., Thomas, A.,Chess, S., et al. (1987). Roundtable: What is temperament? Four ap-proaches. Child Development, 58, 505–529.
Goldsmith, H. H., & Hewitt, E. C. (2003). Validity of parental report oftemperament: Distinctions and needed research. Infant Behavior & De-velopment, 26, 108–111.
Goldsmith, H. H., Lemery, K., & Essex, M. J. (2004). Roles for temper-ament in the liability to psychopathology in childhood. In L. F. DiLalla(Ed.), Behavior genetics principles: Perspectives in development, per-sonality, and psychopathology (pp. 19–39). Washington, DC: AmericanPsychological Association.
Goldsmith, H. H., & Rieser-Danner, L. A. (1986). Variation among tem-perament theories and validation studies of temperament assessment. InG. A. Kohnstamm (Ed.), Temperament discussed: Temperament anddevelopment in infancy and childhood (pp. 1–9). Bristol, PA: Swets &Zeitlinger.
Goldsmith, H. H., Rieser-Danner, L. A., & Briggs, S. (1991). Evaluatingconvergent and discriminant validity of temperament questionnaires forpreschoolers, toddlers, and infants. Developmental Psychology, 27,566–579.
*Gonzalez, C., Fuentes, L., Carranza, J., & Estevez, A. (2001). Tempera-ment and attention in the self-regulation of 7 year-old children. Person-ality and Individual Differences, 30, 931–946.
Grossman, M., & Wood, W. (1993). Sex differences in intensity of emo-tional experience: A social role interpretation. Journal of Personalityand Social Psychology, 65, 1010–1022.
*Grunau, R. V., Whitfield, M. F., & Petrie, J. H. (1994). Pain sensitivityand temperament in extremely low birth weight premature toddlers andpreterm and full-term controls. Pain, 58, 341–346.
*Guerin, D. W., & Gottfried, A. W. (1994). Temperamental consequencesof infant difficultness. Infant Behavior and Development, 17, 413–421.
*Guerin, K. B. (1995). Goodness of fit of early adolescents’ temperament
in the contexts of home and school. (Doctoral dissertation, FordhamUniversity, 1995). Dissertation Abstracts International, 56, 2796.
*Gumora, G. (2000). Emotion regulation and academic achievement.(Doctoral dissertation, Yeshiva University, 2000). Dissertation Ab-stracts International, 61, 2796.
*Gunn, P., & Berry, P. (1985). The temperament of Down’s syndrometoddlers and their siblings. Journal of Child Psychology and Psychiatryand Allied Disciplines, 26, 973–979.
*Gunnar, M., Tout, K., deHaan, M., & Pierce, S. (1997). Temperament,social competence, and adrenocortical activity in preschoolers. Devel-opmental Psychobiology, 31, 65–85.
*Hagekull, B., & Bohlin, G. (1998). Preschool temperament and environ-mental factors related to the five factor model of personality in middlechildhood. Merrill-Palmer Quarterly, 44, 194–215.
Hall, J. A., & Carter, J. D. (1999). Gender-stereotype accuracy as anindividual difference. Journal of Personality and Social Psychology, 77,350–359.
Hall, J. A., & Halberstadt, A. G. (1986). Smiling and gazing. In J. S. Hyde& M. C. Linn (Eds.), The psychology of gender: Advances throughmeta-analysis (pp. 136–158). Baltimore: John Hopkins UniversityPress.
*Halpern, L., Anders, T., & Garcia-Coll, C. (1994). Infant temperament: Isthere a relation to sleep-wake states and maternal nighttime behavior?Infant Behavior and Development, 17, 255–263.
*Halpern, L., Brand, K., & Malone, A. (2001). Parenting stress in mothersof very low birthweight and full-term infants: A function of infantbehavioral characteristics and child rearing attitudes. Journal of Pediat-ric Psychology, 26, 23–104.
*Halpern, L., & Garcia-Coll, C. (2000) Temperament of small for gesta-tional age and appropriate for gestational age infants across the first yearof life. Merrill-Palmer Quarterly, 46, 738–765.
*Halpern, L., Garcia-Coll, C., Meyer, E., & Bendarsky, K. (2001). Thecontributions of temperament and maternal responsiveness to the mentaldevelopment of small for gestational age and appropriate for gestationalage infants. Journal of Applied Developmental Psychology, 22, 199–224.
Hankin, B., Abramson, L., Moffitt, T., Silva, P., McGee, R., & Angell, K.(1998). Development of depression from preadolescence to young adult-hood: Emerging gender differences in a 10-year longitudinal study.Journal of Abnormal Psychology, 107, 128–140.
*Hannan, K., & Luster, T. (1991). Influence of parent, child, and contex-tual factors on the quality of the home environment. Infant MentalHealth Journal, 12, 17–30.
*Hayes, M. J., Parker, K. G., Sallinen, B., & Davare, A. A. (2001).Bedsharing, temperament, and sleep disturbance in early childhood.Sleep: Journal of Sleep and Sleep Disorders Research, 24, 657–662.
*Healy, B. T. (1987). An analysis of the genetic, physiological, andbehavioral correlates to temperament in young children. (Doctoral dis-sertation, University of Maryland, College Park, 1987). DissertationAbstracts International, 47, 3982.
Hedges, L. V., & Becker, B. J. (1986). Statistical methods in the meta-analysis of research on gender differences. In J. S. Hyde & M. C. Linn(Eds.), The psychology of gender: Advances through meta-analysis (pp.14–50). Baltimore: John Hopkins University Press.
Hedges, L. V., & Friedman, L. (1993). Gender differences in variability inintellectual abilities: A reanalysis of Feingold’s results. Review of Edu-cational Research, 63, 94–105.
Hedges, L. V., & Vevea, J. L. (1996). Estimating effect size under publi-cation bias: Small sample properties and robustness of a random effectsselection model. Journal of Educational and Behavioral Statistics, 21,299–332.
Hedges, L. V., & Vevea, J. L. (1998). Fixed- and random-effects models inmeta-analysis. Psychological Methods, 3, 486–504.
Hegvik, R. L., McDevitt, S. C., & Carey, W. B. (1982). The Middle
68 ELSE-QUEST, HYDE, GOLDSMITH, AND VAN HULLE

Childhood Temperament Questionnaire. Developmental and BehavioralPediatrics, 3, 197–200.
*Henderson, H., Fox, N., & Rubin, K. (2001). Temperamental contribu-tions to social behavior: The moderating roles of frontal EEG symmetryand gender. Journal of the American Academy of Child & AdolescentPsychiatry, 40, 68–74.
*Hess, L. K., & Atkins, M. S. (1998). Victims and aggressors at school:Teacher, self, and peer perceptions of psychosocial functioning. AppliedDevelopmental Science, 2, 75–89.
*Hildebrandt, K. A., & Cannan, T. (1985). The distribution of caregiverattention in a group program for young children. Child Study Journal,15, 43–55.
*Hobson-Underwood, P. A. (1989). Child context interactions: Tempera-ment and the development of peer group status among previouslyunacquainted children. (Doctoral dissertation, University of Victoria,1989). Dissertation Abstracts International, 50, 5176.
*Hollis, A. L. (1995). Predicting school readiness using cognitive screen-ing, temperament, and school environment. (Doctoral dissertation, Uni-versity of South Carolina, 1995). Dissertation Abstracts International,56, 0143.
*Houck, G. (1999). The measurement of child characteristics from infancyto toddlerhood: Temperament, developmental competence, self concept,and social competence. Issues in Comprehensive Pediatric Nursing, 22,101–127.
*Houldin, A. D. (1988). Maternal, child, and family characteristics as theyrelate to the quality of the child rearing environment. (Doctoral disser-tation, Temple University, 1988). Dissertation Abstracts International,49, 1981.
*Ispa, J. M., Fune, M. A., & Thornburg, K. R. (2002). Maternal personalityas a moderator of relations between difficult infant temperament andattachment security in low income families. Infant Mental Health Jour-nal, 23, 130–144.
Katzman, S., & Alliger, G. M. (1992). Averaging untransformed varianceratios can be misleading: A comment on Feingold. Review of Educa-tional Research, 62, 427–428.
*Kemple, K., David, G., & Wang, Y. (1996). Preschoolers’ creativity,shyness, and self-esteem. Creativity Research Journal, 9, 317–326.
Kessler, R., McGonagle, K., Swartz, M., Blazer, D., & Nelson, C. (1993).Sex and depression in the National Comorbidity Survey, 1: Lifetimeprevalence, chronicity and recurrence. Journal of Affective Disorders,29, 85–96.
Klein, D. N., & Shih, J. H. (1998). Depressive personality: Associationswith DSM–III–R mood and personality disorders and negative andpositive affectivity, 30-month stability, and prediction of course of AxisI depressive disorders. Journal of Abnormal Psychology, 107, 319–327.
*Klein, H. A. (1992). Individual temperament and emerging self-percep-tion: An interactive perspective. Journal of Research in ChildhoodEducation, 6, 113–120.
*Kochanska, G. (1998). Mother–child relationship, child fearfulness, andemerging attachment: A short-term longitudinal study. DevelopmentalPsychology, 34, 480–490.
*Kochanska, G., Coy, K. C., Tjebkes, T., & Husarek, S. (1998). Individualdifferences in emotionality in infancy. Child Development, 69, 375–390.
*Kochanska, G., Murray, K., & Coy, K. C. (1997). Inhibitory control as acontributor to conscience in childhood: From toddler to early school age.Child Development, 68, 263–277.
*Kochanska, G., Murray, K., Jacques, T. Y., Koenig, A. L., & Vandegeest,K. A. (1996). Inhibitory control in young children and its role inemerging internalization. Child Development, 67, 490–507.
Kohnstamm, G. A. (1989). Temperament in childhood: Cross-cultural andsex differences. In Kohnstamm, G. A., Bates, J. E., & Rothbart, M. K.(Eds.), Temperament in childhood (pp. 483–508). New York: Wiley.
*Korner, A. F., Zeanah, C. H., Linden, J., Berkowitz, R. I., Kraemer, H. C.,
& Agras, W. S. (1985). The relation between neonatal and later activityand temperament. Child Development, 56, 38–42.
*Krenn, M. (1997). Mastery motivation and its relation to temperament inchildhood: A short-term longitudinal study. (Doctoral dissertation, Uni-versity of Manitoba, 1997). Dissertation Abstracts International, 57,4260.
Kring, A. M., & Gordon, A. H. (1998). Sex differences in emotion:Expression, experience, and physiology. Journal of Personality andSocial Psychology, 74, 686–703.
LaFrance, M., Hecht, M. A., & Paluck, E. L. (2003). The contingent smile:A meta-analysis of sex differences in smiling. Psychological Bulletin,129, 305–334.
Lahey, B. B., Moffitt, T. E., & Caspi, A. (2003). Causes of conductdisorder and juvenile delinquency. New York: Guilford Press.
*Lamb, M. E., Hwang, C. P., Bookstein, F. L., Broberg, A., Hult, G., &Frodi, M. (1988). Determinants of social competence in Swedish pre-schoolers. Developmental Psychology, 24, 58–70.
*Lamb, M. E., Hwang, C. P., Broberg, A., & Bookstein, F. L. (1990). Theeffects of out-of-home care on the development of social competence inSweden: A longitudinal study. In N. Fox & G. G. Fein (Eds.), Infant daycare: The current debate (pp. 145–168). Westport, CT: Ablex.
*Laumakis, M. (2001). The effects of family environment variables onyoung children’s school behavior and peer interactions. (Doctoral dis-sertation, University of Southern California, 2001). Dissertation Ab-stracts International, 61, 4991.
*Lehtonen, L., Korhonen, T., & Korvenranta, J. (1994). Temperament andsleeping patterns in colicky infants during the first year of life. Journalof Developmental Behavioral Pediatrics, 15, 416–420.
*Lemery, K. (2000). Exploring the etiology of the relationship betweentemperament and behavior problems in children. (Doctoral dissertation,University of Wisconsin, 2000). Dissertation Abstracts International,61, 1112.
Lemery, K. S., Essex, M. J., & Smider, N. A. (2002). Revealing the relationbetween temperament and behavior problem symptoms by eliminatingmeasurement confounding: Expert ratings and factor analyses. ChildDevelopment, 73, 867–882.
*Lengua, L. J., Sandler, I. N., West, S. G., Wolchik, S. A., & Curran, P. J.(1999). Emotionality and self-regulation, threat appraisal, and coping inchildren of divorce. Development and Psychopathology, 11, 15–37.
*Lengua, L., Wolchik, S., Sandler, I., & West, S. (2000). The additive andinteractive effects of parenting and temperament in predicting adjust-ment problems of children of divorce. Journal of Clinical Child Psy-chology, 29, 232–244.
Lerner, R. M., Palermo, M., Spiro, A., III, & Nesselroade, J. R. (1982).Assessing the dimensions of temperamental individuality across the lifespan: The Dimensions of Temperament Survey (DOTS). Child Devel-opment, 54, 149–159.
*Leve, L., Scaramella, L., & Fagot, B. (2001). Infant temperament, plea-sure in parenting, and marital happiness in adoptive families. InfantMental Health Journal, 22, 545–558.
*Lewis, K. (1999). Maternal style in reminiscing relations to child indi-vidual differences. Cognitive Development, 14, 381–399.
*Liddell, A. (1990). Personality characteristics versus medical and dentalexperiences of dentally anxious children. Journal of Behavioral Medi-cine, 13, 183–194.
*Luby, J., Svrakic, D., McCallum, K., Przybeck, T., & Cloninger, R.(1999). The junior temperament and character inventory: Preliminaryvalidation of a child self-report measure. Psychological Reports, 84,1127–1138.
Lytton, H., & Romney, D. M. (1991). Parents’ differential socialization ofboys and girls: A meta-analysis. Psychological Bulletin, 109, 267–296.
Maccoby, E. E. (1990). Gender and relationships: A developmental ac-count. American Psychologist, 45, 513–520.
69GENDER DIFFERENCES IN TEMPERAMENT

Maccoby, E. E. (1998). The two sexes: Growing up apart, coming together.Cambridge, MA: Harvard University Press.
Maccoby, E. E., & Jacklin, C. N. (1974). The psychology of sex differences.Stanford, CA: Stanford University Press.
Maccoby, E. E., Snow, M. E., & Jacklin, C. N. (1984). Children’s dispo-sitions and mother-child interaction at 12 and 18 months: A short-termlongitudinal study. Developmental Psychology, 20, 459–472.
*Martin, R. P., & Bridger, R. C. (1999). Temperament Assessment Batteryfor Children—Revised. Athens, GA: University of Georgia, SchoolPsychology Clinic.
*Martin, R. P., Wisenbaker, J., & Baker, J. (1997). Gender differences intemperament at six months and five years. Infant Behavior and Devel-opment, 20, 339–347.
*Mathiesen, K., & Tambs, K. (1999). The EAS temperament question-naire: Actor structure, age trends, reliability, and stability in a Norwe-gian sample. Journal of Child Psychology and Psychiatry and AlliedDisciplines, 40, 431–439.
*Maziade, M., Boudreault, M., Thivierge, J., Caperaa, P., & Cote, R.(1984). Infant temperament: SES and gender differences and reliabilityof measurement in a large Quebec sample. Merrill-Palmer Quarterly,30, 213–226.
*Maziade, M., Cote, R., Boudreault, M., Thivierge, J., & Caperaa, P.(1984). The New York Longitudinal Studies model of temperament:Gender differences and demographic correlates of a French-speakingpopulation. Journal of the American Academy of Child Psychiatry, 23,582–587.
*McClowry, S. G. (1989). The effect of temperament and the environmenton the behavior of hospitalized school age children. (Doctoral disserta-tion, University of California, San Francisco, 1989). Dissertation Ab-stracts International, 49, 3677.
*McClowry, S. G. (1995). The development of the school-age tempera-ment inventory. Merrill-Palmer Quarterly, 41, 271–285.
McDevitt, S. C., & Carey, W. B. (1978). The measurement of temperamentin 3–7 year old children. Journal of Child Psychology and Psychiatry,19, 245–253.
*McKim, M., Cramer, K., Stuart, B., & O’Connor, D. (1999). Infant caredecisions and attachment security: The Canadian transition to child carestudy. Canadian Journal of Behavioral Science, 31, 92–106.
*Mednick, B. R., Hocevar, D., Baker, R. L., & Schulsinger, C. (1996).Personality and demographic characteristics of mothers and their ratingsof child difficultness. International Journal of Behavioral Development,19, 121–140.
*Melhuish, E., Moss, P., Mooney, A., & Martin, S. (1991). How similar areday-care groups before the start of day care? Journal of Applied Devel-opmental Psychology, 12, 331–346.
*Mevarech, Z. R. (1985). The relationships between temperament charac-teristics, intelligence, task engagement and mathematics achievement.British Journal of Educational Psychology, 55, 156–163.
*Miceli, P. (1998). Intrapersonal and environmental influences on infantinformational processing: The role of temperament and parenting. (Doc-toral dissertation, University of Notre Dame, 1998). Dissertation Ab-stracts International, 59, 3097.
*Miller, K. J. (2002). Temperamental dimension of approach/avoidance:An exploration of concepts and measures. (Doctoral dissertation, Uni-versity of Maryland, College Park, 2002). Dissertation Abstracts Inter-national, 62, 6011.
*Miller, M. (2000). The relationship of temperament at school entry,cognitive ability, gender, SES, and at-risk status to later school achieve-ment. (Doctoral dissertation, University of Pennsylvania, 2000). Disser-tation Abstracts International, 60, 2372.
Moffitt, T. E., & Caspi, A. (2001). Childhood predictors differentiatelife-course persistent and adolescence-limited antisocial pathwaysamong males and females. Development and Psychopathology, 13, 355–375.
*Myers, J. (1998). Gender, age, intelligence, and temperament as moder-ators of successful peer relationships in children and adolescents understress. (Doctoral dissertation, University of Cincinnati, 1998). Disserta-tion Abstracts International, 58, 4527.
*Nelson, B., Martin, R., Hodge, S., Havill, V., & Kamphaus, R. (1999).Modeling the prediction of elementary school adjustment from pre-school temperament. Personality and Individual Differences, 26, 687–700.
*Nelson, J. A., & Simmerer, N. J. (1984). A correlational study of chil-dren’s temperament and parent behavior. Early Child Development andCare, 16, 231–250.
*Neu, M. (1997). Irritable infants: Their childhood characteristics. (Doc-toral dissertation, University of Colorado Health Sciences Center, 1997).Dissertation Abstracts International, 58, 1805.
Nigg, J. T., Goldsmith, H. H., & Sachek, J. (2004). Temperament andattention-deficit/hyperactivity disorder: Preliminary convergence acrosschild temperament and adult personality data may aid a multi-pathwaymodel. Journal of Clinical Child and Adolescent Psychology, 33, 42–53.
Nolen-Hoeksema, S. (1990). Sex differences in depression. Stanford, CA:Stanford University Press.
*O’Callaghan, M. (1999). Temperamental instability in children of ado-lescent mothers: Correlates of change and implications for development.(Doctoral dissertation, University of Notre Dame, 1997). DissertationAbstracts International, 60, 2989.
*Ottaviano, S., Innocenzi, M., Antignani, M., Ottaviano, P., & Bruni, O.(1997). The Keogh’s Teacher Temperament Questionnaire (short forms)for 8–11 year-old Italian children. Giornale di Neuropsichiatria dell’EtaEvolutiva, 17, 153–158.
*Ottaviano, S., Innocenzi, M., Ottaviano, P., Antignani, M., Bruni, O., &Giannotti, F. (1993). Short temperament questionnaire for children aged8–12 years in the city of Rome. Functional Neurology, 8, 365–371.
*Owens-Stively, J., Frank, N., Smith, A., Hagnio, W., Spirito, A., Arrigan,M., & Alario, A. (1997). Child temperament parenting discipline style,and daytime behavior in childhood sleep disorders. Journal of Develop-mental and Behavioral Pediatrics, 18, 314–321.
*Paguio, L., & Hollet, N. (1991). Temperament and creativity of pre-schoolers. Journal of Social Behavior and Personality, 6, 975–982.
*Parritz, R. H. (1996). A descriptive analysis of toddler coping in chal-lenging circumstances. Infant Behavior and Development, 19, 171–180.
*Pauli-Pott, U., Darui, A., & Beckmann, D. (1999). Infants with atopicdermatitis: Maternal hopelessness, child rearing attitudes and perceivedinfant temperament. Psychotherapy and Psychosomatics, 68, 39–45.
*Pauli-Pott, U., Meresacker, B., Bade, U., Bauer, C., & Beckmann, D.(2000). Contexts of relations of infant negative emotionality to caregiv-er’s reactivity/sensitivity. Infant Behavior and Development, 23, 23–29.
*Pellegrini, A. D., & Bartini, M. (2000). A longitudinal study of bullying,victimization, and peer affiliation during the transition from primaryschool to middle school. American Educational Research Journal, 37,699–725.
*Pierrehumbert, B., Mijkovitch, R., Plancherel, B., Halfon, O., & Anser-met, F. (2000). Attachment and temperament in early childhood: Impli-cations for later behavior problems. Infant and Child Development, 9,17–32.
*Pilkington, C. L. (1989). Temperamental and parental correlates of child-hood fears. (Doctoral dissertation, University of Nebraska—Lincoln,1989). Dissertation Abstracts International, 49, 3667–3668.
*Pitkin, K. S. (1993). Continuity of temperament across early childhood.(Doctoral dissertation, University of Minnesota, 1993). DissertationAbstracts International, 53, 4395.
Plant, E. A., Hyde, J. S., Keltner, D., & Devine, P. G. (2000). The genderstereotyping of emotions. Psychology of Women Quarterly, 24, 81–92.
*Pliner, P., & Loewen, R. (1997). Temperament and food neophobia inchildren. Appetite, 28, 239–254.
*Plumert, J., & Schwebel, D. C. (1997). Social and temperamental influ-
70 ELSE-QUEST, HYDE, GOLDSMITH, AND VAN HULLE
ences on children’s overestimation of their physical abilities: Links toaccidental injuries. Journal of Experimental Child Psychology, 67, 317–337.
*Plunkett, J. W., Cross, D. R., & Meisels, S. J. (1989). Temperamentratings by parents of preterm and full-term infants. Early ChildhoodResearch Quarterly, 4, 317–330.
*Porwancher, D. (1991). A comparison of kindergarten performance on theGesell School Readiness Test to independent measures of intelligence,temperament, and achievement. (Doctoral dissertation, Rutgers StateUniversity of New Jersey, New Brunswick, 1991). Dissertation Ab-stracts International, 52, 1695–1696.
Presley, R., & Martin, R. P. (1994). Toward a structure of preschooltemperament: Factor structure of the Temperament Assessment Batteryfor Children. Journal of Personality, 62, 415–448.
*Pridham, K. F., Chang, A. S., & Chiu, Y. M. (1994). Mothers’ parentingself-appraisals: The contribution of perceived infant temperament. Re-search in Nursing and Health, 17, 381–392.
*Puentes-Neuman, G. (2000). Toddlers’ social coordination with an unfa-miliar peer: Patternings of attachment, temperament, and coping duringdyadic change. (Doctoral dissertation, University of Montreal, 2000).Dissertation Abstracts International, 61, 1674.
*Putnam, S. P. (2003). [Child temperament ratings]. Unpublished raw data.*Raikkonen, K., Katainen, S., Keskivaara, P., & Kelikangas-Jarvinen, J. L.
(2000). Temperament, mothering, and hostile attitudes: A 12-year lon-gitudinal study. Personality and Social Psychology Bulletin, 26, 3–12.
*Ravaja, N., Katainen, S., & Keltigangas, J. L. (2001). Perceived difficulttemperament, hostile maternal child rearing attitudes and insulin resis-tance. Psychotherapy and Psychosomatics, 70, 66–77.
*Reed, R. A. (1994). A study of the relationship between childhoodtemperament and childhood stress response using theory-based behaviorrating scales. (Doctoral dissertation, University of Pittsburgh, 1994).Dissertation Abstracts International, 55, 1203.
Rosenfield, S. (2000). Gender and dimensions of the self. In E. Frank (Ed.),Gender and its effects on psychopathology (pp. 23–36). Washington,DC: American Psychiatric Press.
Rosenthal, R. (1979). The file drawer problem and tolerance for nullresults. Psychological Bulletin, 86, 638–661.
*Roth, K., Eisenberg, N., & Sell, E. R. (1984). The relation of preterm andfull-term infants’ temperament to test-taking behaviors and developmen-tal status. Infant Behavior and Development, 7, 495–505.
Rothbart, M. K. (1981). Measurement of temperament in infancy. ChildDevelopment, 52, 569–578.
*Rothbart, M. K. (1986). Longitudinal observation of infant temperament.Developmental Psychology, 22, 356–365.
Rothbart, M. K., Ahadi, S. A., & Evans, D. E. (2000). Temperament andpersonality: Origins and outcomes. Journal of Personality and SocialPsychology, 78, 122–135.
Rothbart, M. K., Ahadi, S. A., & Hershey, K. L. (1994). Temperament andsocial behavior in childhood. Merrill-Palmer Quarterly, 40, 21–39.
Rothbart, M. K., & Bates, J. (1998). Temperament. In N. Eisenberg (Ed.)& P. H. Mussen (Series Ed.), Handbook of child psychology: Vol. 3.Social, emotional, & personality development (pp. 105–176). New York:Wiley.
Rothbart, M. K., & Derryberry, D. (1981). Development of individualdifferences in temperament. In M. E. Lamb & A. L. Brown (Eds.),Advances in developmental psychology (Vol. 1, pp. 37–86). Hillsdale,NJ: Erlbaum.
Rowe, D. C., & Plomin, R. (1977). Temperament in early childhood.Journal of Personality Assessment, 41, 150–156.
*Rubin, K., Nelson, L., Hastings, P., & Asendorpf, J. (1999). The trans-action between parents’ perceptions of their children’s shyness and theirparenting styles. International Journal of Behavioral Development, 23,937–957.
*Rundman, D. (2001). Temperament in early childhood: Convergence of
measures and cross-cultural comparisons. (Doctoral dissertation, Uni-versity of Oregon, 2001). Dissertation Abstracts International, 61, 5031.
*Sadeh, A., Lavie, P., & Scher, A. (1994). Sleep and temperament:Maternal perceptions of temperament of sleep-disturbed toddlers. EarlyEducation and Development, 5, 311–322.
*Sanson, A. V., Prior, M., & Oberklaid, F. (1985). Normative data ontemperament in Australian infants. Australian Journal of Psychology,37, 185–195.
*Saudino, K. J., & Eaton, W. O. (1995). Continuity and change in objec-tively assessed temperament: A longitudinal twin study of activity level.British Journal of Developmental Psychology, 13, 81–95.
*Saudino, K. J., Plomin, R., & DeFries, J. C. (1996). Tester-relatedtemperament at 14, 20, and 24 months: Environmental change andgenetic continuity. British Journal of Developmental Psychology, 14,129–144.
Scarr, S., & McCartney, K. (1983). How people make their own environ-ments: A theory of genotype-environment effects. Child Development,54, 424–435.
*Scher, A., & Mayseless, O. (2000). Mothers of anxious/ambivalent in-fants: Maternal characteristics and child care context. Child Develop-ment, 71, 1629–1639.
*Schmitz, S., Fulker, D., Plomin, R., Zahn-Waxler, C., Emde, R., &DeFries, J. (1999). Temperament and problem behaviour during earlychildhood. International Journal of Behavioral Development, 23, 333–355.
*Schmitz, S., Saudino, K. J., Plomin, R., Fulkner, D. W., & DeFries, J. C.(1996). Genetic and environmental influences on temperament in middlechildhood: Analysis of Teacher and tester ratings. Child Development,67, 409–422.
*Schoen, M. J. (1990). Temperament and Metropolitan Readiness scores ina kindergarten sample. (Doctoral dissertation, University of South Caro-lina, 1990). Dissertation Abstracts International, 51, 2073.
*Schoen, M. J., & Nagle, R. J. (1994). Prediction of school readiness fromkindergarten temperament scores. Journal of School Psychology, 32,135–147.
*Schor, D. P. (1983). PKU and temperament: Rating children three throughseven years old in PKU families. Clinical Pediatrics, 22, 807–811.
*Schor, D. P. (1985). Temperament and the initial school experience.Children’s Health Care, 13, 129–134.
*Schwarz, R. L. (2002). Distinguishing between sociable and unsociablepassive withdrawal in childhood: Motivation factors and psychosocialoutcomes. (Doctoral dissertation, Purdue University, 2002). DissertationAbstracts International, 62, 5412.
*Schwebel, D. C. (2001). Relations between children’s temperament, abilityestimation, and unintentional injuries. (Doctoral dissertation, University ofIowa, Iowa City, 2000). Dissertation Abstracts International, 61, 4428.
*Schwebel, D. C. (2003). [Child temperament ratings]. Unpublished rawdata.
*Schwebel, D. C., Binder, S. C., Sales, J. M., & Plumert, J. M. (1999).[Child temperament ratings]. Unpublished raw data.
*Schwebel, D. C., & Bounds, M. L. (2003). [Child temperament ratings].Unpublished raw data.
*Schwebel, D. C., & Plumert, J. (1999). Longitudinal and concurrentrelations among temperament, ability estimation, and injury proneness.Child Development, 70, 700–712.
*Sears, R. (1999). The relations among family environment, peer interac-tions, social cognition, and social competence. (Doctoral dissertation,George Mason University, 1999). Dissertation Abstracts International,60, 1352.
Seidlitz, L., & Diener, E. (1998). Sex differences in the recall of affectiveexperiences. Journal of Personality and Social Psychology, 74, 262–271.
Seifer, R. (2003). Twin studies, biases of parents, and biases of researchers.Infant Behavior & Development, 26, 115–117.
Shiner, R., & Caspi, A. (2003). Personality differences in childhood and
71GENDER DIFFERENCES IN TEMPERAMENT

adolescence: Measurement, development, and consequences. Journal ofChild Psychology and Psychiatry, 44, 2–32.
*Simons, C. J. (1983). Parental temperament ratings for risk/non-riskinfants. (Doctoral dissertation, West Virginia University, 1983). Disser-tation Abstracts International, 44, 1991.
*Simpson, A. E., & Stevenson-Hinde, J. (1985). Temperamental charac-teristics of three to four year-old boys and girls and child familyinteractions. Journal of Child Psychology and Psychiatry and AlliedDisciplines, 26, 43–53.
Skodol, A. E. (2000). Gender-specific etiologies for antisocial and borderlinepersonality disorders? In E. Frank (Ed.), Gender and its effects on psycho-pathology (pp. 37–58). Washington, DC: American Psychiatric Press.
*Steir, A. J., & Lehman, E. B. (2000). Attachment to transitional objects:Role of maternal personality and mother toddler interaction. AmericanJournal of Orthopsychiatry, 70, 340–350.
Stern, M., & Karraker, K. H. (1989). Sex stereotyping of infants: A reviewof gender labeling studies. Sex Roles, 20, 501–522.
*Stifter, C. (1988). A study of the causal relationship between physiolog-ical functioning and later temperament from birth to 5 months of age.(Doctoral dissertation, University of Maryland, College Park, 1988).Dissertation Abstracts International, 48, 2805.
*Stifter, C., & Jain, A. (1996). Psychophysiological correlates of infanttemperament: Stability of behavior and autonomic patterning. Develop-mental Psychobiology, 29, 379–391.
Strelau, J. (1998). Temperament: A psychological perspective. New York:Plenum Press.
*Sull, I. (1995). Temperament, mother-child attachment, and peer relation-ships in Korean preschool children. (Doctoral dissertation, Temple Uni-versity, 1995). Dissertation Abstracts International, 56, 3480.
*Sullivan, M. C. (1995). Maternal control style in preschool children bornat medical risk. (Doctoral dissertation, University of Rhode Island,1995). Dissertation Abstracts International, 55, 3823.
*Susman, E., Schmeelk, K., Ponirakis, A., & Gariepy, J. (2001). Maternalprenatal, postpartum, and concurrent stressors and temperament in 3year-olds: A person and variable analysis. Development and Psychopa-thology, 13, 629–652.
Thomas, A., & Chess, S. (1977). Temperament and development. Oxford,England: Brunner/Mazel.
Thomas, A., & Chess, S. (1980). The dynamics of psychological develop-ment. New York: Brunner/Mazel.
Thomas, A., Chess, S., Birch, H. G., Hertzig, M. E., & Korn, S. (1963).Behavioral individuality in early childhood. New York: New YorkUniversity.
Turkewitz, G., & Devenny, D. (1993). Developmental time and timing.Hillsdale, NJ: Erlbaum.
Twenge, J. M., & Nolen-Hoeksema, S. (2002). Age, gender, race, socio-economic status, and birth cohort differences on the Children’s Depres-sion Inventory: A meta-analysis. Journal of Abnormal Psychology, 111,578–588.
*Van Hulle, C. A. (2001). Continuity and change in temperament throughmiddle childhood. (Doctoral dissertation, University of Colorado atBoulder, 2001). Dissertation Abstracts International, 62, 1131.
*Vaughn, B. E., Bradley, C. F., Joffe, L. S., Seiffer, R., & Barglow, P.(1987). Maternal characteristics measured prenatally are predictive ofratings of temperamental “difficulty” on the Carey Infant TemperamentQuestionnaire. Developmental Psychology, 23, 152–161.
*Vitaro, F., Brendgen, M., & Tremblay, R. E. (2002). Reactively andproactively aggressive children: Antecedent and subsequent character-istics. Journal of Child Psychology and Psychiatry and Allied Disci-plines, 43, 495–506.
*Von Bargen, D. M. (1987). Temperament and physiological responses:Relationships among temperament ratings, galvanic skin response, andheart rate in preschool children. (Doctoral dissertation, University ofManitoba, 1987). Dissertation Abstracts International, 47, 3987–3988.
Weber, R., & Crocker, J. (1983). Cognitive processes in the revision ofstereotypic beliefs. Journal of Personality and Social Psychology, 45,961–977.
*Weissbluth, M. (1984). Sleep duration, temperament, and Conners’ rat-ings of three-year-old children. Journal of Developmental and Behav-ioral Pediatrics, 5, 120–123.
Weissman, M., & Klerman, G. (1977). Sex differences and the epidemi-ology of depression. Archives of General Psychiatry, 34, 98–111.
Weissman, M., Leaf, P., Holzer, C., Myers, J., & Tischler, G. (1984). Theepidemiology of depression: An update on sex differences in rates.Journal of Affective Disorders, 7, 1707–1713.
*Wertlieb, D., Weigel, C., & Feldstein, M. (1988). The impact of stress andtemperament on medical utilization by school age children. Journal ofPediatric Psychology, 13, 409–421.
*Wertlieb, D., Weigel, C., Springer, T., & Feldstein, M. (1987). Temper-ament as a moderator of children’s stressful experiences. AmericanJournal of Orthopsychiatry, 57, 234–245.
*Williams, T. (1992). Mother’s representation of her infant and infant’stemperament rating. (Doctoral dissertation, City University of NewYork, 1992). Dissertation Abstracts International, 52, 4496.
*Wills, T. A., Cleary, S. D., Filer, M., Shinar, O., Mariani, J., & Spera, K.(2001). Temperament related to early-onset substance use: Test of adevelopmental model. Prevention Science, 2, 145–163.
*Wills, T. A., Gibbons, F., Gerrard, M., & Brody, G. (2000). Protectionand vulnerability processes relevant for early onset of substance use: Atest among African American children. Health Psychology, 19, 253–263.
*Wills, T. A., & Stoolmiller, M. (2002). The role of self-control in earlyescalation of substance use: A time-varying analysis. Journal of Con-sulting and Clinical Psychology, 70, 986–997.
Windle, M., Iwawaki, S., & Lerner, R. M. (1988). Cross-cultural compa-rability of temperament among Japanese and American preschool chil-dren. International Journal of Psychology, 23, 219–235.
Windle, M., & Lerner, R. M. (1986). Reassessing the dimensions oftemperamental individuality across the life span: The Revised Dimen-sions of Temperament Survey (DOTS-R). Journal of Adolescent Re-search, 1, 213–230.
*Worobey, J. (1998). Feeding method and motor activity in 3-month-oldhuman infants. Perceptual and Motor Skills, 86, 883–895.
*Wulfsohn, S. (2000). Children’s adjustment to first grade: Contributionsof children’s temperament, positive mothering and positive fathering.(Doctoral dissertation, University of Wisconsin, 2000). DissertationAbstracts International, 61, 2800.
*Yen, S., & Ispa, J. (2000). Children’s temperament and behavior inMontessori and constructivist early childhood programs. Early Educa-tion and Development, 11, 171–186.
*Yolton, K. A. (1993). Psychosocial, behavioral, and developmental char-acteristics of prenatal cocaine exposure. (Doctoral dissertation, OhioState University, 1993). Dissertation Abstracts International, 53, 5064.
*Zahn-Waxler, C., Schmitz, S., Fulker, D., Robinson, J., & Emde, R. (1996).Behavior problems in 5-year-old monozygotic and dizygotic twins: Geneticand environmental influences, patterns of regulation, and internalization ofcontrol. Development and Psychopathology, 8, 103–122.
*Zahr, L., & El-Haddad, A. (1998). Temperament and chronic illness inEgyptian children. International Journal of Intercultural Relations, 22,453–465.
*Zimmermann, L. (1998). Relations between temperament, emotion reg-ulation, and the HPA system in three-year-old children. (Doctoral dis-sertation, University of New Mexico, 1998). Dissertation AbstractsInternational, 58, 5675.
Received April 25, 2004Revision received April 27, 2005
Accepted May 9, 2005 �
72 ELSE-QUEST, HYDE, GOLDSMITH, AND VAN HULLE