gelatinized starch investigation - mathematical...
TRANSCRIPT

Gelatinized Starch Investigation
Kathryn Sharpe
August 17, 2004
1 Introduction
This experiment explores the effects of heat and water on starches. A starch is apolysaccharide—a long chain of sugar molecules [1]. It is made up of both amylose andamylopectin, and each type of starch contains a different percentage of each [2]. As a starchis heated to a particular temperature (between 62◦C and 75◦C for most types of starch),it begins to undergo gelatinization [5]. According to J.M.V. Blanshard of the University ofNottingham, “Gelatinization refers loosely both to the loss of order (...) and also to theswelling of the granule” [2]. The loss of order mentioned here is the breaking down of thestarch chain that allows for water absorption and disruption of the crystalline structure ofthe starch [5]. Gelatinization is important because it changes the taste and texture of astarch granule and makes it easier to digest [4]. We will study the process of gelatinization,how it happens, and under what conditions it occurs. Below are some pictures taken with adigital microscope of potato starch before and after cooking. Figure 1 shows a raw slice ofpotato with an evident crystalline structure. Figure 2 shows what the starch granules looklike after they have absorbed some water and expanded. (Note: Taking some time to usethe microscope offers a very helpful visual component for the experiment.)
Studies previously done on the gelatinization of starches have shown mixed results. Ex-periments by Chi Kai show a linear relationship between time and water uptake by rice as
Figure 1: Raw potato slice viewed at 100 times magnification

Figure 2: Potato slice cooked in a microwave for 2 minutes in water at 100 times magnification
it is soaked and heated [3]. Other results include those of Landman and McGuiness in theirmodeling of the cooking of a cereal grain, which is clearly nonlinear [4]. Our preliminary re-sults also indicate a nonlinear relationship. Other experiments have been done with starchesto measure heat transfer over cooking time. The results of these agree with our heat transfermodel and show a nonlinear relationship between time and percentage gelatinized [6].
We use both rice and potatoes to explore starch gelatinization and water absorption. Weare interested in the change of void fraction of rice after it has been heated and absorbed waterto its maximum capacity, as this may affects our model of water absorption. Additionally,we will work with potatoes and heat transfer, as well as percentage cooked over time. Ourgoal is to find a predictive model of the effects of gelatinization. Ready, Set, Cook!
2 Safety
Caution: Water in tank may be very hot. Also, be very careful when using the microtome,as the blades are very sharp.
3 Microscopy: A Visual Component
Learning to use a digital microscope will be very helpful in this investigation. Below area few basic tips for using a digital microscope:
1. Make sure you have plenty of slides and slide covers.
2. Select a slide and lay your specimen on it.
3. Place cover on a wet sample. You do not need a cover on a dry sample.
4. Place slide onto microscope plate and secure with lens holders on either side of theplate.
5. Turn on microscope. Use the knob on the right side of the plate to bring your sampleinto focus.

6. To capture your pictures on the computer, bring up the Motic Images Software andmake sure the microscope is plugged into the computer. Click on File, Capture, andthen save your picture in an appropriate folder.
Additional tips for preparing slides include learning to use the microtome (used to makevery thin slices of a material):
1. Remove the blades from the underneath portion of the base.
2. Choose a blade and remove the washer from the blade container as well.
3. Attach blade to left side of slicer with the blade first, then the washer, then the screwfound on the side.
4. Cut your potato until you have a long slender strip. It should be about two inches byone half inch by one half inch.
5. Load your potato strip into the moving portion of the slicer by turning the knob ontop until the opening is large enough hold the potato strip. Clamp down gently on thepotato, making sure the potato comes about one half inch out of the left side.
6. Reattach the moving component and make a large slice. Now you are ready to beginmaking very thin slices by turning the dial on the right side in very small incrementsuntil your slices are of desired thickness.
7. Always clean the slicer blade very soon after use.
4 Experiment 1: Volume Increase of Rice
This experiment will measure the volume increase of rice over a period of three hoursdue to water absorption and/or heat. We will have two graduated cylinders of rice; one ofthem will be heated during the experiment. It will require use of the following equipment:
• Large tank with heat capacity of at least 70◦C
• Heating utility that attaches to side of tank
• 2 large graduated cylinders
• Plenty of Uncle Ben’s Converted Parboiled Enriched Long Grain Rice
• Stopwatch.

4.1 Procedure
Begin by assembling and preparing the water bath:
1. Fasten the water heating utility to the side of the large tank.
2. Fill the tank with water until the water reaches 2 inches from the top.
3. Flip switch in back of heating utility to turn on the unit’s power source.
4. Press power button on the front of the unit to turn the unit on.
5. If necessary, use a flathead screwdriver to adjust the “safety set” temperature on thesmall dial in the lower left corner of the face of the unit.
6. Press P2 and P3 at the same time and wait until the “high temperature” value appearson the screen. Set this value just a few degrees higher than the capacity of the tankusing the dial to the right of the screen. Now press P2 and P3 at the same time, twice,to return the screen to the normal temperature view setting (This control turns theheater off should the water temperature rise higher than the tank is capable of holdingor if the water level drops below the heating coils.)
7. Press the dial to the right of the temperature viewer in once, and use the dial to adjustyour target temperature, which should be 70◦C, the maximum heat capacity of theacrylic tank. Cover the tank with aluminum foil. This will help the tank heat upfaster and retain its heat throughout your experiments and prevent evaporation.
8. Note: The tank may take up to an hour to heat to the desired temperature, so be sureto turn it on long before you need to use it.
Next, prepare the rice for “cooking”:
1. Begin filling both cylinders with rice until the height–which we will now use to referto volume–of the rice is 50mL.
2. Fill a large beaker with water to add to the rice for cooking. (Do not add the waterto the rice until the bath is heated so the rice does not begin absorbing water beforethe experiment begins.)
When the water bath is heated to 70◦C,
• Three things must happen all at the same time (or as close to it as possible):
1. Pour 250mL of room temperature water into the cylinder that will not be heatedduring the experiment and 250mL of water directly from the heated water bathinto the cylinder that will be heated.
2. Place the cylinder with hot water into the water bath, making sure it is nottouching the sides of the container or the heating utility.
3. Start the stopwatch.
• Record time and temperature of each cylinder at one-minute intervals for the first hourand ten-minute intervals for the next two hours.

0 20 40 60 80 100 120 140 160 18040
60
80
100
120
140
160
180
200
220
Time (minutes)
Vo
lum
e (
mL
)
Linear fit to data:y=.7205x+90.86
Actual heated rice growth data
0 20 40 60 80 100 120 140 160 18040
60
80
100
120
140
160
180
200
220
Time (minutes)
Vo
lum
e (
mL
)
Logistic fit to data:y=179.69/(1+1.64e−.0367x)
Actual heated rice growth data
Figure 3: At the left is a linear least squares fit to my data; on the right is the logistic fit.Clearly, the logistic fit is much more accurate!
4.2 Results
After measuring growth each minute for three hours, we used Matlab to graph our data,time versus height. We fit the data to a linear model and a logistic model to compare howwell each type of relationship resembled our graphs. Figure 3 shows graphs of the actualdata in comparison to the fitted lines. It is clear that the logistic model fits the results muchbetter. We can conclude that water uptake by rice over time is not a linear relationship andbetter conforms to a logistic curve.
4.3 The Mathematics
Our simple mathematical model of growth of rice over time is a differential equation thatcan easily be solved using the separation of variables method. This model assumes that therate of growth of a sample of rice grains by uptake of water is directly proportional to thepercentage of rice granules that have not yet absorbed water to capacity. It accounts for theinitial height of the rice, the final height of the rice, and a water absorption coefficient.
4.3.1 The Simple Model
dL
dt= −h(L − Lc), L(0) = 50, Lc = 190 (1)
In this model, the following things are relevant:
• dLdt
represents the change of volume (height) of rice over time.
• h represents the water absorption rate constant.

• L represents the height of rice at a given time.
• L(0) represents the height at time 0.
• Lc represents the maximum height that the rice will reach during the experiment.
4.3.2 Solving the Model
The model can be solved easily following these steps:
• Separate variables: all terms with L on the left and all terms with t on the right andintegrate.
ln(L − Lc) = −ht + C (2)
• Exponentiate both sides.L − Lc = Ce−ht (3)
• Solve for C.
C =L − Lc
e−ht(4)
• Use initial conditions from data to solve. The initial condition for this experiment is(0, 50). The height of the rice at time 0 is 50mL.
C =50 − 190
e0= −140 (5)
• Solve for L.L = −140e−ht + Lc (6)
This is the theoretical model for the results of the experiment.
4.3.3 Analyzing and Applying the Model
Now we must fit the model to our data by finding an h, water absorption coefficient that fitsour data.
• Our first step is to find dLdh
by differentiating the last equation.
dL
dh= 140te−ht (7)
• Now we look at finding the value of h, the water absorption coefficient. Assume thatthe error between the theoretical model, E, is the difference between the theoreticaldata and the actual data. We will minimize this error. In this evaluation, we will beusing the first three data points: (1,60), (2,62), (3,65).

• The equation we will begin with is:
E =
√√√√ N∑i=1
(Li(li) − Ltheory(li, h))2. (8)
• Squaring both sides, and minimizing E2 will yield the same value as minimizing E, wefind:
E2 =N∑
i=1
(Li(li) − Ltheory(li, h))2. (9)
• Now in order to minimize the error, E, we differentiate equation (9):
∂E
∂h= 0 = −
N∑i=1
2(Li(li) − Ltheory(li, h))dLtheory
dh(li, h). (10)
• Simplifying, we find:
0 = −2N∑
i=1
(Li(li) − Ltheory(li, h))dLtheory
dh(li, h). (11)
• Using N=3 and the first three data points listed above, plugging in values as follows:Li(li) is the actual data value for N=1, N=2, N=3, Ltheory(li, h) is equation (6), anddLtheory(li,h)
dhis the derivative found in the first item of this section.
• The resulting equation is as follows:
0 = −2[(60 − (−140e−h + 190))140e−h + (12)
(62 − (−140e−2h + 190))140(2)e−2h +
(65 − (−140e−3h − 190))140(3)e−3h].
• With much simplification of this equation, we find:
0 = −2(140)(−130e−h − 116e−2h − 375e−3h + 280e−4h + 420e−6h). (13)
• This equation can be solved for h using Maple, and we find that, with our currentdata, the water absorption coefficient, h, is approximately equal to .04278min−1.
In order to find h for N equal to the total number of data points, we used a Matlabprogram that graphed the time values against the log-volume values solved for the ht term,producing a linear relationship. The program also found a linear least squares fit for the newdata. To find h, we solved for the slope of the least squares line: h = .0198min−1 The codefor this Matlab program can be found in the appendix.
4.3.4 A More Advanced Model
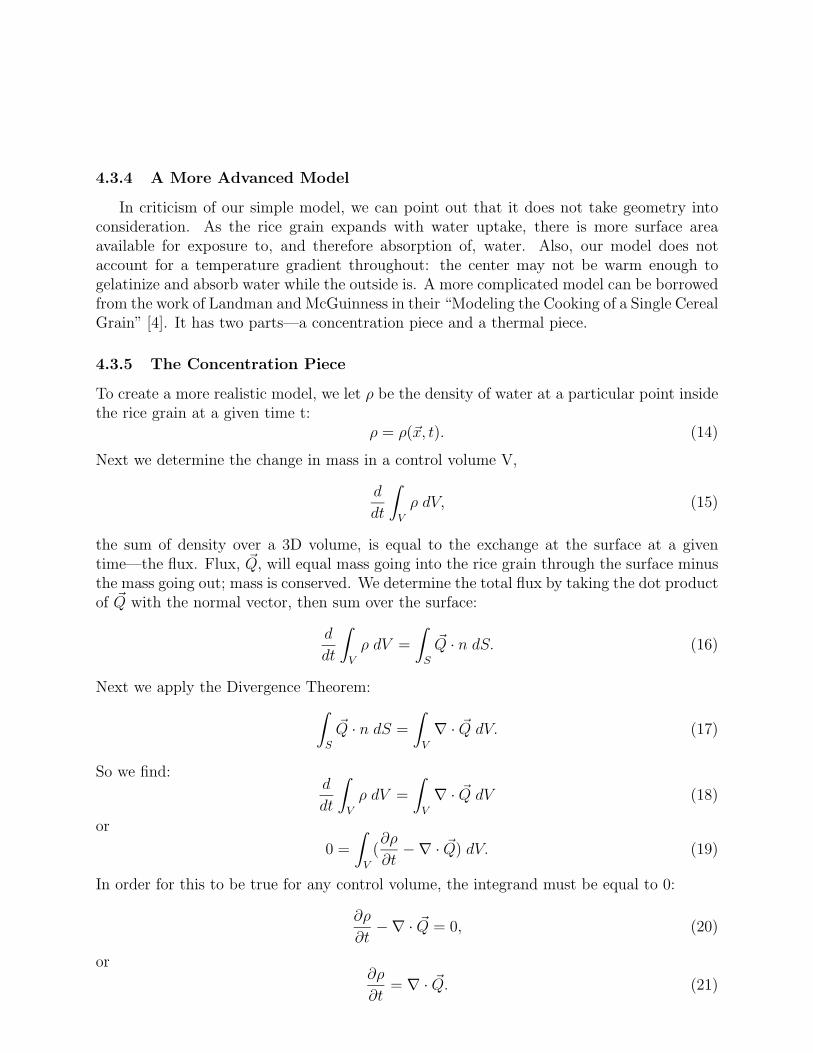
In criticism of our simple model, we can point out that it does not take geometry intoconsideration. As the rice grain expands with water uptake, there is more surface areaavailable for exposure to, and therefore absorption of, water. Also, our model does notaccount for a temperature gradient throughout: the center may not be warm enough togelatinize and absorb water while the outside is. A more complicated model can be borrowedfrom the work of Landman and McGuinness in their “Modeling the Cooking of a Single CerealGrain” [4]. It has two parts—a concentration piece and a thermal piece.
4.3.5 The Concentration Piece
To create a more realistic model, we let ρ be the density of water at a particular point insidethe rice grain at a given time t:
ρ = ρ(�x, t). (14)
Next we determine the change in mass in a control volume V,
d
dt
∫V
ρ dV, (15)
the sum of density over a 3D volume, is equal to the exchange at the surface at a giventime—the flux. Flux, �Q, will equal mass going into the rice grain through the surface minusthe mass going out; mass is conserved. We determine the total flux by taking the dot productof �Q with the normal vector, then sum over the surface:
d
dt
∫V
ρ dV =
∫S
�Q · n dS. (16)
Next we apply the Divergence Theorem:
∫S
�Q · n dS =
∫V
∇ · �Q dV. (17)
So we find:d
dt
∫V
ρ dV =
∫V
∇ · �Q dV (18)
or
0 =
∫V
(∂ρ
∂t−∇ · �Q) dV. (19)
In order for this to be true for any control volume, the integrand must be equal to 0:
∂ρ
∂t−∇ · �Q = 0, (20)
or∂ρ
∂t= ∇ · �Q. (21)

Now we use a constitutive law—which describes the behavior of a particular material—toeliminate �Q. Our constitutive law states that the flux is proportional to the gradient of thedensity of water inside a rice grain:
�Q = k∇ρ. (22)
Substituting, we find:∂ρ
∂t= ∇ · k∇ρ. (23)
4.3.6 The Thermal Piece
Similarly, we can derive an equation for the temperature by applying conservation of energyto a control volume:
∂T
∂t= ∇ · �Q. (24)
We find:∂T
∂t= α∇2T. (25)
Equation (25) is called the heat equation and α is called the thermal diffusivity.
4.3.7 Initial and Boundary Conditions
First, we will consider the concentration piece. At time zero, no water has been absorbedby the rice grain, so our initial condition is:
ρ(�x, 0) = 0. (26)
At the boundary of each individual rice grain, there is water covering the surface, so wewill say that:
ρ(�x, t) = ρ0, (27)
indicating that there is some amount of water, ρ0, at the surface of each grain, available forabsorption.
The thermal piece works the same way. At time zero, no heat has yet been absorbed bythe grain, so its initial temperature is room temperature:
T (�x, 0) = T0. (28)
At the boundary of each grain, the temperature is that of the water surrounding it:
T (�x, t) = TBATH. (29)
Both the concentration and thermal pieces described above, and their initial and bound-ary conditions, make up this more advanced model of water uptake by rice. Note, in general,the equations for density and temperature are coupled since k from equation (23) dependson temperature.
Note: This more difficult model can be adapted to model the heat transfer within apotato in later sections.

5 Experiment 2: Void Fraction
In this experiment we will be measuring the void space in a particular volume of rice–the empty space between grains–both cooked and uncooked, and how that changes as thevolume of rice changes. If the void fraction is different for rice that has been cooked than foruncooked rice, our model from the previous experiment will be affected. Our ultimate goalof the rice experiment is to determine how much water has been taken in by the rice. Todetermine this, it is important to know the void fraction: if it changes after being cooked,then the way we determine how much water has been taken up must also be changed. Wewill need all of the equipment we used for the last experiment and additionally:
• 1 100 or 200mL graduated cylinder
• A few extra containers suitable for cooking rice.
5.1 Procedure
Measure 50mL of dry rice and put it into a 200mL beaker. Fill a 100 or 200mL graduatedcylinder up to 100mL. Pour water into the dry rice until it reaches the top of the rice, nomore. From the water remaining in the cylinder, determine how much water was used to fillthe void space in the dry rice. Record “50mL dry” and the amount of water used. Repeatthis experiment with the following volumes of rice and record the results: 75mL, 100mL.
Measure 50mL of dry rice and put it into a container that is tall enough to sit in thewater bath and marked with, at the very least, approximate volumes. Pour 250mL of waterinto the container. Place rice in water bath and cook for about one hour. Remove rice frombath. Record the new final volume of the rice. Remove water from the container until theremaining water reaches just to the top of the rice and discard it. Remove the rice from thecontainer, trying to remove as little water as possible. Measure the remaining water. This isthe amount of water necessary to fill the void in the cooked rice. Record this data. Repeatthis experiment with the same volumes of rice used in the previous part of the experiment.
Void fraction can be determined by dividing the volume of water needed to fill the voidof a particular volume of rice by the total volume of the rice. In the case of the cooked rice,use the final volume after cooking in your calculation.
5.2 Results
The first time we performed this experiment, with Vitarroz enriched long grain rice,we found that the void fraction only decreased about ten percent due to cooking (heatingand allowing for water absorption). However, when we used Uncle Ben’s rice as suggestedabove (which is supposed to reach four times its size when cooked), we found that the voidfraction decreased sixty five percent. This massive drastic drop makes void fraction a seriousconsideration in a model for Experiment 1. Figure 4 shows how much larger an individualrice grain becomes when it is heated, rather than just soaked.

Figure 4: The size of the rice changes drastically, and so does the void fraction.
Figure 5: About half of the starch granules of a potato cooked 40 seconds in the microwavehave gelatinized.
6 Experiment 3: Cooking Potatoes
Looking at potatoes is another way to investigate the conditions under which starchgelatinizes. Potatoes are even more interesting than rice because you can see the gelatinizedstarch versus the crystallized starch visually, and the increase in percentage gelatinized overtime. In figure 5 it is easy to see which portions have gelatinized and which have not.
6.1 Part 1: How fast does the inside temperature reach the out-side temperature?
In this experiment, we will measure how quickly the potato reaches the temperature ofthe water bath, both on the surface and at its core. We will need the following materials:
• Water tank and heating utility
• One potato

Figure 6: Potato with thermocouples
• Two thermocouples and thermocouple reader
• Stopwatch
• Sharp poker.
This experiment will help us to design any future experiments that investigate cookingpotatoes in a water bath at various temperatures.
6.1.1 Procedure
Begin by measuring and recording the mass and surface area of the potato. Heat thewater bath to 70◦C, as described above. Again, it may take up to one hour. Use your pokingdevice to put a hole into the potato from the top down into the center, making sure not topoke past the center. Slide one thermocouple into the hole, all the way to the center. Pokea tiny hole just under the surface with the stick, and put the tip of the other thermocouplejust under the surface. Figure 6 shows a potato with thermocouples inserted. Make sureboth thermocouples are fairly secure, and be very careful throughout the experiment not todislodge them, as you will have to begin the experiment again if the potato must be removedfrom the bath to reinsert the thermocouples. Carefully place the potato into the preheatedbath and start the stopwatch. Record the temperature of the surface of the potato and theinside of the potato at minute intervals until both temperatures reach the temperature ofthe bath.
6.1.2 Results
Figure 7 displays my results for this experiment. As implied by the model, we have foundthat heat transfer from the outside to the inside of a potato to be best described as a logisticcurve.

0 10 20 30 40 50 6020
25
30
35
40
45
50
55
60
65
70
Time (minutes)
Te
mp
era
ture
(C
elc
ius)
Temperature at center
Temperature atSurface
Figure 7: Inside and outside of potato heat up at very different rates, though both can bedescribed as logistic curves.
6.1.3 The Mathematics
Our simple model of heat transfer inside a potato resembles our model for water uptakeby rice. This model assumes that the rate of change of temperature is directly proportionalto the surface area and to the size of the temperature difference between potato and bath.We begin with:
mcpdT
dt= −hAs(T − TB). (30)
In this equation, the following things are important to know:
• m is the mass of the potato.
• cp is the specific heat of a potato.
• dTdt
is the rate of change of temperature over time.
• h is the heat transfer coefficient.
• As is the surface area of the potato.
• (T − TB) is the difference between the temperature at the inside of the potato minusthe temperature of its surrounding water bath.
Solving this model as we did our model of rice uptake by water and using our initialcondition T (0) = 23.5 (inside temperature at time 0), we find:
T = −46.7e−hAst
mcp + TB. (31)
To analyze and apply the model,
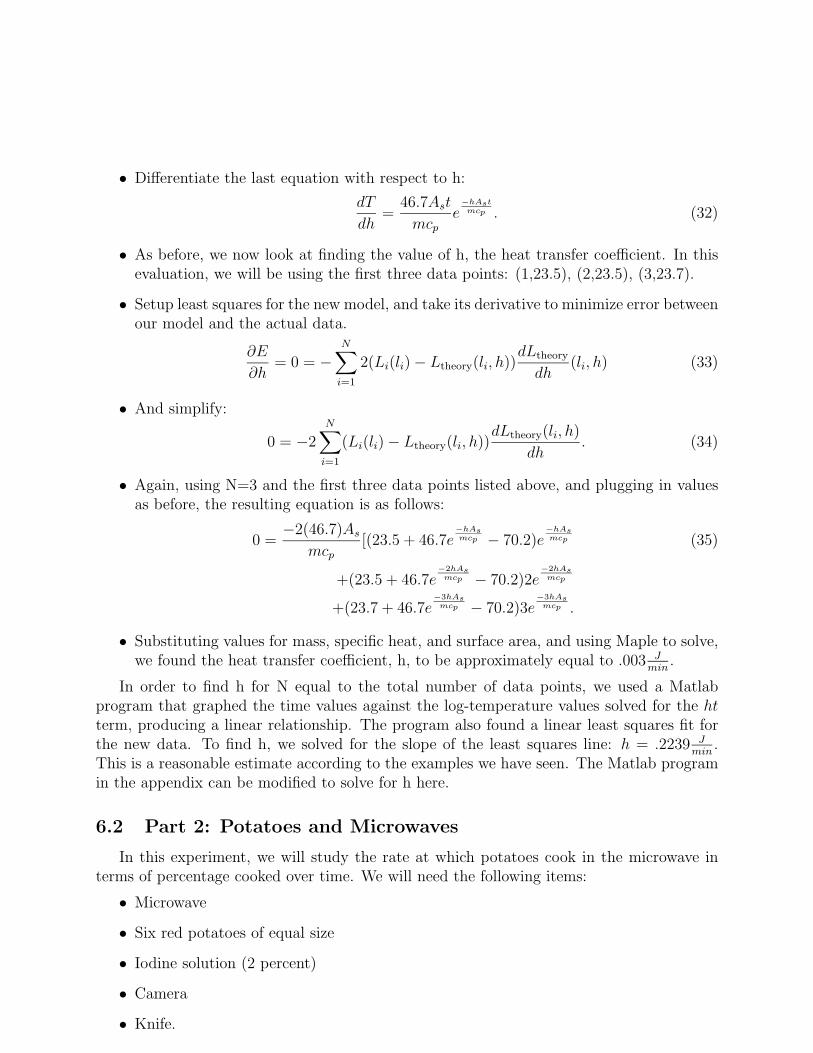
• Differentiate the last equation with respect to h:
dT
dh=
46.7Ast
mcp
e−hAst
mcp . (32)
• As before, we now look at finding the value of h, the heat transfer coefficient. In thisevaluation, we will be using the first three data points: (1,23.5), (2,23.5), (3,23.7).
• Setup least squares for the new model, and take its derivative to minimize error betweenour model and the actual data.
∂E
∂h= 0 = −
N∑i=1
2(Li(li) − Ltheory(li, h))dLtheory
dh(li, h) (33)
• And simplify:
0 = −2N∑
i=1
(Li(li) − Ltheory(li, h))dLtheory(li, h)
dh. (34)
• Again, using N=3 and the first three data points listed above, and plugging in valuesas before, the resulting equation is as follows:
0 =−2(46.7)As
mcp
[(23.5 + 46.7e−hAsmcp − 70.2)e
−hAsmcp (35)
+(23.5 + 46.7e−2hAs
mcp − 70.2)2e−2hAs
mcp
+(23.7 + 46.7e−3hAs
mcp − 70.2)3e−3hAs
mcp .
• Substituting values for mass, specific heat, and surface area, and using Maple to solve,we found the heat transfer coefficient, h, to be approximately equal to .003 J
min.
In order to find h for N equal to the total number of data points, we used a Matlabprogram that graphed the time values against the log-temperature values solved for the htterm, producing a linear relationship. The program also found a linear least squares fit forthe new data. To find h, we solved for the slope of the least squares line: h = .2239 J
min.
This is a reasonable estimate according to the examples we have seen. The Matlab programin the appendix can be modified to solve for h here.
6.2 Part 2: Potatoes and Microwaves
In this experiment, we will study the rate at which potatoes cook in the microwave interms of percentage cooked over time. We will need the following items:
• Microwave
• Six red potatoes of equal size
• Iodine solution (2 percent)
• Camera
• Knife.
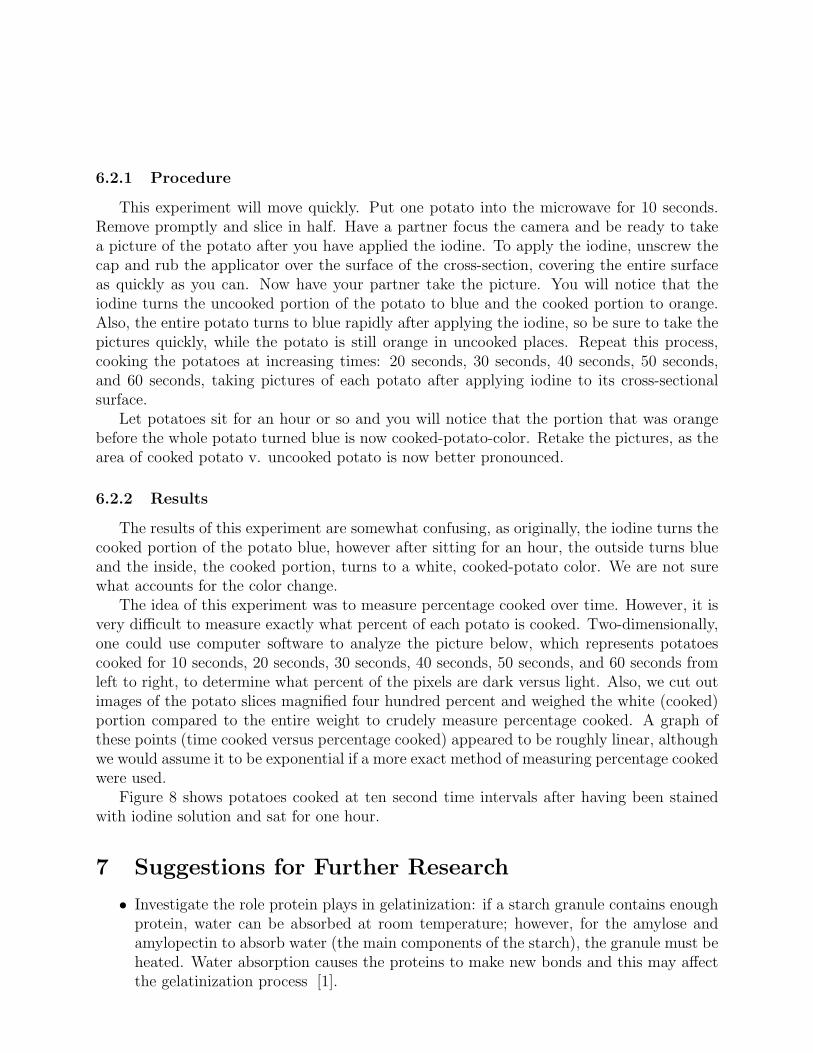
6.2.1 Procedure
This experiment will move quickly. Put one potato into the microwave for 10 seconds.Remove promptly and slice in half. Have a partner focus the camera and be ready to takea picture of the potato after you have applied the iodine. To apply the iodine, unscrew thecap and rub the applicator over the surface of the cross-section, covering the entire surfaceas quickly as you can. Now have your partner take the picture. You will notice that theiodine turns the uncooked portion of the potato to blue and the cooked portion to orange.Also, the entire potato turns to blue rapidly after applying the iodine, so be sure to take thepictures quickly, while the potato is still orange in uncooked places. Repeat this process,cooking the potatoes at increasing times: 20 seconds, 30 seconds, 40 seconds, 50 seconds,and 60 seconds, taking pictures of each potato after applying iodine to its cross-sectionalsurface.
Let potatoes sit for an hour or so and you will notice that the portion that was orangebefore the whole potato turned blue is now cooked-potato-color. Retake the pictures, as thearea of cooked potato v. uncooked potato is now better pronounced.
6.2.2 Results
The results of this experiment are somewhat confusing, as originally, the iodine turns thecooked portion of the potato blue, however after sitting for an hour, the outside turns blueand the inside, the cooked portion, turns to a white, cooked-potato color. We are not surewhat accounts for the color change.
The idea of this experiment was to measure percentage cooked over time. However, it isvery difficult to measure exactly what percent of each potato is cooked. Two-dimensionally,one could use computer software to analyze the picture below, which represents potatoescooked for 10 seconds, 20 seconds, 30 seconds, 40 seconds, 50 seconds, and 60 seconds fromleft to right, to determine what percent of the pixels are dark versus light. Also, we cut outimages of the potato slices magnified four hundred percent and weighed the white (cooked)portion compared to the entire weight to crudely measure percentage cooked. A graph ofthese points (time cooked versus percentage cooked) appeared to be roughly linear, althoughwe would assume it to be exponential if a more exact method of measuring percentage cookedwere used.
Figure 8 shows potatoes cooked at ten second time intervals after having been stainedwith iodine solution and sat for one hour.
7 Suggestions for Further Research
• Investigate the role protein plays in gelatinization: if a starch granule contains enoughprotein, water can be absorbed at room temperature; however, for the amylose andamylopectin to absorb water (the main components of the starch), the granule must beheated. Water absorption causes the proteins to make new bonds and this may affectthe gelatinization process [1].

Figure 8: The white portions are cooked while the dark portions are not.
• One suggestion from the food science department was to look at the way additives likesugar or salt affect the speed of water uptake.
• Do experiments on water uptake by rice and heat transfer inside a potato again andsee if the original h will fit the new data.
• Perform experiments on water uptake by rice at different temperatures to determinewhether or not the water absorption coefficient, h, changes with temperature.
• Additionally, try the water uptake by rice experiment with different types of rice andby cooking in different containers to determine whether h depends on the type of riceor the geometry of its container.
• Incorporate the effects of a change in void fraction on water uptake into the logisticmodel.
• Try a 2-D version of the void fraction experiment to better understand the way ricepacks.
• Try some experiments with single rice grains: cook one rice grain and track its mea-surements (size increase as in Figure 4) and determine if it follows the data for 50mLof rice grains. Try some rice microscopy.
• Try the heat transfer experiment with potatoes shaped into perfect cubes and spheres.
• Try using a starch indicator rather than iodine in the microwave experiment.
8 Appendix
Code for Matlab program to solve for h in water uptake by rice model:
clear;time=[0:1:60 70:10:170];
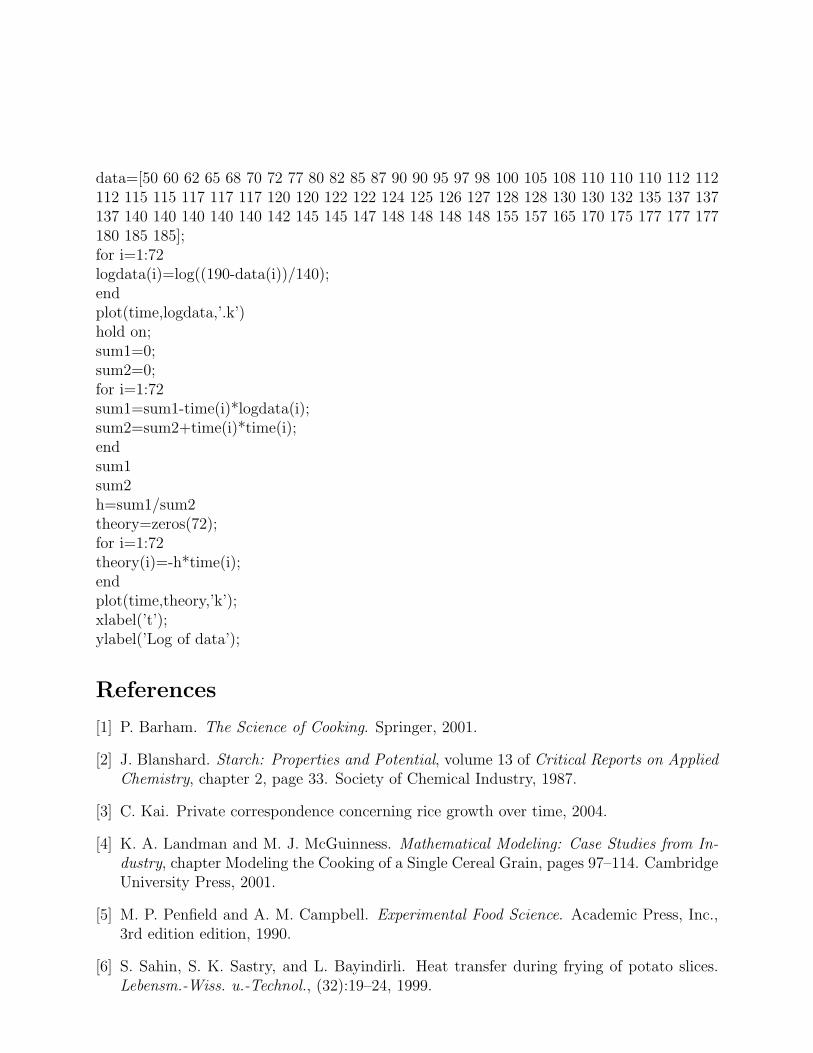
data=[50 60 62 65 68 70 72 77 80 82 85 87 90 90 95 97 98 100 105 108 110 110 110 112 112112 115 115 117 117 117 120 120 122 122 124 125 126 127 128 128 130 130 132 135 137 137137 140 140 140 140 140 142 145 145 147 148 148 148 148 155 157 165 170 175 177 177 177180 185 185];for i=1:72logdata(i)=log((190-data(i))/140);endplot(time,logdata,’.k’)hold on;sum1=0;sum2=0;for i=1:72sum1=sum1-time(i)*logdata(i);sum2=sum2+time(i)*time(i);endsum1sum2h=sum1/sum2theory=zeros(72);for i=1:72theory(i)=-h*time(i);endplot(time,theory,’k’);xlabel(’t’);ylabel(’Log of data’);
References
[1] P. Barham. The Science of Cooking. Springer, 2001.
[2] J. Blanshard. Starch: Properties and Potential, volume 13 of Critical Reports on AppliedChemistry, chapter 2, page 33. Society of Chemical Industry, 1987.
[3] C. Kai. Private correspondence concerning rice growth over time, 2004.
[4] K. A. Landman and M. J. McGuinness. Mathematical Modeling: Case Studies from In-dustry, chapter Modeling the Cooking of a Single Cereal Grain, pages 97–114. CambridgeUniversity Press, 2001.
[5] M. P. Penfield and A. M. Campbell. Experimental Food Science. Academic Press, Inc.,3rd edition edition, 1990.
[6] S. Sahin, S. K. Sastry, and L. Bayindirli. Heat transfer during frying of potato slices.Lebensm.-Wiss. u.-Technol., (32):19–24, 1999.