gearing for stability and growth - listed...
TRANSCRIPT

1
Sta
mfo
rd T
yres
Co
rpo
rati
on
Lim
ited
Gearing for Stability and Growth
ANNUAL REPORT 2017
S T A M F O R D T Y R E S C O R P O R A T I O N L I M I T E D
Gearing for Stability and Growth

17 CORPORATE GOVERNANCE REPORT
34 DIRECTORS' STATEMENT
37 INDEPENDENT AUDITOR’S REPORT
42 CONSOLIDATED INCOME STATEMENT
43 CONSOLIDATED STATEMENT OF COMPREHENSIVE INCOME
44 BALANCE SHEETS
45 STATEMENTS OF CHANGES IN EQUITY
01 CORPORATE INFORMATION
02 LETTER TO SHAREHOLDERS
04 BOARD OF DIRECTORS
07 MANAGEMENT TEAM
08 SENIOR PERSONNEL
09 OUR PRODUCTS
10 OUR PRESENCE
12 FINANCIAL AND OPERATIONS REVIEW
16 FINANCIAL HIGHLIGHTS
47 CONSOLIDATED STATEMENT OF CASH FLOW
48 NOTES TO THE FINANCIAL STATEMENTS
118 LIST OF MAJOR PROPERTIES
119 LIST OF SUBSTANTIAL SHAREHOLDERS
120 STATISTICS OF SHAREHOLDINGS
121 NOTICE OF AGM
127 PROXY FORM
STAMFORD TYRES CORPORATION LIMITED | ANNUAL REPORT 2017
CONTENTS

1
Sta
mfo
rd T
yres
Co
rpo
rati
on
Lim
ited
Gearing for Stability and Growth
stablished in the 1930s
with over 80 years of
existence, Stamford Tyres
has grown from a small tyre
shop to a global distributor
of tyres and wheels spanning over
90 countries and with our own wheel
factory. In the course of our progress,
the company weathered and overcame
cyclical business fluctuations, the Asian
Financial Crisis of the 90’s and the
Global Financial Crisis of the millennium.
Our expertise lies in our international
distribution competence, which
we have expanded throughout the
world. We also have regional retail
operations as well as truck and off-the-
BOARD OF DIRECTORS
President
Wee Kok Wah
Executive Director
Mrs Dawn Wee Wai Ying
Non-Executive &
Independent Chairman
Sam Chong Keen
Non-Executive Director
Dr Wee Li Ann
Independent Directors
Tay Puan Siong
Goh Chee Wee
Leslie Mah Kim Loong
Kazumichi Mandai
CORPORATE INFORMATION
road tyre management services. We
have further expanded our capabilities
in the manufacturing of alloy wheels
and proprietary tyre brands contract
manufacturing.
The Group’s international distribution
network currently spans across 10
countries in Asia Pacific, Africa and
Australia. Our main business activities are
in the distribution of major international
tyre brands – Falken, Dunlop,
Continental, and Maxam. We have also
strengthened our product development
capabilities and introduced innovative
proprietary brands, Sumo Firenza tyres,
Sumo Tire and SSW wheels, which are
sold globally.
AUDIT COMMITTEE
Chairman – Tay Puan Siong
Members
Sam Chong Keen
Leslie Mah Kim Loong
Dr Wee Li Ann
REMUNERATION COMMITTEE
Chairman – Sam Chong Keen
Members
Goh Chee Wee
Dr Wee Li Ann
NOMINATING COMMITTEE
Chairman – Sam Chong Keen
Members
Tay Puan Siong
Wee Kok Wah
COMPANY SECRETARIES
Lo Swee Oi, Michelle Fiona Heng
REGISTERED OFFICE
19 Lok Yang Way
Singapore 628635
Telephone: (65) 6268 3111
Facsimile: (65) 6264 4708 /
(65) 6264 0148
Email: [email protected]
Website: www.stamfordtyres.com
SHARE REGISTRAR
Boardroom Corporate &
Advisory Services Pte Ltd
50 Raffles Place #32-01
Singapore Land Tower
Singapore 048623
AUDITOR
Ernst & Young LLP
One Raffles Quay
North Tower, Level 18
Singapore 048583
Audit Partner: Vincent Toong
(since the financial year ended
30 April 2015)
PRINCIPAL BANKERS
United Overseas Bank Limited
Malayan Banking Berhad
TMB Bank Public Company
Limited
Ambank Berhad
Bangkok Bank Public
Company Limited
The Hong Kong and Shanghai
Banking Corporation Limited
We operate the most extensive retail
network in Singapore and Malaysia.
Through our Mega Mart and Tyre Mart
outlets, we offer a comprehensive
range of products that include tyres,
wheels, batteries, car audio and auto
accessories. We also offer workshop
and tyre services.
Stamford Tyres was listed on the Second
Board of Singapore Stock Exchange
(then known as SGX-Sesdaq) in 1991,
and was upgraded to the Main Board
of the Singapore Exchange Securities
Trading Limited (SGX-ST) in April
2003. Today, Stamford Tyres is one
of the largest independent tyres and
wheels distributor in Southeast Asia.
E

Dear Shareholders,
am pleased to present the
results for FY2017. Our
improved performance is
due to three main factors.
Firstly, our primary market - Southeast
Asia - showed enhanced profitability
despite the challenges faced.
Southeast Asia, which accounted for
85.8% of Group revenue, once again
delivered commendable performance.
It produced pre-tax profit of $7.8
million on revenue of $202.3 million.
The pre-tax profit was 43.7% higher
year-on-year on a 0.8% dip in revenue.
Secondly, after several years of
persistent and focused efforts, our
ventures into the newer and emerging
markets (India and South Africa)
achieved operational breakeven levels.
Our Australian operations narrowed
its losses significantly on the back of
a higher top line from more product
offerings via its local distribution
network.
Thirdly, our ongoing forex risk
management coupled with lower
market volatility has resulted in the
Group reporting net forex costs of
approximately S$68,000, the lowest
in the past five years.
Taken together, those key factors
enabled the Group to report a net
profit of $8.1 million, up 213.6% year-
on-year. Our total revenue was $238.7
million, down 1.5%.
Net profits of $1.7 million and $2.6
million was recorded in FY2015 and
FY2016, respectively.
HEALTHY MARGINS
There were challenges, including a
stronger US dollar vis-à-vis currencies
in markets we operated in. There was
also competition from new players and
an oversupply of tyres globally.
The Group’s gross profit margin
increased to 26.2% in FY2017,
compared to 22.1% and 24.7% in
FY2015 and FY2016, respectively.
This is reflective of one of our core
business approaches – which we have
highlighted at past Annual General
Meetings - of defending our gross
margin and focusing on improving
the contribution from value-added
activities from the Group’s Stamford
Tyres retail chain and truck centres
as well as the offering of total tyre
management services to commercial
fleet and mining operators in Southeast
Asia.
To sustain healthy net margins, we
continue to find ways to reduce and
contain operating costs. Our FY2017
total operating expenses (including
marketing and distribution costs) were
lowered by $1.9 million, or 3.2%, to
$56.4 million.
Notably, we have pared down our net
borrowings by $11.7 million, resulting
in lower finance costs. In conjunction
with that, our inventory as at end-
FY2017 was lowered to $77.9 million
from $85.0 million a year earlier. This
is in line with the Group’s approach of
rationalising its current assets.
VALUE ADDING
We worked continuously to add
value to our clients beyond just
selling tyres. Our extensive Stamford
Tyres retail chain network provides a
comprehensive range of workshop
services as well as the retailing of car
accessories, lubricants and batteries
to both end users and corporate
customers.
Our truck centres cater to the total tyre
management needs of commercial
LETTER TO SHAREHOLDERS
fleet operators. In addition to the
above, we are continuously improving
our offerings of specialty and mining
tyres, logistical and warehouse
support to our mining customers.
Please refer to the Financial and
Operations Review section of this
annual report for more information on
our business performance.
OUTLOOK
Various competitive pressures in our
industry can be challenging to us
but we continue to find ways to stay
resilient. Competition remains strong
from distributors of other tyre brands,
a challenge that has become keener
with an increased supply of tyres
within Southeast Asia. Inflationary
pressure exists in all our markets and
we will do our part to reduce and
contain operating costs.
We will continue to maintain adequate
forex hedging ratios and higher local
currency trade lines in managing the
impact of forex swings.
DIVIDEND
The Board of Directors has proposed a
dividend of 1.5 cents a share, up from
1.0 cent in each of the past two years,
subject to shareholders’ approval at
the Annual General Meeting.
APPRECIATION
I am grateful to customers, suppliers,
bankers and business associates for
their support and confidence in us.
Our staff certainly deserve a pat on
their back, especially the management
team headed by Mr Cham Soon Kian,
our Executive Vice President and a
26-year veteran of Stamford Tyres. I
would also like to thank the Board of
Directors for their counsel.
We look forward to telling you more
about our business, and answering
your questions, at the Annual General
Meeting at our office in Lok Yang Way.
WEE KOK WAH
President
Sta
mfo
rd T
yres
Co
rpo
rati
on
Lim
ited
I
2

Gearing for Stability and GrowthMoving Forward 3
Stamford Tyresretail chain network
ffffffor or oror ro StaStaStaStaStatataSStaStaSStatabbbbbbbb hhhhhhhhGeaGeaGeaGeaGeaGeaGeaGeaGeaaeaaearinrinrinrininrinrinrinrinr g g g MMMMMMMMM ingininginginggg FFFFFF dddddbbbiiliilililililililbibibibii itititytytytytytyyy anananannannand Gd Gd GGGGGd Gd GGGGGrowrowrowrowrowowowowwowowowwowththththtthtththtthbbbiiliililililiibibibbii itititytytytytytyyy anananannana d Gd Gd GGGGGGd GGGGrowrowrowrrowowowowowowowwo thththhtthtththth 33333333
provides a comprehensive range of workshop services as well as the retailing of car accessories, lubricants and batteries to both end users and corporate customers."
Sta
mfo
rd T
yres
Co
rpo
rati
on
Lim
ited
"We worked continuously to add value to our clients beyond just selling tyres. Our extensive

Sta
mfo
rd T
yres
Co
rpo
rati
on
Lim
ited
BOARD OF DIRECTORS
Mr Wee has propelled Stamford Tyres forward as its CEO since the 1970s after
taking over the helm from his father, who had founded the first Stamford Tyre entity
in the 1930s as a petrol pump service station and tyre retail shop. Using his stellar
business acumen and relentless passion, Mr Wee went on to steer Stamford
Tyres to a public listing in 1991, and steadily expanded its business into what it
is today – an international operation in the distribution and retailing of tyres and
wheels, and manufacturing of wheels. His passion for, and in-depth knowledge of,
the tyre business inspire his team to achieve – and have gained him international
recognition in the industry. Highly regarded in the tyre industry and the business
world, he was selected as a finalist for the Ernst & Young Entrepreneur of the Year
award (under the category of Services and Business products) in 2004, one of the
most prestigious awards for entrepreneurs.
Mr Wee holds a Bachelor of Social Science in Economics and Law from the then
University of Singapore (now known as National University of Singapore).
WEE KOK WAH President
oord
t it
and
of,
nal
ess
ear
the
hen
Following his invaluable contributions while on the Board when Comfort Group
Limited was a substantial shareholder, Mr Sam was appointed as an Independent
Director of Stamford Tyres Corporation Limited in 1994. On 23 August 2012, Mr
Sam was appointed as Non-executive Chairman of Stamford Tyres Corporation
Limited. Mr Sam is also Chairman of the Remuneration Committee and Nominating
Committee and sits on the Board's Audit Committee. He has a wealth of
management experience, having worked at senior positions in the Singapore
Government Administrative Service, National Trade Union Congress (NTUC)
and lntraco Limited as well as CEO positions at Comfort Group Limited, VICOM
Limited, Lion Asiapac Limited, Lion Teck Chiang Limited, A-Smart Holdings Ltd
(formerly known as Xpress Holdings Limited) and Jade Technologies Holdings
Limited. He was also the Political Secretary to the Minister for Education from 1988
to 1991. He served on various government boards and committees, including the
Central Provident Fund Board and the National Co operative Federation. Mr Sam
is also the Non-Executive Chairman of Lion Asiapac Limited and sits on the Board
of A-Smart Holdings Ltd as an Independent Director. Mr Sam holds a Bachelor of
Arts (Honours) from the University of Oxford.
SAM CHONG KEEN Non-Executive & Independent Chairman
Com
man
Gov
and
Limit
(form
Limit
to 19
Cen
is als
of A
Arts
SA
4
Gearing for Stability and Growth
Sta
mfo
rd T
yres
Co
rpo
rati
on
Lim
ited
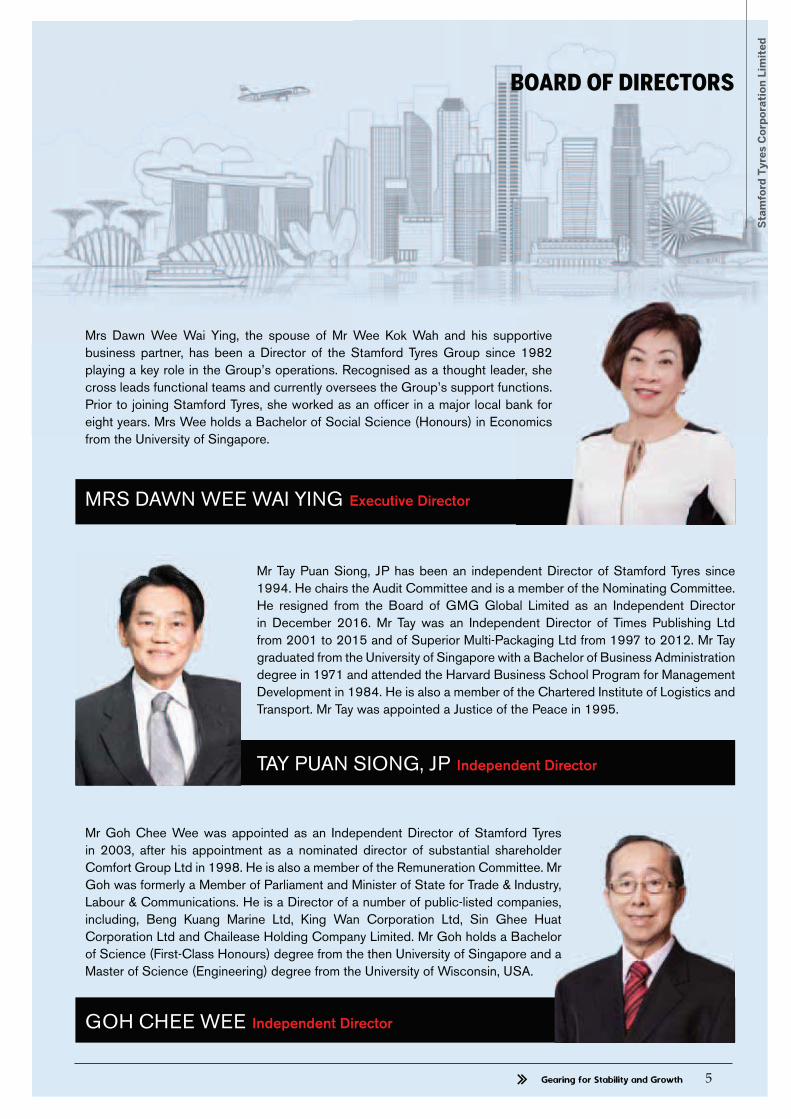
Mrs Dawn Wee Wai Ying, the spouse of Mr Wee Kok Wah and his supportive
business partner, has been a Director of the Stamford Tyres Group since 1982
playing a key role in the Group’s operations. Recognised as a thought leader, she
cross leads functional teams and currently oversees the Group’s support functions.
Prior to joining Stamford Tyres, she worked as an officer in a major local bank for
eight years. Mrs Wee holds a Bachelor of Social Science (Honours) in Economics
from the University of Singapore.
MRS DAWN WEE WAI YING Executive Director
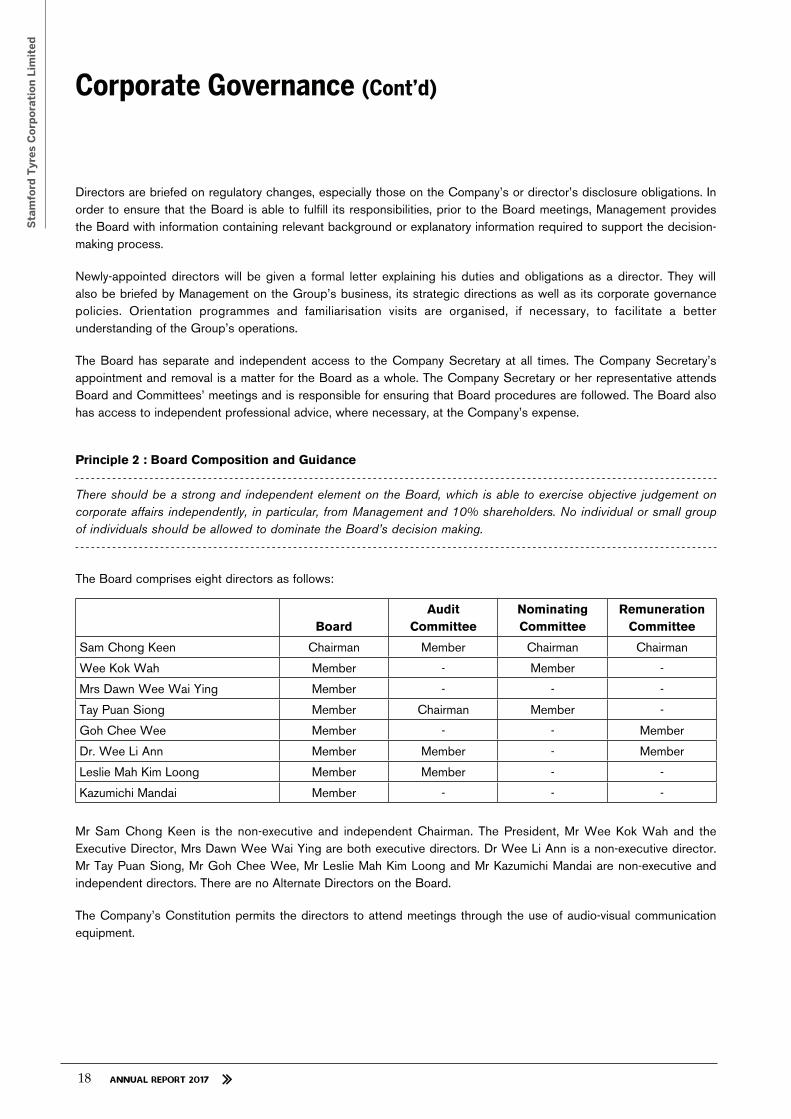
Mr Tay Puan Siong, JP has been an independent Director of Stamford Tyres since
1994. He chairs the Audit Committee and is a member of the Nominating Committee.
He resigned from the Board of GMG Global Limited as an Independent Director
in December 2016. Mr Tay was an Independent Director of Times Publishing Ltd
from 2001 to 2015 and of Superior Multi-Packaging Ltd from 1997 to 2012. Mr Tay
graduated from the University of Singapore with a Bachelor of Business Administration
degree in 1971 and attended the Harvard Business School Program for Management
Development in 1984. He is also a member of the Chartered Institute of Logistics and
Transport. Mr Tay was appointed a Justice of the Peace in 1995.
TAY PUAN SIONG, JP Independent Director
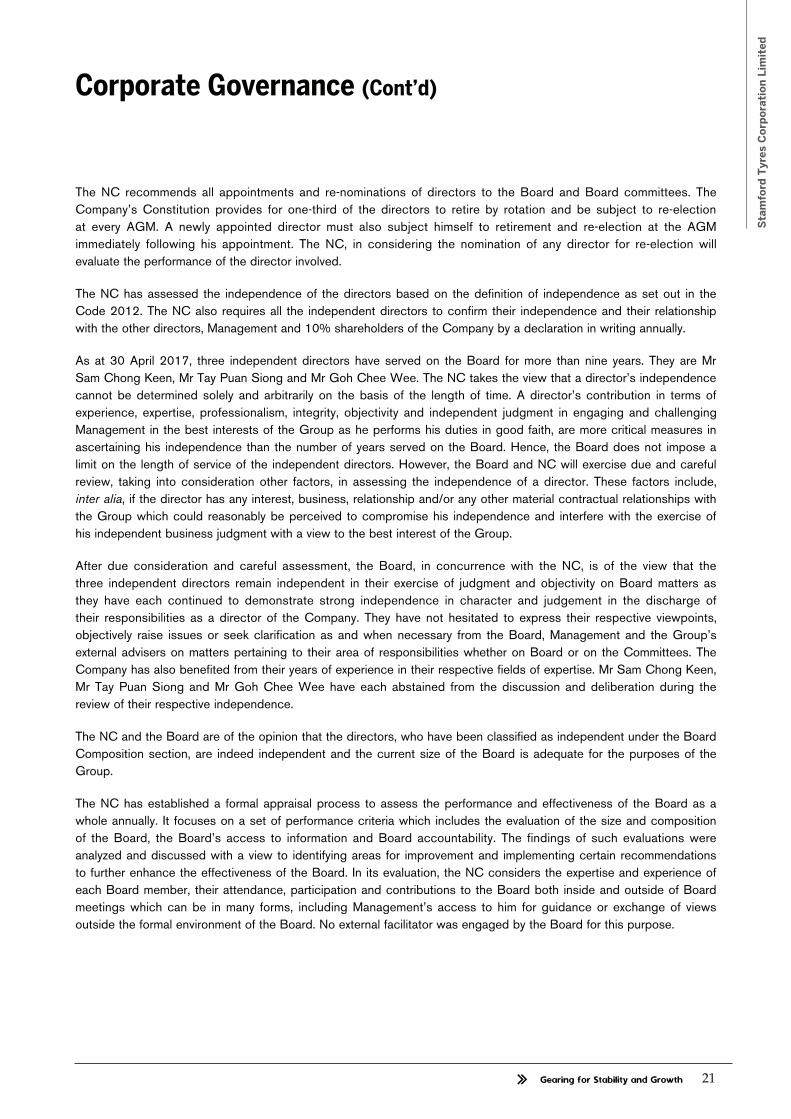
Mr Goh Chee Wee was appointed as an Independent Director of Stamford Tyres
in 2003, after his appointment as a nominated director of substantial shareholder
Comfort Group Ltd in 1998. He is also a member of the Remuneration Committee. Mr
Goh was formerly a Member of Parliament and Minister of State for Trade & Industry,
Labour & Communications. He is a Director of a number of public-listed companies,
including, Beng Kuang Marine Ltd, King Wan Corporation Ltd, Sin Ghee Huat
Corporation Ltd and Chailease Holding Company Limited. Mr Goh holds a Bachelor
of Science (First-Class Honours) degree from the then University of Singapore and a
Master of Science (Engineering) degree from the University of Wisconsin, USA.
GOH CHEE WEE Independent Director
BOARD OF DIRECTORS
5Gearing for Stability and Growth

Sta
mfo
rd T
yres
Co
rpo
rati
on
Lim
ited
Statata
mfo
mfofo
mf
rd T
yres
Co
rpo
ratiat
on
Lim
ited
BOARD OF DIRECTORS
Dr Wee Li Ann, the eldest of Mr and Mrs Wee Kok Wah’s three children, was
appointed Director of Stamford Tyres Corporation Limited in December 2009
and she sits on the Board’s Audit and Remuneration Committees. She worked for
Parkway Group Healthcare from 2003-2007 as a Family Physician and previously
worked as a Broadcast Correspondent for Singapore Press Holdings from 2000-
2003. She worked in healthcare management at Parkway Pantai Group from
2012-2015. She is a family physician in private practice. She is an active Director
of Wah Holdings Pte Ltd, a substantial shareholder of the Company, where she
manages the portfolio. Dr Wee graduated from Harvard’s Kennedy School of
Government with a Master of Public Administration. She holds a medical degree
from Cambridge University and Bachelor of Arts from Johns Hopkins University.
DR WEE LI ANN Non-Executive Director
Mr Kazumichi Mandai was appointed as an Independent Director of Stamford
Tyres Corporation Limited on 1 December 2012. Mr Mandai started his career with
Sumitomo Rubber Industries Ltd (SRI) in 1974 after graduating from Kobe City
University of Foreign Studies. In 2002, he was appointed as Managing Director of
Sumitomo Rubber Asia (Tyre) Private Limited, Singapore, a position he held till 2007.
From 2007 to 2008, Mr Mandai served as Sales Director of SRI Tire Trading Co.,
Tokyo. During that year, Mr Mandai completed a MBA course under SRI’s Internal
Curriculum run by Globis Management Institute, Tokyo. In 2009, Mr Mandai was
appointed as President of Sumitomo Rubber Latin America LTDA, Chile. Mr Mandai
held this position until he reached his maximum age for retirement from Sumitomo
Rubber Industries Ltd in 2011.
KAZUMICHI MANDAI Independent Director
ith
City
of
07.
o.,
nal
as
dai
mo
Mr. Leslie Mah was appointed as an Independent Director of Stamford Tyres Corporation
Limited on 1 December 2012 and sits on the Board's Audit Committee. Mr. Mah served
as the Executive Director of Eu Yan Sang International Ltd prior to his retirement in
2009. He was Company Secretary and Executive Director of Cerebos Pacific Ltd. from
1986 to 2001. Prior to Cerebos, he served as Finance Director of Harpers Gilfillan
for 10 years. Mr Mah was an Independent Director of Falcon Energy Group Limited
and Goodpack Ltd. He is currently a Non-Executive Independent Director of Hotel
Properties Ltd. and Lam Soon (M) Bhd. He is a Lifetime Member of the Institute of
Singapore Chartered Accountants.
LESLIE MAH KIM LOONG Independent Director
6

7
Sta
mfo
rd T
yres
Co
rpo
rati
on
Lim
ited
Gearing for Stability and Growth
Soon Kian joined Stamford Tyres in 1991 as
a management trainee. The following year,
he was assigned to Malaysia to head the
Malaysian operations. Under his leadership,
the Malaysian operations grew to become an
integrated set-up with value-added services
including retail, fleet tyre management and
retread facilities. Soon Kian was promoted
to Senior Vice President in 2006 and rose to
the position of Executive Vice President in 2014. Soon Kian is an
ASEAN scholar and graduated with a Bachelor of Accountancy
degree from the National University of Singapore. He is also an
active member of the Selangor and Federal Territory Tyre Dealers
and Retreaders Association.
CHAM SOON KIAN Executive Vice President, CEO of Malaysia
Conson began his career with Stamford Tyres
in 1993, heading the Group’s operation in
the Philippines. He was the Group Chief
Financial Officer from 2001 to 2013. Conson,
being equipped with operations and financial
experiences, is now overseeing the expansion
and development of the Group’s South Africa
operations. He holds a Bachelor of Science in
Commerce from the University of Santo Tomas,
Philippines and is a Certified Public Accountant.
CONSON TIU SIA Senior Vice President, Head of South Africa Operations
Frank joined the Stamford Tyres Group as
Finance Manager in September 2008. In
2013, He was elevated to the position of
Group Financial Controller. He is currently
responsible for the Group’s financial operations
which include compliance with accounting
and regulatory standards, and corporate
governance. He plays a critical role in ensuring
the smooth operation of the Group’s risk and
management framework which covers finance, operations, statutory
compliance and information technology. Frank holds a Bachelor of
Business, Double Major in Accounting and Information Technology
(University of Technology, Sydney, Australia) and is also a Certified
Public Accountant since 2005.
FRANK NG TSE LIM
Group Financial Controller
Colin joined Stamford Tyres in 2002 and was
appointed as General Manager of Stamford
Tires Distributor Co. Ltd in 2005. He was
promoted to Senior Vice President in April
2014, overseeing all the divisions of Stamford
Tires Distributor Co. Ltd and Stamford Sport
Wheels Co. Ltd, which are our subsidiaries
in Thailand. Colin graduated from the
International Islamic University with a Bachelor
of Accounting (BACC) in 1994. The following year, he was awarded
Association of Chartered Certified Accounts (ACCA). With his
vast experience as an accountant, he was made a Member of The
Malaysian Institute of Accountants (MIA). In 1998, Colin obtained
The Malaysian Institute of Certified Public Accountants (MICPA).
COLIN CHOO NEE ANN Senior Vice President, Head of Thailand Operations
Clare joined Stamford Tyres in 1994. She
was appointed Senior Vice President in 2006
and is in charge of the Group’s supply chain
management system and operations in Hong
Kong, Vietnam and China. With more than 20
years of experience in purchasing, Clare is also
responsible for the Group’s collaboration with
major suppliers and contract manufacturers.
Clare holds a Bachelor of Business Degree
in Transport from the Royal Melbourne Institute of Technology,
Australia.
CLARE LAW LAY KIAN Senior Vice President, Head of Singapore Operations and Supply Chain
MANAGEMENT
Pat is a veteran in the Australia tyre industry and joined the Group as Senior
Vice President of Sales and Marketing in 2005. In May 2016, He relinquished
his position as Senior Vice-President. He currently serves as Management
Consultant to the Group, mainly overseeing and supervising its operations in
Australia, as well as any other Group-related projects assigned by the President.
Before joining Stamford Tyres, Pat was the General Manager (Supply Chain) of
South Pacific Tyres. He has extensive experience in all aspects of the global tyre
and automotive industry.
PATRICK JAMES BERRIMANManagement Consultant
TEAM
MANAGEMENT CONSULTANTenio
she
men
ns i
den
in) o
al tyr
Tor
ed
nt
in
nt.
of
re

8
Sta
mfo
rd T
yres
Co
rpo
rati
on
Lim
ited
SENIOR PERSONNEL
01. IVAN REIJAN RAJOOHead of Fleet
Stamford Tyres International Pte Ltd
Singapore
02. WONG SIEW PENGHead of Wholesale
Stamford Tyres International Pte Ltd
Stamford Tyres (B) Sdn Bhd
Singapore and Brunei
03. LARRY LEE HSIN MIAOHead of International Distribution
Stamford Tyres International Pte Ltd
Singapore
04. KASEM BURETJITTINUNGeneral Manager
Stamford Tires Distributor Co Ltd
Thailand
05. NG WEE LIONGGeneral Manager
Tyre Pacific (Vietnam) Co Ltd
Vietnam
06. JUNE ER CHUI HOONOSB Manager
Stamford Tyres Corporation Ltd
Singapore
07. TAN SER KOONGeneral Manager
Stamford Tyres (Vietnam) Co Ltd
Vietnam
08. ANDRE SMUTSNational Sales Manager
Stamford Tyres Africa Pty Ltd
South Africa
09. ERWIN CHUA General Manager
PT Stamford Tyres Distributor Indonesia
Indonesia
10. ARIF PUTRANTOBranch Manager
PT Stamford Tyres Indonesia
Timika, Indonesia
11. GLADYS BARRIOSDeputy General Manager
Stamford Sport Wheels Co Ltd
Thailand
12. CHNG LEE LEEHead of Finance and Operations
Stamford Tyres (M) Sdn Bhd
Malaysia
13. JASON DAVEYSenior Sales Manager
Stamford Tyres Australia Pty Ltd
Australia
09
01 04
10
0603
12
02
BRIAN U’RENVice President, President’s Office
Stamford Tyres Corporation Ltd
Singapore
Brian joined Stamford Tyres in 1993 as a management trainee and rose to the rank of Assistant Vice
President before he left in 2006. He re-joined in 2009 as the General Manager of Stamford Tyres Australia.
He was appointed as Vice President in 2014 and is currently overseeing the Group’s operations in Indonesia
and joint venture in India with Sumitomo Rubber Industries. Brian graduated from National University of
Singapore with a Bachelor of Arts majoring in Economics and Political Science.
08 13 11
05 07

Gearing for Stability and Growth
OUR PRODUCTS
Sta
mfo
rd T
yres
Co
rpo
rati
on
Lim
ited
Stamford Sport Wheels, or SSW, is our proprietary brand of alloy
wheels. Our wheels are designed, manufactured and tested in-house.
Our designers have created a line of wheels that offer exciting style,
looks and road performance. SSW has models with diameters of 13” to
26” tailored for passenger cars and SUVs. Our wheels are produced in
Thailand using the latest low pressure and tilt gravity casting methods
and in accordance with internationally recognized quality and safety
standards.
Sumo Firenza is our proprietary premium budget range of performance
tyres, SUVs, light truck and truck/bus radials. The Sumo Firenza range
consists of more than 100 models and the tyres are produced in China
and Thailand in factories that have been selected for their consistent
quality standards.
Stamford Tyres has a team of engineers and tyre designers in China who
provide technical support and quality assurance for our tyres which are
popular in Europe, Middle East, Africa, Latin America, Australia, South
Africa and Asia.
Sumo Tire is our line of nylon bias tyres for light truck, truck, agriculture
and earthmover applications. The tyres are designed in-house and in
accordance with internationally recognised standards.
Sumo Tire is made in Asia and we offer a wide range of sizes and
specifications to customers that need tyres for demanding round-the-
clock operations at affordable prices.
The tyres are designed for heavy duty industrial application and are well-
received internationally.
Falken is manufactured by Sumitomo Rubber Industries, a leading Japanese
designer and manufacturer of tyres. The Falken range has tyres for high
performance cars, passenger cars, SUVs, light truck and truck radials. Falken
continually introduces new and exciting products and as part of its R&D
programme, Sumitomo supports many race and rally teams round the world,
outfitting their competition machines with Falken Tyres.
Stamford Tyres distributes Falken in Singapore, Malaysia, Thailand,
Indonesia, Brunei, Vietnam, Cambodia, Myanmar, South Africa, Hong Kong,
India, Bangladesh, Pakistan, Mauritius, Reunion, East Timor, Nepal, Southern
Africa and New Caledonia.
Continental is a range of top-quality tyres designed and manufactured by
the company of the same name headquartered in Hanover, Germany. The
Continental range covers radials designed for sports and passenger cars,
light truck, truck and bus radials as well as military, agriculture and industrial
solid tyres. Continental supplies original equipment (OE) tyres for world-
leading cars such as Porsche, BMW, Mercedes Benz and Volkswagen. Their
tyres also come installed as OE on commercial vehicles such as DAF, Volvo,
MAN and Scania.
Stamford Tyres distributes Continental in Singapore.
Dunlop has been at the forefront of tyre innovations, with over 120 years of
tyre industry experience. Today, Dunlop has grown to become one of the
world's biggest and most trusted brands. Committed to delivering superior
tyres, Dunlop constantly pushes for development of new compounds and
technologies through the rigours of two and four-wheeled motorsports. The
product range that Dunlop offers include passenger car, SUVs, light truck,
truck and bus radial, as well as industrial, agricultural, aircraft and motorcycle
tyres. Dunlop supplies OE tyres for popular Japanese and European luxury
vehicles such as BMW, Audi, Mercedes, Maserati and Volkswagen.
Stamford Tyres, through its joint venture Tyre Pacific, distributes Dunlop in
Hong Kong, Macau, Vietnam, Cambodia and Laos.
Maxam is a niche tyre manufacturer, specialising in tyres for the construction
and mining industries since the mid-1950s and, with its HQ in Luxembourg,
European design and technical experience and a cost-effective manufacturing
base. Personnel from Europe are based on site and the factory is equipped
with modern, state-of-the-art technology and machinery.
On the product front, Maxam has recently introduced a wide range of
industrial and construction tyres for applications such as skid steer, backhoes
and forklifts, plus there are more exciting innovations in the pipeline. Maxam
have complete range of giant radial off-the-road tyres, for rims up to 57” in
diameter.
Stamford Tyres distributes Maxam in Southeast Asia.
OUR PREMIUM BRANDS
OUR PROPRIETARY BRANDS
OUR PRODUCTS
9Gearing for Stability and Growth

10
Sta
mfo
rd T
yres
Co
rpo
rati
on
Lim
ited
10
Sta
mfo
rd T
yres
Co
rpo
rati
on
Lim
ited
SINGAPOREStamford Tyres International Pte Ltd19 Lok Yang Way, Jurong,Singapore 628635Tel: +65 6268 3111Fax: +65 6264 0148 / 4708E-mail: [email protected]
MALAYSIAStamford Tyres (M) Sdn BhdGlenmarie Main Office & Warehouse16 Jalan Jurunilai U1/20,Section U1 Hicom Glenmarie Industrial Park, 40150, Shah Alam, Selangor, MalaysiaTel: +60 3 5569 3094 / 3397 / +60 3 5569 3090Fax: +60 3 5569 3096E-mail: [email protected]
THAILANDStamford Tires Distributor Co, Ltd133/135 Narathiwas Rachanakharin Road,Chongnonsi Yannawa, Bangkok, 10120, ThailandTel: +662 678 2355Fax: +662 678 2351E-mail: [email protected]
INDONESIAPT Stamford Tyres Distributor IndonesiaJl. Boulevard Raya PA 19,No. 4-5, Kelapa Gading Permai,Jakarta Utara, 14240, IndonesiaTel: +62 21 450 4388Fax: +62 21 450 4384E-mail: [email protected]
PT Stamford Tyres IndonesiaJl. Kuala Kuningan, L.I.P. Kuala Kencana Timika – Papua, 99920, IndonesiaTel: +62 901 301889, +62 901 462297Fax: +62 901 301890E-mail: [email protected]
HONG KONG / CHINAStamford Tyres (Hong Kong) LtdNo. 200, Tai Tong Road,Shung Ching Sun Tsuen,Yuen Long, N.T., Hong KongTel: +852 2406 2381Fax: +852 2406 7100Email :[email protected]
AUSTRALIAStamford Tyres Australia Pty Ltd Unit 1, 1 Dupas Street, Smithfield,NSW 2164, AustraliaTel: +61 2 9756 5355Fax: +61 2 9756 5388E-mail: [email protected]
INDIAStamford Tyres Distributors India Private LimitedC/O. Jai Prakash Upadhayay Off. No.3, Mezzanine Floor,12/14, Maharashtra Bhavan, Bora Masjid Street, FortMumbai, Maharashtra400001 IndiaTel: +91 22 31927771 / +91 22 31927773
SOUTH AFRICAStamford Tyres (Africa) (Pty) Ltd
Cape Town Office8 Ferrule Avenue,Montague Gardens,Milnerton, Cape Town,South Africa, 7441Tel: +2721 790 1302Fax: +2710 001 7339
Durban OfficeNo. 9 Leeukop Road,Mahogany Ridge,Pinetown, DurbanSouth Africa, 3600Tel: +27 31 700 5942Fax:+27 31 700 3179
Johannesburg OfficeCnr Horn Street & Brine Avenue, Chloorkop, Extension 1, Kempton Park, JohannesburgSouth Africa, 1624Tel: +2711 393 7124/5Fax: +2786 514 2816
VIETNAMStamford Tyres Vietnam Company Limited4th Floor No. 20/13Nguyen Truong To Street,District 4 HCM City, VietnamTel: +84 8 3943 0558 / +84 8 6686 4900Fax: +84 8 3943 0557
BRUNEI Stamford Tyres (B) Sdn BhdUnit 4, 5 & 6 Lot No 47701, EDR No BD40018, Spg 128-11-26, Jalan Tungku Link,Kg. Pangkalan Gadong,Bandar Seri Begawan,Negara Brunei DarussalamTel: +673 2428194Fax: +673 2428094
MANUFACTURING
PLANT
THAILANDStamford Sport Wheels Company Limited111/2, 5,8,9 Moo 2, Highway 340Suphanburi Road, Tambon Saiyai Amphur Sainoi, Nonthaburi, 11150ThailandTel: +662 967 7109Fax: +662 985 5847E-mail: [email protected]
JOINT VENTURE
COMPANIES
HONG KONGTyre Pacific (HK) Ltd15th Floor, Sandoz Centre178/182 Texaco Road, Tsuen Wan, N.T.Hong Kong, SARTel: +852 2407 8268Fax: +852 2407 5020
INDIAFalken Tyre India Private Limited Unit No 312 (J,K,L,M,N, P & Q) Centrum Plaza, Golf Course Road, Sector – 53Gurgaon – Haryana 122002, IndiaTel: +91 0124-4638989
STAMFORD TYRES
TRUCK CENTRES
SINGAPORETruck CentresOpening Hours:8:30am – 6:00pm (Mon – Sat)*Closed on Public Holidays
Jurong Truck Centre21 Lok Yang WaySingapore 628636Tel: +65 6268-3112 Fax: +65 6262-1027
Changi Truck Centre31 Loyang WaySingapore 508729Tel: +65 6862-2289 Fax: +65 6542-8078
Woodlands Truck Centre10 Admiralty St #01-78North Link BuildingSingapore 757695Tel: +65 6481-9906 Fax: +65 6481-9160
Tuas Truck Centre110 Tuas Souh Avenue 3 #01-02/03 The Index, Singapore, 637369Tel: +65 6265 7680 Fax: +65 6265 7685
MALAYSIAPort Klang Truck CentreLot 9, Lingkaran Sultan Mohamad 1, 42000, Pelabuhan Klang,Selangor, MalaysiaTel: +60 12215 4881
STAMFORD TYRES
RETAIL OUTLETS
SINGAPOREOpening Hours:9:00am – 7:00pm (Monday – Saturday)10.30am – 3.30pm (Sunday and Public Holidays)
Jurong Mega Mart 19 Lok Yang Way, JurongSingapore 628635Tel: +65 6262-3355 Fax: +65 6262-1494Opening Hours:Monday to Saturday8:30am to 7:00pm*Open on Sunday and Public Holidays
Bukit Batok Mega Mart 50 Bukit Batok St.23 #02-19 Midview Building Singapore 659578Tel: +65 6261-3355 Fax: +65 6267-8912*Open on Sunday *Closed on Public Holidays
OUR PRESENCE

11
Sta
mfo
rd T
yres
Co
rpo
rati
on
Lim
ited
Gearing for Stability and Growth 11
Sta
mfo
rd T
yres
Co
rpo
rati
on
Lim
ited
Gearing for Stability and Growth
attiootiooo
nti
SOUTH AFRICA
INDIA
THAILAND
MALAYSIA
SINGAPORE
VIETNAM
HONG KONG
BRUNEI
AUSTRALIA
INDONESIA
Woodlands Mega Mart No. 10 Admiralty Street #01-85Northlink Building Singapore 757695Tel: +65 6555-3355 Fax: +65 6481-6103*Open on Sunday *Closed on Public Holidays
Ang Mo Kio Mega Mart Blk 10 #01-14 Ang Mo Kio Industry Park 2AAng Mo Kio Auto PointSingapore 568047Tel: +65 6483-3355 Fax: +65 6481-5370*Closed on Sunday and Public Holidays
Kaki Bukit Synergy Mega Mart23 Kaki Bukit Rd 4 #01-12/13 Singapore 417801Tel: +65 6702-3355 Fax: +65 6341-6993*Closed on Sunday and Public Holidays
MacPherson Mega Mart 455 MacPherson Road Singapore 368173 Tel: +65 6841-3355 Fax: +65 6742-8167 *Open on Sunday and Public Holidays
Changi Mega Mart 31 Loyang Way Singapore 508729 Tel: +65 6542-3355 Fax: +65 6543-1403 *Open on Sunday and Public Holidays
Tampines Mega Mart Blk 9006 Tampines St 93 #01-196 Singapore 528840 Tel: +65 6286-3355 Fax: +65 6784-4202 *Closed on Sunday and Public Holidays Kaki Bukit Mega Mart Kaki Bukit Industrial Estate 10 Kaki Bukit Road 2, #01-11 & #01-12 First East Centre Singapore 417868 Tel: +65 6636-3355 Fax: +65 6636-4751*Closed on Sunday and Public Holidays
TYRE MART
EXPRESS
East Coast Tyre Mart355 East Coast Road,Caltex Service StationSingapore 428972Tel: +65 6342-0981 Fax: +65 6342-0978*Open on Sunday*Closed on Public Holidays
Yishun (Caltex) Tyre Mart3700 Yishun Ring RoadSingapore 768690Tel: +65 6257-5910Fax: +65 6257-5975*Closed on Sunday and Public Holidays
Leng Kee Tyre MartNo 8 Kung Chong RoadSingapore (159145)Tel: +65 6475-3355 Fax: +65 6475-2162*Open on Sunday *Closed on Public Holidays
Havelock (Shell) Tyre Mart548 Havelock RoadShell Havelock Service StationSingapore 169637Tel: +65 6733-0129 Fax: +65 6694-5805*Closed on Sunday and Public Holidays
Eng Neo Tyre Mart (Shell Eng Neo)648 Dunearn RoadSingapore 289629Tel: +65 6284-3355 Fax: +65 6219-9224*Closed on Sunday and Public Holidays
Tuas (Shell) Tyre Mart121 Tuas South Avenue 5 Singapore 637365Tel: +65 6254-7570Fax: +65 6254-7573Opening Hours:Monday to Saturday8:30am to 7:00pm*Closed on Sunday and Public Holidays
STAMFORD
TYRES IN-HOUSE
WORKSHOP
SERVICES
Tan Chong & Sons Motor(Nissan)913 Bukit Timah RoadSingapore 589623*Closed on Sunday and Public Holidays
Tan Chong & Sons Motor(Nissan)25 Leng Kee RoadSingapore 159097*Closed on Sunday and Public Holidays
Motor Image (Subaru)19 Lorong 8 Toa PayohSingapore 319255*Closed on Sunday and Public Holidays
MALAYSIACheras Tyre MartNo. 182, Jalan Mahkota, Taman Maluri Cheras, 55100 Kuala Lumpur, MalaysiaTel: +60 3 9285-0918Fax: +60 3 9285-0946E-mail: [email protected]
Glenmarie Tyre Mart16 Jalan Jurunilai U1/20Section U1 Hicom GlenmarieIndustrial Park40150 Shah Alam, Selangor, MalaysiaTel: +60 3 5569-5810Fax: +60 3 5569-3096E-mail: [email protected]
INDONESIAKelapa Gading Tyre MartJl. Boulevard Raya PA 19 No. 4-5 Kelapa Gading PermaiJakarta 14240, IndonesiaTel: +62 21 451 5682 / 450 4388Fax: +62 21 450 4384E-mail: [email protected]

12
Sta
mfo
rd T
yres
Co
rpo
rati
on
Lim
ited
he Group faced a
challenging business
environment in FY2017
due to an oversupply of
tyres globally as well as
the continued strengthening of the
US Dollar against domicile currencies
in our key markets, particularly in
Southeast Asia.
For the financial year ended 30
April 2017, the Group’s revenue
was S$235.8 million compared to
S$239.9 million last year. Revenue
derived from the distribution of tyres
and wheels accounted for 87.2% of
total revenue while manufacturing
of wheels accounted for 12.8%. By
geography, Southeast Asia continued
to be the core market for the Group,
accounting for 85.8% of the Group’s
revenue.
Demand for major brand tyres that
the Group distributes, namely Falken,
Dunlop, Continental and Maxam,
remained strong. Sumo Firenza
proprietary brand tyres and SSW
proprietary brand wheels continued
to enjoy stable demand in Singapore,
Malaysia, Indonesia and Thailand.
Gross profit for the Group was
higher at S$61.8 million for FY2017
compared to S$59.1 million last year.
Gross profit margin increased from
24.7% last year to 26.2% in FY2017,
mainly attributable to value-added
activities at Stamford Tyres Mart retail
chain and truck tyre centres.
Operating expenses decreased by
3.2% to S$56.4 million for FY2017
compared to S$58.2 million last year
due to lower finance costs, marketing
and distribution costs, and foreign
exchange costs. This was offset
by higher allowance for inventory
obsolescence.
FINANCIAL AND OPERATIONS REVIEW
OCTOBER 2016Mr Ikuji Ikeda's visit to Stamford Tyres Headquarters in SingaporeFrom Left to Right: Wu Xiao Ning (Manager, Sumitomo Rubber Asia), Cham Soon Kian (Executive Vice President, CEO of Malaysia, Stamford Tyres), Satoru Ushida
(Managing Director, Sumitomo Rubber Asia), Wee Kok Wah (President, Stamford Tyres), Ikuji Ikeda (President and CEO, Sumitomo Rubber Industries), Satoru Yamamoto
(Director and Senior Executive Officer, General Manager of Asia Pacific Regional Headquarters, Sumitomo Rubber Industries), Lee Kok Chiang (Sales & Marketing
Executive Sumitomo Rubber Asia), Dr Wee Li Ann (Non-Executive Director, Stamford Tyres), Clare Law (SVP, Head of Singapore Operations, Stamford Tyres)
T
OCTOBER 2016 Sumitomo Rubber Thailand 10 Years Anniversary Dinner in Cape Dara, Pattaya From Left to Right: Takahiko Shiomi (Director, Sumitomo Rubber Thailand), Satoru Yamamoto (Director and
Senior Executive Officer, General Manager of Asia Pacific Regional Headquarters, Sumitomo Rubber Industries),
Ikuji Ikeda (President and CEO, Sumitomo Rubber Industries), Colin Choo (SVP, Head of Thailand Operations,
Stamford Tyres), Kasem Buretjittinun (General Manager, Stamford Tires Distributor Co Ltd Thailand)

13
Sta
mfo
rd T
yres
Co
rpo
rati
on
Lim
ited
Gearing for Stability and Growth
The share of results of joint ventures
amounted to a net profit of S$2.6
million for FY2017, compared to a net
profit of S$1.8 million last year, mainly
attributable to improved performance
from our Hong Kong and India joint
ventures.
The Group’s net profit for FY2017
more than tripled to S$8.1 million
compared to S$2.6 million last year.
THE GROUPThe distribution network of the Group
comprises of over 5,000 dealers and
distribution centres in 10 countries.
These distribution centres are located
in Singapore, Malaysia, Thailand,
South Africa, Indonesia, Australia,
India, Vietnam, Brunei and Hong
Kong.
SINGAPORETotal revenue generated in Singapore
includes retail chain operations, truck
tyre centres, local wholesaling as well
as the export of tyres and wheels to
countries other than the 10 mentioned
above. Singapore contributed 31.0%
to the Group’s total revenue for
FY2017.
There are currently 18 Stamford Tyres
Mart retail centres and workshops
island-wide, providing customers with
services such as wheel balancing,
wheel alignment, car maintenance
programs and aerodynamic kits. For
commercial customers, Stamford
Tyres provides total tyre management
services and support to fleet owners
to help them reduce vehicle downtime.
MALAYSIAMalaysia remained a significant
market to the Group, contributing
24.0% of the Group’s revenue for
FY2017. Our dealers in the country
totalled approximately 1,000. We will
continue to build up our distribution
and warehousing capabilities in
Malaysia via the development of our
new warehouse at Kapar, as well as
focus on growing our commercial tyre
sales.
GROSS PROFIT FOR THE GROUP WAS
HIGHER AT S$61.8 MILLION FOR FY2017
COMPARED TO S$59.1 MILLION LAST
YEAR.
THAILANDWe have two operating subsidiaries in
Thailand:
• Stamford Sport Wheels Co., Ltd
(“SSW”), which operates two
factories manufacturing aluminium
alloy wheels; and
• Stamford Tires Distributor Co., Ltd
(“STD”), a wholesaler of tyres and
wheels.
SSW products continued to enjoy
strong demand in Southeast Asia,
particularly in Thailand. Higher average
selling price per wheel, lowering of
production costs and optimisation of
product mix have resulted in improved
profitability for SSW. We have
approximately 700 dealers for Falken
tyres, SSW and commercial tyres.
The combined revenue of both
subsidiaries contributed 16.0% to the
Services offered at Stamford Tyres Retail Centres
include tyre fitting, wheel balancing and alignment, as
well as workshop services.
RTG tyre inspection on site at PSA Port, Singapore
Bus tyre alignment services at Jurong Truck
Centre in Singapore
Warehouse Facility at Lok Yang Way, Singapore

14
Sta
mfo
rd T
yres
Co
rpo
rati
on
Lim
ited
OTHERSRevenue from Australia, Vietnam,
Hong Kong and Brunei totalled
S$20.7 million, or 8.8% of Group’s
revenue.
GOING FORWARDThe Group will focus on its core
strength in the distribution of tyres
and wheels in Southeast Asia, as well
as the markets covered by our joint-
Group’s revenue for FY2017. We are
continuously working on enhancing
our marketing and branding activities
to improve the sale of tyres and wheels
in Thailand, as well as enhancing the
product design and sale of SSW
wheels into export markets.
INDONESIAIndonesia contributed 12.9% to the
Group’s revenue for FY2017. The
Group continues to capitalise on the
strong consumer demand in Indonesia
and to strengthen its passenger tyre
and wheels distribution network.
We currently have a comprehensive
network of warehouses and
distribution points within Indonesia
covering Java, Sumatra, Balikpapan,
Makasar, Manado and Timika.
We will continue to extend our network
in order to be closer to our customers
and to provide more direct and value-
added services to complement our
offerings of radial earthmover tyres
of bigger sizes to support the mining
sector.
SOUTH AFRICASouth Africa remains an important
region outside Southeast Asia for
the Group, contributing 7.2% of
the Group’s revenue for FY2017.
We have three major warehouses
in three cities (Cape Town, Durban
and Johannesburg). We have
approximately 700 dealers here. The
passenger car tyres market remains
stable and the truck and earthmover
tyres continue to be our key focus
segments with the recovery of the
mining sector.
venture companies, namely Hong
Kong, Macau, Indo-China and India.
We will continue to:
• Defend gross profit margin.
• Contain operating costs and
rationalise current assets.
• Deliver timely response to market
needs and trends.
• Drive for organic topline growth.
Earthmover tyre repair works at Timika, Indonesia
An earthmover tyre inspection on-site in Kalimantan, Indonesia
New container warehouse in Johannesburg, South Africa Tyre retreading on-site in Singapore

15
Sta
mfo
rd T
yres
Co
rpo
rati
on
Lim
ited
Gearing for Stability and Growth
DECEMBER 2016 Malaysia Warehouse visit in Klang, SelangorFrom the Left to Right: Cham Soon Kian (Executive Vice President, CEO of Malaysia,
Stamford Tyres), Satoru Ushida (Managing Director, Sumitomo Rubber Asia), Wee Kok
Wah (President, Stamford Tyres), Satoru Yamamoto (Director and Senior Executive
Officer, General Manager of Asia Pacific Regional Headquarters, Sumitomo Rubber
Industries)
MARCH 2017 Official Visit to Continental Concept Shop
in Singapore
From Left to Right : Yeung Ting Ting (Purchasing Manager, Stamford Tyres), Wong
Siew Peng (Vice President, Wholesale Division, Stamford Tyres), Phillip v. Hirschheydt
(Executive Vice President, Business Unit Replacement APAC, PLT, Continental Tyres),
Boon Tian Say (Owner, TS Auto Accessories & Trading) Cameron Wilson (Vice President,
Marketing & Sales PLT ASEAN & TT Malaysia, Continental Tyres) Eryn Lee (Market
Manager, Continental Tyres)
SEPTEMBER 2016 Falken Mini Road Show in Malacca,
Malaysia
JULY 2017 Fortuner Car Club visit to Sumitomo Rubber Tyre
Factory in Thailand
OCTOBER 2016 Russ Swift Stunt Show in Ho Chi Minh, Vietnam
MARCH 2017 Showcasing Stamford Tyres' range of
proprietary brand tyres and wheels at the Tyre Expo Asia 2017,
Singapore
JUNE 2017 Continental Gen 6 Launch in Singapore

Sta
mfo
rd T
yres
Co
rpo
rati
on
Lim
ited
PROFIT
AFTER TAX
(S$’000)
GROUP
TURNOVER
(S$’000)
FINANCIAL HIGHLIGHTS
TOTAL ASSETS
(S$’000)
RETURN ON
SHAREHOLDERS'
EQUITY (%)
2013
2013 2013
20132014
2014 2014
20142015
2015 2015
20152016
2016 2016
20162017
2017 2017
20171
,70
31
.40
%
31
7,4
62
29
0,6
15
29
2,5
15
23
9,8
78
23
5,8
03
10
,01
6
11
,55
8
2,5
87
8,1
12
26
6,5
37
26
4,9
61
29
1,1
11
28
6,4
60
30
4,4
65
9.9
1%
8.2
5%
2.1
7%
6.7
2%
1616

Sta
mfo
rd T
yres
Co
rpo
rati
on
Lim
ited
17
Corporate Governance
Stamford Tyres Corporation Ltd (“the Company”) is committed to high standards of corporate governance. This Report
describes the Company’s corporate governance practices with specific reference to the Code of Corporate Governance
2012 (the “Code 2012”). Unless otherwise stated, these practices were in place for the entire financial year.
Board Matters
Principle 1 : Board’s Conduct of Affairs
Every company should be headed by an effective Board to lead and control the company. The Board is collectively
responsible for the long-term success of the company. The Board works with Management to achieve this objective
and Management remains accountable to the Board.
The Board of Directors (the “Board”) oversees the business affairs of the Group and sets overall corporate strategy
and direction. It approves the Group’s strategic plans, key business initiatives and financial objectives, major
investment and divestment and funding proposals. The Board also monitors the operating and financial performance
and oversees the processes for risk management, financial reporting and compliance and evaluating the adequacy
of internal controls. It approves nominations to the Board. The Board sets the Group’s values and standards and
ensures that obligations to shareholders and others are understood and met. Matters specifically reserved for
Board’s decisions are those involving material acquisitions and disposal of assets, corporate or financial restructuring,
share issuances and dividends. The Board has adopted a set of internal guidelines on these matters. The Board
has delegated certain functions to the Audit Committee (“AC”), Nominating Committee (“NC”) and Remuneration
Committee (“RC”) to assist in the execution of its responsibilities. Each Committee has its own written terms of
reference which clearly sets out its objectives, duties, powers and responsibilities and are in line with the Code 2012.
Minutes of all Board Committees are circulated to the Board so that directors are aware of and are kept updated as to
the proceedings and matters discussed during the Committee meetings.
Directors are regularly updated on the Group’s business and regulatory and industry specific environments in which
the Group operates. Directors also have the opportunity to visit the Group’s operational facilities here and overseas
and meet with Management to gain a better understanding of the Group’s global business operations. The Board as
a whole is updated regularly on risk management, corporate governance and key changes in the relevant regulatory
requirements and accounting standards. Appropriate external trainings will be arranged where necessary. To keep
abreast with developments in corporate, financial, legal and other compliance requirements, Directors are encouraged
to attend relevant courses, conferences and seminars funded by the Company.
In order to ensure that the Board is able to fulfil its responsibilities prior to the Board meetings, Management provides
the Board with adequate and timely information containing relevant background or explanatory information required to
support the decision-making process.
The Board conducts regular scheduled meetings on a quarterly basis. Ad-hoc meetings will be convened as warranted
by circumstances. In between the meetings, important matters concerning the Group may be put to the Board for its
decision via circular resolutions for the directors’ approval. Management has access to the directors for guidance or
exchange of views outside of the formal environment of the Board meetings.
All directors exercise due diligence and independent judgement and make decisions objectively in the best interests of
the Group.
Sta
mfo
rd T
yres
Co
rpo
rati
on
Lim
ited
18
Directors are briefed on regulatory changes, especially those on the Company’s or director’s disclosure obligations. In
order to ensure that the Board is able to fulfill its responsibilities, prior to the Board meetings, Management provides
the Board with information containing relevant background or explanatory information required to support the decision-
making process.
Newly-appointed directors will be given a formal letter explaining his duties and obligations as a director. They will
also be briefed by Management on the Group’s business, its strategic directions as well as its corporate governance
policies. Orientation programmes and familiarisation visits are organised, if necessary, to facilitate a better
understanding of the Group’s operations.
The Board has separate and independent access to the Company Secretary at all times. The Company Secretary’s
appointment and removal is a matter for the Board as a whole. The Company Secretary or her representative attends
Board and Committees’ meetings and is responsible for ensuring that Board procedures are followed. The Board also
has access to independent professional advice, where necessary, at the Company’s expense.
Principle 2 : Board Composition and Guidance
There should be a strong and independent element on the Board, which is able to exercise objective judgement on
corporate affairs independently, in particular, from Management and 10% shareholders. No individual or small group
of individuals should be allowed to dominate the Board’s decision making.
The Board comprises eight directors as follows:
Board
Audit
Committee
Nominating
Committee
Remuneration
Committee
Sam Chong Keen Chairman Member Chairman Chairman
Wee Kok Wah Member - Member -
Mrs Dawn Wee Wai Ying Member - - -
Tay Puan Siong Member Chairman Member -
Goh Chee Wee Member - - Member
Dr. Wee Li Ann Member Member - Member
Leslie Mah Kim Loong Member Member - -
Kazumichi Mandai Member - - -
Mr Sam Chong Keen is the non-executive and independent Chairman. The President, Mr Wee Kok Wah and the
Executive Director, Mrs Dawn Wee Wai Ying are both executive directors. Dr Wee Li Ann is a non-executive director.
Mr Tay Puan Siong, Mr Goh Chee Wee, Mr Leslie Mah Kim Loong and Mr Kazumichi Mandai are non-executive and
independent directors. There are no Alternate Directors on the Board.
The Company’s Constitution permits the directors to attend meetings through the use of audio-visual communication
equipment.
Corporate Governance (Cont’d)

Sta
mfo
rd T
yres
Co
rpo
rati
on
Lim
ited
19
Directors’ Attendance at Board & Committee Meetings held since May 2016
Board of
Directors
Audit
Committee
Nominating
Committee
Remuneration
Committee
No. of
Meetings
Held
No. of
Meetings
Attended
No. of
Meetings
Held
No. of
Meetings
Attended
No. of
Meetings
Held
No. of
Meetings
Attended
No. of
Meetings
Held
No. of
Meetings
Attended
Sam Chong Keen 4 4 5 5 1 1 1 1
Wee Kok Wah 4 4 - - 1 1 - -
Mrs Dawn Wee Wai Ying 4 3 - - - - - -
Tay Puan Siong 4 4 5 5 1 1 - -
Goh Chee Wee 4 4 - - - - 1 1
Dr. Wee Li Ann 4 4 5 5 - - 1 1
Leslie Mah Kim Loong 4 4 5 5 - - - -
Kazumichi Mandai 4 4 - - - - - -
There is strong and independent element on the Board. The Board is able to exercise objective judgment
independently from Management and no individual or small group of individuals dominate the decisions of the Board.
The non-executive and independent directors contribute to the Board by monitoring and reviewing Management’s
performance against goals and objectives. Their views and opinions provide different perspectives to the Group’s
business. While challenging Management’s proposals or decisions, they bring independent judgement to bear on
business activities and transactions involving conflicts of interest and other complexities. Where appropriate and
necessary, the non-executive directors would also meet without the presence of Management.
The NC considers the Board’s present size and composition appropriate taking into account the nature and scope of
the Group’s operations, the depth and breadth of knowledge, expertise and business experiences of the directors to
govern and manage the Group’s affairs and that a majority of the Board is independent. The NC reviews the size of
the Board from time to time.
The Board has no dissenting view on the President’s Letter to Shareholders for the financial year in review.
Principle 3 : Chairman and President
There should be a clear division of responsibilities between the leadership of the Board and the executives
responsible for managing the company’s business. No one individual should represent a considerable concentration
of power.
The Chairman is a non-executive appointment and is separate from the office of the President. There is a clear
segregation of the roles and responsibilities between the Chairman and the President. As the Chairman and President
are not related, no Lead Independent Director was appointed.
The Chairman provides strategic guidance and leads the Board. He is responsible for ensuring the effectiveness of
the Board and its governance processes, including the responsibilities of scheduling and setting agendas for Board
meetings and control over the quality, quantity and timeliness of information flow between the Board and Management.
The President provides overall vision and bears full executive responsibility for the Group’s operations, including
making key day-to-day operational decisions.
Corporate Governance (Cont’d)

Sta
mfo
rd T
yres
Co
rpo
rati
on
Lim
ited
20
Principle 4 : Board Membership
There should be a formal and transparent process for the appointment and re-appointment of directors to the Board.
Principle 5 : Board Performance
There should be a formal annual assessment of the effectiveness of the Board as a whole and its board committees
and the contribution by each director to the effectiveness of the Board.
The NC comprises three directors, two of whom, including the Chairman, are independent directors. The Committee
Chairman is Mr Sam Chong Keen and the other members are Mr Tay Puan Siong and Mr Wee Kok Wah.
The NC’s written key terms of reference describe its responsibilities and these include:
reviewing and assessing candidates for directorships (including executive directorships) before nominating
such candidates to the Board for approval;
reviewing and recommending to the Board the re-election and appointment of directors under the retirement
provisions in accordance with the Company’s Constitution at each annual general meeting (“AGM”);
reviewing the composition of the Board annually to ensure that the Board has an appropriate balance of
independent directors and ensuring an appropriate balance of expertise, skills, attributes and abilities on the
Board;
reviewing and determining annually if a director is independent in accordance with the Code 2012 and any
other salient factors;
where a director has multiple board representations, deciding whether the director is able to and has been
adequately carrying out his duties as director; and
reviewing the succession plan for directors and key executives of the Group.
The NC also determines the independence of directors and evaluates and assesses the effectiveness of the Board
taking into consideration appropriate performance criteria.
The Board, through the delegation of its authority to the NC, has used its best efforts to ensure that directors
appointed to the Board possess the background, experience and knowledge in technology, business, finance and
management skills critical to the Group’s businesses and that each director, through his unique contributions, brings
to the Board an independent and objective perspective to enable balanced and well-considered decisions to be made.
The search and nomination process for new directors, if any, will be through search companies, contacts and
recommendations that go through the normal selection process, to cast its net as wide as possible for the
right candidates. New directors are appointed by the Board after the NC has reviewed and recommended their
appointment.
Corporate Governance (Cont’d)
Sta
mfo
rd T
yres
Co
rpo
rati
on
Lim
ited
21
The NC recommends all appointments and re-nominations of directors to the Board and Board committees. The
Company’s Constitution provides for one-third of the directors to retire by rotation and be subject to re-election
at every AGM. A newly appointed director must also subject himself to retirement and re-election at the AGM
immediately following his appointment. The NC, in considering the nomination of any director for re-election will
evaluate the performance of the director involved.
The NC has assessed the independence of the directors based on the definition of independence as set out in the
Code 2012. The NC also requires all the independent directors to confirm their independence and their relationship
with the other directors, Management and 10% shareholders of the Company by a declaration in writing annually.
As at 30 April 2017, three independent directors have served on the Board for more than nine years. They are Mr
Sam Chong Keen, Mr Tay Puan Siong and Mr Goh Chee Wee. The NC takes the view that a director’s independence
cannot be determined solely and arbitrarily on the basis of the length of time. A director’s contribution in terms of
experience, expertise, professionalism, integrity, objectivity and independent judgment in engaging and challenging
Management in the best interests of the Group as he performs his duties in good faith, are more critical measures in
ascertaining his independence than the number of years served on the Board. Hence, the Board does not impose a
limit on the length of service of the independent directors. However, the Board and NC will exercise due and careful
review, taking into consideration other factors, in assessing the independence of a director. These factors include,
inter alia, if the director has any interest, business, relationship and/or any other material contractual relationships with
the Group which could reasonably be perceived to compromise his independence and interfere with the exercise of
his independent business judgment with a view to the best interest of the Group.
After due consideration and careful assessment, the Board, in concurrence with the NC, is of the view that the
three independent directors remain independent in their exercise of judgment and objectivity on Board matters as
they have each continued to demonstrate strong independence in character and judgement in the discharge of
their responsibilities as a director of the Company. They have not hesitated to express their respective viewpoints,
objectively raise issues or seek clarification as and when necessary from the Board, Management and the Group’s
external advisers on matters pertaining to their area of responsibilities whether on Board or on the Committees. The
Company has also benefited from their years of experience in their respective fields of expertise. Mr Sam Chong Keen,
Mr Tay Puan Siong and Mr Goh Chee Wee have each abstained from the discussion and deliberation during the
review of their respective independence.
The NC and the Board are of the opinion that the directors, who have been classified as independent under the Board
Composition section, are indeed independent and the current size of the Board is adequate for the purposes of the
Group.
The NC has established a formal appraisal process to assess the performance and effectiveness of the Board as a
whole annually. It focuses on a set of performance criteria which includes the evaluation of the size and composition
of the Board, the Board’s access to information and Board accountability. The findings of such evaluations were
analyzed and discussed with a view to identifying areas for improvement and implementing certain recommendations
to further enhance the effectiveness of the Board. In its evaluation, the NC considers the expertise and experience of
each Board member, their attendance, participation and contributions to the Board both inside and outside of Board
meetings which can be in many forms, including Management’s access to him for guidance or exchange of views
outside the formal environment of the Board. No external facilitator was engaged by the Board for this purpose.
Corporate Governance (Cont’d)

Sta
mfo
rd T
yres
Co
rpo
rati
on
Lim
ited
22
The NC has assessed that each director in the Company is able to and has been adequately carrying out his duties
as a director of the Company, taking into consideration the director’s number of listed company board representations
and other principal commitments. The Committee also took into consideration the Company’s existing regime of
directors being assessed by each other as an additional check and balance on the performance of individual directors
and that a director should have self-responsibility to determine whether he is able to discharge his duties properly and
effectively as a director when taking on additional listed company board seats. The NC, with concurrence from the
Board, had recently adopted a guide that a director should not have in aggregate more than five (5) listed company
board representations so as to be able to devote sufficient time and attention to the affairs of the Company. None of
the Directors have exceeded this limit.
The NC has recommended the re-election of Mr Sam Chong Keen and Mr Goh Chee Wee, who are retiring by
rotation pursuant to Article 99 of the Company’s Constitution. The retiring directors have offered themselves for
re-election. Each member of the NC has abstained from voting on any resolutions and making any recommendation
and/or participating in respect of matters in which he is interested. The Board has accepted the recommendations of
the NC.
Key information of each director is set out on pages 4 to 6 of this report and the dates of their initial appointment and
last re-appointment/re-election are set out below:
Name of Director Date of initial appointment
Date of last re-appointment/
re-election
Sam Chong Keen 9 Dec 1994 29 Aug 2014
Wee Kok Wah 11 Oct 1989 N.A.*
Mrs Dawn Wee Wai Ying 11 Oct 1989 28 Aug 2015
Tay Puan Siong 2 Jun 1994 28 Aug 2015
Goh Chee Wee 29 Oct 1998 29 Aug 2014
Dr Wee Li Ann 9 Dec 2009 30 Aug 2016
Leslie Mah Kim Loong 1 Dec 2012 30 Aug 2016
Kazumichi Mandai 1 Dec 2012 30 Aug 2016
* Managing Director is not subject to retirement by rotation (Article 94 of the Company’s Constitution)
The Board believes in carrying out succession planning for itself and its key management staff to ensure continuity of
leadership. Currently, there is an informal succession plan in place and the NC will look into drawing up a formal plan
at the relevant time.
Corporate Governance (Cont’d)

Sta
mfo
rd T
yres
Co
rpo
rati
on
Lim
ited
23
Principle 6 : Access to Information
In order to fulfil their responsibilities, directors should be provided with complete, adequate and timely information
prior to board meetings and on an on-going basis so as to enable them to make informed decisions to discharge
their duties and responsibilities.
Directors are given independent and full access to the Management team and Company Secretary, all Board and
Board Committees’ minutes and all approval and information papers. In between Board meetings, important matters
concerning the Company are also put forth to the Board for its decision by way of circular resolutions in writing for
the directors’ approval together with supporting memoranda to enable the directors to make informed decisions. The
Company supports the directors, either individually or as a group, if they require independent professional advice
in furthering their duties to the Company and the cost of such advice will be borne by the Company subject to the
Board’s approval.
Remuneration Matters
Principle 7 : Procedures for Developing Remuneration Policies
There should be a formal and transparent procedure for developing policy on executive remuneration and for fixing
remuneration packages of individual directors. No director should be involved in deciding his own remuneration.
Principle 8 : Level and Mix of Remuneration
The level and structure of remuneration should be aligned with the long-term interest and risk policies of the
company, and should be appropriate to attract, retain and motivate (a) the directors to provide good stewardship of
the company, and (b) key management personnel to successfully manage the company. However, companies should
avoid paying more than is necessary for this purpose.
Principle 9 : Disclosure on Remuneration
Every company should provide clear disclosure of its remuneration policies, level and mix of remuneration, and the
procedure for setting remuneration, in the company’s Annual Report. It should provide disclosure in relation to its
remuneration policies to enable investors to understand the link between remuneration paid to directors and key
management personnel, and performance.
The RC comprises two non-executive and independent directors, and a non-executive director. It is chaired by Mr Sam
Chong Keen and the members are Mr Goh Chee Wee and Dr Wee Li Ann.
The RC’s written key terms of reference describe its responsibilities and these include:
recommending to the Board, in consultation with the Board Chairman, for endorsement, a comprehensive
remuneration policy framework and guidelines for remuneration of the directors and key executives of the
Group;
Corporate Governance (Cont’d)

Sta
mfo
rd T
yres
Co
rpo
rati
on
Lim
ited
24
recommending specific remuneration packages for each of the directors and the executive directors;
in the case of service agreements, considering what compensation commitments the directors’ or key
executives’ contracts of service, if any, would entail in the event of early termination with a view to be fair and
avoid rewarding poor performance and to recognise the duty to mitigate loss;
approving performance targets for assessing the performance of each of the key executive of the Group
and recommending such targets as well as employee specific remuneration packages for each of such key
executive for endorsement by the Board; and
administering share incentive plans of the Company, if any.
The RC reviews and recommends to the Board the framework of remuneration for key executives and for directors
serving on the Board and Board Committees. The review of specific remuneration packages includes fees, salaries,
bonuses and incentives. It also administers the Company’s Employee Share Option Schemes and Performance Share
Schemes, if any. The Company has no such schemes in place presently.
Remuneration for key executives are based on corporate and individual performance with certain key executives
entitled to profit-sharing bonuses based on certain profit on a realized basis. There are appropriate and meaningful
measures in place for the purposes of assessing the performance of the executive directors and key management
personnel. Although the recommendations are made in consultation with Management, the remuneration packages are
ultimately approved by the Board. No director is involved in deciding his own remuneration.
In performing its function, the RC endeavours to establish an appropriate remuneration policy to attract, retain and
motivate the executive directors and key management personnel whilst at the same time ensuring that the reward in
each case takes into account individual performance as well as corporate performance.
Executive directors have service contracts which include terms for termination under appropriate notice. Non-executive
directors are remunerated based on basic fees for serving on the Board and Board Committees. Such fees are
recommended for approval by shareholders as a lump sum payment at the AGM.
At the moment, the Company does not use any contractual provisions to reclaim incentive components of
remuneration from executive directors and key management executives in exceptional circumstances of misstatement
of financial results, or of misconduct resulting in financial loss to the Company. The RC will consider, if required,
whether there is a requirement to institute such contractual provisions to allow the Company to reclaim the incentive
components of the remuneration of the executive directors and key management executives paid in prior years in such
exceptional circumstances.
The RC has access to expert professional advice on remuneration matters whenever there is a need to obtain such
advice.
Details of the Company’s Employee Share Option Schemes and Share Performance Schemes, if any, will be provided
in the Directors’ Statement.
The Board supports and is aware of the need for transparency. However, after deliberation and debate, the Board is of
the view that full disclosure of the specific remuneration of each individual director and the Group’s key management
personnel (who are not directors) is not in the best interest of the Company and therefore shareholders. Inter alia,
the Board has taken into account the very sensitive nature of the matter, the relative size of the Group, the highly
competitive business environment the Group operates in and the irrevocable negative impact such disclosure may
have on the Group.
Corporate Governance (Cont’d)
Sta
mfo
rd T
yres
Co
rpo
rati
on
Lim
ited
25
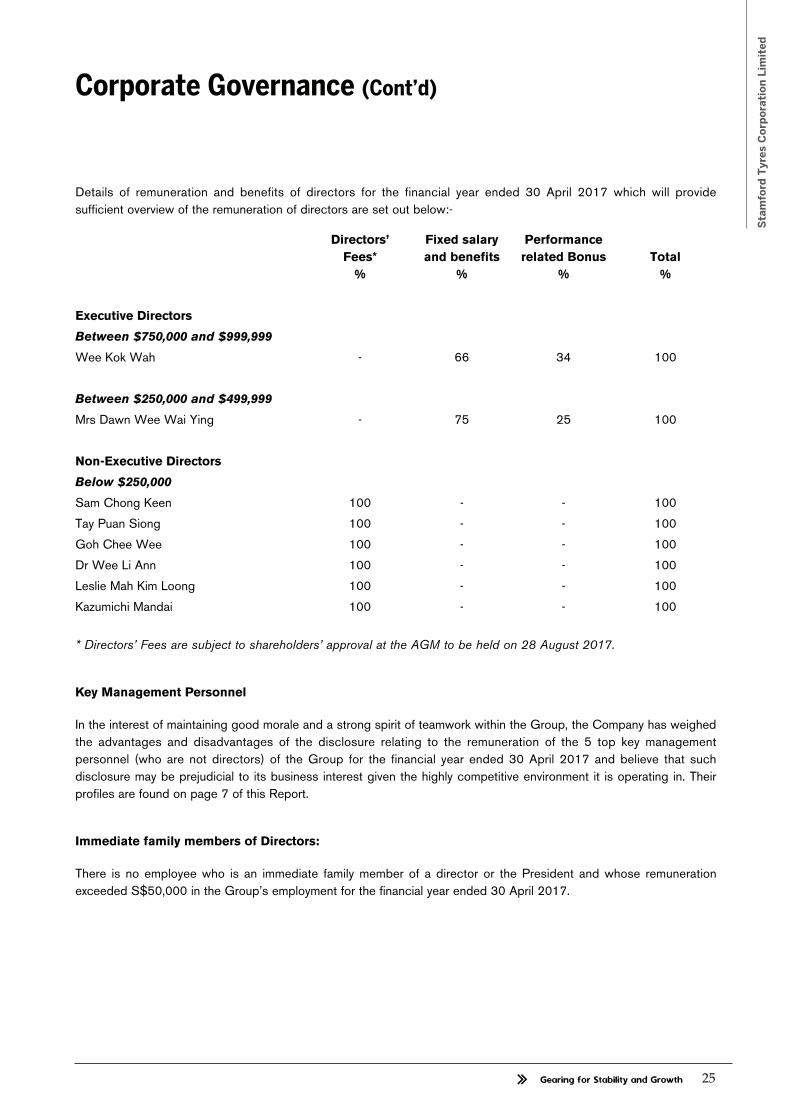
Details of remuneration and benefits of directors for the financial year ended 30 April 2017 which will provide
sufficient overview of the remuneration of directors are set out below:-
Directors’
Fees*
%
Fixed salary
and benefits
%
Performance
related Bonus
%
Total
%
Executive Directors
Between $750,000 and $999,999
Wee Kok Wah - 66 34 100
Between $250,000 and $499,999
Mrs Dawn Wee Wai Ying - 75 25 100
Non-Executive Directors
Below $250,000
Sam Chong Keen 100 - - 100
Tay Puan Siong 100 - - 100
Goh Chee Wee 100 - - 100
Dr Wee Li Ann 100 - - 100
Leslie Mah Kim Loong 100 - - 100
Kazumichi Mandai 100 - - 100
* Directors’ Fees are subject to shareholders’ approval at the AGM to be held on 28 August 2017.
Key Management Personnel
In the interest of maintaining good morale and a strong spirit of teamwork within the Group, the Company has weighed
the advantages and disadvantages of the disclosure relating to the remuneration of the 5 top key management
personnel (who are not directors) of the Group for the financial year ended 30 April 2017 and believe that such
disclosure may be prejudicial to its business interest given the highly competitive environment it is operating in. Their
profiles are found on page 7 of this Report.
Immediate family members of Directors:
There is no employee who is an immediate family member of a director or the President and whose remuneration
exceeded S$50,000 in the Group’s employment for the financial year ended 30 April 2017.
Corporate Governance (Cont’d)
Sta
mfo
rd T
yres
Co
rpo
rati
on
Lim
ited
26
Accountability and Audit
Principle 10 : Accountability
The Board should present a balanced and understandable assessment of the company’s performance, position and
prospects.
Principle 11 : Risk Management and Internal Controls
The Board is responsible for the governance of risk. The Board should ensure that Management maintains a sound
system of risk management and internal controls to safeguard shareholders’ interests and the company’s assets,
and should determine the nature and extent of the significant risks which the Board is willing to take in achieving its
strategic objectives.
Principle 12 : Audit Committee
The Board should establish an Audit Committee (“AC”) with written terms of reference which clearly set out its
authority and duties.
Principle 13 : Internal Audit
The company should establish an effective internal audit function that is adequately resourced and independent of
the activities it audits.
The Board is mindful of the obligation to provide shareholders with a balanced and understandable assessment of the
Company’s performance, position and prospects including information on all major developments that affect the Group
and strives to maintain a high standard of transparency.
The AC comprises three non-executive and independent directors and a non-executive director. It is chaired by Mr
Tay Puan Siong and the members are Mr Sam Chong Keen, Mr Leslie Mah Kim Loong and Dr Wee Li Ann. No former
partner or director of the Company’s existing auditing firm or auditing corporation is a member of the AC.
The AC has full authority to investigate matters relating to the Group and any matters within its terms of reference.
The AC’s written key terms of reference describe its responsibilities and these include:
assisting the Board of Directors in discharging its statutory responsibilities on financing and accounting matters;
reviewing significant financial reporting issues and judgements to ensure the integrity of the financial statements
and any formal announcements relating to financial performance;
reviewing the scope and results of the audit and its cost effectiveness, and the independence and objectivity of
the external auditor;
reviewing and evaluating with internal auditors, the adequacy and effectiveness of the system of internal
controls, including financial, operational, compliance and information technology controls, and risk management
policies and framework;
Corporate Governance (Cont’d)

Sta
mfo
rd T
yres
Co
rpo
rati
on
Lim
ited
27
reviewing any interested person transactions as defined in the Listing Manual;
appraising and reporting to the Board on the audits undertaken by the external auditor and internal auditor, the
adequacy of disclosure of information, and the appropriateness and quality of the system of management and
internal controls;
making recommendations to the Board on the appointment, re-appointment and removal of the external auditor
and internal auditor, and approving the remuneration and terms of engagement of the external auditor and
internal auditor; and
reviewing whistle-blowing investigations within the Group and ensuring appropriate follow-up action, if required.
The significant issues considered by the AC in relation to financial statements during the year ended 30 April 2017
are detailed below, alongside the actions taken by the AC to address these issues:
Significant matters
considered How these issues were addressed by the AC
Impairment assessment
of investments in
subsidiaries, joint
ventures and associate
The AC considered Management’s approach and analysis in assessing for impairment
of its investments in subsidiaries, joint ventures and associate.
The AC considered the reasonableness of the assumptions used and judgements
made on cash flow forecasts, discount rates and growth rates used, and was satisfied
that these were appropriate.
The External Auditor have included the impairment of assessment of investments in
subsidiaries, joint ventures and associate as a key audit matter in its auditor’s report for
the year ended 30 April 2017. This is on page 38 of the Annual Report.
Allowance for inventory
obsolescence
The AC considered the approach and methodology applied to the allowances for
inventory obsolescence.
The AC discussed the above with the External Auditors to consider the
reasonableness, appropriateness of analysis and assessments made by Management,
and was satisfied that these were appropriate.
The External Auditor have included the allowance for inventory obsolescence as a key
audit matter in its auditor’s report for the year ended 30 April 2017. This is on page 38
of the Annual Report.
Allowance for doubtful
debts
The AC considered the approach and methodology relating to the monitoring
and collectability of trade receivables and Management’s assessment in providing
allowance for doubtful debts.
The AC discussed the above with the Management and External Auditor to consider
the reasonableness of the assessment and was satisfied that these were appropriate.
The External Auditor have included the allowance for doubtful debts as a key audit
matter in its auditor’s report for the year ended 30 April 2017. This is on page 39 of
the Annual Report.
Corporate Governance (Cont’d)

Sta
mfo
rd T
yres
Co
rpo
rati
on
Lim
ited
28
The AC reviews the scope, the audit plan, the results and effectiveness of both the External and Internal Auditors and
has met with the External Auditor and Internal Auditor separately without the presence of management for the year in
review.
To keep abreast of the changes in financial reporting standards and related issues which have a direct impact on
financial statements, discussions are held with the External Auditor where applicable, when they attend the AC
Meetings.
The AC, having reviewed the nature and extent of non-audit services provided by Ernst & Young LLP (“EY”) and EY
member firms, including fees paid in respect of the year ended 30 April 2017, is of the view that the independence
and objectivity of EY as External Auditor of the Company has not been compromised. The fee payable to the External
Auditor is disclosed on page 75 of this Annual Report.
The AC has also reviewed and confirmed that EY is a suitable audit firm to meet the Company’s audit obligations,
having regard to the adequacy of resources and experience of the firm and the assigned audit engagement
partner, EY’s other audit engagements, size and complexity of the Stamford Tyres Group, number and experience
of supervisory and professional staff assigned to the audit. Accordingly, the AC recommended to the Board the re-
appointment of EY as External Auditor of the Group for the year ending 30 April 2018. EY has been engaged to audit
the accounts of the Company and its Singapore-incorporated subsidiaries. The accounts of the significant foreign-
incorporated subsidiaries are audited by EY member firms in the respective countries. The Group has complied with
Rules 712 and 715 of the Listing Manual in relation to its auditing firms.
As proper risk management is a significant component of a sound system of internal control, the Group has put in
place a strategic enterprise risk management (“ERM”) framework since FY2007. The Board recognises the importance
of establishing a formal ERM Framework to facilitate the governance of risks and monitoring the effectiveness of
internal controls.
The Board is cognizant of its responsibility for maintaining a sound system of internal controls to safeguard the
investment of its shareholders and the assets and business of the Group. The internal audit function is outsourced
to an external professional firm, Yang Lee & Associates (“YLA”). The Internal Auditor conducts regular audit of
internal control systems of the Group’s companies, recommends necessary improvements and enhancements, and
reports directly to the AC. YLA is guided by the International Standards for the Professional Practice of Internal
Auditing issued by the Institute of Internal Auditors and staffed with professionals with the relevant qualifications and
experience. The AC is satisfied that the Company’s internal audit function is adequately resourced to perform the job
for the Group.
The AC examines the effectiveness of the Group’s internal control systems. The many assurance mechanisms
operating are supplemented by the Internal Auditor’s reviews of the effectiveness of the Group’s material internal
controls, including financial, operational and compliance and information technology controls. Any material non-
compliance or failures in internal controls and recommendations for improvements are reported to the AC. The AC
reviews the effectiveness of the actions taken by Management on the recommendations made by the Internal Auditor
in this respect.
In addition, the Group has set up an executive Risk Management Committee (“RMC”) to oversee that appropriate
risk management policies are put in place and there are processes to evaluate the risks monitored under the ERM
framework. The RMC, comprising members of the Senior Management team, is responsible for setting the direction of
corporate risk management and monitoring the implementation of risk management policies and procedures.
Corporate Governance (Cont’d)

Sta
mfo
rd T
yres
Co
rpo
rati
on
Lim
ited
29
The RMC has established an enhanced risk management policy to provide guidance to Management on key risk
parameters. The significant risks in the Group’s business, including mitigating measures, were also reviewed by the
RMC and reported to the AC and the Board. Risk registers are maintained by the business and operational units
which identify the key risks facing the Group’s business and the internal controls in place to manage those risks.
These risks have been categorized as strategic, operational, financial or compliance risks and the main areas of
financial risk, faced by the Group are foreign currency exchange risk, interest rate risk, credit risk and liquidity risk.
The RMC together with the President and Group Financial Controller have confirmed to the AC and the Board the
adequacy and effectiveness of the risk management system and internal controls.
The AC, with the assistance of the Internal and External Auditors, reviews and reports to the Board on the adequacy
of the Company’s system of internal controls, including financial, operational, compliance and information technology
controls and taking into consideration the risk management perspective.
The AC may examine whatever aspects it deems appropriate of the Group’s financial affairs, its internal and external
audits and its exposure to risks of a regulatory or legal nature. It keeps under review the effectiveness of the
Company’s system of accounting and internal financial controls, for which the directors are responsible. It also keeps
under review the Company’s programme to monitor compliance with its legal, regulatory and contractual obligations.
The Board has received written assurance from the President and Group Financial Controller:
(a) that the financial records have been properly maintained and the financial statements give true and fair view of
the Group’s operations and finances; and
(b) regarding the effectiveness of the Group’s risk management and internal control systems.
Based on the internal controls established and maintained by the Group, work performed by the Internal Auditor,
and the statutory audit conducted by the External Auditor, and reviews performed by Management, Risk Management
Committee and various Board committees, the Board, with the concurrence of the AC, is of the opinion that the
system of internal controls, including financial, operational, compliance and information technology controls and risk
management, were adequate and effective as at 30 April 2017 to meet the needs of the Group’s existing business
objectives, having addressed the risks which the Group considers relevant and material to its operations. While
acknowledging their responsibility for the system of internal controls, the Directors are aware that such a system is
designed to manage, rather than eliminate risks, and therefore cannot provide absolute assurance in this regard, or
absolute assurance against the occurrence of material errors or mis-statements, poor judgment in decision-making,
human errors, losses, fraud or other irregularities.
Quarterly and full year results are reviewed by the AC prior to their submission to the Board as are interested person
transactions that fall within the scope of Chapter 9 of the Listing Manual of the SGX-ST.
The AC has a “whistle blowing” or Corporate Ethics Compliance policy in place. The policy provides a channel for
staff to confidentially report violations of the Group’s Code of Ethics, business conduct, and improprieties in financial
accounting, trade practices, conflict of interest, employee discrimination, health and safety. Reports can be made
on an anonymous basis directly to the AC. Appropriate investigation will be carried out and the informant (if not
anonymous) will be informed of the results.
Corporate Governance (Cont’d)
Sta
mfo
rd T
yres
Co
rpo
rati
on
Lim
ited
30
Risk management policies
The Group has set up objectives to manage the risks that arise from the normal course of its operations. The
significant risks are summarised below:
(i) General business risk
The Group’s major business is distribution of tyres and wheels. The Group is reliant on a few key suppliers for the
supply of certain major brand of tyres. Some of these suppliers have granted exclusive distribution rights. Although
the Group has a strong relationship with the principals (some exceeding 30 years), there is no assurance that the
principals will continue to appoint the Group as their exclusive distribution agent in the future. Should any of the major
principals decide to discontinue the distribution rights in the future, the Group could lose some of its market share
and this could then have an adverse financial impact on the Group. To mitigate this risk, the Group has been focusing
on developing its own range of proprietary ‘in-house’ brands like Sumo Firenza, Sumo Tire and SSW to become less
reliant on its principals.
As in any other business environment, the Group’s assets are exposed to various risks arising from normal operations
and natural disasters. In particular, the Group’s inventory is highly flammable and susceptible to the risk of fire. It is the
Group’s practice to annually assess these risks and/or exposure to ensure that the Group is protected from potential
monetary loss. In addition to other preventive measures, the Group ensures that adequate insurance coverage is
maintained at all times to mitigate such risks except where the cost of insuring the asset is considered prohibitive in
relation to the risks identified.
(ii) Product liability claims
The Group is exposed to claims from its customers from products sold by the Group which contain defects or found
to be unfit for their intended use. The Group may be required to make financial compensation to its customers in
such circumstances. The Group’s principals are well established in the market place and their products are usually
tested for safety before being marketed. The Group continues to spend considerable effort in ensuring the quality of
its products and services. The Group provides its employees with relevant training, on a regular basis, to uphold the
quality of services provided to its customers. The Group has no history of any significant claim made by its customers.
(iii) Credit and inventory risk
The Group faces normal business risks associated with collection of trade receivables and inventory obsolescence.
The Group’s exposure to credit risks arises mainly from sales made to distributors and retailers in various geographical
locations. The Group has tight credit control policies and procedures to evaluate the credit worthiness of customers
before credit is granted and to prevent significant concentration of credit risk. The Group also has adequate policies
and procedures to minimise the risk of inventory obsolescence. The risk of inventory obsolescence may arise from
changes in consumer preference and technology. It is the Group’s policy to maintain optimum inventory level at all
times. Inventory level is monitored regularly and slow moving inventories are quickly identified for early disposal. The
Group has also put in place a ‘supply chain management’ system to procure inventories in an effective manner to
prevent excess inventories on hand.
The financial risk management objectives and policies are discussed in Note 35 to the financial statements.
Corporate Governance (Cont’d)

Sta
mfo
rd T
yres
Co
rpo
rati
on
Lim
ited
31
Communication with Shareholders
Principle 14 : Shareholders’ Rights
Companies should treat all shareholders fairly and equitably, and should recognise, protect and facilitate the exercise
of shareholders’ rights, and continually review and update such governance arrangements.
Principle 15 : Communication with Shareholders
Companies should actively engage their shareholders and put in place an investor relations policy to promote
regular, effective and fair communication with shareholders.
Principle 16 : Conduct of Shareholders’ Meetings
Companies should encourage greater shareholder participation at general meetings of shareholders, and allow
shareholders the opportunity to communicate their views on various matters affecting the company.
The Company does not practise selective disclosure. Shareholders are kept informed of the developments in the
Group’s businesses and operations through announcements via SGXnet as well as through the annual report.
Announcements are made as soon as possible to ensure timely dissemination of the information to shareholders and
the public. Results and the annual reports are announced or issued within the mandatory periods. To further enhance
its communication with investors, the Company’s website www.stamfordtyres.com allows the public to access
information on the Group directly.
Shareholders are encouraged to attend the Company’s general meetings to ensure a greater level of shareholder
participation and for them to be kept up to date on the strategies and goals of the Group. All shareholders
of the Company receive a copy of the Annual Report, Notice of AGM and circulars and notices pertaining to any
Extraordinary General Meetings of the Company.
To facilitate participation by shareholders, the Company’s Constitution allows shareholders to attend and vote at
general meetings of the Company by proxies. A shareholder who is not a relevant intermediary is entitled to appoint
not more than two proxies to attend, speak and vote at the general meetings while a member who is a relevant
intermediary is entitled to appoint more than two proxies to attend, speak and vote at the general meetings through
proxy forms deposited 48 hours before the meeting. Notices of general meetings are also advertised in newspapers
and available on the SGX-ST’s website.
Every matter requiring shareholders’ approval is proposed as a separate resolution. Each item of special business
included in the notice of meeting is accompanied, where appropriate, by an explanation for the proposed resolution.
As authentication of shareholder identity information and other related security issues still remain a concern, the
Company has decided, for the time being, not to implement voting in absentia by mail, facsimile or email. Participation
of shareholders is encouraged at the AGM through the open question and answer session. The Directors,
Management and External Auditor are available to address any queries or concerns on matters relating to the Group
and its operations.
Corporate Governance (Cont’d)

Sta
mfo
rd T
yres
Co
rpo
rati
on
Lim
ited
32
For greater transparency, the Company implemented poll voting since 2012. This entails shareholders being invited
to vote on each resolution by poll thereby allowing all shareholders present or represented at the meeting to vote on
a one share, one vote basis. The detailed voting results of all votes cast for, or against, each resolution tabled, are
announced at the meeting and via SGX-ST’s website.
Dividend Policy
While the Company has not formally instituted a dividend policy, it has a good track record of paying annual dividends
to shareholders. In proposing any dividend payout and/or determining the form, frequency and/or the amount of
such dividend payout, the Board will take into account, inter alia, the Group’s financial position, retained earnings,
results of operation and cash flow, the Group’s expected working capital requirements, the Group’s expected capital
expenditure and future expansion and investment plans and other funding requirements, general economic conditions
and other internal or external factors that may have an impact on the business or financial performance and position of
the Group.
The Board endeavours to maintain a balance between meeting shareholders’ expectations and prudent capital
management with a sustainable dividend payout.
Internal Code on Dealings With Securities
The Group has adopted an internal code which prohibits the Company, directors and employees of the Group
from dealings in securities of the Company while in possession of price-sensitive information, and during the period
commencing two weeks and one month before the announcement of the quarterly and full year results respectively,
and ending on the date of announcement. In addition, directors and employees are expected to observe insider trading
laws at all times even when dealing in securities within the permitted period.
It also discourages dealings on short-term considerations. Directors and employees are required to report securities
dealings to the Company Secretary who will assist to make the necessary announcements.
Corporate Governance (Cont’d)

Sta
mfo
rd T
yres
Co
rpo
rati
on
Lim
ited
33
Interested Person Transactions
The Group has established procedures to ensure that all transactions with interested persons are reported in a timely
manner to the AC and that the transactions are conducted at arm’s length basis and on normal commercial terms
and will not be prejudicial to the interests of the Company and its shareholders. All interested person transactions are
subject to review by the AC to ensure compliance.
During the year, the following interested person transactions were entered with a company in which the two executive
directors are also directors/shareholders and have substantial financial interest:-
Name of interested person Aggregate value of all interested person
transactions conducted during the
financial year (excluding transactions
below $100,000 and transactions
conducted under the shareholders’
mandate pursuant to Rule 920)
Aggregate value of all interested
person transactions conducted
under shareholders’ mandate
pursuant to Rule 920 (excluding
transactions less than $100,000)
Wah Holdings Pte Ltd (1) 182,400 Nil
(1) Mr Wee Kok Wah, Mrs Dawn Wee Wai Ying and Dr Wee Li Ann are directors/shareholders of Wah Holdings
Pte Ltd.
The Company does not have a shareholders’ mandate for interested person transactions pursuant to Rule 920 of the
Listing Manual.
Corporate Governance (Cont’d)
Sta
mfo
rd T
yres
Co
rpo
rati
on
Lim
ited
34
Directors’ Statement
The directors are pleased to present their statement to the members together with the audited consolidated financial
statements of Stamford Tyres Corporation Limited (the “Company”) and its subsidiary companies (collectively, the
“Group”), and the balance sheet and statement of changes in equity of the Company for the financial year ended
30 April 2017.
Opinion of the directors
In the opinion of the directors,
(i) the accompanying balance sheets, consolidated income statement, consolidated statement of comprehensive
income, statements of changes in equity, and consolidated statement of cash flow together with notes thereto
are drawn up so as to give a true and fair view of the financial position of the Group and of the Company as at
30 April 2017 and of the financial performance of the business, changes in equity and cash flows of the Group
and the changes in equity of the Company for the year ended on that date; and
(ii) at the date of this statement, there are reasonable grounds to believe that the Company will be able to pay its
debts as and when they fall due.
Directors
The directors of the Company in office at the date of this statement are:
Sam Chong Keen (Chairman)
Wee Kok Wah (President)
Mrs Dawn Wee Wai Ying (Executive Director)
Tay Puan Siong
Goh Chee Wee
Dr Wee Li Ann
Leslie Mah Kim Loong
Kazumichi Mandai
Directors’ interests in shares and debentures
The following directors, who held office at the end of the financial year had, according to the register of directors’
shareholdings required to be kept under Section 164 of the Singapore Companies Act, Chapter 50, (the “Act”) an
interest in shares and share options of the Company, as stated below:
Direct interest Deemed interest
Name of director At 1.5.2016 At 30.4.2017 At 1.5.2016 At 30.4.2017
Ordinary shares of the Company
Wee Kok Wah 41,954,554 41,954,554 49,551,319 49,551,319
Mrs Dawn Wee Wai Ying 13,637,567 13,637,567 77,868,306 77,868,306
Dr Wee Li Ann 10,000 10,000 10,000 10,000
Leslie Mah Kim Loong – – 1,150,000 1,150,000
Tay Puan Siong 2,500 2,500 2,500 2,500
There was no change in any of the above-mentioned interests in the Company between the end of the financial year
and 21 May 2017.
Sta
mfo
rd T
yres
Co
rpo
rati
on
Lim
ited
35
Directors’ Statement (Cont’d)
Directors’ interests in shares and debentures (cont’d)
By virtue of Section 7 of the Act, Mr Wee Kok Wah and Mrs Dawn Wee Wai Ying are deemed to have an interest in
the ordinary shares of all the subsidiary companies at the beginning and at the end of the financial year.
No other director who held office at the end of the financial year had interests in shares or debentures of the
Company’s subsidiary companies.
Options
No options were issued by the Company or any of its subsidiaries during the financial year. As at 30 April 2017 and
30 April 2016, there were no options in the unissued shares of the Company or any of its subsidiaries which were
outstanding.
Arrangements to enable directors to acquire shares and debentures
Except as disclosed below, neither at the end of nor at any time during the financial year was the Company a party to
any arrangement whose objects are, or one of whose objects is, to enable the directors of the Company to acquire
benefits by means of the acquisition of shares or debentures of the Company or any other body corporate.
Audit Committee
The Audit Committee comprises non-executive and independent directors, Mr Tay Puan Siong (who chairs the Audit
Committee), Mr Sam Chong Keen and Mr Leslie Mah Kim Loong and, non-executive and non-independent director,
Dr Wee Li Ann.
The Committee meets at least 4 times a year and performs its functions in accordance with the Act.
The Committee reviews the overall scope of both internal and external audits and the assistance given by the
Company’s officers to the auditor. It meets with the Company’s internal and external auditors to discuss the results of
their respective examinations and their evaluation of the Group’s system of internal accounting and financial controls.
The Committee also reviews the annual financial statements of the Company and of the Group and the auditor’s
report thereon before submission to the Board, as well as interested person transactions. All major findings and
recommendations are brought to the attention of the Board of Directors.

Sta
mfo
rd T
yres
Co
rpo
rati
on
Lim
ited
36
Auditor
Ernst & Young LLP have expressed their willingness to accept re-appointment as auditor.
On behalf of the Board of Directors,
Wee Kok Wah
Director
Mrs Dawn Wee Wai Ying
Director
28 July 2017
Directors’ Statement (Cont’d)
Sta
mfo
rd T
yres
Co
rpo
rati
on
Lim
ited
37
Report on the Audit of the Financial Statements
Opinion
We have audited the financial statements of Stamford Tyres Corporation Limited (the “Company”) and its subsidiaries
(collectively, the “Group”), which comprise the balance sheets of the Group and the Company as at 30 April 2017,
the statements of changes in equity of the Group and the Company and the consolidated income statement,
consolidated statement of comprehensive income and consolidated cash flow statement of the Group for the year
then ended, and notes to the financial statements, including a summary of significant accounting policies.
In our opinion, the accompanying consolidated financial statements of the Group, the balance sheet and the statement
of changes in equity of the Company are properly drawn up in accordance with the provisions of the Companies Act,
Chapter 50 (the Act) and Financial Reporting Standards in Singapore (FRSs) so as to give a true and fair view of the
consolidated financial position of the Group and the financial position of the Company as at 30 April 2017 and of the
consolidated financial performance, consolidated changes in equity and consolidated cash flows of the Group and
changes in equity of the Company for the year ended on that date.
Basis for Opinion
We conducted our audit in accordance with Singapore Standards on Auditing (SSAs). Our responsibilities under
those standards are further described in the Auditor’s Responsibilities for the Audit of the Financial Statements
section of our report. We are independent of the Group in accordance with the Accounting and Corporate Regulatory
Authority (ACRA) Code of Professional Conduct and Ethics for Public Accountants and Accounting Entities (ACRA
Code) together with the ethical requirements that are relevant to our audit of the financial statements in Singapore,
and we have fulfilled our other ethical responsibilities in accordance with these requirements and the ACRA Code. We
believe that the audit evidence we have obtained is sufficient and appropriate to provide a basis for our opinion.
Key Audit Matters
Key audit matters are those matters that, in our professional judgement, were of most significance in our audit of the
financial statements of the current period. These matters were addressed in the context of our audit of the financial
statements as a whole, and in forming our opinion thereon, and we do not provide a separate opinion on these
matters. For each matter below, our description of how our audit addressed the matter is provided in that context.
We have fulfilled our responsibilities described in the Auditor’s responsibilities for the audit of the financial statements
section of our report, including in relation to these matters. Accordingly, our audit included the performance of
procedures designed to respond to our assessment of the risks of material misstatement of the financial statements.
The results of our audit procedures, including the procedures performed to address the matters below, provide the
basis for our audit opinion on the accompanying financial statements.
Independent Auditor’s ReportFor the year ended 30 April 2017
To the members of Stamford Tyres Corporation Limited

Sta
mfo
rd T
yres
Co
rpo
rati
on
Lim
ited
38
Impairment assessment of investments in subsidiaries, joint ventures and associate
The holding company of the Group has significant investments in subsidiaries, joint ventures and an associate. The
carrying amounts of these investments can be found in Note 13, 14 and 15 to the financial statements respectively.
The financial performance of subsidiaries, joint ventures and associate are dependent on the economic and local
market environment in which they operate in. Management monitors the performance of these entities and an
assessment for impairment is carried out when there are signs of impairment. The impairment assessments involve
the preparation of discounted cash flow forecasts to determine the recoverable amounts of these investments.
Management exercised significant judgement in making assumptions and estimates for the preparation of the
discounted cash flow forecasts. Accordingly, impairment assessment is a key audit matter. The Group’s accounting
policies on impairment of these investments are disclosed in Note 2.9 and 2.10 to the financial statements. The critical
accounting estimates and judgements made in arriving at the assumptions used in the preparation of the discounted
cash flow forecasts by management are stated in Note 3(a)(iii) to the financial statements.
We evaluated management’s future cash flow forecasts and the process by which they were determined and
approved. We tested the robustness of management’s forecast by comparing previous forecasts to actual results.
In addition, we also validated key inputs used in the discounted cash flow forecasts, such as discount rates and
growth rates, to historical data and external market data to assess the reasonableness of management’s forecast.
We assessed management’s sensitivity analysis based on changes to the key assumptions. We also checked the
mathematical accuracy of the underlying calculations.
Finally, we assessed the adequacy of the disclosures on the impairment of investments in subsidiaries, joint ventures
and associate in Notes 13, 14 and 15 to the financial statements, respectively.
Allowance for inventory obsolescence
The Group’s total gross inventories and the related allowance for obsolescence amounted to $88,523,000 and
$10,654,000, respectively, as at 30 April 2017.
The Group’s allowance for inventory obsolescence is subject to changes in the economic and market conditions,
and the corresponding effects on consumer’s spending may result in excess, slow-moving or obsolete inventories
that command selling prices below costs. Significant management judgement is required for the estimation of the
net realisable value (“NRV”) and allowance for inventories’ obsolescence. The estimation is made after taking into
consideration movement in rubber prices, current and expected consumer demand and pricing competition. As such,
we determined that this is a key audit matter. The Group’s principal accounting policy on inventory and the critical
accounting estimates and judgements thereon are disclosed in Note 2.14 and Note 3(a)(ii) to the financial statements
respectively.
As part of our audit, we evaluated the appropriateness of assumptions and estimates made by management in
determining the allowance for inventory obsolescence, including economic and market conditions, expected consumer
demand, and estimation of net realisable value for inventory available for sale. We analysed the aging profile of
inventory disaggregated by type, which are then corroborated with management’s identification and assessment of
allowance for inventory obsolescence. We assessed the determination of net realisable value for selected inventory
samples by comparing them to the unit selling price subsequent to the year end. We subsequently evaluated the
adequacy of management’s write-downs of inventory to lower of cost and NRV. For inventory with negative gross
margins, we assessed if the allowance for these inventories are adequate. Lastly, we assessed the adequacy of the
disclosures related to inventory in Note 16 to the financial statements.
Independent Auditor’s Report (Cont’d)For the year ended 30 April 2017
To the members of Stamford Tyres Corporation Limited

Sta
mfo
rd T
yres
Co
rpo
rati
on
Lim
ited
39
Allowance for doubtful debts
The Group’s total gross trade receivables and its related allowance for doubtful debts amounted to $76,201,000 and
$8,734,000, respectively, as at 30 April 2017.
The collectability of trade receivables is a key element of the Group’s working capital management, and is managed
on an ongoing basis by management. Where collections of outstanding trade receivables are in doubt, management
assesses the recoverability of such amounts and determines the allowance for doubtful debts. Economic
conditions may affect the financial performance and liquidity position of customers which correspondingly affects
the recoverability of trade receivables. Hence, the assessment of allowance of doubtful debts requires significant
judgement. As such, we determined that this is a key audit matter. The Group’s accounting policy on provision
for doubtful debts is disclosed in Note 2.12 to the financial statements and the critical accounting estimates and
judgements are stated in Note 3(a)(iv) to the financial statements.
We evaluated the processes and controls relating to the monitoring of and the impairment policies for uncollectible
trade receivables. We have also evaluated management’s assessment of the recoverability of trade receivables by
reviewing management’s analyses of ageing of receivables, evidence disputes over amounts, and their historical
payment patterns to identify collection risks.
Finally, we assessed the adequacy of the Group’s disclosures on the trade receivables and the related risks such as
credit risk and liquidity risk in Notes 17 and 35 to the financial statements.
Other Information
Management is responsible for the other information. The other information comprises the information included in the
annual report, but does not include the financial statements and our auditor’s report thereon.
Our opinion on the financial statements does not cover the other information and we do not express any form of
assurance conclusion thereon.
In connection with our audit of the financial statements, our responsibility is to read the other information and, in doing
so, consider whether the other information is materially inconsistent with the financial statements or our knowledge
obtained in the audit or otherwise appears to be materially misstated. If, based on the work we have performed, we
conclude that there is a material misstatement of this other information, we are required to report that fact. We have
nothing to report in this regard.
Responsibilities of Management and Directors for the Financial Statements
Management is responsible for the preparation of financial statements that give a true and fair view in accordance with
the provisions of the Act and FRSs, and for devising and maintaining a system of internal accounting controls sufficient
to provide a reasonable assurance that assets are safeguarded against loss from unauthorised use or disposition; and
transactions are properly authorised and that they are recorded as necessary to permit the preparation of true and fair
financial statements and to maintain accountability of assets.
In preparing the financial statements, management is responsible for assessing the Group’s ability to continue as
a going concern, disclosing, as applicable, matters related to going concern and using the going concern basis
of accounting unless management either intends to liquidate the Group or to cease operations, or has no realistic
alternative but to do so.
The directors’ responsibilities include overseeing the Group’s financial reporting process.
Independent Auditor’s Report (Cont’d)For the year ended 30 April 2017
To the members of Stamford Tyres Corporation Limited

Sta
mfo
rd T
yres
Co
rpo
rati
on
Lim
ited
40
Auditor’s Responsibilities for the Audit of the Financial Statements
Our objectives are to obtain reasonable assurance about whether the financial statements as a whole are free from
material misstatement, whether due to fraud or error, and to issue an auditor’s report that includes our opinion.
Reasonable assurance is a high level of assurance, but is not a guarantee that an audit conducted in accordance with
SSAs will always detect a material misstatement when it exists. Misstatements can arise from fraud or error and are
considered material if, individually or in the aggregate, they could reasonably be expected to influence the economic
decisions of users taken on the basis of these financial statements.
As part of an audit in accordance with SSAs, we exercise professional judgment and maintain professional scepticism
throughout the audit. We also:
Identify and assess the risks of material misstatement of the financial statements, whether due to fraud or error,
design and perform audit procedures responsive to those risks, and obtain audit evidence that is sufficient and
appropriate to provide a basis for our opinion. The risk of not detecting a material misstatement resulting from
fraud is higher than for one resulting from error, as fraud may involve collusion, forgery, intentional omissions,
misrepresentations, or the override of internal control.
Obtain an understanding of internal control relevant to the audit in order to design audit procedures that are
appropriate in the circumstances, but not for the purpose of expressing an opinion on the effectiveness of the
Group’s internal control.
Evaluate the appropriateness of accounting policies used and the reasonableness of accounting estimates and
related disclosures made by management.
Conclude on the appropriateness of management’s use of the going concern basis of accounting and, based
on the audit evidence obtained, whether a material uncertainty exists related to events or conditions that may
cast significant doubt on the Group’s ability to continue as a going concern. If we conclude that a material
uncertainty exists, we are required to draw attention in our auditor’s report to the related disclosures in the
financial statements or, if such disclosures are inadequate, to modify our opinion. Our conclusions are based
on the audit evidence obtained up to the date of our auditor’s report. However, future events or conditions may
cause the Group to cease to continue as a going concern.
Evaluate the overall presentation, structure and content of the financial statements, including the disclosures,
and whether the financial statements represent the underlying transactions and events in a manner that
achieves fair presentation.
Obtain sufficient appropriate audit evidence regarding the financial information of the entities or business
activities within the Group to express an opinion on the consolidated financial statements. We are responsible
for the direction, supervision and performance of the group audit. We remain solely responsible for our audit
opinion.
Independent Auditor’s Report (Cont’d)For the year ended 30 April 2017
To the members of Stamford Tyres Corporation Limited
Sta
mfo
rd T
yres
Co
rpo
rati
on
Lim
ited
41
Auditor’s Responsibilities for the Audit of the Financial Statements (cont’d)
We communicate with the directors regarding, among other matters, the planned scope and timing of the audit and
significant audit findings, including any significant deficiencies in internal control that we identify during our audit.
We also provide the directors with a statement that we have complied with relevant ethical requirements regarding
independence, and to communicate with them all relationships and other matters that may reasonably be thought to
bear on our independence, and where applicable, related safeguards.
From the matters communicated with the directors, we determine those matters that were of most significance in
the audit of the financial statements of the current period and are therefore the key audit matters. We describe these
matters in our auditor’s report unless law or regulation precludes public disclosure about the matter or when, in
extremely rare circumstances, we determine that a matter should not be communicated in our report because the
adverse consequences of doing so would reasonably be expected to outweigh the public interest benefits of such
communication.
Report on Other Legal and Regulatory Requirements
In our opinion, the accounting and other records required by the Act to be kept by the Company and by those
subsidiary corporations incorporated in Singapore of which we are the auditors have been properly kept in accordance
with the provisions of the Act.
The engagement partner on the audit resulting in this independent auditor’s report is Vincent Toong.
_________________________
Ernst & Young LLP
Public Accountants and
Chartered Accountants
Singapore
28 July 2017
Independent Auditor’s Report (Cont’d)For the year ended 30 April 2017
To the members of Stamford Tyres Corporation Limited

Sta
mfo
rd T
yres
Co
rpo
rati
on
Lim
ited
42
Note 2017 2016
$’000 $’000
Revenue 4 235,803 239,878
Other revenue 5 2,864 2,333
Total revenue 238,667 242,211
Less: Costs and expenditure
Cost of goods sold 6 173,974 180,747
Salaries and employees benefits 7 23,673 23,307
Marketing and distribution 7,114 7,739
Utilities, repairs and maintenance 6,040 5,723
Finance costs 8 4,461 5,449
Depreciation of property, plant and equipment 4,946 5,116
Operating lease rentals 4,753 4,494
Other operating expenses 5,390 6,418
Total expenditure (230,351) (238,993)
Share of results of joint ventures 14 2,614 1,767
Profit before taxation 9 10,930 4,985
Taxation 10 (2,818) (2,398)
Profit for the financial year 8,112 2,587
Attributable to:
Equity holders of the Company 8,112 2,587
Earnings per share:
- basic and diluted (cents) 11 3.44 1.10
The accompanying accounting policies and explanatory notes form an integral part of the financial statements.
Consolidated Income StatementFor the year ended 30 April 2017
(In Singapore Dollar)
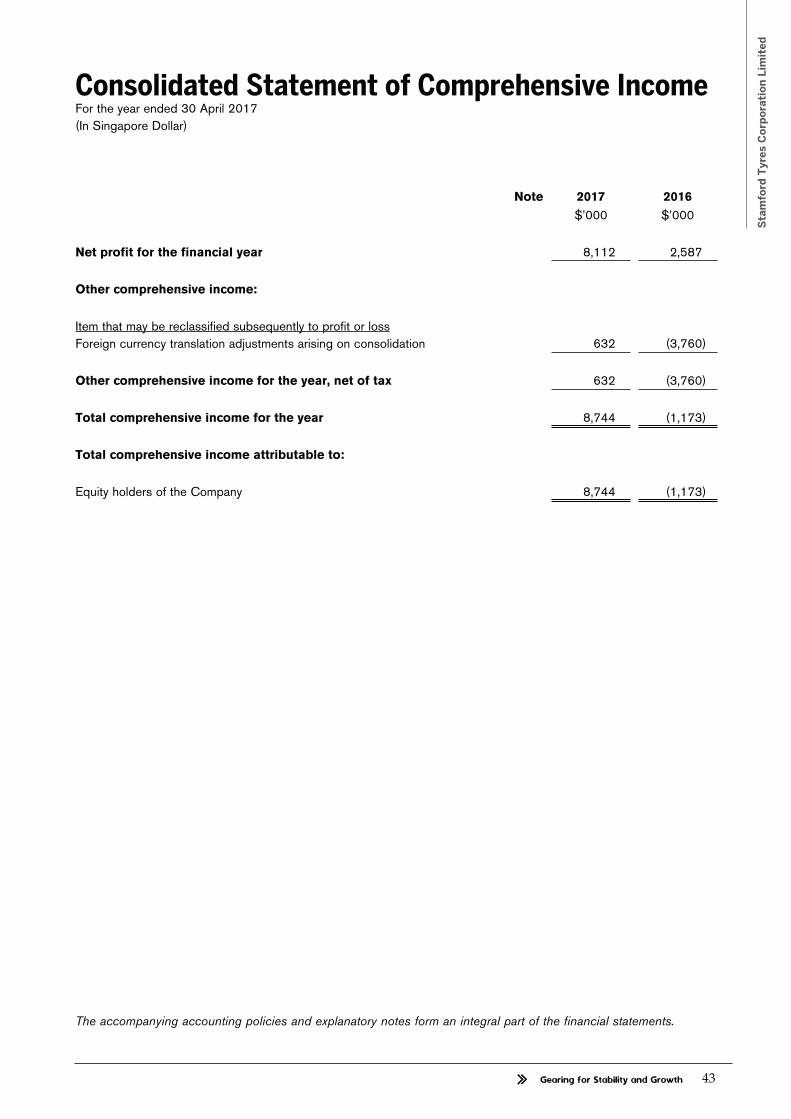
Sta
mfo
rd T
yres
Co
rpo
rati
on
Lim
ited
43
Note 2017 2016
$’000 $’000
Net profit for the financial year 8,112 2,587
Other comprehensive income:
Item that may be reclassified subsequently to profit or loss
Foreign currency translation adjustments arising on consolidation 632 (3,760)
Other comprehensive income for the year, net of tax 632 (3,760)
Total comprehensive income for the year 8,744 (1,173)
Total comprehensive income attributable to:
Equity holders of the Company 8,744 (1,173)
The accompanying accounting policies and explanatory notes form an integral part of the financial statements.
Consolidated Statement of Comprehensive IncomeFor the year ended 30 April 2017
(In Singapore Dollar)

Sta
mfo
rd T
yres
Co
rpo
rati
on
Lim
ited
44
Group Company
Note 2017 2016 2017 2016
$’000 $’000 $’000 $’000
Non-current assets
Property, plant and equipment 12 70,679 70,625 – –
Subsidiary companies 13 – – 40,764 40,789
Amounts due from subsidiary companies 13 – – 14,311 14,259
Joint venture companies 14 16,862 14,299 6,567 6,567
Associated company 15 233 233 – –
Deferred tax assets 28 3,109 2,468 – –
90,883 87,625 61,642 61,615
Current assets
Inventories 16 77,869 85,020 – –
Trade receivables 17 67,467 67,618 – –
Derivatives 18 70 66 54 –
Other receivables 19 4,665 4,232 96 94
Prepayments and advances 19 3,890 2,975 21 21
Cash and cash equivalents 20 21,693 17,425 1,225 373
175,654 177,336 1,396 488
Less: Current liabilities
Trade payables 21 20,465 17,184 – –
Trust receipts (secured) 22 50,808 49,686 – –
Derivatives 18 20 96 – 39
Other payables 23 18,711 16,396 605 711
Loans (secured) 24 17,980 10,570 – –
Hire-purchase liabilities 25 807 878 – –
Provisions 26 689 639 – –
Provision for taxation 2,742 1,871 12 22
112,222 97,320 617 772
Net current assets/(liabilities) 63,432 80,016 779 (284)
Non-current liabilities
Amounts due to subsidiary companies 13 – – 14,219 11,341
Hire-purchase liabilities 25 882 1,323 – –
Provisions 26 861 820 – –
Long-term loans (secured) 27 27,375 47,066 – –
Deferred tax liabilities 28 1,304 927 108 108
30,422 50,136 14,327 11,449
123,893 117,505 48,094 49,882
Equity
Share capital 29 35,722 35,722 35,722 35,722
Reserves 30 88,171 81,783 12,372 14,160
123,893 117,505 48,094 49,882
The accompanying accounting policies and explanatory notes form an integral part of the financial statements.
Balance SheetsAs at 30 April 2017
(In Singapore Dollar)

Sta
mfo
rd T
yres
Co
rpo
rati
on
Lim
ited
45
Note
Equity,
total
$’000
Equity
attributable
to owners
of the
Company,
total
$’000
Share
capital
$’000
Revenue
reserve
$’000
Other
reserves,
total
$’000
Capital
reserve
$’000
Employee
share
option
reserve
$’000
Foreign
currency
translation
reserve
$’000
Discount on
acquisition
of non-
controlling
interest
$’000
Group
Balance at 1 May 2015 121,034 121,034 35,722 98,501 (13,189) 424 254 (14,069) 202
Profit for the financial year 2,587 2,587 – 2,587 – – – – –
Other comprehensive income
for the financial year (3,760) (3,760) – – (3,760) – – (3,760) –
Total comprehensive income
for the financial year (1,173) (1,173) – 2,587 (3,760) – – (3,760) –
Contributions by and
distributions to owners
Forfeiture of employee share
options – – – 254 (254) – (254) – –
Dividend on ordinary shares 31 (2,356) (2,356) – (2,356) – – – – –
Total contributions by and
distributions to owners (2,356) (2,356) – (2,102) (254) – (254) – –
Balance at 30 April 2016 and
1 May 2016 117,505 117,505 35,722 98,986 (17,203) 424 – (17,829) 202
Profit for the financial year 8,112 8,112 – 8,112 – – – – –
Other comprehensive income
for the financial year 632 632 – – 632 – – 632 –
Total comprehensive income
for the financial year 8,744 8,744 – 8,112 632 – – 632 –
Contributions by and
distributions to owners
Dividend on ordinary shares 31 (2,356) (2,356) – (2,356) – – – – –
Total contributions by and
distributions to owners (2,356) (2,356) – (2,356) – – – – –
Balance at 30 April 2017 123,893 123,893 35,722 104,742 (16,571) 424 – (17,197) 202
The details of the nature of the reserves are set out in Note 30.
The accompanying accounting policies and explanatory notes form an integral part of the financial statements.
Statements of Changes in EquityFor the year ended 30 April 2017
(In Singapore Dollar)
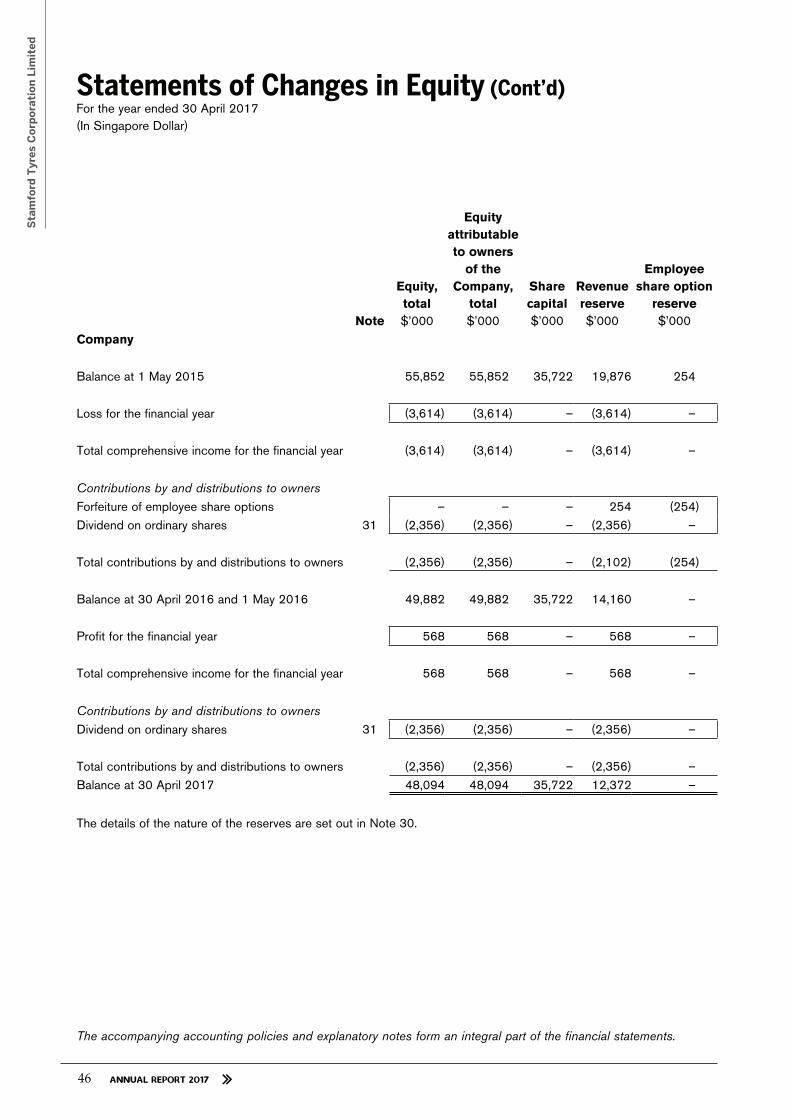
Sta
mfo
rd T
yres
Co
rpo
rati
on
Lim
ited
46
Note
Equity,
total
$’000
Equity
attributable
to owners
of the
Company,
total
$’000
Share
capital
$’000
Revenue
reserve
$’000
Employee
share option
reserve
$’000
Company
Balance at 1 May 2015 55,852 55,852 35,722 19,876 254
Loss for the financial year (3,614) (3,614) – (3,614) –
Total comprehensive income for the financial year (3,614) (3,614) – (3,614) –
Contributions by and distributions to owners
Forfeiture of employee share options – – – 254 (254)
Dividend on ordinary shares 31 (2,356) (2,356) – (2,356) –
Total contributions by and distributions to owners (2,356) (2,356) – (2,102) (254)
Balance at 30 April 2016 and 1 May 2016 49,882 49,882 35,722 14,160 –
Profit for the financial year 568 568 – 568 –
Total comprehensive income for the financial year 568 568 – 568 –
Contributions by and distributions to owners
Dividend on ordinary shares 31 (2,356) (2,356) – (2,356) –
Total contributions by and distributions to owners (2,356) (2,356) – (2,356) –
Balance at 30 April 2017 48,094 48,094 35,722 12,372 –
The details of the nature of the reserves are set out in Note 30.
The accompanying accounting policies and explanatory notes form an integral part of the financial statements.
Statements of Changes in Equity (Cont’d)For the year ended 30 April 2017
(In Singapore Dollar)
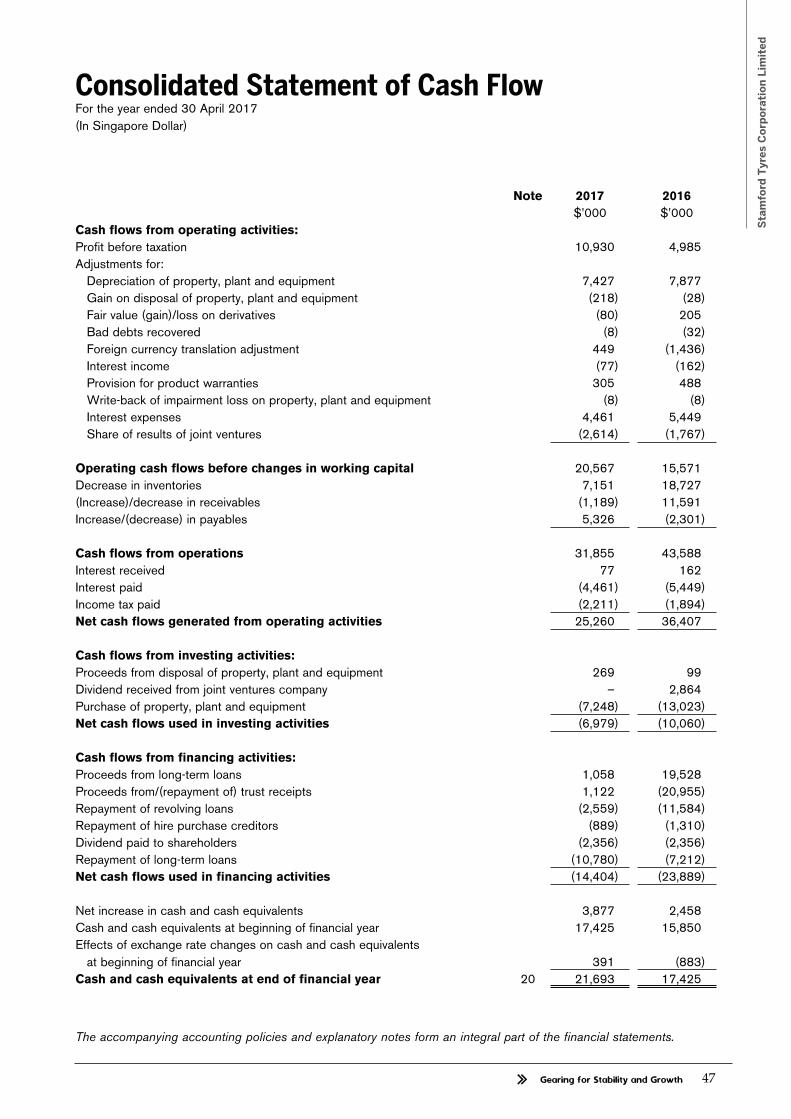
Sta
mfo
rd T
yres
Co
rpo
rati
on
Lim
ited
47
Note 2017 2016
$’000 $’000
Cash flows from operating activities:
Profit before taxation 10,930 4,985
Adjustments for:
Depreciation of property, plant and equipment 7,427 7,877
Gain on disposal of property, plant and equipment (218) (28)
Fair value (gain)/loss on derivatives (80) 205
Bad debts recovered (8) (32)
Foreign currency translation adjustment 449 (1,436)
Interest income (77) (162)
Provision for product warranties 305 488
Write-back of impairment loss on property, plant and equipment (8) (8)
Interest expenses 4,461 5,449
Share of results of joint ventures (2,614) (1,767)
Operating cash flows before changes in working capital 20,567 15,571
Decrease in inventories 7,151 18,727
(Increase)/decrease in receivables (1,189) 11,591
Increase/(decrease) in payables 5,326 (2,301)
Cash flows from operations 31,855 43,588
Interest received 77 162
Interest paid (4,461) (5,449)
Income tax paid (2,211) (1,894)
Net cash flows generated from operating activities 25,260 36,407
Cash flows from investing activities:
Proceeds from disposal of property, plant and equipment 269 99
Dividend received from joint ventures company – 2,864
Purchase of property, plant and equipment (7,248) (13,023)
Net cash flows used in investing activities (6,979) (10,060)
Cash flows from financing activities:
Proceeds from long-term loans 1,058 19,528
Proceeds from/(repayment of) trust receipts 1,122 (20,955)
Repayment of revolving loans (2,559) (11,584)
Repayment of hire purchase creditors (889) (1,310)
Dividend paid to shareholders (2,356) (2,356)
Repayment of long-term loans (10,780) (7,212)
Net cash flows used in financing activities (14,404) (23,889)
Net increase in cash and cash equivalents 3,877 2,458
Cash and cash equivalents at beginning of financial year 17,425 15,850
Effects of exchange rate changes on cash and cash equivalents
at beginning of financial year 391 (883)
Cash and cash equivalents at end of financial year 20 21,693 17,425
The accompanying accounting policies and explanatory notes form an integral part of the financial statements.
Consolidated Statement of Cash FlowFor the year ended 30 April 2017
(In Singapore Dollar)
Sta
mfo
rd T
yres
Co
rpo
rati
on
Lim
ited
48
1. Corporation information
Stamford Tyres Corporation Limited is a limited liability company incorporated and domiciled in Singapore and
is listed on the Singapore Exchange Securities Trading Limited (SGX-ST).
Its registered office and principal place of business is at 19 Lok Yang Way, Singapore 628635.
The principal activity of the Company is that of an investment holding company and the principal activities
of the subsidiary companies consist of the wholesale and retail of tyres and wheels, design and contract
manufacturing of tyres for proprietary brands, tyre retreading, equipment trading, servicing of motor vehicles,
and manufacturing and sale of aluminium alloy wheels.
2. Summary of significant accounting policies
2.1 Basis of preparation
The consolidated financial statements of the Group, and the balance sheet and statement of changes in equity
of the Company have been prepared in accordance with Singapore Financial Reporting Standards (“FRS”).
The financial statements have been prepared on a historical cost basis except for certain financial instruments
and financial assets that have been measured at their fair values.
The financial statements are presented in Singapore Dollar ($) and all values are rounded to the nearest
thousand ($’000) except when otherwise indicated.
The Accounting Standards Council announced on 29 May 2014 that Singapore incorporated companies listed
in the Singapore Exchange will apply a new financial reporting framework identical to the International Financial
Reporting Standards. The Group will adopt the new financial reporting framework with effect from 1 May 2018.
2.2 Changes in accounting policies
The accounting policies adopted are consistent with those of the previous financial year except in the current
financial year, the Group has adopted all the new and revised standards which are effective for annual financial
periods beginning on or after 1 May 2016. The adoption of these standards did not have any effect on the
financial performance or position of the Group and the Company.
Notes to the Financial StatementsFor the financial year ended 30 April 2017
(In Singapore Dollar)
Sta
mfo
rd T
yres
Co
rpo
rati
on
Lim
ited
49
2. Summary of significant accounting policies (cont’d)
2.3 Standards issued but not yet effective
The Group has not adopted the following standards applicable to the Group that have been issued but not yet
effective:
Description
Effective for annual
periods beginning
on or after
Amendments to FRS 7 Disclosure Initiative 1 January 2017
Amendments to FRS 12 Recognition of Deferred Tax Assets for Unrealised Losses 1 January 2017
Amendments to FRS 112 Classifications of the Scope of the Standard 1 January 2017
Improvements to FRSs (December 2016)
(a) Amendments to FRS 28 Measuring an Associate or Joint Venture at fair value 1 January 2018
(b) Amendments to FRS 40 Transfers of Investment Property 1 January 2018
(c) Amendments to FRS 102 Classification and Measurement of Share-based
Payment Transactions 1 January 2018
(d) Amendments to FRS 104 Applying FRS 109 Financial Instruments with FRS 104
Insurance Contracts 1 January 2018
FRS 109 Financial Instruments 1 January 2018
FRS 115 Revenue from Contracts with Customers 1 January 2018
INT FRS 122 Foreign Currency Transactions and Advance Consideration 1 January 2018
FRS 116 Leases 1 January 2019
Amendments to FRS 110 & FRS 28 Sale or Contribution of Assets between an Investor
and its Associate or Joint Venture To be determined
Except for FRS 115, FRS 109 and FRS 116, the directors expect that the adoption of the other standards
above will have no material impact on the financial statements in the period of initial application. The nature of
the impending changes in accounting policy on adoption of FRS 115, FRS 109 and FRS 116 are described
below.
FRS 115 Revenue from Contracts with Customers
FRS 115 establishes a five-step model that will apply to revenue arising from contracts with customers. Under
FRS 115, revenue is recognised at an amount that reflects the consideration which an entity expects to be
entitled in exchange for transferring goods or services to a customer.
The new revenue standard will supersede all current revenue recognition requirements under FRS. Either a full
retrospective application or a modified retrospective application is required for annual periods beginning on or
after 1 January 2018. Early adoption is permitted.
Notes to the Financial Statements (Cont’d)For the financial year ended 30 April 2017
(In Singapore Dollar)

Sta
mfo
rd T
yres
Co
rpo
rati
on
Lim
ited
Notes to the Financial Statements (Cont’d)For the financial year ended 30 April 2017
(In Singapore Dollar)
50
2. Summary of significant accounting policies (cont’d)
2.3 Standards issued but not yet effective (cont’d)
FRS 115 Revenue from Contracts with Customers (cont’d)
During the year, the Group performed a preliminary assessment of FRS 115 which is subject to changes arising
from a more detailed ongoing analysis. The Group expects the following impact upon adoption of FRS 115:
(a) Variable consideration
Some contracts with customers provide a right of return, trade discounts or volume rebates. Currently,
the Group recognises revenue from the sale of goods measured at the fair value of the consideration
received or receivable, net of returns and allowance, trade discounts and volume rebates. If revenue
cannot be reliably measured, the Group defers revenue recognition until the uncertainty is resolved.
Such provisions give rise to variable consideration under FRS 115, and will be required to be estimated
at contract inception. FRS 115 requires the estimated variable consideration to be constrained to
prevent over-recognition of revenue. The Group continues to assess individual contracts to determine
the estimated variable consideration and related constraint. The Group expects that application of the
constraint may result in more revenue being deferred than is under current FRS.
Transition
The following practical expedients are available when applying FRS 115 retrospectively.
- For completed contracts, an entity need not restate contracts that begin and end with the same annual
reporting period or are completed contracts at the beginning of the earliest period presented.
- For completed contracts that have variable consideration, an entity may use the transaction price at
the date the contract was completed rather than estimating the variable consideration amounts in the
comparative reporting periods; and
- For contracts that were modified before the beginning of the earliest period presented, an entity need
not retrospectively restate the contract for those contract modifications. Instead, an entity shall reflect
the aggregate effect of all of the modifications that occur before the beginning of the earliest period
presented when:
identifying the satisfied and unsatisfied performance obligations;
determining the transaction price; and
allocating the transaction price to the satisfied and unsatisfied performance obligations.
Sta
mfo
rd T
yres
Co
rpo
rati
on
Lim
ited
Notes to the Financial Statements (Cont’d)For the financial year ended 30 April 2017
(In Singapore Dollar)
51
2. Summary of significant accounting policies (cont’d)
2.3 Standards issued but not yet effective (cont’d)
FRS 115 Revenue from Contracts with Customers (cont’d)
- For all reporting periods presented before the date of initial application, an entity need not disclose the
amount of the transaction price allocated to the remaining performance obligations and an explanation of
when the entity expects to recognise that amount as revenue.
The Group plans to adopt the new standard on the required effective date using either the full or modified
retrospective method and apply all the practical expedients available under FRS 115 as listed above.
FRS 109 Financial Instruments
FRS 109 introduces new requirements for classification and measurement of financial assets, impairment of
financial assets and hedge accounting. Financial assets are classified according to their contractual cash flow
characteristics and the business model under which they are held. The impairment requirements in FRS 109
are based on an expected credit loss model and replace the FRS 39 incurred loss model.
Impairment
FRS 109 requires the Group to record expected credit losses on all of its debt securities, loans and trade
receivables, either on a 12-month or lifetime basis. The Group expects to apply the simplified approach and
record lifetime expected losses on all trade receivables. Upon application of the expected credit loss model, the
Group expects a significant impact on its equity due to unsecured nature of its loans and receivables, but it will
need to perform a more detailed analysis which considers all reasonable and supportable information, including
forward-looking elements to determine the extent of impact.
Transition
The Group plans to adopt the new standard on the required effective date without restating prior periods’
information and recognises any difference between the previous carrying amount and the carrying amount at
the beginning of the annual reporting period at the date of initial application in the opening retained earnings.
FRS 116 Leases
FRS 116 requires lessees to recognise most leases on balance sheets to reflect the rights to use the leased
assets and the associated obligations for lease payments as well as the corresponding interest expense and
depreciation charges. The standard includes two recognition exemption for lessees – leases of ‘low value’ assets
and short-term leases. The new standard is effective for annual periods beginning on or after 1 January 2019.
The Group is currently assessing the impact of the new standard and plans to adopt the new standard on the
required effective date. The Group expects the adoption of the new standard will result in increase in total assets
and total liabilities, earnings before interest, taxes, depreciation and amortization (EBITDA) and gearing ratio.

Sta
mfo
rd T
yres
Co
rpo
rati
on
Lim
ited
Notes to the Financial Statements (Cont’d)For the financial year ended 30 April 2017
(In Singapore Dollar)
52
2. Summary of significant accounting policies (cont’d)
2.4 Basis of consolidation and business combinations
(a) Basis of consolidation
The consolidated financial statements comprise the financial statements of the Company and its
subsidiaries as at the end of the reporting period. The financial statements of the subsidiaries used
in the preparation of the consolidated financial statements are prepared for the same reporting date
as the Company. Consistent accounting policies are applied to like transactions and events in similar
circumstances.
All intra-group balances, income and expenses and unrealised gains and losses resulting from intra-
group transactions and dividends are eliminated in full.
Subsidiaries are consolidated from the date of acquisition, being the date on which the Group obtains
control, and continue to be consolidated until the date that such control ceases.
Losses within a subsidiary are attributed to the non-controlling interest even if that results in a deficit
balance.
A change in the ownership interest of a subsidiary, without a loss of control, is accounted for as an
equity transaction. If the Group loses control over a subsidiary, it:
- De-recognises the assets (including goodwill) and liabilities of the subsidiary at their carrying
amounts at the date when control is lost;
- De-recognises the carrying amount of any non-controlling interest;
- De-recognises the cumulative translation differences recorded in equity;
- Recognises the fair value of the consideration received;
- Recognises the fair value of any investment retained;
- Recognises any surplus or deficit in profit or loss;
- Re-classifies the Group’s share of components previously recognised in other comprehensive
income to profit or loss or retained earnings, as appropriate.
(b) Business combinations and goodwill
Business combinations are accounted for by applying the acquisition method. Identifiable assets
acquired and liabilities assumed in a business combination are measured initially at their fair values at the
acquisition date. Acquisition-related costs are recognised as expenses in the periods in which the costs
are incurred and the services are received.
Any contingent consideration to be transferred by the acquirer will be recognised at fair value at the
acquisition date. Subsequent changes to the fair value of the contingent consideration which is deemed
to be an asset or liability, will be recognised in profit or loss.

Sta
mfo
rd T
yres
Co
rpo
rati
on
Lim
ited
Notes to the Financial Statements (Cont’d)For the financial year ended 30 April 2017
(In Singapore Dollar)
53
2. Summary of significant accounting policies (cont’d)
2.4 Basis of consolidation and business combinations (cont’d)
(b) Business combinations and goodwill (cont’d)
The Group elects for each individual business combination, whether non-controlling interest in the
acquiree (if any), that are present ownership interests and entitle their holders to a proportionate share
of net assets in the event of liquidation, is recognised on the acquisition date at fair value, or at the non-
controlling interest’s proportionate share of the acquiree’s identifiable net assets. Other components of
non-controlling interests are measured at their acquisition date fair value, unless another measurement
basis is required by another FRS.
Any excess of the sum of the fair value of the consideration transferred in the business combination, the
amount of non-controlling interest in the acquiree (if any), and the fair value of the Group’s previously
held equity interest in the acquiree (if any), over the net fair value of the acquiree’s identifiable assets
and liabilities is recorded as goodwill. In instances where the latter amount exceeds the former, the
excess is recognised as gain on bargain purchase in profit or loss on the acquisition date.
Goodwill is initially measured at cost. Following initial recognition, goodwill is measured at cost less any
accumulated impairment losses.
For the purpose of impairment testing, goodwill acquired in a business combination is, from the
acquisition date, allocated to the Group’s cash-generating units that are expected to benefit from the
synergies of the combination, irrespective of whether other assets or liabilities of the acquiree are
assigned to those units.
The cash-generating units to which goodwill have been allocated is tested for impairment annually and
whenever there is an indication that the cash-generating unit may be impaired. Impairment is determined
for goodwill by assessing the recoverable amount of each cash-generating unit (or group of cash-
generating units) to which the goodwill relates.
2.5 Transactions with non-controlling interest
Non-controlling interest represents the equity in subsidiaries not attributable, directly or indirectly, to owners of
the Company, and are presented separately in the consolidated statement of comprehensive income and within
equity in the consolidated balance sheet, separately from equity attributable to owners of the Company.
Changes in the Company owners’ ownership interest in a subsidiary that do not result in a loss of control
are accounted for as equity transactions. In such circumstances, the carrying amounts of the controlling and
non-controlling interests are adjusted to reflect the changes in their relative interests in the subsidiary. Any
difference between the amount by which the non-controlling interest is adjusted and the fair value of the
consideration paid or received is recognised directly in equity and attributed to owners of the Company.

Sta
mfo
rd T
yres
Co
rpo
rati
on
Lim
ited
Notes to the Financial Statements (Cont’d)For the financial year ended 30 April 2017
(In Singapore Dollar)
54
2. Summary of significant accounting policies (cont’d)
2.6 Foreign currency
The Group’s consolidated financial statements are presented in Singapore Dollar, which is also the Company’s
functional currency. Each entity in the Group determines its own functional currency and items included in the
financial statements of each entity are measured using that functional currency.
(a) Transactions and balances
Transactions in foreign currencies are measured in the respective functional currencies of the Company
and its subsidiaries and are recorded on initial recognition in the functional currencies at exchange
rates approximating those ruling at the transaction dates. Monetary assets and liabilities denominated
in foreign currencies are translated at the rate of exchange ruling at the end of each reporting period.
Non-monetary items that are measured in terms of historical cost in a foreign currency are translated
using the exchange rates as at the dates of the initial transactions. Non-monetary items measured at fair
value in a foreign currency are translated using the exchange rates at the date when the fair value was
determined.
Exchange differences arising on monetary items that for part of the Group’s net investment in foreign
operations are recognised initially in other comprehensive income and accumulated under foreign
currency translation reserve in equity. The foreign currency translation reserve is reclassified from equity
to profit or loss of the Group on disposal of the foreign operation.
(b) Consolidated financial statements
For consolidation purpose, the assets and liabilities of foreign operations are translated into SGD at
the rate of exchange ruling at the end of the reporting period and their profit or loss are translated at
the exchange rates prevailing at the date of the transactions. The exchange differences arising on the
translation are recognised in other comprehensive income. On disposal of a foreign operation, the
component of other comprehensive income relating to that particular foreign operation is recognised in
profit or loss.
In the case of a partial disposal without loss of control of a subsidiary that includes a foreign operation,
the proportionate share of the cumulative amount of the exchange differences are re-attributed to non-
controlling interest and are not recognised in profit or loss. For partial disposals of associates or jointly
controlled entities that are foreign operations, the proportionate share of the accumulated exchange
differences is reclassified to profit or loss.
2.7 Property, plant and equipment
All items of property, plant and equipment are initially recorded at cost and subsequently measured at cost
less accumulated depreciation and accumulated impairment losses. The cost includes the cost of replacing
part of the property, plant and equipment and borrowing costs that are directly attributable to the acquisition,
construction or production of a qualifying property, plant and equipment. The accounting policy for borrowing
costs is set out in Note 2.18.
The cost of an item of property, plant and equipment is recognised as an asset if, and only if, it is probable that
future economic benefits associated with the item will flow to the Group and the cost can be measured reliably.

Sta
mfo
rd T
yres
Co
rpo
rati
on
Lim
ited
Notes to the Financial Statements (Cont’d)For the financial year ended 30 April 2017
(In Singapore Dollar)
55
2. Summary of significant accounting policies (cont’d)
2.7 Property, plant and equipment (cont’d)
The initial cost of property, plant and equipment comprises its net purchase price after deducting for any trade
discount and rebates, including import duties and non-refundable purchase taxes, any directly attributable costs
of bringing the asset to its working condition and location for its intended use. The costs of dismantling and
removing the item and restoring the site on which it is located, the obligation for which an entity incurs either
when the item is acquired or as a consequence of having used the item during a particular period of purposes
other than to produce inventories during that period are capitalised. Expenditure incurred after the property,
plant and equipment have been put into operation, such as repairs and maintenance and overhaul costs, is
normally charged to profit or loss in the period in which the costs are incurred.
In situations where it can be clearly demonstrated that the expenditure has resulted in an increase in the future
economic benefits expected to be obtained from the use of an item of property, plant and equipment beyond
its originally assessed standard of performance, the expenditure is capitalised as an additional cost of property,
plant and equipment.
Depreciation is calculated so as to write off the cost of the assets on a straight line basis over the estimated
useful lives of the assets concerned. The principal rates used for this purpose are:
Leasehold land and buildings – over their lease period, ranging from 1.7% to 5.6% per annum
Leasehold improvements – 5% to 10% per annum
Motor vehicles – 20% per annum
Plant and equipment – 10% to 20% per annum
Computer hardware and software – 33 % per annum
Furniture and fittings – 10% per annum
Freehold land has an unlimited useful life and is therefore not depreciated. No depreciation is provided for
construction-in-progress until it is completed and available for use.
Depreciation expense is charged in profit or loss up to the month of disposal or write-off. Fully depreciated
assets are retained in the financial statements until they are no longer in use.
The carrying values of property, plant and equipment are reviewed for impairment when events or changes in
circumstances indicate that the carrying value may not be recoverable.
The residual value, useful life and depreciation method are reviewed at the end of each financial year-end, and
adjusted prospectively, if appropriate.
An item of property, plant and equipment is derecognised upon disposal or when no future economic benefits
are expected from its use or disposal. Any gain or loss arising on de-recognition of the asset is included in
profit or loss in the year the asset is derecognised.

Sta
mfo
rd T
yres
Co
rpo
rati
on
Lim
ited
Notes to the Financial Statements (Cont’d)For the financial year ended 30 April 2017
(In Singapore Dollar)
56
2. Summary of significant accounting policies (cont’d)
2.8 Impairment of non-financial assets
The Group assesses at each reporting date whether there is an indication that an asset may be impaired. If any
such indication exists, or when annual impairment testing for an asset is required, the Group makes an estimate
of the asset’s recoverable amount.
An asset’s recoverable amount is the higher of an asset’s or cash-generating unit’s fair value less costs of
disposal and its value in use and is determined for an individual asset, unless the asset does not generate cash
inflows that are largely independent of those from other assets or group of assets. Where the carrying amount
of an asset or cash-generating unit exceeds its recoverable amount, the asset is considered impaired and is
written down to its recoverable amount.
Impairment losses of continuing operations are recognised in profit or loss, except for assets that are previously
revalued where the revaluation was taken to other comprehensive income. In this case, the impairment is also
recognised in other comprehensive income up to the amount of any previous revaluation.
A previously recognised impairment loss is reversed only if there has been a change in the estimates used to
determine the asset’s recoverable amount since the last impairment loss was recognised. If that is the case, the
carrying amount of the asset is increased to its recoverable amount. That increase cannot exceed the carrying
amount that would have been determined, net of depreciation, had no impairment loss been recognised
previously. Such reversal is recognised in profit or loss unless the asset is measured at revalued amount, in
which case the reversal is treated as a revaluation increase.
2.9 Subsidiaries
A subsidiary is an investee that is controlled by the Group. The Group controls an investee when it is exposed,
or has rights, to variable returns from its involvement with the investee and has the ability to affect those returns
through its power over the investee.
In the Company’s separate financial statements, investments in subsidiary companies are accounted for at cost
less any impairment losses. Details of the subsidiary companies are set out in Note 40.
2.10 Joint ventures and associate
An associate is an entity over which the Group has the power to participate in the financial and operating
policy decisions of the investee but does not have control or joint control of those policies. A joint venture
is a contractual arrangement whereby two or more parties undertake an economic activity that is subject to
joint control, where the strategic financial and operating decisions relating to the activity require the unanimous
consent of the parties sharing control.
The Group account for its investments in associate and joint ventures using the equity method from the date on
which it becomes an associate or joint venture.
On acquisition of the investment, any excess of the cost of the investment over the Group’s share of the net fair
value of the investee’s identifiable assets and liabilities is accounted as goodwill and is included in the carrying
amount of the investment. Any excess of the Group’s share of the net fair value of the investee’s identifiable
assets and liabilities over the cost of the investment is included as income in the determination of the entity’s
share of the associate or joint venture’s profit or loss in the period in which the investment is acquired.
Sta
mfo
rd T
yres
Co
rpo
rati
on
Lim
ited
Notes to the Financial Statements (Cont’d)For the financial year ended 30 April 2017
(In Singapore Dollar)
57
2. Summary of significant accounting policies (cont’d)
2.10 Joint ventures and associate (cont’d)
Under the equity method, the investment in associate or joint ventures are carried in the balance sheet at cost
plus post-acquisition changes in the Group’s share of net assets of the associate or joint ventures. The profit
or loss reflects the share of results of the operations of the associate or joint ventures. Distributions received
from joint ventures or associate reduce the carrying amount of the investment. Where there has been a change
recognised in other comprehensive income by the associate or joint venture, the Group recognises its share of
such changes in other comprehensive income. Unrealised gains and losses resulting from transactions between
the Group and associate or joint venture are eliminated to the extent of the interest in the associate or joint
venture.
When the Group’s share of losses in an associate or joint venture equals or exceeds its interest in the
associate or joint venture, the Group does not recognise further losses, unless it has incurred obligations or
made payments on behalf of the associate or joint venture.
After application of the equity method, the Group determines whether it is necessary to recognise an additional
impairment loss on the Group’s investment in associate or joint venture. The Group determines at the end
of each reporting period whether there is any objective evidence that the investment in the associate or
joint venture is impaired. If this is the case, the Group calculates the amount of impairment as the difference
between the recoverable amount of the associate or joint venture and its carrying value and recognises the
amount in profit or loss.
The most recent available audited financial statements of the associated companies or joint ventures are
used by the Group in applying the equity method. Where the dates of the audited financial statements used
are not co-terminous with those of the Group, the share of results is arrived at from the last audited financial
statements available and unaudited management financial statements to the end of the accounting period.
Consistent accounting policies are applied for like transactions and events in similar circumstances.
Upon loss of significant influence over the associate or joint venture, the Group measures and recognises
the retained investment at its fair value. Any difference between the carrying amount of the associate or joint
venture upon loss of significant influence and the fair value of the aggregate of the retained investment and
proceeds from disposal is recognised in profit or loss.
If the Group’s ownership interest in an associate or joint venture is reduced, but the Group continues to apply
the equity method, the Group reclassifies to profit or loss the proportion of the gain or loss that had previously
been recognised in other comprehensive income relating to that reduction in ownership interest if that gain or
loss would be required to be reclassified to profit or loss on the disposal of the related assets or liabilities.
In the Company’s separate financial statements, investments in associated companies or joint ventures are
accounted for at cost less impairment losses. Details of the associated company and joint ventures are set out
in Note 40.

Sta
mfo
rd T
yres
Co
rpo
rati
on
Lim
ited
Notes to the Financial Statements (Cont’d)For the financial year ended 30 April 2017
(In Singapore Dollar)
58
2. Summary of significant accounting policies (cont’d)
2.11 Financial instruments
(a) Financial assets
Initial recognition and measurement
Financial assets are recognised when, and only when, the Group becomes a party to the contractual
provisions of the financial instrument. The Group determines the classification of its financial assets at
initial recognition.
When financial assets are recognised initially, they are measured at fair value, plus, in the case of
financial assets not at fair value through profit or loss, directly attributable transaction costs.
Subsequent measurement
The subsequent measurement of financial assets depends on their classification as follows:
(i) Financial assets at fair value through profit or loss
Financial assets at fair value through profit or loss include financial assets held for trading and
financial assets designated upon initial recognition at fair value through profit or loss. Financial
assets are classified as held for trading if they are acquired for the purpose of selling or
repurchasing in the near term. This category includes derivative financial instruments entered into
by the Group. Derivatives, including separated embedded derivatives are also classified as held
for trading.
The Group has not designated any financial assets upon initial recognition at fair value through
profit or loss.
Subsequent to initial recognition, financial assets at fair value through profit or loss are measured
at fair value. Any gains or losses arising from changes in fair value of the financial assets are
recognised in profit or loss. Net gains or net losses on financial assets at fair value through profit
or loss include exchange differences, interest and dividend income.
Derivatives embedded in host contracts are accounted for as separate derivatives and recorded
at fair value if their economic characteristics and risks are not closely related to those of the
host contracts and the host contracts are not measured at fair value with changes in fair value
recognised in profit or loss. These embedded derivatives are measured at fair value with changes
in fair value recognised in profit or loss. Reassessment only occurs if there is a change in the
terms of the contract that significantly modifies the cash flows that would otherwise be required.
Sta
mfo
rd T
yres
Co
rpo
rati
on
Lim
ited
Notes to the Financial Statements (Cont’d)For the financial year ended 30 April 2017
(In Singapore Dollar)
59
2. Summary of significant accounting policies (cont’d)
2.11 Financial instruments (cont’d)
(a) Financial assets (cont’d)
Subsequent measurement (cont’d)
(ii) Loans and receivables
Non-derivative financial assets with fixed or determinable payments that are not quoted in an
active market are classified as loans and receivables. Subsequent to initial recognition, loans
and receivables are measured at amortised cost using the effective interest method, less
impairment. Gains and losses are recognised in profit or loss when the loans and receivables are
derecognised or impaired, and through the amortisation process.
The Group classifies the following financial assets as loans and receivables:
cash and cash equivalents;
trade and other receivables, amounts due from subsidiary companies.
De-recognition
A financial asset is derecognised where the contractual right to receive cash flows from the asset has
expired. On de-recognition of a financial asset in its entirety, the difference between the carrying amount
and the sum of the consideration received and any cumulative gain or loss that had been recognised in
other comprehensive income is recognised in profit or loss.
Regular way purchases and sales
All regular way purchases and sales of financial assets are recognised or derecognised on the trade
date i.e., the date that the Group commits to purchase or sell the asset. Regular way purchases or
sales are purchases or sales of financial assets that require delivery of assets within the period generally
established by regulation or convention in the marketplace concerned.
(b) Financial liabilities
Initial recognition and measurement
Financial liabilities are recognised when, and only when, the Group becomes a party to the contractual
provisions of the financial instrument. The Group determines the classification of its financial liabilities at
initial recognition.
All financial liabilities are recognised initially at fair value plus in the case of financial liabilities not at fair
value through profit or loss, directly attributable transaction costs.

Sta
mfo
rd T
yres
Co
rpo
rati
on
Lim
ited
Notes to the Financial Statements (Cont’d)For the financial year ended 30 April 2017
(In Singapore Dollar)
60
2. Summary of significant accounting policies (cont’d)
2.11 Financial instruments (cont’d)
(b) Financial liabilities (cont’d)
Subsequent measurement
The measurement of financial liabilities depends on their classification as follows:
(i) Financial liabilities at fair value through profit or loss
Financial liabilities at fair value through profit or loss include financial liabilities held for trading.
Financial liabilities are classified as held for trading if they are acquired for the purpose of selling
in the near term. This category includes derivative financial instruments entered into by the Group
that are not designated as hedging instruments in hedge relationships. Separated embedded
derivatives are also classified as held for trading unless they are designated as effective hedging
instruments.
Subsequent to initial recognition, financial liabilities at fair value through profit or loss are
measured at fair value. Any gains or losses arising from changes in fair value of the financial
liabilities are recognised in profit or loss. Net gains or net losses on financial assets at fair value
through profit or loss include exchange differences, interest and dividend income.
The Group has not designated any financial liabilities upon initial recognition at fair value through
profit or loss.
(ii) Financial liabilities at amortised cost
After initial recognition, other financial liabilities are subsequently measured at amortised cost
using the effective interest rate method. Gains and losses are recognised in profit or loss when
the liabilities are derecognised, and through the amortisation process.
De-recognition
A financial liability is derecognised when the obligation under the liability is discharged or cancelled or
expires. When an existing financial liability is replaced by another from the same lender on substantially
different terms, or the terms of an existing liability are substantially modified, such an exchange or
modification is treated as a de-recognition of the original liability and the recognition of a new liability,
and the difference in the respective carrying amounts is recognised in profit or loss.

Sta
mfo
rd T
yres
Co
rpo
rati
on
Lim
ited
Notes to the Financial Statements (Cont’d)For the financial year ended 30 April 2017
(In Singapore Dollar)
61
2. Summary of significant accounting policies (cont’d)
2.12 Impairment of financial assets
The Group assesses at the end of each reporting period whether there is any objective evidence that a financial
asset is impaired.
(a) Financial assets carried at amortised cost
For financial assets carried at amortised cost, the Group first assesses whether objective evidence
of impairment exists individually for financial assets that are individually significant, or collectively for
financial assets that are not individually significant. If the Group determines that no objective evidence
of impairment exists for an individually assessed financial asset, whether significant or not, it includes the
asset in a group of financial assets with similar credit risk characteristics and collectively assesses them
for impairment. Assets that are individually assessed for impairment and for which an impairment loss is,
or continues to be recognised are not included in a collective assessment of impairment.
If there is objective evidence that an impairment loss on financial assets carried at amortised cost
has been incurred, the amount of the loss is measured as the difference between the asset’s carrying
amount and the present value of estimated future cash flows discounted at the financial asset’s
original effective interest rate. If a loan has a variable interest rate, the discount rate for measuring any
impairment loss is the current effective interest rate. The carrying amount of the asset is reduced through
the use of an allowance account. The impairment loss is recognised in profit or loss.
When the asset becomes uncollectible, the carrying amount of impaired financial assets is reduced
directly or if an amount was charged to the allowance account, the amounts charged to the allowance
account are written off against the carrying value of the financial asset.
To determine whether there is objective evidence that an impairment loss on financial assets has
incurred, the Group considers factors such as the probability of insolvency or significant financial
difficulties of the debtor and default or significant delay in payments.
If in a subsequent period, the amount of the impairment loss decreases and the decrease can be
related objectively to an event occurring after the impairment was recognised, the previously recognised
impairment loss is reversed to the extent that the carrying amount of the asset does not exceed its
amortised cost at the reversal date. The amount of reversal is recognised in profit or loss.
(b) Financial assets carried at cost
If there is objective evidence (such as significant adverse changes in the business environment where
the issuer operates, probability of insolvency or significant financial difficulties of the issuer) that
an impairment loss on financial assets carried at cost has been incurred, the amount of the loss is
measured as the difference between the asset’s carrying amount and the present value of estimated
future cash flows discounted at the current market rate of return for a similar financial asset. Such
impairment losses are not reversed in subsequent periods.

Sta
mfo
rd T
yres
Co
rpo
rati
on
Lim
ited
Notes to the Financial Statements (Cont’d)For the financial year ended 30 April 2017
(In Singapore Dollar)
62
2. Summary of significant accounting policies (cont’d)
2.13 Cash and cash equivalents
Cash and cash equivalents comprise cash at bank and on hand, demand deposits, and short-term, highly liquid
investments that are readily convertible to known amount of cash and which are subject to an insignificant
risk of changes in value. These also include bank overdrafts that form an integral part of the Group’s cash
management.
2.14 Inventories
Inventories are stated at the lower of cost and net realisable value. Cost is determined on a weighted average
cost method and includes all costs in bringing the inventories to their present location and condition. In the
case of manufactured and retread products, and work-in-progress, cost includes all direct expenditure and
production overheads based on normal operating capacity. Net realisable value is the price at which the
inventories can be realised in the normal course of business after allowing for the costs of realisation and,
where appropriate, the cost of conversion from the existing state to a finished condition.
An allowance is made where necessary for obsolete, slow moving and defective inventories.
2.15 Provisions
Provisions are recognised when the Group has a present obligation (legal or constructive) as a result of a past
event, it is probable that an outflow of resources embodying economic benefits will be required to settle the
obligation and the amount of the obligation can be estimated reliably.
Provisions are reviewed at the end of each reporting period and adjusted to reflect the current best estimate.
If it is no longer probable that an outflow of economic resources will be required to settle the obligation, the
provision is reversed. If the effect of the time value of money is material, provisions are discounted using a
current pre-tax rate that reflects, where appropriate, the risks specific to the liability. When discounting is used,
the increase in the provision due to the passage of time is recognised as a finance cost.
2.16 Government grants
Government grants are recognised at their fair value where there is reasonable assurance that the grant will be
received and all attaching conditions will be complied with. Grants in respect of specific expenses are taken to
profit or loss in the same year as the relevant expenses.
2.17 Financial guarantees
A financial guarantee contract is a contract that requires the issuer to make specified payments to reimburse
the holder for a loss it incurs because a specified debtor fails to make payment when due in accordance with
the terms of a debt instrument.
Financial guarantees are recognised initially as a liability at fair value, adjusted for transaction costs that are
directly attributable to the issuance of the guarantee. Subsequent to initial recognition, financial guarantees are
recognised as income in profit or loss over the period of the guarantee. If it is probable that the liability will be
higher than the amount initially recognised less amortisation, the liability is recorded at the higher amount with
the difference charged to profit or loss.

Sta
mfo
rd T
yres
Co
rpo
rati
on
Lim
ited
Notes to the Financial Statements (Cont’d)For the financial year ended 30 April 2017
(In Singapore Dollar)
63
2. Summary of significant accounting policies (cont’d)
2.18 Borrowing costs
Borrowing costs are capitalised as part of the cost of a qualifying asset if they are directly attributable to the
acquisition, construction or production of that asset. Capitalisation of borrowing costs commences when the
activities to prepare the asset for its intended use or sale are in progress and the expenditures and borrowing
costs are incurred. Borrowing costs are capitalised until the assets are substantially completed for their
intended use or sale. All other borrowing costs are expensed in the period they occur. Borrowing costs consist
of interest and other costs that an entity incurs in connection with the borrowing of funds.
2.19 Employee benefits
(a) Defined contribution plans
The Group participates in the national pension schemes as defined by the laws of the countries in
which it has operations. In particular, the Singapore companies in the Group make contributions to the
Central Provident Fund scheme in Singapore, a defined contribution pension scheme. Contributions to
defined contribution schemes are recognised as an expense in the period in which the related service is
performed.
(b) Employee leave entitlement
Employee entitlements to annual leave are recognised as a liability when they accrue to employees.
The estimated liability for leave is recognised for services rendered by employees up to the end of each
reporting period.
(c) Executives’ Share Option Scheme
The Company had in place the STC Share Option Scheme 2001 (the “Scheme”) for the granting of
share options to eligible employees of the Group to subscribe for ordinary shares in the Company,
whereby employees render services as consideration for share options (“equity-settled transactions”).
The cost of equity-settled transactions with employees was measured by reference to the fair value at
the date on which the share options are granted. In valuing the share options, no account was taken
of any performance conditions, other than conditions linked to the price of the shares of the Company
(‘market conditions’), if applicable.
The cost of equity-settled transactions was recognised in profit or loss with a corresponding increase in
the employee share option reserve, over the period in which the performance and/or service conditions
were fulfilled, ending on the date on which the relevant employees became fully entitled to the award
(‘the vesting date’). The cumulative expense recognised for equity-settled transactions at each reporting
date until the vesting date reflects the extent to which the vesting period had expired and the Group’s
best estimate of the number of share options that would ultimately vest. The charge or credit to profit or
loss for a period represents the movement in cumulative expense recognised as at the beginning and
end of that period and was recognised in the employee benefits expense.

Sta
mfo
rd T
yres
Co
rpo
rati
on
Lim
ited
Notes to the Financial Statements (Cont’d)For the financial year ended 30 April 2017
(In Singapore Dollar)
64
2. Summary of significant accounting policies (cont’d)
2.19 Employee benefits (cont’d)
(c) Executives’ Share Option Scheme (cont’d)
No expense was recognised for options that do not ultimately vest, except for option where vesting
was conditional upon a market condition, which were treated as vested irrespective of whether or not
the market condition was satisfied, provided that all other performance and/or service conditions were
satisfied.
Where the terms of an equity-settled transaction award were modified, the minimum expense recognised
was the expense as if the terms had not been modified, if the original terms of the award are met. An
additional expense was recognised for any modification that increased the total fair value of the share-
based payment transaction, or was otherwise beneficial to the employee as measured at the date of
modification.
Where an equity-settled transaction award was cancelled, it was treated as if it had vested on the date
of cancellation, and any expense that otherwise would have been recognised for services received over
the remaining vesting period was recognised immediately. However, if a new award was substituted
for the cancelled award, and designated as a replacement award on the date that it is granted, the
cancelled and new awards were treated as if they were a modification of the original award, as
described in the previous paragraph.
2.20 Hire-purchases
Hire-purchases, which effectively transfer to the Group substantially all the risks and benefits incidental
to ownership of the hire-purchase item, are capitalised at the present value of the minimum hire-purchase
payments at the inception of the hire-purchase term. Any initial direct costs are also added to the amount
capitalised. Hire-purchase payments are apportioned between the finance charges and reduction of the hire-
purchase liability so as to achieve a constant rate of interest on the remaining balance of the liability. Finance
charges are charged directly to profit or loss. Depreciation on the relevant assets is charged to profit or loss on
the basis outlined in Note 2.7.
2.21 Operating leases
As lessee
Leases where substantially all the risks and benefits of ownership of the lease effectively remain with the lessor
are classified as operating leases.
Operating lease payments are recognised as an expense in profit or loss on a straight line basis over the lease
term. The aggregate benefit of incentives provided by the lessor is recognised as a reduction of rental expense
over the lease term on a straight line basis.

Sta
mfo
rd T
yres
Co
rpo
rati
on
Lim
ited
Notes to the Financial Statements (Cont’d)For the financial year ended 30 April 2017
(In Singapore Dollar)
65
2. Summary of significant accounting policies (cont’d)
2.21 Operating leases (cont’d)
As lessor
Leases in which the Group does not transfer substantially all the risks and rewards of ownership of the asset
are classified as operating leases. Initial direct costs incurred in negotiating an operating lease are added to the
carrying amount of the leased asset and recognised over the lease term on the same bases as rental income.
The accounting policy for rental income is set out in Note 2.22(g). Contingent rents are recognised as revenue
in the period in which they are earned.
2.22 Revenue recognition
Revenue is recognised to the extent that it is probable that the economic benefits will flow to the Group and
the revenue can be reliably measured regardless of when the payment is made. Revenue is measured at the fair
value of consideration received or receivable, taking into account contractually defined terms of payment and
excluding goods and services tax, and sales return.
(a) Sale of goods
Revenue from sale of goods is recognised upon the transfer of significant risks and rewards of
ownership of the goods to the customer, usually on delivery of goods. Revenue is not recognised to
the extent where there are significant uncertainties regarding the recovery of the consideration due,
associated costs or the possible return of goods.
(b) Rendering of services
Revenue from the rendering of services is recognised when the services have been performed.
(c) Volume rebates
Volume rebates from suppliers for purchases made during the financial year is deducted from the cost of
inventory if the goods remain unsold at the end of the reporting period or credited against cost of goods
sold in profit or loss if the goods have been sold at the end of the reporting period.
(d) Advertising and promotional rebates
Advertising and promotional rebates from suppliers are recognised as follows:
those that are determined based on the amount of purchases made during the financial year are
credited against marketing and promotion expenses in profit or loss; and
those that are reimbursed at the discretion of the suppliers are credited against marketing and
promotion expenses in profit or loss when these are received.

Sta
mfo
rd T
yres
Co
rpo
rati
on
Lim
ited
Notes to the Financial Statements (Cont’d)For the financial year ended 30 April 2017
(In Singapore Dollar)
66
2. Summary of significant accounting policies (cont’d)
2.22 Revenue recognition (cont’d)
(e) Dividend income
Dividend income is recognised when the Group’s right to receive payments is established.
(f) Interest income
Interest income is recognised using the effective interest method.
(g) Rental income
Rental income arising from operating leases is accounted for on a straight-line basis over the lease
terms. The aggregate costs of incentives provided to lessees are recognised as a reduction of rental
income over the lease term on a straight-line basis.
2.23 Taxes
(a) Current income tax
Current income tax assets and liabilities for the current and prior periods are measured at the amount
expected to be recovered from or paid to the taxation authorities. The tax rates and tax laws used to
compute the amount are those that are enacted or substantively enacted at the end of the reporting
period, in the countries where the Group operates and generates taxable income.
Current income taxes are recognised in profit or loss except to the extent that the tax relates to
items recognised outside profit or loss, either in other comprehensive income or directly in equity.
Management periodically evaluates positions taken in the tax returns with respect to situations in which
applicable tax regulations are subject to interpretation and establishes provisions where appropriate.
(b) Deferred tax
Deferred tax is provided using the liability method on temporary differences at the end of each reporting
period between the tax bases of assets and liabilities and their carrying amounts for financial reporting
purposes.
Deferred tax liabilities are recognised for all taxable temporary differences, except:
Where the deferred tax liability arises from the initial recognition of goodwill or of an asset or
liability in a transaction that is not a business combination and, at the time of the transaction,
affects neither the accounting profit nor taxable profit or loss; and
In respect of taxable temporary differences associated with investments in subsidiaries, associate
and interests in joint ventures, where the timing of the reversal of the temporary differences can
be controlled and it is probable that the temporary differences will not reverse in the foreseeable
future.

Sta
mfo
rd T
yres
Co
rpo
rati
on
Lim
ited
Notes to the Financial Statements (Cont’d)For the financial year ended 30 April 2017
(In Singapore Dollar)
67
2. Summary of significant accounting policies (cont’d)
2.23 Taxes (cont’d)
(b) Deferred tax (cont'd)
Deferred tax assets are recognised for all deductible temporary differences, carry-forward of unused tax
credits and unused tax losses, to the extent that it is probable that taxable profit will be available against
which the deductible temporary differences, and the carry forward of unused tax credits and unused tax
losses can be utilised except:
Where the deferred tax asset relating to the deductible temporary difference arises from the initial
recognition of an asset or liability in a transaction that is not a business combination and, at the
time of the transaction, affects neither the accounting profit nor taxable profit or loss; and
In respect of deductible temporary differences associated with investments in subsidiaries,
associate and interests in joint ventures, deferred tax assets are recognised only to the extent
that it is probable that the temporary differences will reverse in the foreseeable future and taxable
profit will be available against which the temporary differences can be utilised.
The carrying amount of deferred tax assets is reviewed at the end of each reporting period and reduced
to the extent that it is no longer probable that sufficient taxable profit will be available to allow all or part
of the deferred tax asset to be utilised. Unrecognised deferred tax assets are reassessed at the end of
each reporting period and are recognised to the extent that it has become probable that future taxable
profit will allow the deferred tax asset to be recovered.
Deferred tax assets and liabilities are measured at the tax rates that are expected to apply in the year
when the asset is realised or the liability is settled, based on tax rates (and tax laws) that have been
enacted or substantively enacted at the end of each reporting period.
Deferred tax relating to items recognised outside profit or loss is recognised outside profit or
loss. Deferred tax items are recognised in correlation to the underlying transaction either in other
comprehensive income or directly in equity and deferred tax arising from a business combination is
adjusted against goodwill on acquisition.
(c) Sales tax
Revenue, expenses and assets are recognised net of the amount of sales tax except:
Where the sales tax incurred on a purchase of assets or services is not recoverable from the
taxation authority, in which case the sales tax is recognised as part of the cost of acquisition of
the asset or as part of the expense item as applicable; and
Receivables and payables that are stated with the amount of sales tax included.
The net amount of sales tax recoverable from, or payable to, the taxation authority is included as part of
receivables or payables in the balance sheet.
Sta
mfo
rd T
yres
Co
rpo
rati
on
Lim
ited
Notes to the Financial Statements (Cont’d)For the financial year ended 30 April 2017
(In Singapore Dollar)
68
2. Summary of significant accounting policies (cont’d)
2.24 Derivative financial instruments
The Group uses derivative financial instruments, such as forward currency contracts and interest rate swaps, to
manage its risks associated with foreign currency and interest rate fluctuations.
A derivative financial instrument is initially recognised at its fair value on the date the contract is entered into
and is subsequently carried at its fair value. The method of recognising the resulting gain or loss depends on
whether the derivative is designated as a hedging instrument, and if so, the nature of the item being hedged.
For purpose of hedge accounting, hedges are classified as cash flow hedges when hedging the exposure
to variability in cash flows that is attributable to a particular risk associated with a highly probable forecast
transaction.
The Group documents at the inception of the transaction the relationship between the hedging instruments
and hedged items, as well as its risk management objective and strategies for undertaking various hedge
transactions. The Group also documents its assessment, both at hedge inception and on an ongoing basis,
of whether the derivatives designated as hedging instruments are highly effective in offsetting changes in cash
flows of the hedged items.
(a) Cash flow hedge
The fair value changes on the effective portion of derivatives that are designated and qualify as cash
flow hedges are recognised in the fair value reserve within equity and transferred to profit or loss in the
periods when the hedged items affect profit or loss. The fair value changes relating to the ineffective
portion are recognised immediately in profit or loss.
(b) Derivatives that do not qualify for hedge accounting
Fair value changes on these derivatives are recognised in profit or loss when the changes arise.
The fair value of forward currency contracts is calculated by reference to current forward exchange rates for
contracts with similar maturity profiles. The fair value of interest rate swap contracts is determined by reference
to market values for similar instruments.
2.25 Segment reporting
For management purposes, the Group is organised into operating segments based on their regions which are
independently managed by the respective segment managers responsible for the performance of the respective
segments under their charge. The segment managers report directly to the management of the Company who
regularly review the segment results in order to allocate resources to the segments and to assess the segment
performance. Additional disclosures on each of these segments are shown in Note 39, including the factors
used to identify the reportable segments and the measurement basis of segment information.

Sta
mfo
rd T
yres
Co
rpo
rati
on
Lim
ited
Notes to the Financial Statements (Cont’d)For the financial year ended 30 April 2017
(In Singapore Dollar)
69
2. Summary of significant accounting policies (cont’d)
2.26 Share capital and share issuance expenses
Proceeds from issuance of ordinary shares are recognised as share capital in equity. Incremental costs directly
attributable to the issuance of ordinary shares are deducted against share capital.
2.27 Dividends
Interim dividends are recorded in the financial year in which they are declared payable. Final dividends are
recorded in the financial year in which the dividends are approved by the shareholders.
2.28 Contingencies
A contingent liability is:
(a) a possible obligation that arises from past events and whose existence will be confirmed only by the
occurrence or non-occurrence of one or more uncertain future events not wholly within the control of the
Group; or
(b) a present obligation that arises from past events but is not recognised because:
(i) It is not probable that an outflow of resources embodying economic benefits will be required to
settle the obligation; or
(ii) The amount of the obligation cannot be measured with sufficient reliability.
A contingent asset is a possible asset that arises from past events and whose existence will be confirmed only
by the occurrence or non-occurrence of one or more uncertain future events not wholly within the control of the
Group.
Contingent liabilities and assets are not recognised on the balance sheet of the Group, except for contingent
liabilities assumed in a business combination that are present obligations and which the fair values can be
reliably determined.
3. Significant accounting estimates and judgements
The preparation of the Group’s financial statements requires management to make judgements, estimates and
assumptions that affect the reported amounts of revenues, expenses, assets and liabilities, and the disclosure
of contingent liabilities at the end of reporting period. However, uncertainty about these assumptions and
estimates could result in outcomes that could require a material adjustment to the carrying amount of the asset
or liability affected in the future.

Sta
mfo
rd T
yres
Co
rpo
rati
on
Lim
ited
Notes to the Financial Statements (Cont’d)For the financial year ended 30 April 2017
(In Singapore Dollar)
70
3. Significant accounting estimates and judgements (cont’d)
(a) Key sources of estimation uncertainty
The key assumptions concerning the future and other key sources of estimation uncertainty at the end
of each reporting period, that have a significant risk of causing a material adjustment to the carrying
amounts of assets and liabilities within the next financial year are discussed below. The Group based
its assumptions and estimates on parameters available when the financial statements was prepared.
Existing circumstances and assumptions about future developments, however, may change due to
market changes or circumstances arising beyond the control of the Group. Such changes are reflected
in the assumptions when they occur.
(i) Useful lives of leasehold improvement, motor vehicle and plant and equipment
The cost of plant and equipment is depreciated on a straight-line basis over their respective
estimated economic useful lives. Management estimates the useful lives of these leasehold
improvement, motor vehicle plant and equipment to be within 3 to 20 years. The carrying
amount of the Group’s total major vehicle and plant and equipment as at 30 April 2017 was
$20,115,000 (2016: $19,439,000). Changes in the expected level of usage, technological
developments as well as consumer preferences could impact the economic useful lives and the
residual values of these assets, therefore future depreciation charges could be revised and could
have an impact on the profit in future years.
(ii) Allowance for inventories’ obsolescence
Allowance for inventories’ obsolescence is estimated based on the best available facts and
circumstances at the end of each reporting period, including but not limited to, the inventories’
own physical conditions, their expected market selling prices, estimated costs of completion
and estimated costs to be incurred for their sales. The allowance is re-evaluated and adjusted
as additional information received affects the amount estimated. The carrying amount of the
inventories as at 30 April 2017 is $77,869,000 (2016: $85,020,000).
(iii) Impairment of non-financial assets
An impairment exists when the carrying value of an asset or cash generating unit exceeds its
recoverable amount, which is the higher of its fair value less costs to sell and its value in use. The
fair value less costs to sell calculation is based on available data from binding sales transactions
in an arm’s length transaction of similar assets or observable market prices less incremental
costs for disposing the asset. The value in use calculation is based on a discounted cash flow
model. The cash flows are derived from the budget for the next five years and do not include
restructuring activities that the Group is not yet committed to or significant future investments that
will enhance the asset’s performance of the cash generating unit being tested. The recoverable
amount is most sensitive to the discount rate used for the discounted cash flow model as well as
the expected future cash inflows and the growth rate used for extrapolation purposes.

Sta
mfo
rd T
yres
Co
rpo
rati
on
Lim
ited
Notes to the Financial Statements (Cont’d)For the financial year ended 30 April 2017
(In Singapore Dollar)
71
3. Significant accounting estimates and judgements (cont’d)
(a) Key sources of estimation uncertainty (cont’d)
(iv) Allowance for doubtful debts
The Group evaluates specific accounts where it has information that certain customers are unable
to meet their financial obligations. In those cases, the Group uses judgement, based on the best
available facts and circumstances at the end of each reporting period, including but not limited
to, the length of its relationship with the customer and the customer’s current credit status based
on third party credit reports and known market factors, to record specific allowance against
amount due from such customers to reduce its receivables to the amount the Group expects
to collect. These specific allowances are re-evaluated and adjusted as additional information
received affects the amounts of allowance for doubtful debts. The carrying amount of the
Group’s trade receivables after allowance for doubtful debts as at 30 April 2017 is $67,467,000
(2016: $67,618,000).
(b) Critical judgements made in applying accounting policies
In the process of applying the Group’s accounting policies, management has made the following
judgements, apart from those involving estimations, which has the most significant effect on the amounts
recognised in the financial statements:
(i) Income taxes
Significant judgement is involved in determining the Group-wide provision for income taxes. There
are certain transactions and computations for which the ultimate tax determination is uncertain
during the ordinary course of business. The Group recognises liabilities for expected tax issues
based on estimates of whether additional taxes will be due. Where the final tax outcome of these
matters is different from the amounts that were initially recognised, such differences will impact
the income tax and deferred tax provisions in the period in which such determination is made.
The carrying amount of the Group’s provision for taxation, deferred tax assets and deferred
tax liabilities at 30 April 2017 were $2,742,000 (2016: $1,871,000), $3,109,000 (2016:
$2,468,000) and $1,304,000 (2016: $927,000) respectively.
(ii) Impairment of financial assets
The Group follows the guidance FRS 39 in determining when a financial asset is other-than-
temporarily impaired. This determination requires significant judgement. The Group evaluates,
among other factors, the duration and extent to which the fair value of a financial asset is less
than its cost, and the financial health of and near-term business outlook for the financial asset,
including factors such as industry performance, changes in technology and operational and
financing cash flow. Further details of the impairment of financial assets are given in Notes 17
and 19 to the financial statements.

Sta
mfo
rd T
yres
Co
rpo
rati
on
Lim
ited
Notes to the Financial Statements (Cont’d)For the financial year ended 30 April 2017
(In Singapore Dollar)
72
3. Significant accounting estimates and judgements (cont’d)
(b) Critical judgements made in applying accounting policies (cont’d)
(iii) Determination of functional currency
The Group measures foreign currency transactions in the respective functional currencies
of the Company and its subsidiaries. In determining the functional currencies of the entities in
the Group, judgment is required to determine the currency that mainly influences sales prices
for goods and services and of the country whose competitive forces and regulations mainly
determines the sales prices of its goods and services. The functional currencies of the entities in
the Group are determined based on management’s assessment of the economic environment in
which the entities operate and the entities’ process of determining sales prices.
4. Revenue
Group
2017 2016
$’000 $’000
Tyres and wheels:
- Wholesale and distribution 189,616 191,998
- Retail and fleet 46,187 47,880
235,803 239,878
5. Other revenue
Group
2017 2016
$’000 $’000
Interest income from bank deposits 77 162
Sundry income 2,694 2,016
Government grants in respect of Jobs Credit Scheme 93 155
2,864 2,333

Sta
mfo
rd T
yres
Co
rpo
rati
on
Lim
ited
Notes to the Financial Statements (Cont’d)For the financial year ended 30 April 2017
(In Singapore Dollar)
73
6. Cost of goods sold
Group
2017 2016
$’000 $’000
Inventories recognised as an expense in cost of goods sold 168,224 174,497
7. Salaries and employee benefits
Group
2017 2016
$’000 $’000
Employee benefits expenses (including executive directors):
Salaries, wages and bonuses 21,367 21,174
Contributions to defined contribution plans 1,170 1,226
Others 4,405 4,396
26,942 26,796
Employee benefits are included in the following line items in profit or loss:
- Cost of goods sold 3,269 3,489
- Salaries and employee benefits 23,673 23,307
26,942 26,796
Employee share option scheme
The Group had a STC Share Option Scheme 2001 (the “Scheme”) which allowed the Company to grant share
options to eligible employees to acquire shares in the Company.
The Scheme was open to full-time confirmed employees, executive and non-executive directors, but not
controlling shareholders or their associates of the Company, and entitled the option holders to exercise their
options and subscribe for new ordinary shares in the Company either at the market price or at a price set at a
discount not exceeding 20% of the market price. Market price was equal to the average last dealt price of the
share for 3 consecutive trading days immediately preceding the offer date. Options granted with the exercise
price set at market price were exercisable after the third anniversary of the offer date. Executive options granted
under the Scheme were exercisable for a period of 10 years whereas non-executive options were exercisable
for a period of 5 years. The share options under the Scheme were exercisable after a vesting period of 3 years.
All share options have expired on 16 August 2015.
The total number of shares in respect of which options may be offered on any offering date, when added to
the number of shares issued or issuable in respect of option under the Scheme should not exceed 15% of the
issued share capital of the Company on the day preceding that offering date.

Sta
mfo
rd T
yres
Co
rpo
rati
on
Lim
ited
Notes to the Financial Statements (Cont’d)For the financial year ended 30 April 2017
(In Singapore Dollar)
74
7. Salaries and employee benefits (cont’d)
Employee share option scheme (cont’d)
Information with respect to the total number of outstanding options granted under the Scheme is as follows:
Group
2017 2016
Number of
options
Weighted
average
exercise
price in the
financial year
Number of
options
Weighted
average
exercise
price in the
financial year
($) ($)
Outstanding at beginning of year – – 750,000 0.430
Forfeited during the year – – (750,000) 0.430
Exercised during the year – – – 0.430
Outstanding at end of year – – – 0.430
Exercisable at end of year – – – 0.430
No share option expense was recorded in 2016 and 2017 as the share options were granted and vested in
prior years. When granted, the share option expense was computed based on the fair value of share options, as
at the date of grant estimated by an external valuer using the binomial model, taking into account the terms and
conditions upon which the options were granted. The fair value of options granted was $0.31 per option. The
inputs to the model used are shown below:
Date of option granted 23 June 2001
Dividend yield (%) 4.000
Expected volatility (%) 107.750
Historical volatility (%) 107.750
Risk free interest rate (%) 2.820
Expected life of option (years) 10.000
Weighted average share price ($) 0.486
The expected life of the options was based on historical data and is not necessarily indicative of exercise
patterns that may occur. The expected volatility reflects the assumption that the historical volatility is indicative
of future trends, which may also not necessarily be the actual outcome. No other features of option grant were
incorporated into the measurement at fair value.

Sta
mfo
rd T
yres
Co
rpo
rati
on
Lim
ited
Notes to the Financial Statements (Cont’d)For the financial year ended 30 April 2017
(In Singapore Dollar)
75
8. Finance costs
Group
2017 2016
$’000 $’000
Interest expense on:
- Bank overdrafts, trust receipts and hire-purchase liabilities 2,632 2,963
- Bank loans 1,829 2,486
4,461 5,449
9. Profit before taxation
Profit before taxation is stated after charging/(crediting):
Group
2017 2016
$’000 $’000
Depreciation of property, plant and equipment (inclusive of charges included in
cost of goods sold) 7,427 7,877
Foreign exchange loss 68 1,076
Allowance for/(write-back of) inventory obsolescence 491 (533)
Fair value (gain)/loss on derivatives (80) 205
Gain on disposal of property, plant and equipment (218) (28)
Bad debts recovered (8) (32)
Allowance for doubtful trade receivables 1,812 1,903
Audit fees:
- Auditors of the Company 496 437
- Other auditors 146 185
There are no non-audit fees paid to the auditors of the Company during the current and preceding financial
years.

Sta
mfo
rd T
yres
Co
rpo
rati
on
Lim
ited
Notes to the Financial Statements (Cont’d)For the financial year ended 30 April 2017
(In Singapore Dollar)
76
10. Taxation
Major components of income tax expense
The major components of income tax expense for the years ended 30 April 2017 and 2016 are:
Group
Note 2017 2016
$’000 $’000
Income statement
Current income taxation
- Current year 2,646 2,094
- Under/(over)-provision of tax in respect of prior years 9 (10)
2,655 2,084
Deferred income taxation 28
- Origination and reversal of temporary differences 97 94
- (Over)/under-provision of tax in respect of prior years (280) 143
(183) 237
Withholding tax 346 77
Income tax expenses recognised in profit or loss 2,818 2,398
Relationship between tax expense and accounting profit
The reconciliation between tax expense and the product of accounting profit multiplied by the applicable
corporate tax rate for the years ended 30 April 2017 and 2016 are as follows:
Group
2017 2016
Profit before taxation 10,930 4,985
Less: Share of results of joint ventures* (2,614) (1,767)
8,316 3,218
Taxation at statutory tax rate of 17% (2016: 17%) 1,414 547
Adjustments:
- Expenses not deductible for income tax purposes 648 714
- Effects of different tax rates in other countries 392 (2)
- Deferred tax assets not recognised in the current year 325 1,021
- Partial tax exemption and tax relief (52) (52)
- Withholding tax 346 77
- Others 16 (40)
- (Over)/under-provision of tax in respect of prior years (271) 133
Taxation 2,818 2,398
* These are presented net of tax in profit or loss.

Sta
mfo
rd T
yres
Co
rpo
rati
on
Lim
ited
Notes to the Financial Statements (Cont’d)For the financial year ended 30 April 2017
(In Singapore Dollar)
77
10. Taxation (cont’d)
As at 30 April 2017, the Group, primarily through its subsidiary companies, has unutilised tax losses of
approximately $25,210,000 (2016: $25,076,000) which may, subject to the agreement with the relevant tax
authorities, be carried forward and utilised to set-off against future taxable profits. Except for an amount of
$7,318,000 (2016: $7,549,000) which would expire in between 2018 and 2025 (2016: between 2017 and
2024), there is no time limit imposed on the utilisation of the remaining tax losses. The potential tax benefit of
approximately $7,414,000 (2016: $7,334,000) arising from the unutilised tax losses has not been recognised
in the financial statements due to the uncertainty of its recoverability.
11. Earnings per share
The following tables reflect the profit and share data used in the computation of basic and diluted earnings per
share (“EPS”) for the years ended 30 April:
Group
2017 2016
$’000 $’000
Group earnings used for the calculation of EPS:
Profit net of tax attributable to equity holders of the Company used in the
computation of basic earnings per share 8,112 2,587
’000 ’000
Number of shares used for the calculation of basic and diluted EPS:
Weighted average number of ordinary shares in issue used for the calculation of
basic EPS 235,586 235,586
Basic EPS is calculated on the Group’s profit for the financial year attributable to equity holders of the
Company divided by the weighted average number of ordinary shares in issue during the financial year.
Diluted EPS is calculated on the same basis as basic EPS as there are no dilutive potential ordinary shares as
at 30 April 2017 and 30 April 2016.
All share options have expired on 16 August 2015 and that there is no potential ordinary shares outstanding as
of 30 April 2017 and 30 April 2016.

Sta
mfo
rd T
yres
Co
rpo
rati
on
Lim
ited
Notes to the Financial Statements (Cont’d)For the financial year ended 30 April 2017
(In Singapore Dollar)
78
12. Property, plant and equipment
Freehold
land
Freehold
building
Leasehold
land and
buildings
Leasehold
improvements
Plant and
equipment
Motor
vehicles Total
Group $’000 $’000 $’000 $’000 $’000 $’000 $’000
Cost:
At 1 May 2015 4,614 566 51,088 9,584 79,144 6,371 151,367
Foreign currency translation
adjustment (124) – (367) (167) (2,361) (277) (3,296)
Additions 8,917 – 946 142 2,548 839 13,392
Disposals/write-off – – – (2) (234) (340) (576)
Reclassifications – – 5 – (5) – –
At 30 April 2016 and 1 May 2016 13,407 566 51,672 9,557 79,092 6,593 160,887
Foreign currency translation
adjustment (506) – (19) 140 2,192 87 1,894
Additions – – 1,908 256 4,272 1,230 7,666
Disposals/write-off – – (10) (1) (629) (871) (1,511)
At 30 April 2017 12,901 566 53,551 9,952 84,927 7,039 168,936
Accumulated depreciation and
impairment:
At 1 May 2015 – 283 12,429 6,487 61,680 4,364 85,243
Foreign currency translation
adjustment – – (188) (126) (1,837) (194) (2,345)
Charge for the financial year – – 1,943 607 4,617 710 7,877
Write-back of impairment loss – – (8) – – – (8)
Disposals/write-off – – – – (200) (305) (505)
At 30 April 2016 and 1 May 2016 – 283 14,176 6,968 64,260 4,575 90,262
Foreign currency translation
adjustment – – 75 110 1,798 53 2,036
Charge for the financial year – – 1,928 551 4,148 800 7,427
Write-back of impairment loss – – (8) – – – (8)
Disposals/write-off – – – – (604) (856) (1,460)
At 30 April 2017 – 283 16,171 7,629 69,602 4,572 98,257
Net book value:
At 30 April 2017 12,901 283 37,380 2,323 15,325 2,467 70,679
At 30 April 2016 13,407 283 37,496 2,589 14,832 2,018 70,625
Depreciation charge included in cost of goods sold
Depreciation charge amounting to $2,481,000 (2016: $2,761,000) was included in cost of goods sold during
the financial year.
Assets pledged as security
The Group’s property, plant and equipment with a total net book value of $49,034,000 as at 30 April 2017
(2016: $54,696,000) are subject to legal mortgages and floating charges referred to in Notes 24 and 27.

Sta
mfo
rd T
yres
Co
rpo
rati
on
Lim
ited
Notes to the Financial Statements (Cont’d)For the financial year ended 30 April 2017
(In Singapore Dollar)
79
12. Property, plant and equipment (cont’d)
Assets held under hire-purchase
Additions to plant and equipment for the financial year includes $377,000 (2016: $231,000) acquired
under hire-purchase agreements. The carrying amount of plant and equipment acquired under hire-purchase
agreements amounted to $2,780,000 as at 30 April 2017 (2016: $3,337,000). These assets are pledged as
security for the related hire-purchase liabilities referred to in Note 25.
13. Investment in subsidiaries
Company
Note 2017 2016
$’000 $’000
Cost of investment
Unquoted equity shares, at cost 40 78,122 78,122
Less: Impairment loss (37,358) (37,333)
40,764 40,789
Movement in impairment loss accounts:
At 1 May 37,333 31,682
Charge for the financial year 25 5,651
At 30 April 37,358 37,333
During the year, the Company carried out an impairment assessment on the recoverable amount of its
investments in subsidiaries. An impairment loss of $25,000 for the investment in a subsidiary was recognised
in “Other operating expenses” line item of profit or loss for the financial year as its carrying amount exceeded
the fair value based on the net asset value of the subsidiary. In the prior year, an impairment loss of $5,651,000
was recognised as the carrying values of one of the subsidiaries exceeded its recoverable amount determined
on its value-in-use and the other subsidiaries determined by their fair values based on net asset values. In
determining the value-in-use, a pre-tax discount rate of 9.5% was applied.
Amounts due from/(to) subsidiary companies
Loan to a subsidiary company (unsecured) 13,767 13,767
Amounts due from subsidiary companies (non-trade) 4,400 4,209
18,167 17,976
Less: Allowance for doubtful non-trade receivables from subsidiary companies (3,856) (3,717)
Amounts due from subsidiary companies 14,311 14,259
Amounts due to subsidiary companies (non-trade) (14,219) (11,341)

Sta
mfo
rd T
yres
Co
rpo
rati
on
Lim
ited
Notes to the Financial Statements (Cont’d)For the financial year ended 30 April 2017
(In Singapore Dollar)
80
13. Investment in subsidiaries (cont’d)
Movement in allowance for doubtful non-trade receivables amounts due from subsidiary companies:
Company
2017 2016
$’000 $’000
At 1 May 3,717 3,499
Allowance for the financial year 139 218
At 30 April 3,856 3,717
For the year ended 30 April 2017, an impairment loss of $139,000 (2016: $218,000) was recognised in
profit or loss of the Company following a debt recovery assessment performed on amounts due from subsidiary
companies as at 30 April 2017 and 30 April 2016, respectively.
The loan to a subsidiary company is unsecured, bears fixed interest at 2.89% (2016: 2.89%) per annum, with
no repayment terms and is repayable only when the cash flows of the subsidiary company permits. The amount
is not expected to be repaid in the next twelve months as the subsidiary company cannot repay this loan to the
Company until the subsidiary company has repaid certain term loans it obtained from the banks (Note 27).
Details of the subsidiary companies are set out in Note 40.
14. Joint venture companies
Group Company
2017 2016 2017 2016
$’000 $’000 $’000 $’000
Tyre Pacific (HK) Limited 14,362 12,160 1,571 1,571
Falken Tyre India Private Limited 2,500 2,139 4,996 4,996
16,862 14,299 6,567 6,567
Movement in investment in joint ventures during the year:
Group
2017 2016
$’000 $’000
At 1 May 14,299 15,897
Share of total comprehensive income 2,614 1,767
Dividends received – (2,864)
Exchange and other adjustments (51) (501)
At 30 April 16,862 14,299

Sta
mfo
rd T
yres
Co
rpo
rati
on
Lim
ited
Notes to the Financial Statements (Cont’d)For the financial year ended 30 April 2017
(In Singapore Dollar)
81
14. Joint venture companies (cont’d)
Analysis of total comprehensive income
Profit or loss after tax from continuing operations
Group
2017 2016
$’000 $’000
Tyre Pacific (HK) Limited 2,426 1,733
Falken Tyre India Private Limited 188 34
Total comprehensive income 2,614 1,767
Tyre Pacific (HK) Limited
Falken Tyre India
Private Limited
2017 2016 2017 2016
$’000 $’000 $’000 $’000
Summarised balance sheet
Cash and cash equivalents 11,160 9,964 260 628
Other current assets 23,224 21,190 14,170 10,240
Total current assets 34,384 31,154 14,430 10,868
Non-current assets 7,694 7,998 868 1,290
Total assets 42,078 39,152 15,298 12,158
Current financial liabilities (excluding trade,
other payables and provisions) 5,448 5,300 763 1,213
Other current liabilities 7,906 9,532 6,247 3,967
Total current liabilities 13,354 14,832 7,010 5,180
Non-current financial liabilities (excluding trade,
other payables and provisions) – – 1,888 1,540
Other non-current liabilities – – 150 90
Total non-current liabilities – – 2,038 1,630
Total liabilities 13,354 14,832 9,048 6,810
Net assets 28,724 24,320 6,250 5,348
Summarised statement of comprehensive
income
Revenue 41,178 45,784 34,890 27,118
Cost of goods sold (30,736) (36,098) (23,455) (17,858)
Depreciation and amortisation (346) (386) (655) (493)
Interest expense (208) (396) (45) (160)
Other expenditure (4,032) (4,388) (10,265) (8,523)
Profit before tax 5,856 4,516 470 84
Income tax expense (1,004) (1,050) – –
Total comprehensive income 4,852 3,466 470 84
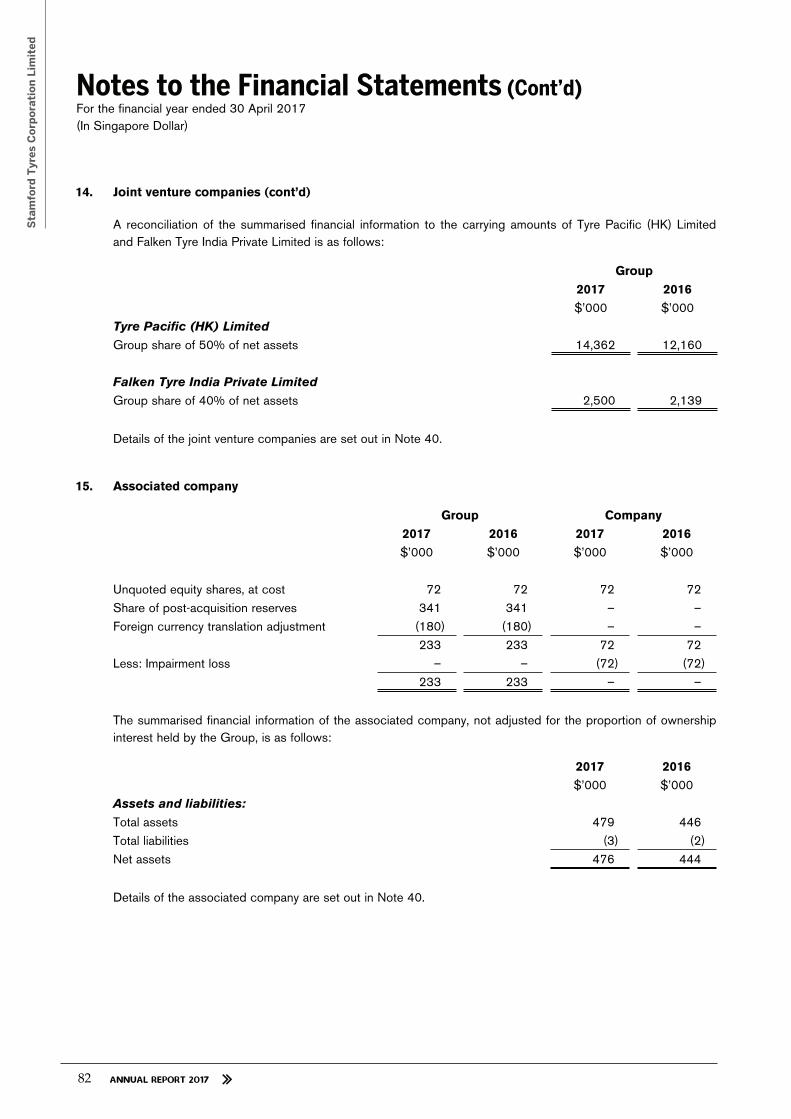
Sta
mfo
rd T
yres
Co
rpo
rati
on
Lim
ited
Notes to the Financial Statements (Cont’d)For the financial year ended 30 April 2017
(In Singapore Dollar)
82
14. Joint venture companies (cont’d)
A reconciliation of the summarised financial information to the carrying amounts of Tyre Pacific (HK) Limited
and Falken Tyre India Private Limited is as follows:
Group
2017 2016
$’000 $’000
Tyre Pacific (HK) Limited
Group share of 50% of net assets 14,362 12,160
Falken Tyre India Private Limited
Group share of 40% of net assets 2,500 2,139
Details of the joint venture companies are set out in Note 40.
15. Associated company
Group Company
2017 2016 2017 2016
$’000 $’000 $’000 $’000
Unquoted equity shares, at cost 72 72 72 72
Share of post-acquisition reserves 341 341 – –
Foreign currency translation adjustment (180) (180) – –
233 233 72 72
Less: Impairment loss – – (72) (72)
233 233 – –
The summarised financial information of the associated company, not adjusted for the proportion of ownership
interest held by the Group, is as follows:
2017 2016
$’000 $’000
Assets and liabilities:
Total assets 479 446
Total liabilities (3) (2)
Net assets 476 444
Details of the associated company are set out in Note 40.

Sta
mfo
rd T
yres
Co
rpo
rati
on
Lim
ited
Notes to the Financial Statements (Cont’d)For the financial year ended 30 April 2017
(In Singapore Dollar)
83
16. Inventories
Group
2017 2016
$’000 $’000
Inventories for sale 70,062 76,558
Raw materials 6,490 6,259
Work-in-progress - aluminium alloy wheels 1,317 2,203
Total inventories at lower of cost or net realisable value 77,869 85,020
Inventories for sale are stated after deducting allowance for obsolescence of 10,654 10,291
17. Trade receivables
Group
2017 2016
$’000 $’000
External parties 76,163 75,861
Amount due from joint venture company 38 –
Less: Allowance for doubtful trade receivables (8,734) (8,243)
67,467 67,618
Bad debts recovered (8) (32)
Trade receivables are denominated in the following currencies:
Ringgit Malaysia 21,296 22,765
Indonesian Rupiah 11,174 7,752
Singapore Dollar 10,221 12,056
Thai Baht 9,920 10,447
United States Dollar 4,296 6,125
South African Rand 3,222 3,570
Australian Dollar 2,657 1,953
Euro 2,112 1,001
Hong Kong Dollar 1,462 830
Others 1,107 1,119
67,467 67,618
External trade receivables and amount due from joint venture company are non-interest bearing which are
generally on 30 to 120 days terms. They are recognised at their original invoice amounts which represent their
fair values on initial recognition.
At the end of the reporting period, trade receivables arising from export sales amounting to $350,000 (2016:
$326,000) are supported by letters of credits issued by banks in countries where the customers are based.

Sta
mfo
rd T
yres
Co
rpo
rati
on
Lim
ited
Notes to the Financial Statements (Cont’d)For the financial year ended 30 April 2017
(In Singapore Dollar)
84
17. Trade receivables (cont’d)
Receivables that are past due but not impaired
The Group has trade receivables amounting to $30,314,000 (2016: $25,416,000) that are past due at the end
of the reporting period but not impaired. These receivables are unsecured and the analysis of their aging at the
end of each reporting period is as follows:
Group
2017 2016
$’000 $’000
Trade receivables past due:
Lesser than 30 days 11,801 8,812
30 - 60 days 7,030 4,861
61 - 90 days 3,664 2,065
91 - 120 days 1,085 2,030
More than 120 days 6,734 7,648
30,314 25,416
Receivables that are impaired
The Group’s trade receivables that are impaired at the end of each reporting period and the movement of the
allowance accounts used to record the impairment are as follows:
Trade receivables – nominal amounts 8,734 8,243
Less: Allowance for doubtful trade receivables (8,734) (8,243)
– –
Movement in allowance accounts:
At 1 May 8,243 7,865
Charge for the year 1,812 1,903
Written-off against allowance (1,505) (1,257)
Foreign currency translation adjustment 184 (268)
At 30 April 8,734 8,243
For the year ended 30 April 2017, an impairment loss of $1,812,000 (2016: $1,903,000) was recognised in
profit or loss following a debt recovery assessment performed on trade receivables as at 30 April 2017.

Sta
mfo
rd T
yres
Co
rpo
rati
on
Lim
ited
Notes to the Financial Statements (Cont’d)For the financial year ended 30 April 2017
(In Singapore Dollar)
85
18. Derivatives
Group
2017
Fair value
2016
Fair value
Assets Liabilities Assets Liabilities
$’000 $’000 $’000 $’000
Non-hedging instrument
- Forward currency contracts (a) 70 (16) 59 (96)
- Interest rate swap (b) – (4) 7 –
70 (20) 66 (96)
Company
2017
Fair value
2016
Fair value
Assets Liabilities Assets Liabilities
$’000 $’000 $’000 $’000
Non-hedging instrument
- Forward currency contracts (a) 54 – – (39)
(a) Foreign exchange forward contracts
The Group and the Company use foreign currency contracts to manage the risk against currency
fluctuations in connection with payments to overseas suppliers and receipts from overseas customers
and inter-company receivables and payables. The contractual amounts to be paid or received and
contractual exchange rates of the outstanding contracts at the end of each reporting period are as
follows:
Group
contractual/notional
amounts
2017 2016
$’000 $’000
To sell Singapore Dollar for:
- United States Dollar 2,198 1,052
- Euro 1,745 721
3,943 1,773
To sell South African Rand for:
- United States Dollar 84 61
- Singapore Dollar 61 –
145 61

Sta
mfo
rd T
yres
Co
rpo
rati
on
Lim
ited
Notes to the Financial Statements (Cont’d)For the financial year ended 30 April 2017
(In Singapore Dollar)
86
18. Derivatives (cont’d)
(a) Foreign exchange forward contracts (cont’d)
Group
contractual/notional
amounts
2017 2016
$’000 $’000
To sell Thai Baht for:
- United States Dollar 291 281
- Singapore Dollar 140 –
431 281
To buy Singapore Dollar for:
- Australian Dollar 5,400 5,358
- United States Dollar 1,397 3,010
- South African Rand 2,782 2,620
- Euro 2,207 756
11,786 11,744
To buy Thai Baht for:
- United States Dollar 4,550 2,956
- Singapore Dollar 644 244
- Euro 18 –
5,212 3,200
Company
contractual/notional
amounts
2017 2016
$’000 $’000
To buy Singapore Dollar for Australian Dollar 2,592 2,519
(b) Interest rate swap
The subsidiary company entered into another interest rate swap of $10 million in 2014 to manage its
exposure to interest rate fluctuation. The interest rate swap pays floating rate interest equal to 1-month
Swap Offer Rate (“SOR”) and receives a fixed rate of interest of 0.99% per annum. The interest rate
swap matured on 6 June 2017.

Sta
mfo
rd T
yres
Co
rpo
rati
on
Lim
ited
Notes to the Financial Statements (Cont’d)For the financial year ended 30 April 2017
(In Singapore Dollar)
87
19. Other receivables
Group Company
2017 2016 2017 2016
$’000 $’000 $’000 $’000
Financial assets
Amounts due from:
- Joint venture company 60 58 60 58
- Shareholders of subsidiary companies – – 244 244
Sundry receivables 3,987 3,654 1 1
Deposits to suppliers 816 696 – –
Staff loans 99 117 – –
4,962 4,525 305 303
Less: Allowance for doubtful receivables (297) (293) (209) (209)
4,665 4,232 96 94
Non-financial assets
Prepayments and advances
Prepaid operating expenses 1,047 1,045 21 21
Advance payment for purchases 2,843 1,930 – –
3,890 2,975 21 21
Movement in allowance accounts:
At 1 May 293 211 209 209
Charge for the year 4 82 – –
At 30 April 297 293 209 209
The non-trade amounts due from the joint venture company and shareholders of subsidiary companies are
unsecured, interest-free and are repayable on demand. The amounts are to be settled in cash.
The deposits to suppliers are unsecured and interest-free. The deposits are refundable at the end of the
manufacturing contracts.
Staff loans are unsecured, bear interest at rates at 6.50% (2016: 6.50%) per annum and repayable within the
next 12 months.
The advance payment for purchases is unsecured, interest-free and is deductible against the amount payable
on purchases from these suppliers.

Sta
mfo
rd T
yres
Co
rpo
rati
on
Lim
ited
Notes to the Financial Statements (Cont’d)For the financial year ended 30 April 2017
(In Singapore Dollar)
88
20. Cash and cash equivalents
Group Company
2017 2016 2017 2016
$’000 $’000 $’000 $’000
Cash at bank and on hand 21,693 17,425 1,225 373
Cash and cash equivalents are denominated in the following currencies:
Singapore Dollar 7,098 4,811 1,219 366
Ringgit Malaysia 3,668 3,514 – –
South African Rand 3,448 3,003 – –
Indonesian Rupiah 1,983 612 – –
Thai Baht 1,761 1,669 – –
Hong Kong Dollar 1,629 1,619 – –
United States Dollar 855 642 6 7
Others 1,251 1,555 – –
21,693 17,425 1,225 373
Cash at bank earns interest at floating rates based on daily bank deposits rates ranging from 0.02% to 3.00%
(2016: 0.01% to 4.00%) per annum.
21. Trade payables
Trade payables are denominated in the following currencies:
Group
2017 2016
$’000 $’000
United States Dollar 5,215 3,384
Ringgit Malaysia 3,579 4,407
Singapore Dollar 3,104 2,524
Euro 2,400 1,506
Australian Dollar 1,972 1,307
Indonesian Rupiah 1,503 847
Thai Baht 1,387 916
South African Rand 965 1,458
Others 340 835
20,465 17,184
These amounts are non-interest bearing. Trade payables are normally settled on 120 days terms.

Sta
mfo
rd T
yres
Co
rpo
rati
on
Lim
ited
Notes to the Financial Statements (Cont’d)For the financial year ended 30 April 2017
(In Singapore Dollar)
89
22. Trust receipts (secured)
Trust receipts have maturity dates of up to 6 (2016: 6) months and are secured by corporate guarantees from
the Company, a negative pledge over the assets, excluding its leasehold buildings, of subsidiary companies.
These facilities are subject to compliance with certain financial covenants.
The trust receipts bear interest at rates ranging from 1.85% to 13.50% (2016: 1.36% to 13.00%) per annum.
The weighted average interest rate of the Group’s trust receipts is 4.02% (2016: 4.79%) per annum.
Trust receipts are denominated in the following currencies:
Group
2017 2016
$’000 $’000
Singapore Dollar 13,269 7,377
Thai Baht 11,356 12,156
United States Dollar 8,645 5,716
Indonesian Rupiah 6,133 4,050
Ringgit Malaysia 5,548 14,286
South African Rand 2,902 4,435
Australian Dollar 1,860 1,595
Hong Kong Dollar 1,095 71
50,808 49,686
23. Other payables
Group Company
2017 2016 2017 2016
$’000 $’000 $’000 $’000
Financial liabilities
Amounts due to associated company 299 288 89 89
Payroll and staff related expenses 4,480 3,630 – –
Sundry payables 6,060 5,014 48 30
Accrued operating expenses 7,872 7,464 468 592
18,711 16,396 605 711
The non-trade amounts due to the associated company are unsecured, interest-free and repayable on demand.

Sta
mfo
rd T
yres
Co
rpo
rati
on
Lim
ited
Notes to the Financial Statements (Cont’d)For the financial year ended 30 April 2017
(In Singapore Dollar)
90
24. Loans (secured)
Group
Note 2017 2016
$’000 $’000
Short-term loans (revolving credit facilities) 1,858 4,417
Long-term loans - current portion 27 16,122 6,153
17,980 10,570
The short-term loans are secured by negative pledge over the assets of certain subsidiary companies, excluding
their hire-purchase assets, and corporate guarantees from the Company. The short-term loans bear interest at
rates ranging from 3.00% to 8.50% (2016: 2.63% to 8.00%) per annum. The weighted average interest rate of
the Group’s short-term loans is 6.01% (2016: 5.16%) per annum.
Short-term loans are denominated in the following currencies:
Group
Effective interest rate
2017 2016 2017 2016
% % $’000 $’000
Vietnamese Dong loans 8.41 7.33 1,051 1,026
Thai Baht loans 4.27 4.34 807 769
Ringgit Malaysia loans – 4.61 – 2,419
Hong Kong Dollar loans – 6.06 – 203
1,858 4,417

Sta
mfo
rd T
yres
Co
rpo
rati
on
Lim
ited
Notes to the Financial Statements (Cont’d)For the financial year ended 30 April 2017
(In Singapore Dollar)
91
25. Hire-purchase liabilities
The future minimum payments under hire-purchase agreements to acquire motor vehicles and plant and
equipment are as follows:
Group
Minimum
payments
Present value
of payments
Minimum
payments
Present value
of payments
2017 2017 2016 2016
$’000 $’000 $’000 $’000
Within one year 893 807 968 878
After one year but not more than five years 984 882 1,459 1,323
More than five years – – – –
Total minimum hire-purchase payments 1,877 1,689 2,427 2,201
Less: Amounts representing finance charges (188) – (226) –
Present value of minimum hire-purchase payments 1,689 1,689 2,201 2,201
Effective interest rates on the hire-purchase arrangements range from 3.41% to 11.13% (2016: 3.41% to
10.53%) per annum.
26. Provisions
Group
2017 2016
$’000 $’000
Current liabilities:
Provision for product warranties
At 1 May 639 550
Provision for the year 305 488
Provision utilised during the year (255) (399)
At 30 April 689 639
A provision is recognised for expected warranty claims on proprietary products sold during the financial year
based on past experience of the level of returns.
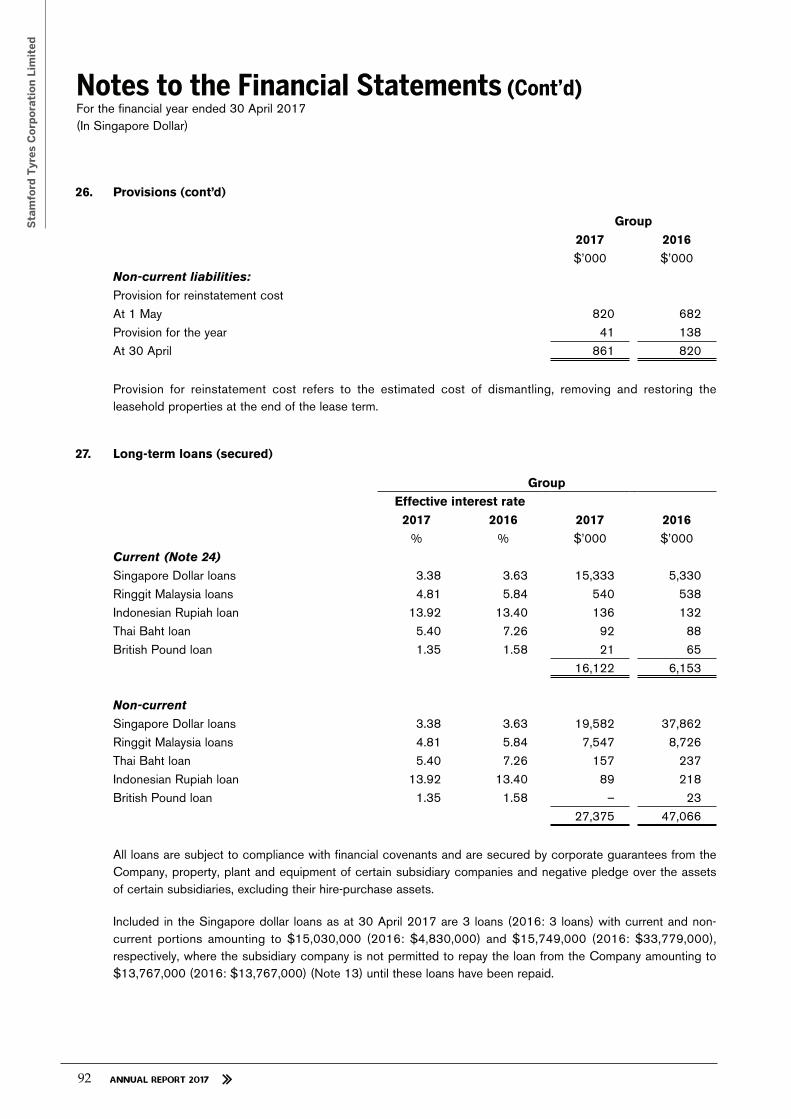
Sta
mfo
rd T
yres
Co
rpo
rati
on
Lim
ited
Notes to the Financial Statements (Cont’d)For the financial year ended 30 April 2017
(In Singapore Dollar)
92
26. Provisions (cont’d)
Group
2017 2016
$’000 $’000
Non-current liabilities:
Provision for reinstatement cost
At 1 May 820 682
Provision for the year 41 138
At 30 April 861 820
Provision for reinstatement cost refers to the estimated cost of dismantling, removing and restoring the
leasehold properties at the end of the lease term.
27. Long-term loans (secured)
Group
Effective interest rate
2017 2016 2017 2016
% % $’000 $’000
Current (Note 24)
Singapore Dollar loans 3.38 3.63 15,333 5,330
Ringgit Malaysia loans 4.81 5.84 540 538
Indonesian Rupiah loan 13.92 13.40 136 132
Thai Baht loan 5.40 7.26 92 88
British Pound loan 1.35 1.58 21 65
16,122 6,153
Non-current
Singapore Dollar loans 3.38 3.63 19,582 37,862
Ringgit Malaysia loans 4.81 5.84 7,547 8,726
Thai Baht loan 5.40 7.26 157 237
Indonesian Rupiah loan 13.92 13.40 89 218
British Pound loan 1.35 1.58 – 23
27,375 47,066
All loans are subject to compliance with financial covenants and are secured by corporate guarantees from the
Company, property, plant and equipment of certain subsidiary companies and negative pledge over the assets
of certain subsidiaries, excluding their hire-purchase assets.
Included in the Singapore dollar loans as at 30 April 2017 are 3 loans (2016: 3 loans) with current and non-
current portions amounting to $15,030,000 (2016: $4,830,000) and $15,749,000 (2016: $33,779,000),
respectively, where the subsidiary company is not permitted to repay the loan from the Company amounting to
$13,767,000 (2016: $13,767,000) (Note 13) until these loans have been repaid.

Sta
mfo
rd T
yres
Co
rpo
rati
on
Lim
ited
Notes to the Financial Statements (Cont’d)For the financial year ended 30 April 2017
(In Singapore Dollar)
93
28. Deferred taxation
Group Company
Note 2017 2016 2017 2016
$’000 $’000 $’000 $’000
At 1 May 1,541 1,895 (108) (108)
Foreign currency translation adjustment 81 (117) – –
Write-back for the financial year 10 (97) (94) – –
(Over)/under-provision of deferred tax
expense in respect of prior years 10 280 (143) – –
At 30 April 1,805 1,541 (108) (108)
Represented by:
- Deferred tax assets 3,109 2,468 – –
- Deferred tax liabilities (1,304) (927) (108) (108)
1,805 1,541 (108) (108)
The deferred tax assets and liabilities arise from the following temporary differences:
Property,
plant and
equipment Receivables Inventories
Unremitted
foreign
sourced
income
Provision,
accruals
and others Total
$’000 $’000 $’000 $’000 $’000 $’000
Group
2017
At 1 May (745) 879 1,318 (108) 197 1,541
Movement for the year (28) 13 475 – (277) 183
Foreign currency
translation adjustment (8) 43 44 – 2 81
At 30 April (781) 935 1,837 (108) (78) 1,805
2016
At 1 May (813) 990 1,664 (108) 162 1,895
Movement for the year 62 (58) (280) – 39 (237)
Foreign currency
translation adjustment 6 (53) (66) – (4) (117)
At 30 April (745) 879 1,318 (108) 197 1,541
The deferred tax liabilities of the Company relate to unremitted foreign sourced income.
Temporary differences for which no deferred tax liability have been recognised aggregate to $5,735,000
(2016: $4,922,000) as the Group determined that the undistributed earnings of its subsidiaries will not be
distributed in the foreseeable future. The deferred tax liability is estimated to be $574,000 (2016: $492,000).

Sta
mfo
rd T
yres
Co
rpo
rati
on
Lim
ited
Notes to the Financial Statements (Cont’d)For the financial year ended 30 April 2017
(In Singapore Dollar)
94
29. Share capital
Group and Company
Number of
shares
2017
Share
capital
2017
Number of
shares
2016
Share
capital
2016
’000 $’000 ’000 $’000
Issued and fully paid:
At beginning and end of financial year 235,586 35,722 235,586 35,722
The holders of the ordinary shares are entitled to receive dividends as and when declared by the Company.
Each ordinary share carries one vote without restriction. The ordinary shares have no par value.
There are no unissued shares under share options as at 30 April 2017 (2016: Nil with exercise price of $0.43
per share). All share options had expired on 16 August 2015 and no share options were outstanding as at
30 April 2017. The details of the share options are discussed in Note 7.
The holders of the share options have no right to participate by virtue of these options in any share issue of any
other company in the Group.
30. Reserves – Group and Company
(a) Capital reserve
Capital reserve represents proceeds from issuance of warrants and non-distributable amounts set aside
in compliance with local laws of certain overseas subsidiary company.
(b) Employee share option reserve
Employee share option reserve represents the fair value of equity-settled share options granted to
employees (Note 7). The reserve was made up of the accumulated value of services received from
employees recorded on grant of equity-settled share options.
(c) Revenue reserve
This represents the accumulated profits less distributions made to the shareholders of the Company.
(d) Foreign currency translation reserve
This comprises foreign exchange differences arising from the translation of the financial statements of
overseas subsidiary, associated and joint venture companies and from the translation of long-term inter-
company advances which are effectively part of net investments in the subsidiary companies.
(e) Discount on acquisition of non-controlling interest
The discount on acquisition of non-controlling interest represents the difference between the amount
by which the non-controlling interest is adjusted and the fair value of the consideration paid that is
recognised directly in equity and attributed to the parent. Such changes in the Company’s ownership
interest in a subsidiary that do not result in a loss of control are accounted for as equity transactions.
The movement in the reserves are shown in the statements of changes in equity.

Sta
mfo
rd T
yres
Co
rpo
rati
on
Lim
ited
Notes to the Financial Statements (Cont’d)For the financial year ended 30 April 2017
(In Singapore Dollar)
95
31. Dividend
Group and Company
2017 2016
$’000 $’000
Final exempt (one-tier) dividend of 1.0 cent (2016: 1.0 cent), per share in
respect of the previous financial year 2,356 2,356
Dividend declared and paid during the year 2,356 2,356
The directors have proposed a final exempt (one-tier) dividend of 1.5 cents (2016: 1.0 cent) per share
amounting to approximately $3,534,000 (2016: $2,356,000) to be paid in respect of the financial year ended
30 April 2017. The dividend will be recorded as a liability on the balance sheets of the Company and Group
upon approval by the shareholders of the Company at the next Annual General Meeting of the Company.
32. Commitments
(i) Operating lease commitments – as lessee
The Group leases office premises, warehousing facilities and retail outlets under operating leases. The
leases typically run for an initial period of 2 to 30 years, with an option to renew the leases after that
date. Lease rentals are usually adjusted during the renewals to reflect market rentals. There were no
restrictions placed upon the Group by entering into these leases.
As at financial year end, commitments for minimum rental payments under non-cancellable leases with a
term of more than one year are as follows:
Group
2017 2016
$’000 $’000
Within one year 3,151 4,517
Within two to five years 5,180 5,286
After five years 7,326 8,577
15,657 18,380

Sta
mfo
rd T
yres
Co
rpo
rati
on
Lim
ited
Notes to the Financial Statements (Cont’d)For the financial year ended 30 April 2017
(In Singapore Dollar)
96
32. Commitments (cont’d)
(ii) Capital commitments
Group
2017 2016
$’000 $’000
Commitments in respect of contracts placed for the purchase/
construction of property, plant and equipment 69 1,360
33. Contingencies
Company
2017 2016
$’000 $’000
Corporate guarantees
Guarantees issued for bank facilities granted to subsidiary companies 96,163 107,322
The above corporate guarantees indicate amounts utilised by subsidiary companies as at the end of each
reporting period.
34. Related party transactions
(a) Sale and purchase of goods and services
In addition to those related party information disclosed elsewhere in the financial statements, the
following significant transactions between the Group and related parties took place during the year at
terms agreed between the parties:
Group
2017 2016
$’000 $’000
Income from services rendered to a joint venture company 628 587
Management fee paid to other shareholder of a joint venture company (90) (90)
Rental expenses paid to a company with common director (182) (174)

Sta
mfo
rd T
yres
Co
rpo
rati
on
Lim
ited
Notes to the Financial Statements (Cont’d)For the financial year ended 30 April 2017
(In Singapore Dollar)
97
34. Related party transactions (cont’d)
(b) Compensation of key management personnel
Group
2017 2016
$’000 $’000
Salaries, bonus and other benefits-in-kind 2,279 2,490
Directors’ fees 377 377
Contribution to defined contribution plan 72 72
2,728 2,939
Comprises amounts paid/payable to:
- Directors of the Company 1,561 1,470
- Directors of subsidiary companies 371 370
- Other key management personnel 796 1,099
2,728 2,939
35. Financial risk management objectives and policies
The Group’s principal financial instruments, other than derivative financial instruments, comprise short-term and
long-term bank borrowings, hire-purchase contracts, and cash and short-term deposits. The main purpose of
these financial instruments and borrowings are to raise finance for the Group’s operations. The Group has
various other financial assets and liabilities such as trade receivables and trade payables, which arise directly
from its operations.
The Group also enters into derivative instruments in the form of interest rate swap and forward currency contracts
to manage interest rate and currency risks arising from the Group’s operations and its sources of financing.
It is, and has been throughout the year under review, the Group’s policy that no trading in derivative financial
instruments shall be undertaken.
The main risks faced by the Group and Company are foreign currency risk, interest rate risk, credit risk and
liquidity risk that arise through its normal operations.
(a) Foreign currency risk
Foreign exchange risk arises from a change in foreign currency exchange rate, which is expected to
have an adverse effect on the Group in the current reporting period and in future years. The Group
operates in several countries and subsidiary, associated and joint venture companies within the Group
maintain their books and records in their respective functional currencies. The Group’s accounting policy
is to translate the results of overseas subsidiary, associated and joint venture companies using the
weighted average exchange rates. Net assets denominated in foreign currencies and held at the financial
year end are translated into Singapore Dollar, the Group’s reporting currency, at year end exchange
rates. Fluctuations in the exchange rate between the functional currencies and Singapore Dollar will
therefore have an impact on the Group. It is the Group’s policy not to hedge exposures arising from
such translations. The Group’s strategy is to fund overseas operations with borrowings denominated in
their functional currencies as a natural hedge against overseas assets.

Sta
mfo
rd T
yres
Co
rpo
rati
on
Lim
ited
Notes to the Financial Statements (Cont’d)For the financial year ended 30 April 2017
(In Singapore Dollar)
98
35. Financial risk management objectives and policies (cont’d)
(a) Foreign currency risk (cont’d)
The Group is also exposed to the volatility in the foreign currency cash flows related to repatriation of
the investments in and advances to its subsidiary, associated and joint venture companies. The Group
does not hedge exposures arising from such risks.
The Group’s trading subsidiary companies are exposed to movements in foreign currency rates arising
from the purchases of goods from suppliers and sales made to customers located in several countries.
Whenever necessary, foreign exchange forward contracts are used by the subsidiary companies to
manage the foreign currency exposure arising from their trading activities. The Group accounting policies
in relation to these derivative financial instruments are set out in Note 2.24.
Sensitivity analysis for foreign currency risk
A 5% fluctuation of certain foreign currencies against the underlying functional currencies of the Group’s
entities at the end of each reporting period would have an impact on the Group’s profit net of tax by the
amounts shown below. The analysis assumes all other variables, in particular, interest rates, remained
constant. The analysis is performed on the same basis for the financial year ended 30 April 2016.
(Decrease)/increase in
profit net of tax
2017 2016
$’000 $’000
USD – strengthened by 5% against SGD (2016: 5%) (436) (117)
– weakened by 5% against SGD (2016: 5%) 436 117
ZAR – strengthened by 5% against SGD (2016: 5%) 229 219
– weakened by 5% against SGD (2016: 5%) (229) (219)
MYR – strengthened by 5% against SGD (2016: 5%) 121 126
– weakened by 5% against SGD (2016: 5%) (121) (126)
(b) Interest rate risk
Interest rate risk is the risk that changes in interest rates will have an adverse financial effect on the
Group’s financial conditions and results. The primary source of the Group’s interest rate risk is its
borrowings from banks and other financial institutions primarily in Singapore, Malaysia and Thailand.
The Group ensures that it obtains borrowings at competitive interest rates under the most favourable
terms and conditions. Where appropriate, the Group uses interest rate swaps to hedge its interest rate
exposure for specific underlying debt obligations. Risk variables are based on volatility in interest rates.
This analysis assumes that all other variables, in particular foreign currency rates and tax rates remain
constant. Information relating to the interest rate is disclosed in Notes 22, 24, 25 and 27. At the end
of the reporting period, approximately 2% (2016: 2%) of the Group’s borrowings are at fixed rates of
interest. Cash and bank balances are excluded from the table below as fluctuations of interest rates are
determined to have no significant impact on the Group’s profit net of tax. Included in the table below are
the Group’s interest-bearing financial instruments, categorised by the earlier contractual re-pricing or
maturity dates.

Sta
mfo
rd T
yres
Co
rpo
rati
on
Lim
ited
Notes to the Financial Statements (Cont’d)For the financial year ended 30 April 2017
(In Singapore Dollar)
99
35. Financial risk management objectives and policies (cont’d)
(b) Interest rate risk (cont’d)
Group
Within 1
year
Within 1-2
years
Within 2-3
years
Within 3-4
years
Within 4-5
years
More than 5
years Total
$’000 $’000 $’000 $’000 $’000 $’000 $’000
2017
Fixed rate
Derivatives liabilities 4 – – – – – 4
Obligations under hire-purchase 736 662 88 14 4 – 1,504
Bank loans 92 92 65 – – – 249
Floating rate
Obligations under hire-purchase 71 53 39 22 – – 185
Trust receipts 50,808 – – – – – 50,808
Bank loans 17,888 3,392 3,342 7,656 2,372 10,456 45,106
2016
Fixed rate
Derivatives assets 7 – – – – – 7
Obligations under hire-purchase 827 613 599 20 2 – 2,061
Bank loans 88 88 88 61 – – 325
Floating rate
Obligations under hire-purchase 51 41 28 20 – – 140
Trust receipts 49,686 – – – – – 49,686
Bank loans 10,482 16,270 3,646 3,574 7,763 15,576 57,311

Sta
mfo
rd T
yres
Co
rpo
rati
on
Lim
ited
Notes to the Financial Statements (Cont’d)For the financial year ended 30 April 2017
(In Singapore Dollar)
100
35. Financial risk management objectives and policies (cont’d)
(b) Interest rate risk (cont’d)
Sensitivity analysis for interest rate risk
The table below demonstrates the sensitivity to a reasonably possible change in interest rates with all
other variables held constant, of the Group’s profit net of tax.
Increase/
(decrease) in
basis points
Decrease/
(increase) in
profit net
of tax
$’000
2017
- Singapore Dollar 50 248
- Ringgit Malaysia 50 68
- Thai Baht 50 57
- United States Dollar 50 43
- Singapore Dollar (50) (248)
- Ringgit Malaysia (50) (68)
- Thai Baht (50) (57)
- United States Dollar (50) (43)
2016
- Singapore Dollar 50 261
- United States Dollar 50 118
- Thai Baht 50 62
- Ringgit Malaysia 50 28
- Singapore Dollar (50) (261)
- United States Dollar (50) (118)
- Thai Baht (50) (62)
- Ringgit Malaysia (50) (28)
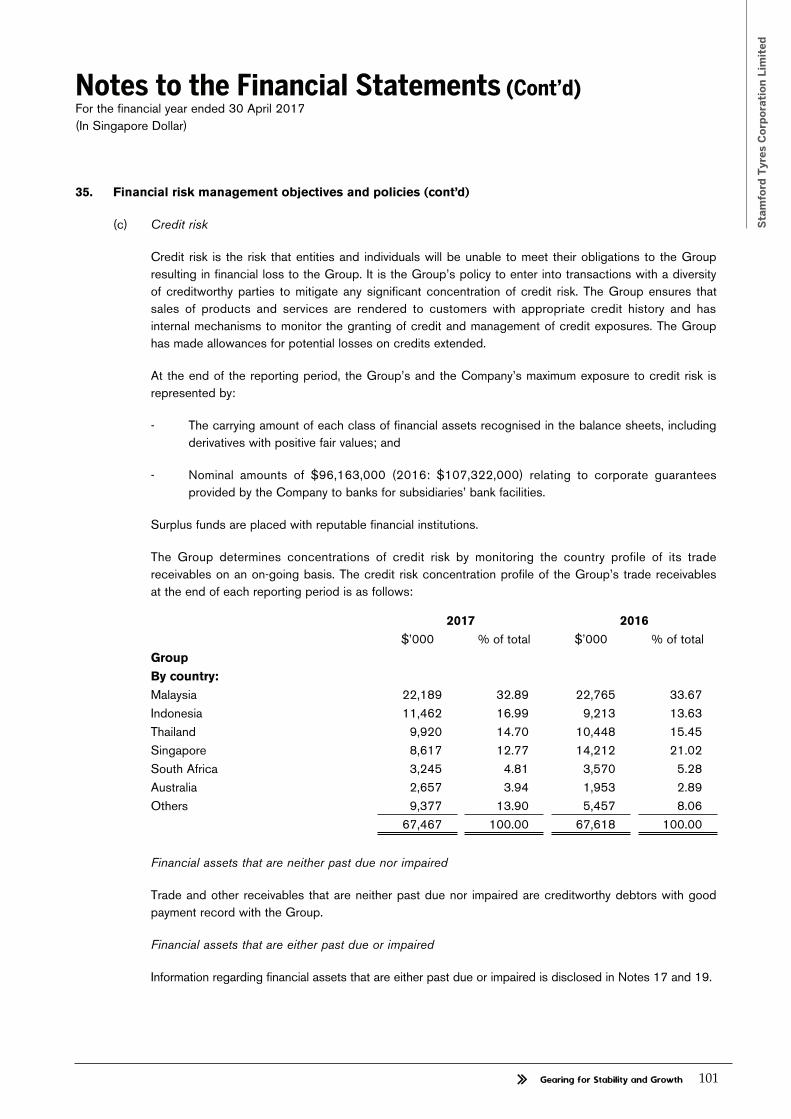
Sta
mfo
rd T
yres
Co
rpo
rati
on
Lim
ited
Notes to the Financial Statements (Cont’d)For the financial year ended 30 April 2017
(In Singapore Dollar)
101
35. Financial risk management objectives and policies (cont’d)
(c) Credit risk
Credit risk is the risk that entities and individuals will be unable to meet their obligations to the Group
resulting in financial loss to the Group. It is the Group’s policy to enter into transactions with a diversity
of creditworthy parties to mitigate any significant concentration of credit risk. The Group ensures that
sales of products and services are rendered to customers with appropriate credit history and has
internal mechanisms to monitor the granting of credit and management of credit exposures. The Group
has made allowances for potential losses on credits extended.
At the end of the reporting period, the Group’s and the Company’s maximum exposure to credit risk is
represented by:
- The carrying amount of each class of financial assets recognised in the balance sheets, including
derivatives with positive fair values; and
- Nominal amounts of $96,163,000 (2016: $107,322,000) relating to corporate guarantees
provided by the Company to banks for subsidiaries’ bank facilities.
Surplus funds are placed with reputable financial institutions.
The Group determines concentrations of credit risk by monitoring the country profile of its trade
receivables on an on-going basis. The credit risk concentration profile of the Group’s trade receivables
at the end of each reporting period is as follows:
2017 2016
$’000 % of total $’000 % of total
Group
By country:
Malaysia 22,189 32.89 22,765 33.67
Indonesia 11,462 16.99 9,213 13.63
Thailand 9,920 14.70 10,448 15.45
Singapore 8,617 12.77 14,212 21.02
South Africa 3,245 4.81 3,570 5.28
Australia 2,657 3.94 1,953 2.89
Others 9,377 13.90 5,457 8.06
67,467 100.00 67,618 100.00
Financial assets that are neither past due nor impaired
Trade and other receivables that are neither past due nor impaired are creditworthy debtors with good
payment record with the Group.
Financial assets that are either past due or impaired
Information regarding financial assets that are either past due or impaired is disclosed in Notes 17 and 19.

Sta
mfo
rd T
yres
Co
rpo
rati
on
Lim
ited
Notes to the Financial Statements (Cont’d)For the financial year ended 30 April 2017
(In Singapore Dollar)
102
35. Financial risk management objectives and policies (cont’d)
(d) Liquidity risk
The Group monitors its projected and actual cash inflows and outflows to ensure that funding needs are
identified and managed in advance. The Group actively manages its debt maturity profile, operating cash
flows and availability of committed credit facilities to ensure that all refinancing, repayment and funding
needs are met. The Group strives to maintain a sufficient level of banking facilities to meet its funding
requirements and utilise trust receipts, revolving credit facilities, loans and hire-purchase contracts for
this purpose. The credit facilities provided by the banks and finance companies are subject to certain
financial covenants, and terms and conditions which are summarised in Notes 22, 24, 25 and 27.
The table below summarises the maturity profile of the Group and Company’s financial assets and
liabilities at the end of each reporting period based on contractual undiscounted payments.
1 year
or less
2 to 5
years
Over 5
years Total
$’000 $’000 $’000 $’000
2017
Group
Financial assets
Trade and other receivables 72,132 – – 72,132
Derivatives 70 – – 70
Cash and cash equivalents 21,693 – – 21,693
Total undiscounted financial assets 93,895 – – 93,895
Financial liabilities
Trade payables, trust receipts and other
payables 89,984 – – 89,984
Derivatives 20 – – 20
Hire-purchase liabilities 893 984 – 1,877
Loans and borrowings 18,671 17,539 10,884 47,094
Total undiscounted financial liabilities 109,568 18,523 10,884 138,975
Total net undiscounted financial liabilities (15,673) (18,523) (10,884) (45,080)

Sta
mfo
rd T
yres
Co
rpo
rati
on
Lim
ited
Notes to the Financial Statements (Cont’d)For the financial year ended 30 April 2017
(In Singapore Dollar)
103
35. Financial risk management objectives and policies (cont’d)
(d) Liquidity risk (cont’d)
1 year
or less
2 to 5
years
Over 5
years Total
$’000 $’000 $’000 $’000
2016
Group
Financial assets
Trade and other receivables 71,850 – – 71,850
Derivatives 66 – – 66
Cash and cash equivalents 17,425 – – 17,425
Total undiscounted financial assets 89,341 – – 89,341
Financial liabilities
Trade payables, trust receipts and other
payables 83,266 – – 83,266
Derivatives 96 – – 96
Hire-purchase liabilities 968 1,459 – 2,427
Loans and borrowings 11,052 32,717 16,281 60,050
Total undiscounted financial liabilities 95,382 34,176 16,281 145,839
Total net undiscounted financial liabilities (6,041) (34,176) (16,281) (56,498)
2017
Company
Financial assets
Other receivables 96 – – 96
Derivatives 54 – – 54
Cash and cash equivalents 1,225 – – 1,225
Total undiscounted financial assets 1,375 – – 1,375
Financial liabilities
Other payables 605 – – 605
Total undiscounted financial liabilities 605 – – 605
Total net undiscounted financial assets 770 – – 770
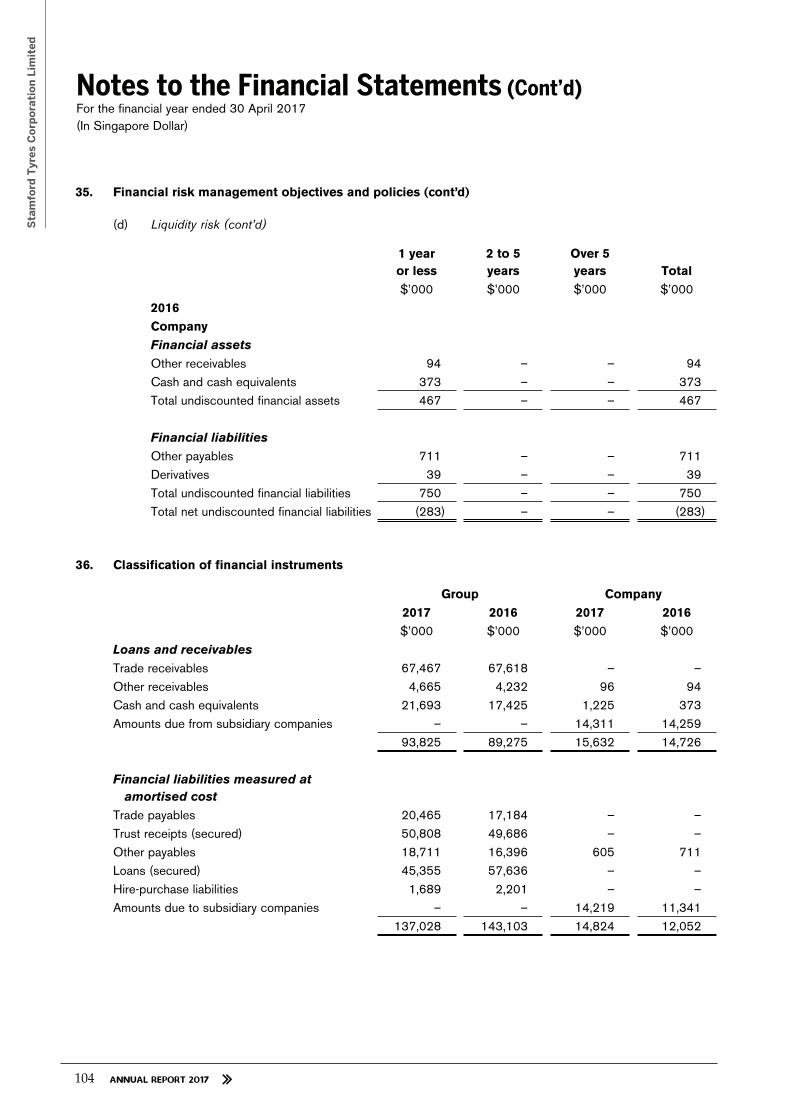
Sta
mfo
rd T
yres
Co
rpo
rati
on
Lim
ited
Notes to the Financial Statements (Cont’d)For the financial year ended 30 April 2017
(In Singapore Dollar)
104
35. Financial risk management objectives and policies (cont’d)
(d) Liquidity risk (cont’d)
1 year
or less
2 to 5
years
Over 5
years Total
$’000 $’000 $’000 $’000
2016
Company
Financial assets
Other receivables 94 – – 94
Cash and cash equivalents 373 – – 373
Total undiscounted financial assets 467 – – 467
Financial liabilities
Other payables 711 – – 711
Derivatives 39 – – 39
Total undiscounted financial liabilities 750 – – 750
Total net undiscounted financial liabilities (283) – – (283)
36. Classification of financial instruments
Group Company
2017 2016 2017 2016
$’000 $’000 $’000 $’000
Loans and receivables
Trade receivables 67,467 67,618 – –
Other receivables 4,665 4,232 96 94
Cash and cash equivalents 21,693 17,425 1,225 373
Amounts due from subsidiary companies – – 14,311 14,259
93,825 89,275 15,632 14,726
Financial liabilities measured at
amortised cost
Trade payables 20,465 17,184 – –
Trust receipts (secured) 50,808 49,686 – –
Other payables 18,711 16,396 605 711
Loans (secured) 45,355 57,636 – –
Hire-purchase liabilities 1,689 2,201 – –
Amounts due to subsidiary companies – – 14,219 11,341
137,028 143,103 14,824 12,052

Sta
mfo
rd T
yres
Co
rpo
rati
on
Lim
ited
Notes to the Financial Statements (Cont’d)For the financial year ended 30 April 2017
(In Singapore Dollar)
105
36. Classification of financial instruments (cont’d)
Group Company
2017 2016 2017 2016
$’000 $’000 $’000 $’000
Fair value through profit or loss
Forward currency contracts
- Derivatives assets 70 59 54 –
- Derivatives liabilities (16) (96) – (39)
Interest rate swap
- Derivatives assets – 7 – –
- Derivatives liabilities (4) – – –
37. Fair value of financial instruments
(a) Fair value of financial instruments that are carried at fair value
The following table shows an analysis of financial instruments carried at fair value by level of fair value
hierarchy:
Note
Quoted prices in
active markets
for identical
instruments
(Level 1)
Significant
other
observable
inputs
(Level 2)
Significant
unobservable
inputs
(Level 3)
$’000 $’000 $’000
Group
2017
Financial assets
Forward currency contracts 18 – 70 –
Interest rate swap 18 – – –
Financial liabilities
Forward currency contracts 18 – (16) –
Interest rate swap 18 – (4) –
2016
Financial assets
Forward currency contracts 18 – 59 –
Interest rate swap 18 – 7 –
Financial liabilities
Forward currency contracts 18 – (96) –
Interest rate swap 18 – – –

Sta
mfo
rd T
yres
Co
rpo
rati
on
Lim
ited
Notes to the Financial Statements (Cont’d)For the financial year ended 30 April 2017
(In Singapore Dollar)
106
37. Fair value of financial instruments (cont’d)
(a) Fair value of financial instruments that are carried at fair value (cont’d)
Note
Quoted prices in
active markets
for identical
instruments
(Level 1)
Significant
other
observable
inputs
(Level 2)
Significant
unobservable
inputs
(Level 3)
$’000 $’000 $’000
Company
2017
Financial assets
Forward currency contracts 18 – 54 –
2016
Financial liabilities
Forward currency contracts 18 – (39) –
Fair value hierarchy
The Group classify fair value measurement using a fair value hierarchy that reflects the significance of
the inputs used in making the measurements. The fair value hierarchy have the following levels:
Level 1 – Quoted prices (unadjusted) in active markets for identical assets or liabilities
Level 2 – Inputs other than quoted prices included within Level 1 that are observable for the
asset or liability, either directly (i.e., as prices) or indirectly (i.e., derived from prices), and
Level 3 – Inputs for the asset or liability that are not based on observable market data
(unobservable inputs)
Determination of fair value
Forward currency contracts and interest rate swaps are valued using a valuation technique with market
observable inputs. The most frequently applied valuation techniques include forward pricing and swap
models, using present value calculations. The models incorporate various inputs including the foreign
exchange spot and forward rates, interest rate curves and forward rate curves.

Sta
mfo
rd T
yres
Co
rpo
rati
on
Lim
ited
Notes to the Financial Statements (Cont’d)For the financial year ended 30 April 2017
(In Singapore Dollar)
107
37. Fair value of financial instruments (cont’d)
(b) Fair value of financial instruments by classes that are not carried at fair value and whose carrying
amounts are reasonable approximation of fair value
The management has determined that the carrying amounts of cash and short-term deposits, current
trade and other receivables, current trade and other payables and current bank loans based on their
notional amounts, reasonably approximate their fair values because these are mostly short-term in nature
or are re-priced frequently within a year.
The estimated fair values of the Group’s and Company’s borrowings approximates their carrying
amounts, based on borrowing rates which would be available to the Company at the end of each
reporting period.
(c) Fair value of financial instruments by classes that are not carried at fair value and whose carrying
amounts are not reasonable approximation of fair value
The Company has non-current interest-free receivables extended to subsidiary companies, which
either form part of the Company’s net investment in subsidiary companies or are not expected to be
repaid until the cash flows of the subsidiary companies permit. It is impractical to determine the fair
value of these receivables as the timing of the future cash flow repatriation cannot be estimated reliably.
Therefore, such loans are carried at cost.
38. Capital management
The primary objective of the Group’s capital management is to ensure that it maintains a strong credit rating
and healthy capital ratios in order to support its business and maximise shareholder value.
The Group manages its capital structure and makes adjustments to it, in light of changes in economic
conditions. To maintain or adjust the capital structure, the Group may adjust the dividend payment to
shareholders, return capital to shareholders or issue new shares. No changes were made in the objectives,
policies or processes during the years ended 30 April 2017 and 30 April 2016.
The Group monitors capital using a gearing ratio, which is bank borrowings divided by distributable net assets.
The Group’s policy is to keep the gearing ratio at less than 3 (2016: 3) times. Bank borrowings include trust
receipts, short-term and long-term loans.
Group
2017 2016
$’000 $’000
Trust receipts 50,808 49,686
Loans (secured) 45,355 57,636
Bank borrowings 96,163 107,322
Equity attributable to the equity holders of the Company 123,893 117,505
Less: Statutory reserve fund (424) (424)
Distributable net assets 123,469 117,081
Gearing ratio (times) 0.78 0.92

Sta
mfo
rd T
yres
Co
rpo
rati
on
Lim
ited
Notes to the Financial Statements (Cont’d)For the financial year ended 30 April 2017
(In Singapore Dollar)
108
38. Capital management (cont’d)
The Company and certain subsidiaries of the Group are subject to financial covenants for credit facilities
provided by banks. The Company and these subsidiaries are required to maintain certain leverage ratios, debt
service coverage ratios, interest coverage and shareholders’ funds.
As disclosed in Note 30, a subsidiary of the Group is required to maintain a five percent reserve at each
distribution of dividends until the reserve reaches at least ten percent of the subsidiary’s authorised capital. This
externally imposed capital requirement has been complied with by the subsidiary for the financial years ended
30 April 2017 and 30 April 2016.
39. Segment information
For management purposes, the Group is organised into business units based on their geographical locations,
and has four reportable segments as follows:
I. South East Asia
II. North Asia
III. Africa
IV. Others
Distribution of tyres and wheels to external customers are included in the South East Asia, North Asia, Africa
and other segments. Manufacturing of alloy wheels sold directly to external customers are included in the South
East Asia segment.
Except as indicated above, no operating segments have been aggregated to form the above reportable
operating segments. Management monitors the operating results of its business units separately for the
purpose of making decisions about resource allocation and performance assessment. Segment performance
is evaluated based on operating profit or loss which in certain respects, as explained in the table below, is
measured differently from operating profit or loss in the consolidated financial statements. Income taxes are
managed on a group basis and are not allocated to operating segments.

Sta
mfo
rd T
yres
Co
rpo
rati
on
Lim
ited
Notes to the Financial Statements (Cont’d)For the financial year ended 30 April 2017
(In Singapore Dollar)
109
39. Segment information (cont’d)
Transfer prices between operating segments are based on terms agreed between parties.
South East
Asia
North
Asia Africa Others
Total of
segments Elimination Consolidated
$’000 $’000 $’000 $’000 $’000 $’000 $’000
2017
Revenue:
External revenue 202,270 2,806 17,062 13,665 235,803 – 235,803
Inter-segment revenue 26,064 995 – 63 27,122 (27,122) –
Other revenue:
- Interest income 8 – 55 14 77 – 77
- Others 1,606 1,180 1 – 2,787 – 2,787
Total revenue 229,948 4,981 17,118 13,742 265,789 (27,122) 238,667
Finance costs (4,448) (17) (337) (111) (4,913) 452 (4,461)
Segment result 7,830 838 359 (1,118) 7,909 452 8,361
Less: Unallocated
expenses (45)
Share of results of joint
ventures – 1,799 – 188 1,987 627 2,614
Profit before taxation 10,930
Taxation (2,818)
Profit for the financial year 8,112
Other information
Segment assets 217,298 5,632 16,109 7,294 246,333 – 246,333
Associated and joint
venture companies 233 14,362 – 2,500 17,095 – 17,095
Unallocated assets 2,843 36 – 230 3,109 – 3,109
Total assets 220,374 20,030 16,109 10,024 266,537 – 266,537
Segment liabilities 127,750 1,445 4,490 4,913 138,598 – 138,598
Unallocated liabilities 4,046 – – – 4,046 – 4,406
Total liabilities 131,796 1,445 4,490 4,913 142,644 – 142,644

Sta
mfo
rd T
yres
Co
rpo
rati
on
Lim
ited
Notes to the Financial Statements (Cont’d)For the financial year ended 30 April 2017
(In Singapore Dollar)
110
39. Segment information (cont’d)
South East
Asia
North
Asia Africa Others
Total of
segments Elimination Consolidated
$’000 $’000 $’000 $’000 $’000 $’000 $’000
2017
Other segment information
Additions to non-current
assets
- Property, plant and
equipment 7,000 – 559 107 7,666 – 7,666
Significant non-cash
expenses:
Amortisation and depreciation 7,118 62 138 109 7,427 – 7,427
Allowance for doubtful trade
receivables 1,599 72 66 75 1,812 – 1,812
Allowance/(write-back of) for
inventory obsolescence 466 56 (75) 44 491 – 491
Write-back of impairment
on property, plant and
equipment (8) – – – (8) – (8)
Bad debts recovered – – – (8) (8) – (8)
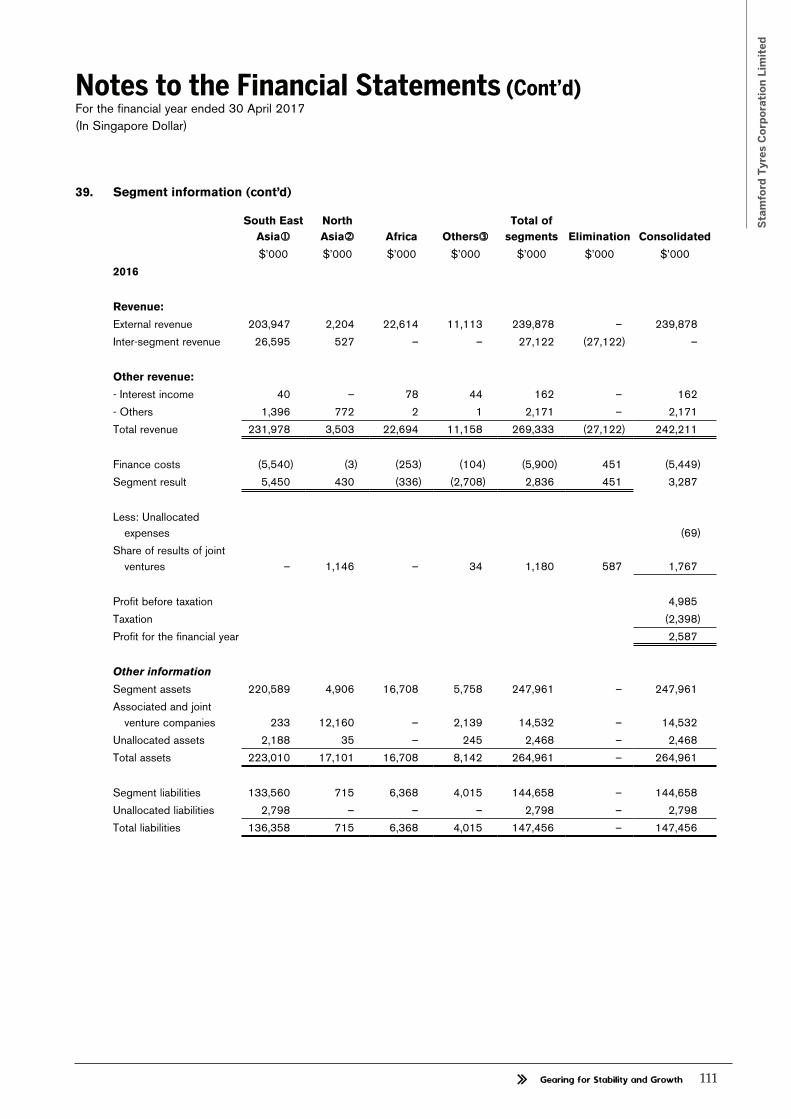
Sta
mfo
rd T
yres
Co
rpo
rati
on
Lim
ited
Notes to the Financial Statements (Cont’d)For the financial year ended 30 April 2017
(In Singapore Dollar)
111
39. Segment information (cont’d)
South East
Asia
North
Asia Africa Others
Total of
segments Elimination Consolidated
$’000 $’000 $’000 $’000 $’000 $’000 $’000
2016
Revenue:
External revenue 203,947 2,204 22,614 11,113 239,878 – 239,878
Inter-segment revenue 26,595 527 – – 27,122 (27,122) –
Other revenue:
- Interest income 40 – 78 44 162 – 162
- Others 1,396 772 2 1 2,171 – 2,171
Total revenue 231,978 3,503 22,694 11,158 269,333 (27,122) 242,211
Finance costs (5,540) (3) (253) (104) (5,900) 451 (5,449)
Segment result 5,450 430 (336) (2,708) 2,836 451 3,287
Less: Unallocated
expenses (69)
Share of results of joint
ventures – 1,146 – 34 1,180 587 1,767
Profit before taxation 4,985
Taxation (2,398)
Profit for the financial year 2,587
Other information
Segment assets 220,589 4,906 16,708 5,758 247,961 – 247,961
Associated and joint
venture companies 233 12,160 – 2,139 14,532 – 14,532
Unallocated assets 2,188 35 – 245 2,468 – 2,468
Total assets 223,010 17,101 16,708 8,142 264,961 – 264,961
Segment liabilities 133,560 715 6,368 4,015 144,658 – 144,658
Unallocated liabilities 2,798 – – – 2,798 – 2,798
Total liabilities 136,358 715 6,368 4,015 147,456 – 147,456

Sta
mfo
rd T
yres
Co
rpo
rati
on
Lim
ited
Notes to the Financial Statements (Cont’d)For the financial year ended 30 April 2017
(In Singapore Dollar)
112
39. Segment information (cont’d)
South East
Asia
North
Asia Africa Others
Total of
segments Elimination Consolidated
$’000 $’000 $’000 $’000 $’000 $’000 $’000
2016
Other segment information
Additions to non-current
assets
- Property, plant and
equipment 13,139 155 89 9 13,392 – 13,392
Significant non-cash
expenses:
Amortisation and depreciation 7,549 71 155 102 7,877 – 7,877
Allowance for/(write-back of)
doubtful trade receivables 1,265 – (77) 715 1,903 – 1,903
(Write-back of)/allowance
for inventory obsolescence (820) 42 8 237 (533) – (533)
Write-back of impairment
on property, plant and
equipment (8) – – – (8) – (8)
Bad debts recovered (21) (1) (10) – (32) – (32)
Note:
Includes Singapore, Malaysia, Philippines, Thailand, Indonesia, Vietnam and Brunei
Includes Hong Kong and People’s Republic of China
Includes North America/Latin America, Australia and India
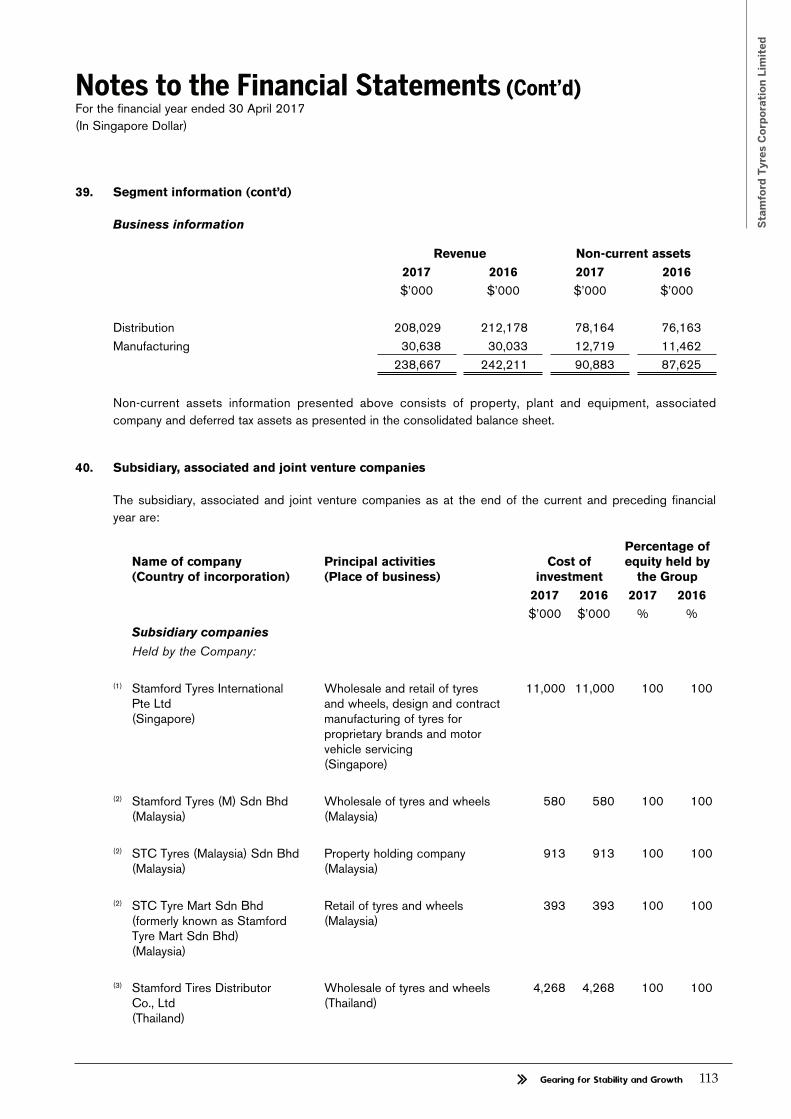
Sta
mfo
rd T
yres
Co
rpo
rati
on
Lim
ited
Notes to the Financial Statements (Cont’d)For the financial year ended 30 April 2017
(In Singapore Dollar)
113
39. Segment information (cont’d)
Business information
Revenue Non-current assets
2017 2016 2017 2016
$’000 $’000 $’000 $’000
Distribution 208,029 212,178 78,164 76,163
Manufacturing 30,638 30,033 12,719 11,462
238,667 242,211 90,883 87,625
Non-current assets information presented above consists of property, plant and equipment, associated
company and deferred tax assets as presented in the consolidated balance sheet.
40. Subsidiary, associated and joint venture companies
The subsidiary, associated and joint venture companies as at the end of the current and preceding financial
year are:
Name of company
(Country of incorporation)
Principal activities
(Place of business)
Cost of
investment
Percentage of
equity held by
the Group
2017 2016 2017 2016
$’000 $’000 % %
Subsidiary companies
Held by the Company:
(1) Stamford Tyres International
Pte Ltd
(Singapore)
Wholesale and retail of tyres
and wheels, design and contract
manufacturing of tyres for
proprietary brands and motor
vehicle servicing
(Singapore)
11,000 11,000 100 100
(2) Stamford Tyres (M) Sdn Bhd
(Malaysia)
Wholesale of tyres and wheels
(Malaysia)
580 580 100 100
(2) STC Tyres (Malaysia) Sdn Bhd
(Malaysia)
Property holding company
(Malaysia)
913 913 100 100
(2) STC Tyre Mart Sdn Bhd
(formerly known as Stamford
Tyre Mart Sdn Bhd)
(Malaysia)
Retail of tyres and wheels
(Malaysia)
393 393 100 100
(3) Stamford Tires Distributor
Co., Ltd
(Thailand)
Wholesale of tyres and wheels
(Thailand)
4,268 4,268 100 100

Sta
mfo
rd T
yres
Co
rpo
rati
on
Lim
ited
Notes to the Financial Statements (Cont’d)For the financial year ended 30 April 2017
(In Singapore Dollar)
114
40. Subsidiary, associated and joint venture companies (cont’d)
Name of company
(Country of incorporation)
Principal activities
(Place of business)
Cost of
investment
Percentage of
equity held by
the Group
2017 2016 2017 2016
$’000 $’000 % %
Subsidiary companies (cont’d)
Held by the Company:
(3) # STC Tyres Limited
(Thailand)
Inactive
(Thailand)
288 288 49 49
(3) # Stamford Auto Mart Limited
(Thailand)
Inactive
(Thailand)
21 21 49 49
(4) Stamford Tyres (Hong Kong)
Limited
(Hong Kong)
Investment holding and wholesale
of tyres
(Hong Kong and People’s Republic
of China)
6,523 6,523 100 100
(4) Boon Tyre Holdings Limited
(Hong Kong)
Investment and property holding
company
(Hong Kong and United Kingdom)
@ @ 100 100
## Stamford Tires and Wheels, Inc.
(United States of America)
Wholesale of tyres and wheels
(Latin America and United States
of America)
14 14 100 100
(5) Stamford Tyres (Africa) (Pty) Ltd
(South Africa)
Wholesale of tyres and wheels
(South Africa)
15,568 15,568 100 100
(7) PT Stamford Tyres Indonesia
(Indonesia)
Wholesale and retail of tyres and
retreading of tyres
(Indonesia)
726 726 100 100
(7) PT Stamford Tyres Distributor
Indonesia
(Indonesia)
Wholesale of tyres and wheels
(Indonesia)
6,637 6,637 100 100
(1) Sumo Tires Pte Ltd
(Singapore)
Inactive
(Singapore)
@ @ 100 100
(1) Stamford Auto City Pte Ltd
(Singapore)
Inactive
(Singapore)
200 200 100 100

Sta
mfo
rd T
yres
Co
rpo
rati
on
Lim
ited
Notes to the Financial Statements (Cont’d)For the financial year ended 30 April 2017
(In Singapore Dollar)
115
40. Subsidiary, associated and joint venture companies (cont’d)
Name of company
(Country of incorporation)
Principal activities
(Place of business)
Cost of
investment
Percentage of
equity held by
the Group
2017 2016 2017 2016
$’000 $’000 % %
Subsidiary companies (cont’d)
Held by the Company:
(1) Wahsan Trading Pte Ltd
(Singapore)
Inactive
(Singapore)
218 218 100 100
(3) Stamford Sport Wheels Company
Limited
(Thailand)
Manufacture of aluminium
alloy wheels
(Thailand)
19,898 19,898 100 100
## Stamford International Trading
(Tianjin) Co. Ltd.
(People’s Republic of China)
Inactive
(People’s Republic of China)
322 322 100 100
## Stamford Tyres Australia Pty
Limited
(Australia)
Wholesale of tyres and wheels
(Australia)
6,770 6,770 100 100
## Stamford Tyres Philippines, Inc.
(Philippines)
Inactive
(Philippines)
361 361 100 100
(8)
++
Stamford Tyres Distributors India
Private Limited
(India)
Wholesale of tyres
(India)
2,493 2,493 100 100
## Stamford Tyres Do Brazil
Participacoes LTDA
(Brazil)
Dormant
(Brazil)
281 281 100 100
(13)
++
Stamford Tyres Vietnam Company
Limited
(Vietnam)
Wholesale of tyres and wheels
(Vietnam)
623 623 100 100
(10) Stamford Tyres (B) Sdn Bhd
(Brunei)
Wholesale of tyres and wheels
(Brunei)
25 25 100 100
78,122 78,122

Sta
mfo
rd T
yres
Co
rpo
rati
on
Lim
ited
Notes to the Financial Statements (Cont’d)For the financial year ended 30 April 2017
(In Singapore Dollar)
116
40. Subsidiary, associated and joint venture companies (cont’d)
Name of company
(Country of incorporation)
Principal activities
(Place of business)
Percentage of
equity held by
the Group
2017 2016
% %
Subsidiary companies
Held by Stamford Tyres (Hong Kong) Limited:
## Stamford Tyres (Guangzhou) Limited
(People’s Republic of China)
Dormant
(People’s Republic of China)
100 100
Held by Stamford Tyres (M) Sdn Bhd:
(2) Stamford Retread Industries (M) Sdn Bhd
(Malaysia)
Retreading of tyres (formerly retail
of motor vehicles)
(Malaysia)
100 100
Held by Boon Tyre Holdings Limited:
(1) Raffles Resources Singapore Pte Ltd
(Singapore)
Inactive
(Singapore)
100 100
Joint venture companies
Held by the Company:
(6) + Tyre Pacific (HK) Limited
(Hong Kong)
Investment holding and wholesale
of tyres
(Hong Kong, Vietnam and
People’s Republic of China)
50 50
(11) +++Falken Tyre India Private Ltd
(India)
Distribution and sale of
replacement tyres
(India)
40 40
Held by Tyre Pacific (HK) Limited:
(6) + Real Courage Limited
(Hong Kong)
Property holding company
(Hong Kong)
50 50
## Guangzhou Orizz Mega Outlet Co Ltd
(People’s Republic of China)
Wholesale of tyres
(People’s Republic of China)
50 50
(9) + Orizz (Shanghai) Limited
(People’s Republic of China)
Wholesale of tyres
(People’s Republic of China)
50 50
(9) + Shanghai Orizz Mega Outlet Co Ltd
(People’s Republic of China)
Wholesale of tyres
(People’s Republic of China)
50 50
(12) + Tyre Pacific (Vietnam) Limited Wholesale of tyres
(Vietnam)
50 50

Sta
mfo
rd T
yres
Co
rpo
rati
on
Lim
ited
Notes to the Financial Statements (Cont’d)For the financial year ended 30 April 2017
(In Singapore Dollar)
117
40. Subsidiary, associated and joint venture companies (cont’d)
Name of company
(Country of incorporation)
Principal activities
(Place of business)
Percentage of
equity held by
the Group
2017 2016
% %
Associated company
Held by the Company:
## Stamford Tyres (Thailand) Co., Ltd
(Thailand)
Inactive
(Thailand)
49 49
@ Cost of investment at one hundred units of local currency or less.
# The company is considered a subsidiary company and included in the consolidated financial statements
as the Group has the power to control, by agreement, the financial and operating policies of the
management of the Company.
## Not required to be audited under the laws of the country of incorporation. Unaudited financial statements
have been used for the preparation of the consolidated financial statements of the Group.
+ Statutory year end is 31 December. A limited review of the financial statements has been performed for
the purpose of the preparation of the consolidated financial statements of the Group.
++ Statutory year end is 31 March. Unaudited financial statements has been used for the preparation of the
consolidated financial statements of the Group.
+++ Statutory year end is 31 March. A limited review of the financial statements has been performed for the
purpose of the preparation of the consolidated financial statements of the Group.
Auditors(1) Ernst & Young LLP, Singapore, Public Accountants and Chartered Accountants(2) Ernst & Young, Malaysia, Chartered Accountants(3) Ernst & Young Office Limited, Thailand, Certified Public Accountants(4) Paul Wong & Co., Hong Kong, CPAs, Certified Public Accountants(5) Ernst & Young, South Africa, Chartered Accountants(6) Ernst & Young, Hong Kong, Certified Public Accountants(7) Herman Dody Tanumihardja & Rekan, Indonesia, Registered Public Accounting Firm(8) Jai Prakash Upadhahay & Co., India, Chartered Accountants(9) BDO China Shu Lun Pan, People’s Republic of China, Certified Public Accountants(10) WKA Associates, Brunei, Certified Public Accountants and Auditors(11) BSR & Associates LLP, India, Chartered Accountants(12) Vietnam Accounting Auditing Consulting Company Limited (13) AS Auditing Company
40. Authorisation of financial statements for issue
The financial statements for the year ended 30 April 2017 were authorised for issue in accordance with a
resolution of the directors on 28 July 2017.

Sta
mfo
rd T
yres
Co
rpo
rati
on
Lim
ited
118
List of PropertiesAs at 30 April 2017
Location Tenure of Lease Area (sqm) Description
SINGAPORE
19 Lok Yang Way, JurongSingapore 628635
30 year lease from 2006
18,024.7 Corporate office, tyre retail service centre with showroom and warehouse
21 Lok Yang Way, Jurong Singapore 628636
60 year lease from 1973 renewed in 2013 until 2035 (22 years)
13,122.1 (land area)
22,591.09 (gross floor area)
Truck service centre and warehouse
455 Macpherson RoadSingapore 368173
63 year lease from 2001
951.0 Tyre retail centre and showroom
50 Bukit Batok Street 23 #02-19 Midview Building Singapore 659578
55 year lease from 2002
276.0 Tyre retail centre and showroom
10 Admiralty Street #01-85 North Link Building Singapore 757695
10 Admiralty Street #01-78, North Link Building Singapore 757695
56 year lease from 2003
47 year lease from2012
689.0
521.0
Tyre retail centre and showroom
Commercial truck centre
31 Loyang WaySingapore 508729
16 year lease from 2004
2,510.4 Tyre retail centre and showroom
10 Kaki Bukit Road 2, #01-11 & #01-12 First East Centre Singapore 417868
28 year lease from 2011
458.6 Tyre retail centre and showroom
110 Tuas South Avenue 3 #01-02/03The Index, Singapore, 637369
30 year lease from 2013
585.0 Truck service centre
MALAYSIA16 Jalan Juru Nilai U1/20 Section U1Hicom Glenmarie Industrial Park40150 Shah Alam, Selangor, Malaysia
Freehold 6,968.0 Corporate office, tyre retail and service centre with showroom and warehouse
Lot L2-22,23,23A, 25 Seri Alam Industrial Park, Sungai Kapar Indah, Klang, Selangor, Malaysia
Freehold 33,430.0 Industrial land (under development)
THAILAND111/2, 5 Moo 2, Highway 340, Suphanburi RoadTambon Saiyai, Amphur Sainoi, Nonthaburi 11150Thailand
Freehold 14,636.0 Wheel factory with showroom and warehouse
111/8, 9 Moo 2, Highway 340, Suphanburi RoadTambon Saiyai, Amphur Sainoi, Nonthaburi 11150Thailand
Freehold 16,380.0 Second wheel factory
INDONESIAJalan Boulevard Raya Blok PA19 No. 4-5Pengangsaan Dua, Kelapa GadingJakarta Utara, Indonesia 14250
20 year lease from 2011
144.0 Office with warehouse, retail and service centre
Lot D-4 Jalan Kuala KuninganKuala Kencana, Light Industrial ParkTembagapura, Mimika Baru Papua, Indonesia
20 year lease from 2014
12,000.0 Office with truck service centre, warehouse and retreading plant
Jalan Projakal Rt. 047 Kelurahan BatuAmpar Kecamatan Balikpapan Utara, Indonesia
30 year lease from 2013
2,973.0 Office with warehouse
SOUTH AFRICAERF 460, Cnr Horn Street 8 Brine Avenue,Chloorkop Ext 23 Kempton Park, Johannesburg, South Africa
Freehold 16,091.0 Open storage for tyres
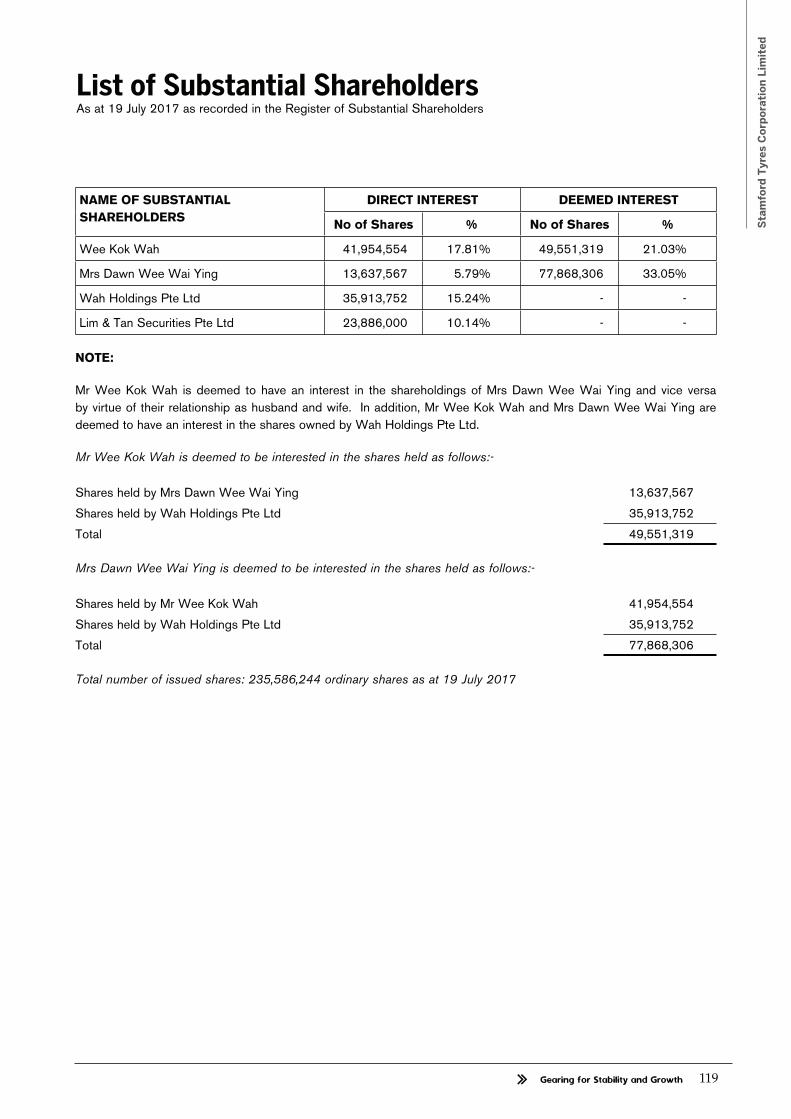
Sta
mfo
rd T
yres
Co
rpo
rati
on
Lim
ited
119
NAME OF SUBSTANTIAL
SHAREHOLDERS
DIRECT INTEREST DEEMED INTEREST
No of Shares % No of Shares %
Wee Kok Wah 41,954,554 17.81% 49,551,319 21.03%
Mrs Dawn Wee Wai Ying 13,637,567 5.79% 77,868,306 33.05%
Wah Holdings Pte Ltd 35,913,752 15.24% - -
Lim & Tan Securities Pte Ltd 23,886,000 10.14% - -
NOTE:
Mr Wee Kok Wah is deemed to have an interest in the shareholdings of Mrs Dawn Wee Wai Ying and vice versa
by virtue of their relationship as husband and wife. In addition, Mr Wee Kok Wah and Mrs Dawn Wee Wai Ying are
deemed to have an interest in the shares owned by Wah Holdings Pte Ltd.
Mr Wee Kok Wah is deemed to be interested in the shares held as follows:-
Shares held by Mrs Dawn Wee Wai Ying 13,637,567
Shares held by Wah Holdings Pte Ltd 35,913,752
Total 49,551,319
Mrs Dawn Wee Wai Ying is deemed to be interested in the shares held as follows:-
Shares held by Mr Wee Kok Wah 41,954,554
Shares held by Wah Holdings Pte Ltd 35,913,752
Total 77,868,306
Total number of issued shares: 235,586,244 ordinary shares as at 19 July 2017
List of Substantial ShareholdersAs at 19 July 2017 as recorded in the Register of Substantial Shareholders
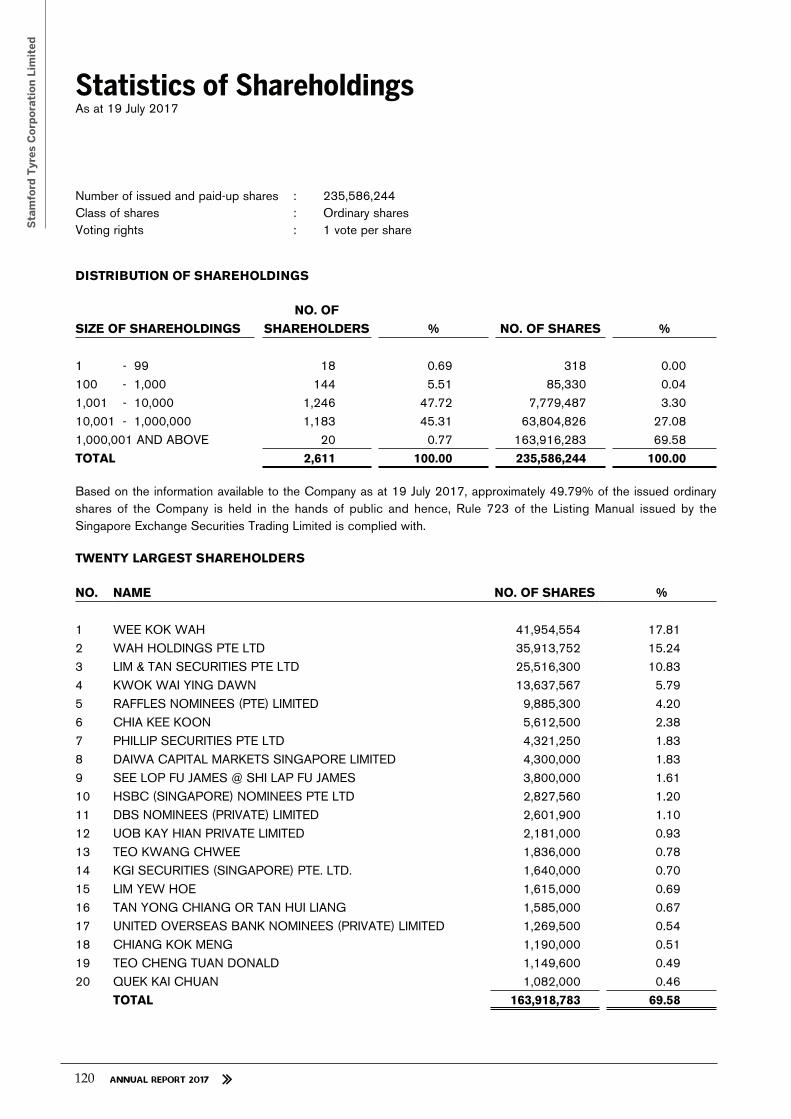
Sta
mfo
rd T
yres
Co
rpo
rati
on
Lim
ited
120
Statistics of ShareholdingsAs at 19 July 2017
Number of issued and paid-up shares : 235,586,244
Class of shares : Ordinary shares
Voting rights : 1 vote per share
DISTRIBUTION OF SHAREHOLDINGS
NO. OF
SIZE OF SHAREHOLDINGS SHAREHOLDERS % NO. OF SHARES %
1 - 99 18 0.69 318 0.00
100 - 1,000 144 5.51 85,330 0.04
1,001 - 10,000 1,246 47.72 7,779,487 3.30
10,001 - 1,000,000 1,183 45.31 63,804,826 27.08
1,000,001 AND ABOVE 20 0.77 163,916,283 69.58
TOTAL 2,611 100.00 235,586,244 100.00
Based on the information available to the Company as at 19 July 2017, approximately 49.79% of the issued ordinary
shares of the Company is held in the hands of public and hence, Rule 723 of the Listing Manual issued by the
Singapore Exchange Securities Trading Limited is complied with.
TWENTY LARGEST SHAREHOLDERS
NO. NAME NO. OF SHARES %
1 WEE KOK WAH 41,954,554 17.81
2 WAH HOLDINGS PTE LTD 35,913,752 15.24
3 LIM & TAN SECURITIES PTE LTD 25,516,300 10.83
4 KWOK WAI YING DAWN 13,637,567 5.79
5 RAFFLES NOMINEES (PTE) LIMITED 9,885,300 4.20
6 CHIA KEE KOON 5,612,500 2.38
7 PHILLIP SECURITIES PTE LTD 4,321,250 1.83
8 DAIWA CAPITAL MARKETS SINGAPORE LIMITED 4,300,000 1.83
9 SEE LOP FU JAMES @ SHI LAP FU JAMES 3,800,000 1.61
10 HSBC (SINGAPORE) NOMINEES PTE LTD 2,827,560 1.20
11 DBS NOMINEES (PRIVATE) LIMITED 2,601,900 1.10
12 UOB KAY HIAN PRIVATE LIMITED 2,181,000 0.93
13 TEO KWANG CHWEE 1,836,000 0.78
14 KGI SECURITIES (SINGAPORE) PTE. LTD. 1,640,000 0.70
15 LIM YEW HOE 1,615,000 0.69
16 TAN YONG CHIANG OR TAN HUI LIANG 1,585,000 0.67
17 UNITED OVERSEAS BANK NOMINEES (PRIVATE) LIMITED 1,269,500 0.54
18 CHIANG KOK MENG 1,190,000 0.51
19 TEO CHENG TUAN DONALD 1,149,600 0.49
20 QUEK KAI CHUAN 1,082,000 0.46
TOTAL 163,918,783 69.58

Sta
mfo
rd T
yres
Co
rpo
rati
on
Lim
ited
121
NOTICE IS HEREBY GIVEN that the Twenty-Eighth Annual General Meeting of the Company will be held on Monday,
28 August 2017 at 3.00 p.m. at 19 Lok Yang Way, Singapore 628635 for the purpose of transacting the following
business:-
ORDINARY BUSINESS
1. To receive and adopt the Directors’ Statement, Auditor’s Report and Audited Financial Statements for the
financial year ended 30 April 2017. Resolution 1
2. To approve the Directors’ fees of up to $377,000 for the financial year ending 30 April 2018.
[See explanatory note (a)] Resolution 2
3. To declare the payment of a first and final tax exempt (one-tier) dividend of 1.5 cents per ordinary share for the
financial year ended 30 April 2017. Resolution 3
4. To re-elect Mr Sam Chong Keen, who is retiring pursuant to Article 99 of the Company’s Constitution, as a
Director of the Company. [See explanatory note (b)] Resolution 4
5. To re-elect Mr Goh Chee Wee, who is retiring pursuant to Article 99 of the Company’s Constitution, as a
Director of the Company. [See explanatory note (c)] Resolution 5
6. To re-appoint Ernst & Young LLP as the Company’s Auditor and to authorise the Directors to fix their
remuneration. Resolution 6
SPECIAL BUSINESS
To consider and, if thought fit, to pass the following resolution as an ordinary resolution:
7. Share Issue Mandate
That authority be and is hereby given to the Directors of the Company to:
(a) (i) issue shares of the Company (“shares”) whether by way of rights, bonus or otherwise; and/or
(ii) make or grant offers, agreements or options (collectively, “Instruments”) that might or would
require shares to be issued, including but not limited to the creation and issue of (as well as
adjustments to) warrants, debentures or other instruments convertible into shares
at any time and upon such terms and conditions and for such purposes and to such persons as the
Directors may in their absolute discretion deem fit; and
(b) (notwithstanding the authority conferred by this Resolution may have ceased to be in force) issue shares
in pursuance of any Instruments made or granted by the Directors while this Resolution was in force,
Notice of Annual General Meeting

Sta
mfo
rd T
yres
Co
rpo
rati
on
Lim
ited
122
provided that:
(i) the aggregate number of shares to be issued pursuant to this Resolution (including shares to be
issued in pursuance of Instruments made or granted pursuant to this Resolution) does not exceed
50% of the total number of issued shares (excluding treasury shares and subsidiary holdings)
of the Company (as calculated in accordance with sub-paragraph (2) below), of which the
aggregate number of shares to be issued other than on a pro-rata basis to shareholders of the
Company (including shares to be issued in pursuance of Instruments made or granted pursuant
to this Resolution) does not exceed 20% of the total number of issued shares (excluding treasury
shares and subsidiary holdings) the Company (as calculated in accordance with sub-paragraph
(2) below);
(ii) (subject to such manner of calculation as may be prescribed by the Singapore Exchange
Securities Trading Limited) for the purpose of determining the aggregate number of shares that
may be issued under sub-paragraph (1) above, the total number of shares (excluding treasury
shares and subsidiary holdings) shall be based on the total number of issued shares (excluding
treasury shares and subsidiary holdings) of the Company at the time this Resolution is passed,
after adjusting for:
(a) new shares arising from the conversion or exercise of any convertible securities or share
options or vesting of share awards which are outstanding at the time this Resolution is
passed; and
(b) any subsequent bonus issue, consolidation or subdivision of shares;
and, in sub-paragraph (i) above and this sub-paragraph (ii), “subsidiary holdings” has the meaning
given to it in the Listing Manual of the Singapore Exchange Securities Trading Limited;
(iii) in exercising the authority conferred by this Resolution, the Company shall comply with the provisions
of the Listing Manual of the Singapore Exchange Securities Trading Limited for the time being in force
(unless such compliance has been waived by the Singapore Exchange Securities Trading Limited) and
the Constitution for the time being of the Company; and
(iv) (unless revoked or varied by the Company in general meeting) the authority conferred by this Resolution
shall continue in force until the conclusion of the next Annual General Meeting of the Company or the
date by which the next Annual General Meeting of the Company is required by law to be held, whichever
is the earlier.
[See explanatory note (d)] Resolution 7
Notice of Annual General Meeting (Cont’d)

Sta
mfo
rd T
yres
Co
rpo
rati
on
Lim
ited
123
NOTICE IS HEREBY GIVEN that the Share Transfer Books and Register of Members of the Company will be closed
on 7 September 2017 at 5.00 p.m. for the purpose of determining shareholders’ entitlement to the proposed first
and final tax exempt (one-tier) dividend of 1.5 cents per ordinary share for the financial year ended 30 April 2017 (the
“Proposed Dividend”).
Duly completed registrable transfers received by the Company’s Registrar, Boardroom Corporate & Advisory Services
Pte. Ltd. of 50 Raffles Place, Singapore Land Tower #32-01, Singapore 048623, up to 5.00 p.m. on 7 September
2017 will be registered before shareholders’ entitlement to the Proposed Dividend is determined.
Shareholders (being Depositors) whose securities accounts with The Central Depository (Pte) Limited (“CDP”) are
credited with shares as at 5.00 p.m. on 7 September 2017 will be entitled to the Proposed Dividend.
The Proposed Dividend, if approved at the Twenty-Eighth Annual General Meeting of the Company to be held on 28
August 2017, will be paid on 18 September 2017.
By Order Of The Board
Lo Swee Oi
Company Secretary
4 August 2017
Singapore
Explanatory Notes:
(a) The proposed ordinary Resolution 2 above, if passed, will facilitate the payment of Directors’ fees during
the financial year in which the fees are incurred, that is, during the financial year ending 30 April 2018. The
comparative amount for Directors’ fees for the financial year ended 30 April 2017 is unchanged at S$377,000.
(b) Mr Sam Chong Keen, if re-elected, will continue to serve as a member of the Audit Committee and Chairman
of the Nominating and Remuneration Committees. He is considered by the Board of Directors as an
Independent Director. For more information on Mr Sam, please refer to the “Board of Directors” and “Corporate
Governance” sections in the Annual Report 2017.
(c) Mr Goh Chee Wee is considered by the Board of Directors as an Independent Director. For more information
on Mr Goh, please refer to the “Board of Directors” and “Corporate Governance” sections in the Annual Report
2017.
(d) The proposed ordinary resolution 7 above, if passed, will empower the Directors of the Company from the date
of this Annual General Meeting to issue shares in the Company up to the limits as specified in the resolution
for such purposes as they consider would be in the interests of the Company. This authority will continue in
force until the next Annual General Meeting of the Company, unless previously revoked or varied at a general
meeting.
Notice of Annual General Meeting (Cont’d)
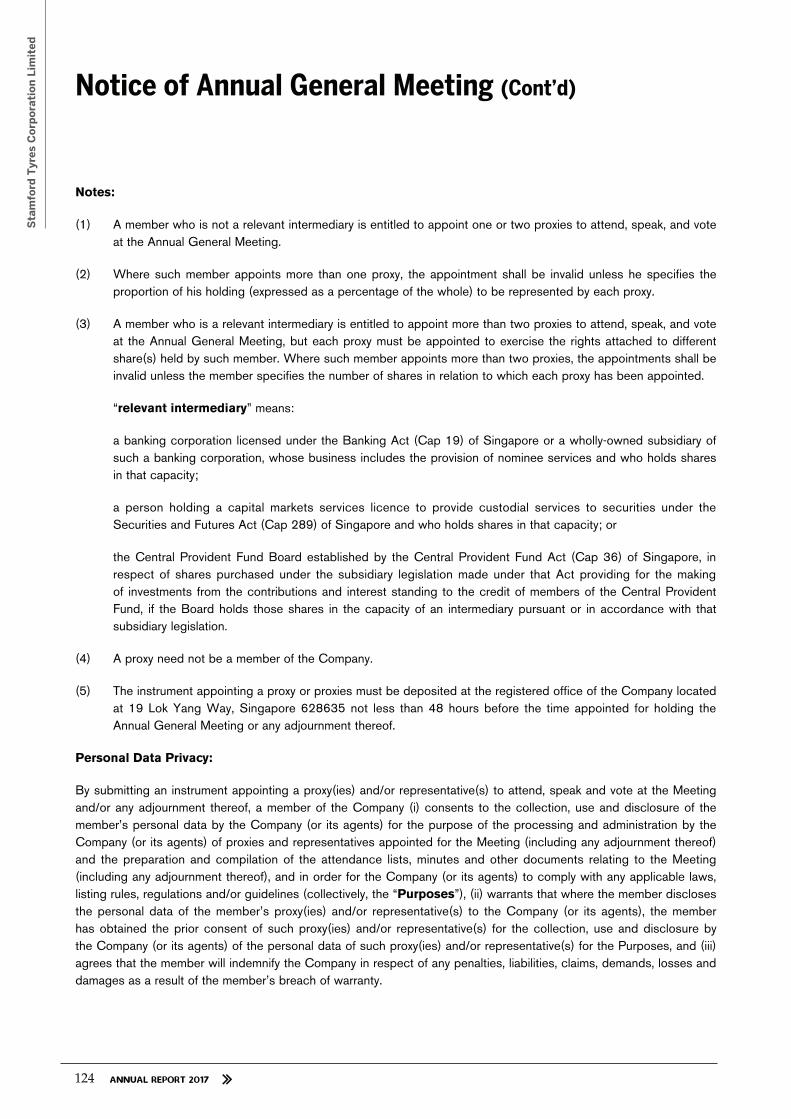
Sta
mfo
rd T
yres
Co
rpo
rati
on
Lim
ited
124
Notes:
(1) A member who is not a relevant intermediary is entitled to appoint one or two proxies to attend, speak, and vote
at the Annual General Meeting.
(2) Where such member appoints more than one proxy, the appointment shall be invalid unless he specifies the
proportion of his holding (expressed as a percentage of the whole) to be represented by each proxy.
(3) A member who is a relevant intermediary is entitled to appoint more than two proxies to attend, speak, and vote
at the Annual General Meeting, but each proxy must be appointed to exercise the rights attached to different
share(s) held by such member. Where such member appoints more than two proxies, the appointments shall be
invalid unless the member specifies the number of shares in relation to which each proxy has been appointed.
“relevant intermediary” means:
a banking corporation licensed under the Banking Act (Cap 19) of Singapore or a wholly-owned subsidiary of
such a banking corporation, whose business includes the provision of nominee services and who holds shares
in that capacity;
a person holding a capital markets services licence to provide custodial services to securities under the
Securities and Futures Act (Cap 289) of Singapore and who holds shares in that capacity; or
the Central Provident Fund Board established by the Central Provident Fund Act (Cap 36) of Singapore, in
respect of shares purchased under the subsidiary legislation made under that Act providing for the making
of investments from the contributions and interest standing to the credit of members of the Central Provident
Fund, if the Board holds those shares in the capacity of an intermediary pursuant or in accordance with that
subsidiary legislation.
(4) A proxy need not be a member of the Company.
(5) The instrument appointing a proxy or proxies must be deposited at the registered office of the Company located
at 19 Lok Yang Way, Singapore 628635 not less than 48 hours before the time appointed for holding the
Annual General Meeting or any adjournment thereof.
Personal Data Privacy:
By submitting an instrument appointing a proxy(ies) and/or representative(s) to attend, speak and vote at the Meeting
and/or any adjournment thereof, a member of the Company (i) consents to the collection, use and disclosure of the
member’s personal data by the Company (or its agents) for the purpose of the processing and administration by the
Company (or its agents) of proxies and representatives appointed for the Meeting (including any adjournment thereof)
and the preparation and compilation of the attendance lists, minutes and other documents relating to the Meeting
(including any adjournment thereof), and in order for the Company (or its agents) to comply with any applicable laws,
listing rules, regulations and/or guidelines (collectively, the “Purposes”), (ii) warrants that where the member discloses
the personal data of the member’s proxy(ies) and/or representative(s) to the Company (or its agents), the member
has obtained the prior consent of such proxy(ies) and/or representative(s) for the collection, use and disclosure by
the Company (or its agents) of the personal data of such proxy(ies) and/or representative(s) for the Purposes, and (iii)
agrees that the member will indemnify the Company in respect of any penalties, liabilities, claims, demands, losses and
damages as a result of the member’s breach of warranty.
Notice of Annual General Meeting (Cont’d)


STAMFORD TYRES CORPORATION LIMITEDCompany Registration No: 198904416M
(Incorporated in the Republic of Singapore)
ANNUAL GENERAL MEETING
PROXY FORM
I/We (Name) ___________________________________ NRIC/Passport No./Co. Regn. No. _______________________________
of (Address)_________________________________________________________________________________________________
being a member/members of Stamford Tyres Corporation Limited (the “Company”) hereby appoint:
Name AddressNRIC/Passport
Number
Proportion of
Shareholdings (%)
and/or (delete as appropriate)
Name AddressNRIC/Passport
Number
Proportion of
Shareholdings (%)
or failing the person, or either or both of the persons, referred to above, the Chairman of the Annual General Meeting (the
“Meeting”), as my/our proxy/proxies to attend and to vote for me/us on my/our behalf at the Meeting of the Company to be
convened at 19 Lok Yang Way, Singapore 628635 on 28 August 2017 at 3.00 p.m. and at any adjournment thereof. I/We
direct my/our proxy/proxies to vote for or against the resolutions to be proposed at the Meeting as indicated hereunder. If no
specific direction as to voting is given, the proxy/proxies will vote or abstain from voting at his/their discretion, as he/they will
on any other matter arising at the Meeting.
No. Resolutions For Against
ORDINARY BUSINESS
1. Adoption of Directors’ Statement, Auditor’s Report and Audited Financial Statements
2. Approval of Directors’ Fees
3. Declaration of First and Final Dividend
4. Re-election of Mr Sam Chong Keen as Director
5. Re-election of Mr Goh Chee Wee as Director
6. Re-appointment of Ernst & Young LLP as Auditor and authorization to Directors to fix
their remuneration
SPECIAL BUSINESS
7. Authority to issue shares pursuant to the Share Issue Mandate
(If you wish to exercise all your votes “For” or “Against”, please indicate your vote with a tick “ ”. Alternatively, please indicate
the number of votes “For” or “Against”.)
Dated this ___________ day of ____________________ 2017
_________________________________________
Signature(s) of Member(s)/Common Seal
IMPORTANT: PLEASE READ NOTES OVERLEAF
Important
1. A relevant intermediary may appoint more than two proxies to attend, speak, and vote at the
Annual General Meeting. Please see Note 3 overleaf for the definition of “relevant intermediary”.
2. For investors who have used their CPF monies to buy Stamford Tyres Corporation Limited shares,
this proxy form is not valid for use and shall be ineffective for all intents and purposes if used or
purported to be used by them.
3. CPF investors are requested to contact their respective Agent Banks if they have any queries
regarding their appointment as proxies or the appointment of their Agent Banks as proxies for the
Annual General Meeting.
Total number of shares held:

NOTES
1. A member who is not a relevant intermediary is entitled to appoint one or two proxies to attend, speak and vote at the
Meeting.
2. Where such member appoints more than one proxy, the appointment shall be invalid unless he specifies the proportion of his
holding (expressed as a percentage of the whole) to be represented by each proxy.
3. A member who is a relevant intermediary is entitled to appoint more than two proxies to attend, speak and vote at the
Meeting, but each proxy must be appointed to exercise the rights attached to different share(s) held by such member. Where
such member appoints more than two proxies, the appointments shall be invalid unless the member specifies the number of
shares in relation to which each proxy has been appointed.
“relevant intermediary” means:
(a) a banking corporation licensed under the Banking Act (Cap 19) of Singapore or a wholly-owned subsidiary of such
a banking corporation, whose business includes the provision of nominee services and who holds shares in that
capacity;
(b) a person holding a capital markets services licence to provide custodial services to securities under the Securities
and Futures Act (Cap 289) of Singapore and who holds shares in that capacity; or
(c) the Central Provident Fund Board established by the Central Provident Fund Act (Cap 36) of Singapore, in respect
of shares purchased under the subsidiary legislation made under that Act providing for the making of investments
from the contributions and interest standing to the credit of members of the Central Provident Fund, if the Board
holds those shares in the capacity of an intermediary pursuant or in accordance with that subsidiary legislation.
4. A proxy need not be a member of the Company.
5. If no name is inserted in the space for the name of your proxy on the form of proxy, the Chairman of the Meeting will act as
your proxy.
6. Completion and return of this instrument appointing a proxy shall not preclude a member from attending and voting at the
Meeting. Any appointment of a proxy or proxies shall be deemed to be revoked if a member attends the Meeting in person,
and in such event, the Company reserves the right to refuse to admit any person or persons appointed under the instrument
of proxy, to the Meeting.
7. A member should insert the total number of shares held. If the member has shares entered against his name in the
Depository Register as defined in Section 81SF of the Securities and Futures Act (Cap 289) of Singapore, he should insert
that number of shares. If the member has shares registered in his name in the Register of Members of the Company, he
should insert that number of shares. If the member has shares entered against his name in the Depository Register and
registered in his name in the Register of Members, he should insert the aggregate number of shares.
8. If no number is inserted, this instrument of proxy will be deemed to relate to all shares held by the member.
9. The instrument appointing a proxy or proxies must be deposited at the registered office of the Company located at 19 Lok Yang
Way, Singapore 628635 not less than 48 hours before the time appointed for holding the Meeting or any adjournment thereof.
10. The instrument appointing a proxy or proxies must be under the hand of the appointor or of his attorney duly authorised in
writing. Where the instrument appointing a proxy or proxies is executed by a corporation, it must be executed either under its
common seal or under the hand of its attorney or a duly authorised officer.
11. Where an instrument appointing a proxy or proxies is signed on behalf of the appointor by an attorney, the letter or power of
attorney or a duly certified copy thereof must (failing previous registration with the Company) be lodged with the instrument
of proxy, failing which the instrument may be treated as invalid.
12. A corporation which is a member may authorise by resolution of its directors or other governing body such person as it
thinks fit to act as its representative at the Meeting, in accordance with Section 179 of the Companies Act (Cap 50) of
Singapore.
13. CPF Investors who buy shares in the Company may attend and cast their votes at the Meeting in person. CPF Investors who
are unable to attend the Meeting but would like to vote may inform their respective Agent Banks to appoint the Chairman of
the Meeting to act as their proxy, in which case, the CPF Investor shall be precluded from attending the Meeting.
14. The Company shall be entitled to reject an instrument of proxy which is incomplete, improperly completed, illegible or where
the true intentions of the appointor are not ascertainable from the instructions of the appointor specified on the instrument of
proxy. In addition, in the case of shares entered in the Depository Register, the Company may reject an instrument of proxy if
the member, being the appointor, is not shown to have shares entered against his name in the Depository Register as at 72
hours before the time appointed for holding the Meeting, as certified by The Central Depository (Pte) Limited to the Company.
Personal Data Privacy:
By submitting an instrument appointing a proxy(ies) and/or representative(s) to attend, speak and vote at the Meeting and/or any
adjournment thereof, a member of the Company (i) consents to the collection, use and disclosure of the member’s personal data
by the Company (or its agents) for the purpose of the processing and administration by the Company (or its agents) of proxies and
representatives appointed for the Meeting (including any adjournment thereof) and the preparation and compilation of the attendance
lists, minutes and other documents relating to the Meeting (including any adjournment thereof), and in order for the Company (or its
agents) to comply with any applicable laws, listing rules, regulations and/or guidelines (collectively, the “Purposes”), (ii) warrants
that where the member discloses the personal data of the member’s proxy(ies) and/or representative(s) to the Company (or its
agents), the member has obtained the prior consent of such proxy(ies) and/or representative(s) for the collection, use and disclosure
by the Company (or its agents) of the personal data of such proxy(ies) and/or representative(s) for the Purposes, and (iii) agrees that
the member will indemnify the Company in respect of any penalties, liabilities, claims, demands, losses and damages as a result of
the member’s breach of warranty.

17
Sta
mfo
rd T
yres
Co
rpo
rati
on
Lim
ited
Gearing for Stability and Growth
