Figure 12.1 | Commercial or near-commercial fossil energy technologies discussed in this chapter and their suitability for addressing four major energy-related challenges. Among the listed technology options, only coproduction systems (that include coprocessing of some biomass) are capable of addressing all major challenges.
Figure 12.4 | Alternative cost indices, each normalized to 100 in year 2000. The Chemical Engineering Plant Cost Index is the most appropriate one to use for many of the energy supply systems discussed in this chapter. Source: updated from Kreutz et al., 2008 .
Net Power 592 ---Net plant Efficiency, % HHV (overal 36.8%Net Power 691 ---Net plant Efficiency, % HHV (overal 24.9%
Vent
CCS
Output
Energy Flow Mass FlowMW kg/s
Vent 0.6 5CCS 0.9 8
PM/Ash
Energy Flow Mass FlowMW kg/s
Vent 0 13CCS 0 18
Limestone
Energy Flow Mass FlowMW kg/s
Vent - -CCS (29) 174
CO2
Energy Flow Mass FlowMW kg/s
Vent 216 645CCS 74 697
Stack Gas
Energy Flow Mass FlowMW kg/s
Vent 9 34CCS 13 50
Gypsum
Vent 392CCS 889
Raw Water UsageVolume Flow, liters/s
Mass and Energy Balance of a Subcritical Power Plant with and without CCS
Fossil Energy
Presenter
Presentation Notes
Figure 12.5 | Mass and energy balance of a typical subcritical power plant without and with carbon capture (‘Vent’ and ‘CCS,’ respectively). In the case with CCS, the net power output accounts for CO 2 compression to 153 bar, which is assumed to be suffi cient to transport and inject the CO 2 into an underground storage reservoir. Source: based on Woods et al., 2007 .
Net Power 589 ---Net plant Efficiency, % HHV (overal 39.1%Net Power 674 ---Net plant Efficiency, % HHV (overal 27.2%
Output
CCS
Vent
Energy Flow Mass FlowMW kg/s
Vent 0.6 5CCS 0.9 7
PM/Ash
Energy Flow Mass FlowMW kg/s
Vent 8 32CCS 12 46
Gypsum
Energy Flow Mass FlowMW kg/s
Vent 0 12CCS 0 17
Limestone
Energy Flow Mass FlowMW kg/s
Vent - -CCS (26) 158
CO2
Energy Flow Mass FlowMW kg/s
Vent 195 603CCS 43 624
Stack Gas
Vent 343CCS 767
Raw Water UsageVolume Flow, liters/s
Mass and Energy Balance of a Supercritical Power Plant with and without CCS
Fossil Energy
Presenter
Presentation Notes
Figure 12.6 | Mass and energy balance of a typical supercritical power plant without and with carbon capture (‘Vent’ and ‘CCS,’ respectively). In the case with CCS, the net power output accounts for CO 2 compression to 153 bar, which is assumed to be suffi cient to transport and inject the CO 2 into an underground storage reservoir. Source: based on Woods et al., 2007 .
Figure 12.7 | Generic representation of coal-IGCC technology. Shaded blocks indicate units added for carbon capture and storage (CCS). When CCS is utilized, the acid gas removal unit is re-designed to capture CO2 in addition to H2S.
Mass/Energy Balance for a Coal-IGCC Plant Using Slurry-Feed Gasifier, Radiant Syngas Cooling without and with CCS
Fossil Energy
Presenter
Presentation Notes
Figure 12.9 | Mass/energy balance for a coal-IGCC plant using slurry-feed gasifier, radiant syngas cooling without and with CO 2 capture (‘Vent’ and ‘CCS,’ respectively). In the CCS case, the net power output accounts for CO 2 compression to 153 bar, which is assumed to be sufficient to transport and inject the CO 2 into an underground storage reservoir. Source: based on Woods et al., 2007 .
Estimated Levelized Cost of Electricity Generation for Alternative Technologies as a Function of GHG Emissions Price
Fossil Energy
Presenter
Presentation Notes
Figure 12.10 | Estimated levelized cost of electricity generation (LCOE) for alternative technologies as a function of GHG emissions price. (See Table 12.6 , Table 12.7 , and Table 12.8 for detailed cost assumptions.) The CIGCC and BIGCC systems shown here correspond to the PEI performance and cost estimates shown in Table 12.7 .) Also shown is the 2007 average price paid to electricity generators in the United States (at zero GHG price) and how this price would change with GHG emissions price if the emissions are assumed to be the US grid-average for 2007 (636 kgCO 2 -eq/MWh).
Mass and Energy Balance of NGCC Without CO2 Capture (When Shaded Components are Excluded)
Fossil Energy
Presenter
Presentation Notes
Figure 12.11 | Mass and energy balance of NGCC without CO 2 capture (when shaded components are excluded). Including shaded components, the schematic represents NGCC with post-combustion CO 2 capture. For the case with CCS, the net power output accounts for CO 2 compression to 153 bar, which is assumed to be sufficient to transport and inject the CO 2 into an underground storage reservoir. Source: based on Woods et al., 2007 .
Baseline Life Cycle Emissions of CO2-eq for Fuels Derived from Petroleum
Fossil Energy
Presenter
Presentation Notes
Figure 12.15 | Baseline life cycle emissions of CO 2 -eq for fuels derived from petroleum and sold or distributed in the United States in 2005. Source: based on NETL, 2009 .
Carbon Flows for Conversion of Coal and Biomass to Liquid Fuels and Electricity
Fossil Energy
Presenter
Presentation Notes
Figure 12.18 | Carbon flows for conversion of coal and biomass to liquid fuels and electricity. When biomass is approximately 30% of the feedstock input (on a higher heating value basis), the net fuel cycle GHG emissions associated with the produced liquid fuels and electricity would be less than 10% of the emissions for the displaced fossil fuels. Source: Larson et al., 2010 .
Alternative Process Configurations for Maximizing Production of FTL
Fossil Energy
Presenter
Presentation Notes
Figure 12.20 | Alternative process confi gurations for maximizing production of FTL from coal (CTL-RC-CCS, blue-shaded components) or from biomass (BTL-RC-CCS, greenshaded components) with capture and storage of carbon. Yellow-shaded components are common to both CTL and BTL systems.
Figure 12.22 | Values of GHGI for the synthetic fuel options described in Table 12.15, along with the GHGI for future cellulosic-biomass ethanol technologies. See Table 12.15 , note (c) for definition of GHGI. For details on the cellulosic ethanol options see Box 12.3 and Liu et al., 2011a .
Yields of Low/Zero Net GHG Emitting Liquid Fuels from Biomass
Fossil Energy
Presenter
Presentation Notes
Figure 12.23 | Yields of low/zero net GHG emitting liquid fuels from biomass, liters of gasoline equivalent per dry tonne. For the biomass-only designs that incorporate CCS (BTL-RC-CCS, BTG-RC-CCS, and EtOH-CCS), life cycle GHG emissions are negative, leaving “room in the atmosphere” for some crude oil-derived fuel that can be used while keeping zero net GHG emissions for the biomass + crude oil-derived liquid fuels. Based on Liu et al., 2011a . See also Box 12.3 for a discussion of the cellulosic ethanol options.
Breakeven Oil Prices as a Function of GHG Emission Price for Coal, Biomass, and Coal/Biomass Conversion to FTL or MTG
Fossil Energy
Presenter
Presentation Notes
Figure 12.24 | Breakeven oil prices (US 2007 $) as a function of GHG emission price for coal, biomass, and coal/biomass conversion to FTL or MTG. (See Table 12.6 , note (b) for financial parameter assumptions. Also, electricity sales are assumed at the US average grid price plotted
Simplified Process Diagrams for H2 Production from Natural Gas via Steam-Methane Reforming (top) or via Autothermal Reforming (bottom)
Fossil Energy
Presenter
Presentation Notes
Figure 12.26 | Simplified process diagrams for H 2 production from natural gas via steam-methane reforming (top) or via autothermal reforming (bottom). When CO 2 is captured for storage (as shown), import of electricity may be required to meet on-site needs. Without CO 2 capture, there can be net electricity exports to the grid from the facility.
Levelized Hydrogen Production Costs as a Function of GHG Emissions Price
Fossil Energy
Presenter
Presentation Notes
Figure 12.27 | Levelized hydrogen production costs as a function of GHG emissions price. (See Table 12.6 , note (b) for fi nancial parameter assumptions. Also, electricity sales are assumed at the US average grid price plotted in Figure 12.10 .) Source: based on Simbeck, 2004 ; Simbeck and Wilhelm, 2007 ; Liu et al., 2011a .
Per Capita Energy Use Rate for Cooking in the Early 1980s
Fossil Energy
Presenter
Presentation Notes
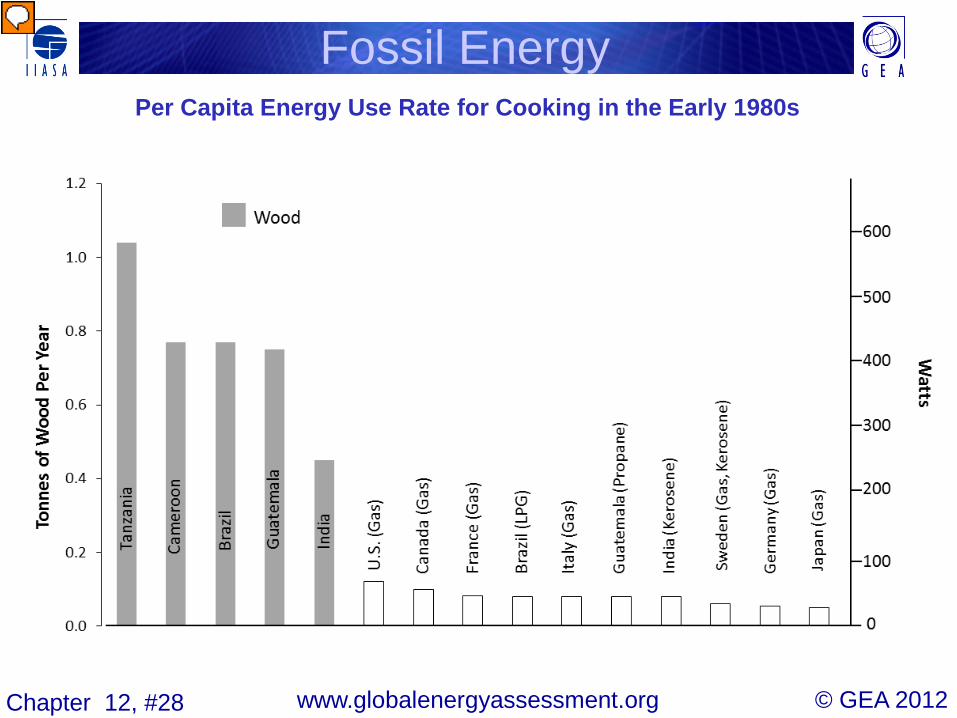
Figure 12.28 | Per capita energy use rate for cooking in the early 1980s. For both wood stoves and stoves burning high-quality energy carriers, the per capita energy use rate is in Watts; for wood fuel, the rate is also in t/yr of dry wood. (Assuming 1 tonne = 18 GJ, 1 t/yr = 570 Watts). Source: Goldemberg et al., 1985 .
Breakeven Crude Oil Price (BEOP) as a Function of the GHG Emissions Price
Fossil Energy
Presenter
Presentation Notes
Figure 12.30 | Breakeven crude oil price (BEOP) as a function of the GHG emissions price for the MTG options described in Table 12.21 . (See Table 12.6 , note (b) and Table 12.16 , note (b) for financial parameter and other assumptions. Electricity sales are assumed at the US average grid price plotted in Figure 12.10 .)
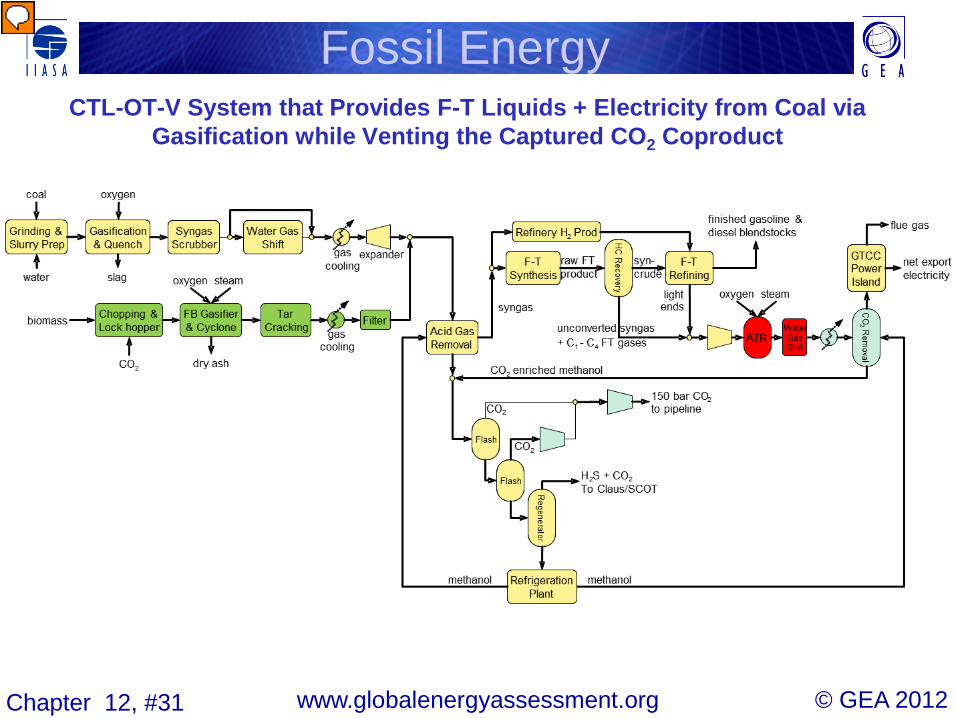
CTL-OT-V System that Provides F-T Liquids + Electricity from Coal via Gasification while Venting the Captured CO2 Coproduct
Fossil Energy
Presenter
Presentation Notes
Figure 12.31 | CTL-OT-V system (including only yellow-shaded components) that provides F-T liquids + electricity from coal via gasification while venting the captured CO 2 coproduct. Upstream of the synthesis reactor CO 2 accounting for 25% of the C in the coal is captured along with H 2 S using Rectisol. The H 2 S is converted to elemental sulfur in a Claus plant and the CO 2 is vented.
CTG-PB-CCS System that Provides Gasoline and LPG + Electricity From Coal
Fossil Energy
Presenter
Presentation Notes
Figure 12.32 | CTG-PB-CCS system (yellow-shaded components) that provides gasoline and LPG + electricity from coal. H 2 S is converted to elemental sulfur, and CO 2 is captured both upstream and downstream of synthesis (accounting for 64% of C in the coal), compressed to 150 bar, and delivered to a pipeline for transport to a geological storage site. With the addition of the green-shaded components, the system (CBTG-PB-CCS) produces gasoline and LPG + electricity from coal and biomass. CO 2 accounting for 65% of C in the feedstocks is captured and sent to geological storage.
Biomass and Coal Required to Produce Alternative Fuels Having Low/Zero Fuel-cycle-wide GHG Emissions
Fossil Energy
Presenter
Presentation Notes
Figure 12.33 | Biomass (and coal) required to produce alternative fuels having low/zero fuel-cycle-wide GHG emissions. For this graph, all primary energy input is allocated to liquid fuels even though all systems also provide electricity. For details on the cellulosic ethanol options (EtOH-V and EtOH-CCS) see Box 12.3 . Source: based on Liu et al., 2011a .
Figure 12.34 | Comparison of CTL production costs (US 2007 $): OT vs RC options, both with CO 2 vented (–V) and with carbon capture and storage (–CCS). (See Table 12.6 , note (b) for financial parameter assumptions. Also, electricity sales are assumed at the US average grid price plotted in Figure 12.10 .) Source: based on Liu et al., 2011a .
Figure 12.35 | Comparison of CTG production costs (US 2007 $): PB vs RC options, both with CO 2 vented (–V) and with carbon capture and storage (–CCS). Same financial parameter and electricity price assumptions as Figure 12.34 . Source: based on Liu et al., forthcoming.
Liquid Fuel Production Costs for Alternative FTL-OT and MTG-PB Options
Fossil Energy
Presenter
Presentation Notes
Figure 12.36 | Liquid fuel production costs (US 2007 $) for alternative FTL-OT and MTG-PB options, involving coal and coal + biomass as feedstocks. Same financial parameter and electricity price assumptions as Figure 12.34 . Source: based on Liu et al., 2011a.
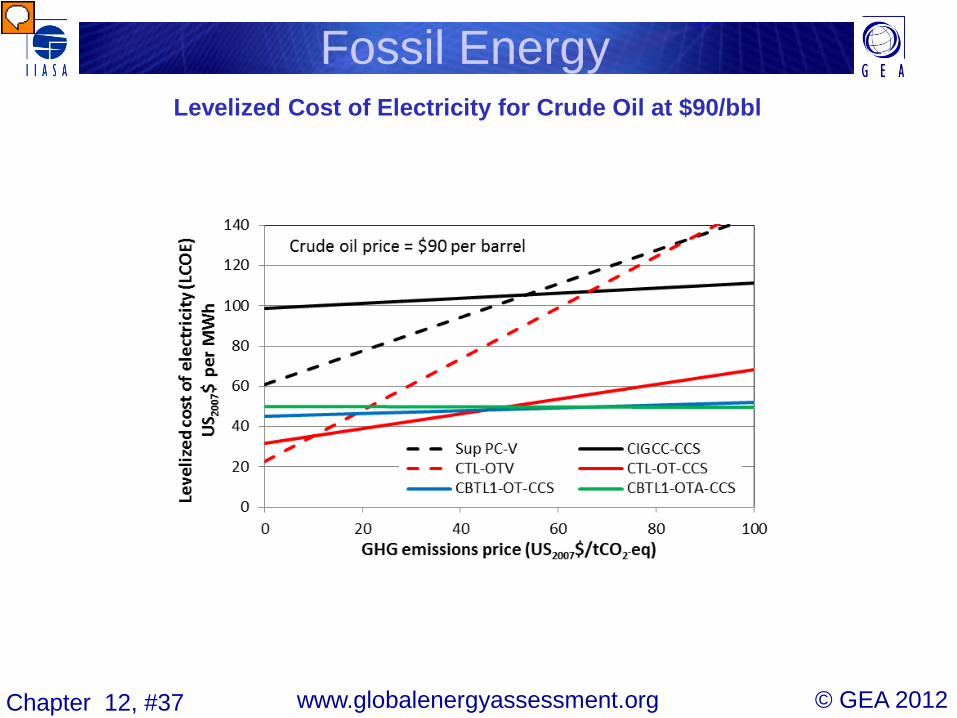
Levelized Cost of Electricity for Crude Oil at $90/bbl
Fossil Energy
Presenter
Presentation Notes
Figure 12.37 | Levelized cost of electricity (LCOE) for crude oil at $90/bbl for the electric power options described in Table 12.24 . (See Table 12.6 , note (b) for fi nancial parameter values assumed.) The IEA (2009b) projects that if the global community were to pursue a GHG emissions trajectory consistent with stabilizing the atmospheric GHG concentration at 450 ppmv the world oil price would be fl at at US$90/bbl, 2020–2030, considerably lower than its projection of the world oil price for its Reference Case (BAU) scenario.
Figure 12.39 | GHG emissions for China: for the BAU scenario based on US EIA (2009a) and for the three thought experiment variants discussed in the main text.
Figure 12.40 | Oil imports for China: for the BAU scenario based on US EIA (2009a) and for the three thought experiment variants discussed in the main text.
Figure 12.41 | Levelized cost of electricity (LCOE) vs GHG emissions price under US conditions for the alternative power options in Table 12.25 when the levelized crude oil price is US$90/bbl. (See Table 12.6 , note (b) for financial parameter values assumed.) Source: based on Liu et al., 2011a ; Williams et al., 2011 .
Figure 12.42 | Breakeven crude oil price (BEOP) vs GHG emissions price for the alternative coproduction systems in Table 12.25 . (See Table 12.6 , note (b) for financial parameter values assumed.) Source: based on Liu et al., 2011a ; Williams et al., 2011 .
Figure 12.43 | Minimum dispatch cost (MDC) vs GHG emissions price for the alternative coproduction systems listed in Table 12.25 . Source: based on Liu et al., 2011a; Williams et al., 2011 .
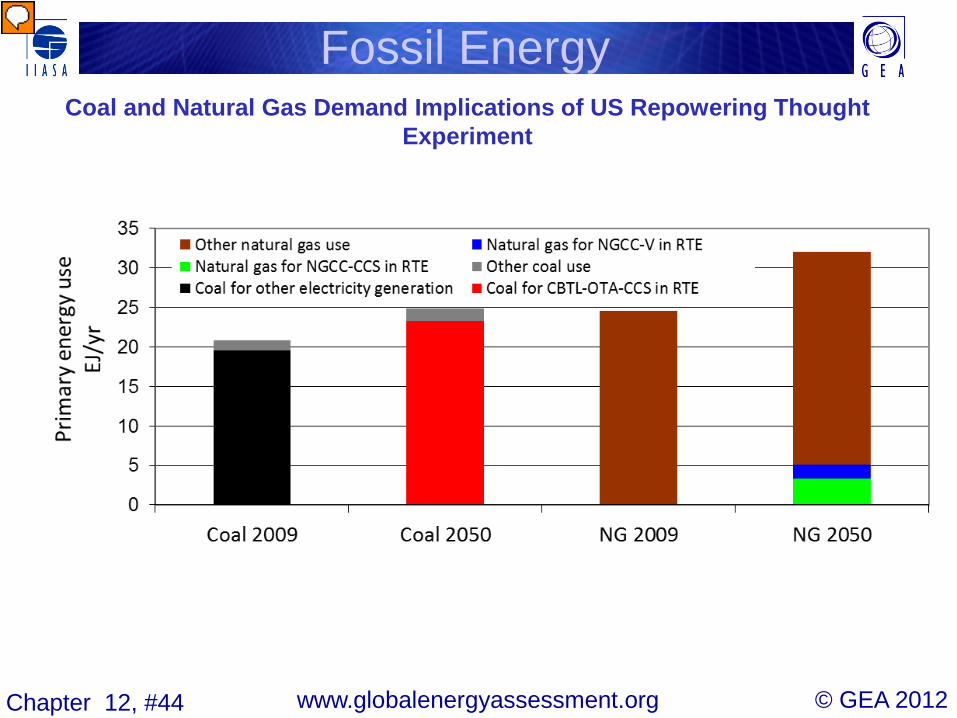
Figure 12.45 | The simple payback on the total new plant investment, 2016–2050, for the RTE would be about seven years if the sole benefit considered is the reduced public health damage costs from reduced PM 2.5 air pollution. (See Table 12.9 .)
Outlook For Natural Gas Supplies in The United States
Fossil Energy
Presenter
Presentation Notes
Figure 12.46 | Outlook for natural gas supplies in the United States. To convert cubic feet to cubic meters, divide by 35.3. Source: modifi ed from US EIA, 2010a .
Figure 12.47 | LCOF vs GHG emissions price for the six alternative low-carbon fuel options listed in Table 12.26 . Also shown are values of petroleum-derived gasoline and an average for gasoline plus diesel corresponding to the proportions of these fuels found in the FTL fl ues in the CBTL and BTL cases (see Table 12.15 , note (a)). (See Table 12.6 , note (b) for fi nancial parameter assumptions. Also, electricity sales are assumed at the US average grid price plotted in Figure 12.10. ) Based on Liu et al., 2011a .
Real internal rate of return on equity for BIGCC-CCS and for the FTL options with the lowest LCOF for three levelized crude oil prices
Fossil Energy
Presenter
Presentation Notes
Figure 12.48 | Real internal rate of return on equity (IRRE) for BIGCC-CCS (see Table 12.26 ) and for the FTL options with the lowest LCOF (see Figure 12.47 ) for three levelized crude oil prices. Electricity sales are assumed at the US average grid price plotted in Figure 12.10 . Based on Liu et al., 2011a .
Energy and GHG Emissions for Global Coal/Biomass Thought Experiment
Fossil Energy
Presenter
Presentation Notes
Figure 12.49 | Energy and GHG emissions for global coal/biomass thought experiment and for IEA 2050 Baseline (business-as-usual) scenario. Numbers at tops of bars are total GHG emissions in GtCO 2 -eq/yr. LDV fuel use rate is in liters of gasoline equivalent per 100 km. Source: see discussion in text.
GBTL-OT-CCS System that Provides Electricity+FTL from Natural Gas and Biomass
Fossil Energy
Presenter
Presentation Notes
Figure 12.50 | GBTL-OT-CCS system that provides electricity + FTL (via use of a cobalt catalyst) from natural gas and biomass. Natural gas is converted to syngas in an autothermal reformer. Syngas is generated from biomass in a fl uidized bed gasifi er. The autothermal reformer is also used to crack (i.e., eliminate) the tars from the biomass-derived syngas. 52% of C in the feedstocks is captured, compressed to 150 bar, and sent via pipeline to a geological storage site. The system was designed with enough biomass coprocessing (34%) to realize GHGI = 0.10. Source: based on Liu et al., 2011b .
LCOE vs GHG Emissions Price for Coproduction Technologies
Fossil Energy
Presenter
Presentation Notes
Figure 12.51 | Levelized cost of electricity vs GHG emissions price for the coproduction technologies in Table 12.27 and stand-alone power options – assuming a US$90/bbl of crude oil price and reference case coal and natural gas pricing (US$2.04/GJ and US$5.1/GJ, respectively). (See Table 12.6 , note (b) for fi nancial parameter assumptions.) Source: based on Liu et al., 2011b .