ge sensing - instrumartge sensing optica general eastern dew point analyzer operator’s manual...
TRANSCRIPT

GESensing
OpticaGeneral Eastern Dew Point Analyzer
Operator’s Manual

GESensing
OpticaGeneral Eastern Dew Point Analyzer
Operator’s ManualA40238752CJanuary 2006
The Optica Dew Point Analyzer is a General Eastern Instruments product. General Eastern Instruments has joined other GE high-technology sensing businesses under a new name—GE Sensing.

January 2006
Warranty Each instrument manufactured by GE Infrastructure Sensing is warranted to be free from defects in material and workmanship. Liability under this warranty is limited to restoring the instrument to normal operation or replacing the instrument, at the sole discretion of GE Infrastructure Sensing. Fuses and batteries are specifically excluded from any liability. This warranty is effective from the date of delivery to the original purchaser. If GE Infrastructure Sensing determines that the equipment was defective, the warranty period is:
• one year for general electronic failures of the instrument
• one year for mechanical failures of the sensor
If GE Infrastructure Sensing determines that the equipment was damaged by misuse, improper installation, the use of unauthorized replacement parts, or operating conditions outside the guidelines specified by GE Infrastructure Sensing, the repairs are not covered under this warranty.
The warranties set forth herein are exclusive and are in lieu ofall other warranties whether statutory, express or implied(including warranties or merchantability and fitness for aparticular purpose, and warranties arising from course ofdealing or usage or trade).
Return Policy If a GE Infrastructure Sensing instrument malfunctions within the warranty period, the following procedure must be completed:
1. Notify GE Infrastructure Sensing, giving full details of the problem, and provide the model number and serial number of the instrument. If the nature of the problem indicates the need for factory service, GE Infrastructure Sensing will issue a RETURN AUTHORIZATION number (RA), and shipping instructions for the return of the instrument to a service center will be provided.
2. If GE Infrastructure Sensing instructs you to send your instrument to a service center, it must be shipped prepaid to the authorized repair station indicated in the shipping instructions.
3. Upon receipt, GE Infrastructure Sensing will evaluate the instrument to determine the cause of the malfunction.
Then, one of the following courses of action will then be taken:
• If the damage is covered under the terms of the warranty, the instrument will be repaired at no cost to the owner and returned.
• If GE Infrastructure Sensing determines that the damage is not covered under the terms of the warranty, or if the warranty has expired, an estimate for the cost of the repairs at standard rates will be provided. Upon receipt of the owner’s approval to proceed, the instrument will be repaired and returned.
iii

January 2006
Table of Contents
Chapter 1: Features and Capabilities
Introduction. . . . . . . . . . . . . . . . . . . . . . . . . . . . . . . . . . . . . . . . . . . . . . . . . . . . . . . . . . . . . . . . . . . . . . . . . . . . 1-1Electronics Enclosure . . . . . . . . . . . . . . . . . . . . . . . . . . . . . . . . . . . . . . . . . . . . . . . . . . . . . . . . . . . . . . . . . . . 1-2
Front Panel. . . . . . . . . . . . . . . . . . . . . . . . . . . . . . . . . . . . . . . . . . . . . . . . . . . . . . . . . . . . . . . . . . . . . . . . . 1-2Input/Output Capability . . . . . . . . . . . . . . . . . . . . . . . . . . . . . . . . . . . . . . . . . . . . . . . . . . . . . . . . . . . . . 1-3
The System . . . . . . . . . . . . . . . . . . . . . . . . . . . . . . . . . . . . . . . . . . . . . . . . . . . . . . . . . . . . . . . . . . . . . . . . . . . . 1-3System Components. . . . . . . . . . . . . . . . . . . . . . . . . . . . . . . . . . . . . . . . . . . . . . . . . . . . . . . . . . . . . . . . 1-3System Planning. . . . . . . . . . . . . . . . . . . . . . . . . . . . . . . . . . . . . . . . . . . . . . . . . . . . . . . . . . . . . . . . . . . . 1-3
Sensors . . . . . . . . . . . . . . . . . . . . . . . . . . . . . . . . . . . . . . . . . . . . . . . . . . . . . . . . . . . . . . . . . . . . . . . . . . . . . . . . 1-3Dew Point Sensors. . . . . . . . . . . . . . . . . . . . . . . . . . . . . . . . . . . . . . . . . . . . . . . . . . . . . . . . . . . . . . . . . . 1-4Temperature Sensor . . . . . . . . . . . . . . . . . . . . . . . . . . . . . . . . . . . . . . . . . . . . . . . . . . . . . . . . . . . . . . . . 1-4Pressure Sensor . . . . . . . . . . . . . . . . . . . . . . . . . . . . . . . . . . . . . . . . . . . . . . . . . . . . . . . . . . . . . . . . . . . . 1-4
Theory of Operation . . . . . . . . . . . . . . . . . . . . . . . . . . . . . . . . . . . . . . . . . . . . . . . . . . . . . . . . . . . . . . . . . . . . 1-4Hygrometer Function . . . . . . . . . . . . . . . . . . . . . . . . . . . . . . . . . . . . . . . . . . . . . . . . . . . . . . . . . . . . . . . 1-4Hygrometer Calibration . . . . . . . . . . . . . . . . . . . . . . . . . . . . . . . . . . . . . . . . . . . . . . . . . . . . . . . . . . . . . 1-5Other Hygrometer Applications . . . . . . . . . . . . . . . . . . . . . . . . . . . . . . . . . . . . . . . . . . . . . . . . . . . . . 1-6
The PACER Cycle. . . . . . . . . . . . . . . . . . . . . . . . . . . . . . . . . . . . . . . . . . . . . . . . . . . . . . . . . . . . . . . . . . . . . . . . 1-6
iv
January 2006
Table of Contents (cont.)
Chapter 2: Installation
Introduction . . . . . . . . . . . . . . . . . . . . . . . . . . . . . . . . . . . . . . . . . . . . . . . . . . . . . . . . . . . . . . . . . . . . . . . . . . . 2-1Benchtop Installation. . . . . . . . . . . . . . . . . . . . . . . . . . . . . . . . . . . . . . . . . . . . . . . . . . . . . . . . . . . . . . . . . . . 2-1
Mounting the Benchtop. . . . . . . . . . . . . . . . . . . . . . . . . . . . . . . . . . . . . . . . . . . . . . . . . . . . . . . . . . . . . 2-1Using the Rack Mounting Option . . . . . . . . . . . . . . . . . . . . . . . . . . . . . . . . . . . . . . . . . . . . . . . . . . . . 2-2Wiring the Benchtop. . . . . . . . . . . . . . . . . . . . . . . . . . . . . . . . . . . . . . . . . . . . . . . . . . . . . . . . . . . . . . . . 2-5
Wall-Mount Installation. . . . . . . . . . . . . . . . . . . . . . . . . . . . . . . . . . . . . . . . . . . . . . . . . . . . . . . . . . . . . . . . . 2-6Mounting the Wall-Mount. . . . . . . . . . . . . . . . . . . . . . . . . . . . . . . . . . . . . . . . . . . . . . . . . . . . . . . . . . . 2-6Wiring the Wall-Mount. . . . . . . . . . . . . . . . . . . . . . . . . . . . . . . . . . . . . . . . . . . . . . . . . . . . . . . . . . . . . . 2-7
Output Wiring. . . . . . . . . . . . . . . . . . . . . . . . . . . . . . . . . . . . . . . . . . . . . . . . . . . . . . . . . . . . . . . . . . . . . . . . . . 2-8Analog Outputs . . . . . . . . . . . . . . . . . . . . . . . . . . . . . . . . . . . . . . . . . . . . . . . . . . . . . . . . . . . . . . . . . . . . 2-9Alarm Outputs . . . . . . . . . . . . . . . . . . . . . . . . . . . . . . . . . . . . . . . . . . . . . . . . . . . . . . . . . . . . . . . . . . . . 2-10Serial Output . . . . . . . . . . . . . . . . . . . . . . . . . . . . . . . . . . . . . . . . . . . . . . . . . . . . . . . . . . . . . . . . . . . . . . 2-12
Sensor Information. . . . . . . . . . . . . . . . . . . . . . . . . . . . . . . . . . . . . . . . . . . . . . . . . . . . . . . . . . . . . . . . . . . . 2-12Sampling Lines . . . . . . . . . . . . . . . . . . . . . . . . . . . . . . . . . . . . . . . . . . . . . . . . . . . . . . . . . . . . . . . . . . . . 2-13Ensuring Heat Transfer . . . . . . . . . . . . . . . . . . . . . . . . . . . . . . . . . . . . . . . . . . . . . . . . . . . . . . . . . . . . 2-14High Dew Point Measurements . . . . . . . . . . . . . . . . . . . . . . . . . . . . . . . . . . . . . . . . . . . . . . . . . . . . 2-14Filter Requirements. . . . . . . . . . . . . . . . . . . . . . . . . . . . . . . . . . . . . . . . . . . . . . . . . . . . . . . . . . . . . . . . 2-15Flow Rate . . . . . . . . . . . . . . . . . . . . . . . . . . . . . . . . . . . . . . . . . . . . . . . . . . . . . . . . . . . . . . . . . . . . . . . . . 2-15
Sensor Installation . . . . . . . . . . . . . . . . . . . . . . . . . . . . . . . . . . . . . . . . . . . . . . . . . . . . . . . . . . . . . . . . . . . . 2-16Model 1111H Sensor . . . . . . . . . . . . . . . . . . . . . . . . . . . . . . . . . . . . . . . . . . . . . . . . . . . . . . . . . . . . . . 2-16Model D-2 Sensor . . . . . . . . . . . . . . . . . . . . . . . . . . . . . . . . . . . . . . . . . . . . . . . . . . . . . . . . . . . . . . . . . 2-16Model 1311DR Sensor . . . . . . . . . . . . . . . . . . . . . . . . . . . . . . . . . . . . . . . . . . . . . . . . . . . . . . . . . . . . . 2-17Model 1311XR Sensor . . . . . . . . . . . . . . . . . . . . . . . . . . . . . . . . . . . . . . . . . . . . . . . . . . . . . . . . . . . . . 2-18Model SIM-12H Heated Sensor and Components . . . . . . . . . . . . . . . . . . . . . . . . . . . . . . . . . . . 2-20Connecting the Sensors . . . . . . . . . . . . . . . . . . . . . . . . . . . . . . . . . . . . . . . . . . . . . . . . . . . . . . . . . . . 2-21
v

January 2006
Table of Contents (cont.)
Chapter 3: Operation
Introduction. . . . . . . . . . . . . . . . . . . . . . . . . . . . . . . . . . . . . . . . . . . . . . . . . . . . . . . . . . . . . . . . . . . . . . . . . . . . 3-1Normal Operation . . . . . . . . . . . . . . . . . . . . . . . . . . . . . . . . . . . . . . . . . . . . . . . . . . . . . . . . . . . . . . . . . . . . . . 3-1Operating the VGA Optica. . . . . . . . . . . . . . . . . . . . . . . . . . . . . . . . . . . . . . . . . . . . . . . . . . . . . . . . . . . . . . . 3-2Operating the 4x40 Optica . . . . . . . . . . . . . . . . . . . . . . . . . . . . . . . . . . . . . . . . . . . . . . . . . . . . . . . . . . . . . . 3-3Network Operation . . . . . . . . . . . . . . . . . . . . . . . . . . . . . . . . . . . . . . . . . . . . . . . . . . . . . . . . . . . . . . . . . . . . . 3-3Process Pressure . . . . . . . . . . . . . . . . . . . . . . . . . . . . . . . . . . . . . . . . . . . . . . . . . . . . . . . . . . . . . . . . . . . . . . . 3-4
Actively Measuring Process Pressure . . . . . . . . . . . . . . . . . . . . . . . . . . . . . . . . . . . . . . . . . . . . . . . . 3-4Manually Entering Pressure . . . . . . . . . . . . . . . . . . . . . . . . . . . . . . . . . . . . . . . . . . . . . . . . . . . . . . . . . 3-4Measuring at a Different Pressure . . . . . . . . . . . . . . . . . . . . . . . . . . . . . . . . . . . . . . . . . . . . . . . . . . . 3-4Scenario 1: Measurement Without Enabling the Process Pressure Feature. . . . . . . . . . . . . 3-5Scenario 2: Measurement Requiring the Process Pressure Feature . . . . . . . . . . . . . . . . . . . . 3-6
Status Line Indications. . . . . . . . . . . . . . . . . . . . . . . . . . . . . . . . . . . . . . . . . . . . . . . . . . . . . . . . . . . . . . . . . . 3-8Factory Default Settings . . . . . . . . . . . . . . . . . . . . . . . . . . . . . . . . . . . . . . . . . . . . . . . . . . . . . . . . . . . . 3-9
Sensor Balancing. . . . . . . . . . . . . . . . . . . . . . . . . . . . . . . . . . . . . . . . . . . . . . . . . . . . . . . . . . . . . . . . . . . . . . 3-10Helpful Hints For Operating the Unit . . . . . . . . . . . . . . . . . . . . . . . . . . . . . . . . . . . . . . . . . . . . . . . . . . . . 3-10
Supercooled Dew Points . . . . . . . . . . . . . . . . . . . . . . . . . . . . . . . . . . . . . . . . . . . . . . . . . . . . . . . . . . . 3-11Contamination . . . . . . . . . . . . . . . . . . . . . . . . . . . . . . . . . . . . . . . . . . . . . . . . . . . . . . . . . . . . . . . . . . . . 3-11Mirror Flooding . . . . . . . . . . . . . . . . . . . . . . . . . . . . . . . . . . . . . . . . . . . . . . . . . . . . . . . . . . . . . . . . . . . . 3-13Sample Line Maintenance. . . . . . . . . . . . . . . . . . . . . . . . . . . . . . . . . . . . . . . . . . . . . . . . . . . . . . . . . . 3-13Pressure Effects . . . . . . . . . . . . . . . . . . . . . . . . . . . . . . . . . . . . . . . . . . . . . . . . . . . . . . . . . . . . . . . . . . . 3-13
vi
January 2006
Table of Contents (cont.)
Chapter 4: Programming the VGA Optica
Introduction . . . . . . . . . . . . . . . . . . . . . . . . . . . . . . . . . . . . . . . . . . . . . . . . . . . . . . . . . . . . . . . . . . . . . . . . . . . 4-1Programming Fundamentals . . . . . . . . . . . . . . . . . . . . . . . . . . . . . . . . . . . . . . . . . . . . . . . . . . . . . . . . . . . 4-1
The Keys . . . . . . . . . . . . . . . . . . . . . . . . . . . . . . . . . . . . . . . . . . . . . . . . . . . . . . . . . . . . . . . . . . . . . . . . . . . 4-2Data Entry Fields . . . . . . . . . . . . . . . . . . . . . . . . . . . . . . . . . . . . . . . . . . . . . . . . . . . . . . . . . . . . . . . . . . . 4-2
Units of Measure . . . . . . . . . . . . . . . . . . . . . . . . . . . . . . . . . . . . . . . . . . . . . . . . . . . . . . . . . . . . . . . . . . . . . . . 4-4User Equations. . . . . . . . . . . . . . . . . . . . . . . . . . . . . . . . . . . . . . . . . . . . . . . . . . . . . . . . . . . . . . . . . . . . . . . . . 4-4Menu 1 . . . . . . . . . . . . . . . . . . . . . . . . . . . . . . . . . . . . . . . . . . . . . . . . . . . . . . . . . . . . . . . . . . . . . . . . . . . . . . . . 4-6
Analog Outputs . . . . . . . . . . . . . . . . . . . . . . . . . . . . . . . . . . . . . . . . . . . . . . . . . . . . . . . . . . . . . . . . . . . . 4-6Pressure Input. . . . . . . . . . . . . . . . . . . . . . . . . . . . . . . . . . . . . . . . . . . . . . . . . . . . . . . . . . . . . . . . . . . . . . 4-7Alarms . . . . . . . . . . . . . . . . . . . . . . . . . . . . . . . . . . . . . . . . . . . . . . . . . . . . . . . . . . . . . . . . . . . . . . . . . . . . . 4-8Automatic Cleaning and Balance Function. . . . . . . . . . . . . . . . . . . . . . . . . . . . . . . . . . . . . . . . . . . 4-9Data Fields . . . . . . . . . . . . . . . . . . . . . . . . . . . . . . . . . . . . . . . . . . . . . . . . . . . . . . . . . . . . . . . . . . . . . . . . 4-11Buzzer/Sound . . . . . . . . . . . . . . . . . . . . . . . . . . . . . . . . . . . . . . . . . . . . . . . . . . . . . . . . . . . . . . . . . . . . . 4-11Network Menu . . . . . . . . . . . . . . . . . . . . . . . . . . . . . . . . . . . . . . . . . . . . . . . . . . . . . . . . . . . . . . . . . . . . 4-12Datalog . . . . . . . . . . . . . . . . . . . . . . . . . . . . . . . . . . . . . . . . . . . . . . . . . . . . . . . . . . . . . . . . . . . . . . . . . . . 4-13Download Screen . . . . . . . . . . . . . . . . . . . . . . . . . . . . . . . . . . . . . . . . . . . . . . . . . . . . . . . . . . . . . . . . . 4-14
Menu 2 . . . . . . . . . . . . . . . . . . . . . . . . . . . . . . . . . . . . . . . . . . . . . . . . . . . . . . . . . . . . . . . . . . . . . . . . . . . . . . . 4-15General . . . . . . . . . . . . . . . . . . . . . . . . . . . . . . . . . . . . . . . . . . . . . . . . . . . . . . . . . . . . . . . . . . . . . . . . . . . 4-16Special. . . . . . . . . . . . . . . . . . . . . . . . . . . . . . . . . . . . . . . . . . . . . . . . . . . . . . . . . . . . . . . . . . . . . . . . . . . . 4-16User Equation . . . . . . . . . . . . . . . . . . . . . . . . . . . . . . . . . . . . . . . . . . . . . . . . . . . . . . . . . . . . . . . . . . . . . 4-16Communication Parameters . . . . . . . . . . . . . . . . . . . . . . . . . . . . . . . . . . . . . . . . . . . . . . . . . . . . . . . 4-17Serial Output Data. . . . . . . . . . . . . . . . . . . . . . . . . . . . . . . . . . . . . . . . . . . . . . . . . . . . . . . . . . . . . . . . . 4-18Set Time & Date . . . . . . . . . . . . . . . . . . . . . . . . . . . . . . . . . . . . . . . . . . . . . . . . . . . . . . . . . . . . . . . . . . . 4-19Restore Defaults. . . . . . . . . . . . . . . . . . . . . . . . . . . . . . . . . . . . . . . . . . . . . . . . . . . . . . . . . . . . . . . . . . . 4-19
Saving Configuration Files . . . . . . . . . . . . . . . . . . . . . . . . . . . . . . . . . . . . . . . . . . . . . . . . . . . . . . . . . . . . . 4-20
vii

January 2006
Table of Contents (cont.)
Chapter 5: Programming the 4x40 Optica
Introduction. . . . . . . . . . . . . . . . . . . . . . . . . . . . . . . . . . . . . . . . . . . . . . . . . . . . . . . . . . . . . . . . . . . . . . . . . . . . 5-1Programming Technique. . . . . . . . . . . . . . . . . . . . . . . . . . . . . . . . . . . . . . . . . . . . . . . . . . . . . . . . . . . . . . . . 5-2Programmable Functions . . . . . . . . . . . . . . . . . . . . . . . . . . . . . . . . . . . . . . . . . . . . . . . . . . . . . . . . . . . . . . . 5-4
Analog Outputs. . . . . . . . . . . . . . . . . . . . . . . . . . . . . . . . . . . . . . . . . . . . . . . . . . . . . . . . . . . . . . . . . . . . . 5-4Communication Parameters . . . . . . . . . . . . . . . . . . . . . . . . . . . . . . . . . . . . . . . . . . . . . . . . . . . . . . . . 5-4Serial Output Units. . . . . . . . . . . . . . . . . . . . . . . . . . . . . . . . . . . . . . . . . . . . . . . . . . . . . . . . . . . . . . . . . . 5-5Serial Output Setup . . . . . . . . . . . . . . . . . . . . . . . . . . . . . . . . . . . . . . . . . . . . . . . . . . . . . . . . . . . . . . . . . 5-5Alarms . . . . . . . . . . . . . . . . . . . . . . . . . . . . . . . . . . . . . . . . . . . . . . . . . . . . . . . . . . . . . . . . . . . . . . . . . . . . . 5-6Data Fields . . . . . . . . . . . . . . . . . . . . . . . . . . . . . . . . . . . . . . . . . . . . . . . . . . . . . . . . . . . . . . . . . . . . . . . . . 5-7Pressure Input. . . . . . . . . . . . . . . . . . . . . . . . . . . . . . . . . . . . . . . . . . . . . . . . . . . . . . . . . . . . . . . . . . . . . . 5-7Automatic Cleaning and Balance Function. . . . . . . . . . . . . . . . . . . . . . . . . . . . . . . . . . . . . . . . . . . 5-8Buzzer and Sounds . . . . . . . . . . . . . . . . . . . . . . . . . . . . . . . . . . . . . . . . . . . . . . . . . . . . . . . . . . . . . . . . 5-11General Settings . . . . . . . . . . . . . . . . . . . . . . . . . . . . . . . . . . . . . . . . . . . . . . . . . . . . . . . . . . . . . . . . . . . 5-11User Equations . . . . . . . . . . . . . . . . . . . . . . . . . . . . . . . . . . . . . . . . . . . . . . . . . . . . . . . . . . . . . . . . . . . . 5-11Set Time and Date . . . . . . . . . . . . . . . . . . . . . . . . . . . . . . . . . . . . . . . . . . . . . . . . . . . . . . . . . . . . . . . . . 5-12Special . . . . . . . . . . . . . . . . . . . . . . . . . . . . . . . . . . . . . . . . . . . . . . . . . . . . . . . . . . . . . . . . . . . . . . . . . . . . 5-12User Default Settings . . . . . . . . . . . . . . . . . . . . . . . . . . . . . . . . . . . . . . . . . . . . . . . . . . . . . . . . . . . . . . 5-12Factory Calibrations . . . . . . . . . . . . . . . . . . . . . . . . . . . . . . . . . . . . . . . . . . . . . . . . . . . . . . . . . . . . . . . 5-12
Chapter 6: Network-Based Programming
Introduction. . . . . . . . . . . . . . . . . . . . . . . . . . . . . . . . . . . . . . . . . . . . . . . . . . . . . . . . . . . . . . . . . . . . . . . . . . . . 6-1Programming Screens . . . . . . . . . . . . . . . . . . . . . . . . . . . . . . . . . . . . . . . . . . . . . . . . . . . . . . . . . . . . . . . . . . 6-1
Chapter 7: Maintenance
Minor Maintenance of Sensor Optics . . . . . . . . . . . . . . . . . . . . . . . . . . . . . . . . . . . . . . . . . . . . . . . . . . . . 7-1Cleaning the Sensor Mirror . . . . . . . . . . . . . . . . . . . . . . . . . . . . . . . . . . . . . . . . . . . . . . . . . . . . . . . . . . 7-1Balancing the Sensor Optics . . . . . . . . . . . . . . . . . . . . . . . . . . . . . . . . . . . . . . . . . . . . . . . . . . . . . . . . 7-2
Field Replacement of Sensor Mirrors . . . . . . . . . . . . . . . . . . . . . . . . . . . . . . . . . . . . . . . . . . . . . . . . . . . . 7-4Replacing the Sensor Mirror . . . . . . . . . . . . . . . . . . . . . . . . . . . . . . . . . . . . . . . . . . . . . . . . . . . . . . . . . 7-5
Test and Calibration . . . . . . . . . . . . . . . . . . . . . . . . . . . . . . . . . . . . . . . . . . . . . . . . . . . . . . . . . . . . . . . . . . . . 7-6Troubleshooting . . . . . . . . . . . . . . . . . . . . . . . . . . . . . . . . . . . . . . . . . . . . . . . . . . . . . . . . . . . . . . . . . . . . . . . . 7-6
The Display Doesn’t Light Up . . . . . . . . . . . . . . . . . . . . . . . . . . . . . . . . . . . . . . . . . . . . . . . . . . . . . . . . 7-6“Service” Appears on the STATUS Display Line. . . . . . . . . . . . . . . . . . . . . . . . . . . . . . . . . . . . . . . . 7-6Incorrect Dew Point Display . . . . . . . . . . . . . . . . . . . . . . . . . . . . . . . . . . . . . . . . . . . . . . . . . . . . . . . . . 7-7“Balance” Remains on the Status Line . . . . . . . . . . . . . . . . . . . . . . . . . . . . . . . . . . . . . . . . . . . . . . . 7-8No Analog Output . . . . . . . . . . . . . . . . . . . . . . . . . . . . . . . . . . . . . . . . . . . . . . . . . . . . . . . . . . . . . . . . . . 7-8No Serial Output . . . . . . . . . . . . . . . . . . . . . . . . . . . . . . . . . . . . . . . . . . . . . . . . . . . . . . . . . . . . . . . . . . . . 7-8
viii
January 2006
Table of Contents (cont.)
Appendix A: Specifications
Performance. . . . . . . . . . . . . . . . . . . . . . . . . . . . . . . . . . . . . . . . . . . . . . . . . . . . . . . . . . . . . . . . . . . . . . . . . . . A-1Accuracy. . . . . . . . . . . . . . . . . . . . . . . . . . . . . . . . . . . . . . . . . . . . . . . . . . . . . . . . . . . . . . . . . . . . . . . . . . . A-1Measurement Ranges . . . . . . . . . . . . . . . . . . . . . . . . . . . . . . . . . . . . . . . . . . . . . . . . . . . . . . . . . . . . . . A-1Response Time . . . . . . . . . . . . . . . . . . . . . . . . . . . . . . . . . . . . . . . . . . . . . . . . . . . . . . . . . . . . . . . . . . . . . A-1
Functionality . . . . . . . . . . . . . . . . . . . . . . . . . . . . . . . . . . . . . . . . . . . . . . . . . . . . . . . . . . . . . . . . . . . . . . . . . . . A-2Alarms . . . . . . . . . . . . . . . . . . . . . . . . . . . . . . . . . . . . . . . . . . . . . . . . . . . . . . . . . . . . . . . . . . . . . . . . . . . . . A-2Operating ranges . . . . . . . . . . . . . . . . . . . . . . . . . . . . . . . . . . . . . . . . . . . . . . . . . . . . . . . . . . . . . . . . . . A-2
Physical (bench mount) . . . . . . . . . . . . . . . . . . . . . . . . . . . . . . . . . . . . . . . . . . . . . . . . . . . . . . . . . . . . . . . . . A-2Physical (wall mount) . . . . . . . . . . . . . . . . . . . . . . . . . . . . . . . . . . . . . . . . . . . . . . . . . . . . . . . . . . . . . . . . . . . A-2Optional Accessories . . . . . . . . . . . . . . . . . . . . . . . . . . . . . . . . . . . . . . . . . . . . . . . . . . . . . . . . . . . . . . . . . . . A-3
Appendix B: Humidity Equations and Conversion Chart
Introduction . . . . . . . . . . . . . . . . . . . . . . . . . . . . . . . . . . . . . . . . . . . . . . . . . . . . . . . . . . . . . . . . . . . . . . . . . . . B-1Vapor Pressure. . . . . . . . . . . . . . . . . . . . . . . . . . . . . . . . . . . . . . . . . . . . . . . . . . . . . . . . . . . . . . . . . . . . . . . . . B-1Humidity. . . . . . . . . . . . . . . . . . . . . . . . . . . . . . . . . . . . . . . . . . . . . . . . . . . . . . . . . . . . . . . . . . . . . . . . . . . . . . . B-2
Appendix C: Configuring the Serial Interface
Wiring to a Personal Computer . . . . . . . . . . . . . . . . . . . . . . . . . . . . . . . . . . . . . . . . . . . . . . . . . . . . . . . . . C-1
Appendix D: Chilled Mirror Sensors
Introduction . . . . . . . . . . . . . . . . . . . . . . . . . . . . . . . . . . . . . . . . . . . . . . . . . . . . . . . . . . . . . . . . . . . . . . . . . . . D-1Depression. . . . . . . . . . . . . . . . . . . . . . . . . . . . . . . . . . . . . . . . . . . . . . . . . . . . . . . . . . . . . . . . . . . . . . . . . . . . . D-1Measurement Range . . . . . . . . . . . . . . . . . . . . . . . . . . . . . . . . . . . . . . . . . . . . . . . . . . . . . . . . . . . . . . . . . . . D-2Comparing Optica Models . . . . . . . . . . . . . . . . . . . . . . . . . . . . . . . . . . . . . . . . . . . . . . . . . . . . . . . . . . . . . . D-3
Appendix E: Glossary
Appendix F: Automatic Balance (for earlier software versions)
Programming Automatic Balance for a VGA Optica . . . . . . . . . . . . . . . . . . . . . . . . . . . . . . . . . . . . . . F-1Programming Automatic Balance for a 4x40 Optica . . . . . . . . . . . . . . . . . . . . . . . . . . . . . . . . . . . . . F-1
ix

January 2006
Table of Contents (cont.)
Appendix G: Communicating with the OPTICA Using Ethernet
Direct Communication. . . . . . . . . . . . . . . . . . . . . . . . . . . . . . . . . . . . . . . . . . . . . . . . . . . . . . . . . . . . . . . . . . G-1Computer Communication. . . . . . . . . . . . . . . . . . . . . . . . . . . . . . . . . . . . . . . . . . . . . . . . . . . . . . . . . . . . . . G-1
Determining the Available Commands. . . . . . . . . . . . . . . . . . . . . . . . . . . . . . . . . . . . . . . . . . . . . . . G-2Retrieving the Alarm Settings. . . . . . . . . . . . . . . . . . . . . . . . . . . . . . . . . . . . . . . . . . . . . . . . . . . . . . . . G-3Retrieving the Alarm Types. . . . . . . . . . . . . . . . . . . . . . . . . . . . . . . . . . . . . . . . . . . . . . . . . . . . . . . . . . G-4Retrieving Supported Units . . . . . . . . . . . . . . . . . . . . . . . . . . . . . . . . . . . . . . . . . . . . . . . . . . . . . . . . . . G-5Retrieving Labels and Functions . . . . . . . . . . . . . . . . . . . . . . . . . . . . . . . . . . . . . . . . . . . . . . . . . . . . . G-6Retrieving Analog Output Information . . . . . . . . . . . . . . . . . . . . . . . . . . . . . . . . . . . . . . . . . . . . . . . G-8Retrieving the Measured and Calculated Values. . . . . . . . . . . . . . . . . . . . . . . . . . . . . . . . . . . . . . G-84X40 Optica Configuration . . . . . . . . . . . . . . . . . . . . . . . . . . . . . . . . . . . . . . . . . . . . . . . . . . . . . . . . .G-10
x

Chapter 1

Features and Capabilities
Introduction. . . . . . . . . . . . . . . . . . . . . . . . . . . . . . . . . . . . . . . . . . . . . . . . . . . . 1-1
Electronics Enclosure . . . . . . . . . . . . . . . . . . . . . . . . . . . . . . . . . . . . . . . . . . . 1-2
The System . . . . . . . . . . . . . . . . . . . . . . . . . . . . . . . . . . . . . . . . . . . . . . . . . . . . 1-3
Sensors . . . . . . . . . . . . . . . . . . . . . . . . . . . . . . . . . . . . . . . . . . . . . . . . . . . . . . . . 1-3
Theory of Operation . . . . . . . . . . . . . . . . . . . . . . . . . . . . . . . . . . . . . . . . . . . . 1-4
The PACER Cycle . . . . . . . . . . . . . . . . . . . . . . . . . . . . . . . . . . . . . . . . . . . . . . . . 1-6
January 2006
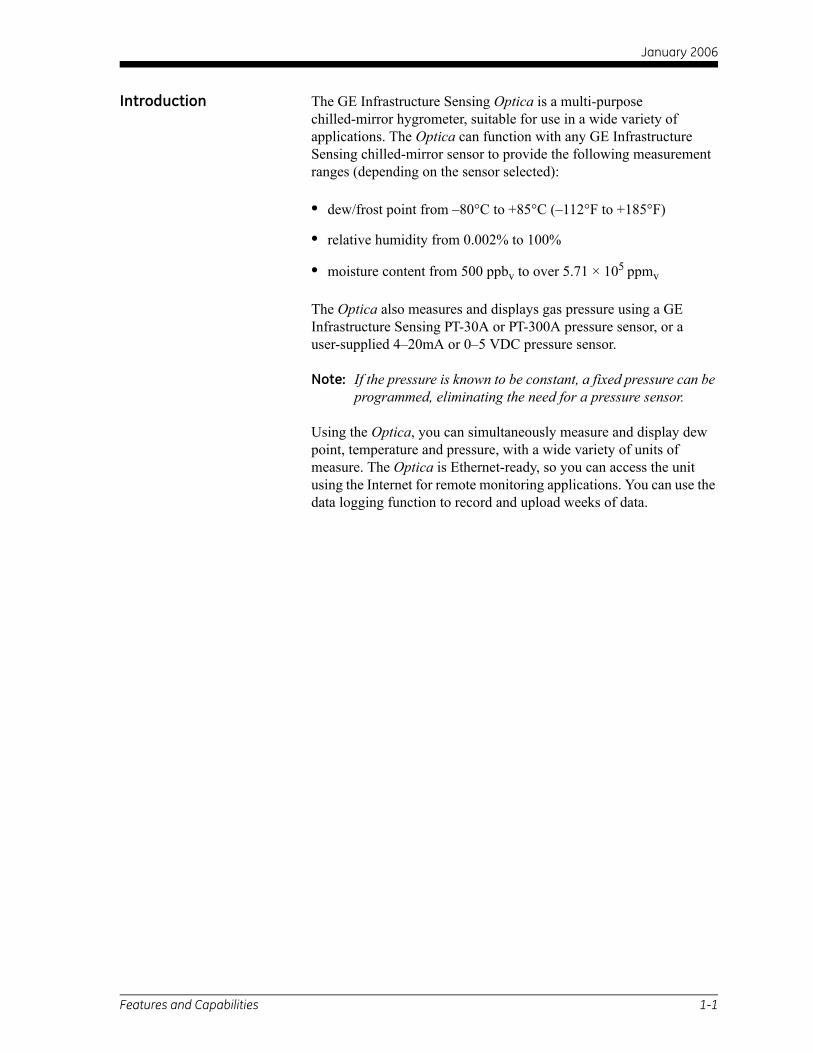
Introduction The GE Infrastructure Sensing Optica is a multi-purpose chilled-mirror hygrometer, suitable for use in a wide variety of applications. The Optica can function with any GE Infrastructure Sensing chilled-mirror sensor to provide the following measurement ranges (depending on the sensor selected):
• dew/frost point from –80°C to +85°C (–112°F to +185°F)
• relative humidity from 0.002% to 100%
• moisture content from 500 ppbv to over 5.71 × 10⁵ ppmv
The Optica also measures and displays gas pressure using a GE Infrastructure Sensing PT-30A or PT-300A pressure sensor, or auser-supplied 4–20mA or 0–5 VDC pressure sensor.
Note: If the pressure is known to be constant, a fixed pressure can be programmed, eliminating the need for a pressure sensor.
Using the Optica, you can simultaneously measure and display dew point, temperature and pressure, with a wide variety of units of measure. The Optica is Ethernet-ready, so you can access the unit using the Internet for remote monitoring applications. You can use the data logging function to record and upload weeks of data.
Features and Capabilities 1-1

January 2006
Electronics Enclosure The Optica is available in two configurations:
• a benchtop model, with an optional rack-mount adapter available
• a wall-mount unit, housed in a NEMA-4 enclosure, suitable for industrial environments
See Chapter 2, Installation, for details on how to mount the Optica.
Front Panel The Optica’s front panel is shown in Figure 1-1 below. The panel includes: a display, an alphanumeric keypad for data entry, ENTER and TAB keys, and four softkeys to the right of the display screen.
Two display options are available:
• a high-resolution full-color liquid crystal display (LCD) with data graphing and on-screen programming capability (referred to as the “VGA” unit). See Figure 1-1 below.
• a 4-line by 40-character alphanumeric display (referred to as the “4x40” unit).
Figure 1-1: Optica Benchtop Version with VGA Display
1-2 Features and Capabilities

January 2006
Input/Output Capability Available inputs and outputs include the following:
• 4-wire Resistance Temperature Detector (RTD) input
• 4–20 mA and 0–5 VDC Pressure Sensor inputs
• two simultaneous analog outputs, each with 4–20 mA and 0–5 VDC capability
• two independent alarm relays (Form C, 5 Amp)
• serial communications port
• Ethernet 10BaseT (on VGA Optica only)
The Optica uses the GE Infrastructure Sensing patented Programmable Automatic Contaminant Error Reduction (PACER) system to insure measurement accuracy.
Detailed specifications for the Optica are given in Appendix A.
The System
System Components A complete Optica system consists of the following items:
System Planning The Optica can be used for a wide variety of measurement applications, including the measurement of dew points of gasses that are at pressures that exceed the measurement range of GEI’s sensors. In this situation be sure to check the section Process Pressure on page 3-4 for installation planning.
Sensors The Optica can be configured with a chilled-mirror dew point sensor. The specific sensor is chosen according to the expected dew point range and the environment in which the dew point is to be determined. In addition, the Optica can be configured with a temperature and/or pressure sensor. GE Infrastructure Sensing provides the following sensors for various applications:
• Electronic monitor • Temperature sensor (optional)
• Dew point sensor • Pressure sensor (optional)
• Interconnecting sensor cable • Maintenance kit
• AC line cord • User’s Manual
• Certification that the unit is traceable to the National Instituteof Standards and Technology (Certificate of Conformance)
Features and Capabilities 1-3

January 2006
Dew Point Sensors • Model 1111H — Single-stage sensor
• Model 1211H — Two-stage sensor; high pressure and temperature
• Model D-2 — Two-stage sensor
• Model SIM-12H — Two-stage heated sensor
• Model 1311DR — Four-stage, liquid or air cooled sensor
• Model 1311XR — Five-stage, liquid cooled sensor
Temperature Sensor • Model T-100E
Pressure Sensor • Model PT-30A or PT-300A
Theory of Operation Optical condensation hygrometry is a precise technique for determining the water vapor content in gases by directly measuring dew point or frost temperatures. Using this technique, a metallic mirror is cooled until it reaches a temperature at which a thin layer of condensation begins to form on it. The dew layer is detected optically, and the mirror is held at that temperature. The mirror temperature, measured with a platinum resistance thermometer, is an accurate indicator of the dew or frost point. Because these hygrometers are so accurate, they are widely used as a standard in many of the world’s metrology laboratories.
Hygrometer Function Figure 1-2 on page 1-5 illustrates how GE Infrastructure Sensing hygrometers detect and measure dew point. The condensate mirror is illuminated with a high-intensity, solid state, light emitting diode (LED). A photodetector monitors the LED light reflected from the mirror. The photodetector is fully illuminated when the mirror is clear of dew, and it receives less light as dew forms. A separate LED and photodetector pair are used as a known reference to compensate for any thermally induced changes in the optical components. The photodetectors are arranged in an electrical bridge circuit, the output current of which is proportional to the light reflected from the mirror. The bridge output controls the electrical current to the thermoelectric cooler.
A large bridge current develops when the mirror is dry, causing the mirror to cool toward the dew point. As dew begins to form on the mirror, less light is reflected, and the bridge output decreases. This, in turn, causes a decrease in cooling current. A rate feedback loop within the amplifier ensures critical response, causing the mirror to stabilize quickly at a temperature that maintains a thin dew or frost layer on the mirror surface. A precision thermometer element embedded within the mirror directly monitors this dew point temperature.
1-4 Features and Capabilities

January 2006
Hygrometer Calibration The Optica unit can be sent to the National Institute of Standards and Technology (NIST) in Gaithersburg, Maryland for certification or to any National Standards lab for calibration against their primary humidity standards. A calibrated instrument can then be used as a transfer standard in local laboratories to calibrate lower echelon instruments.
Caution!Field calibration is not recommended.
Hygrometers used as calibration standards must have the following characteristics:
• The mirror thermometer must have suitable long-term accuracy (such as that obtained with a platinum resistance thermometer).
• A means should be provided for viewing the dew or frost formation on the mirror.
Figure 1-2: Chilled-Mirror Hygrometer Diagram
41.2°FDew Point Temperature(Precision Thermometer)
LEDRegulation
ThermoelectricHeat Pump Power
Gain
Optical Reference
Features and Capabilities 1-5

January 2006
Other Hygrometer Applications
Many GE Infrastrucure Sensing Chilled Mirror Hygrometers are used in industrial applications in addition to metrology. The optical condensation hygrometer is not readily damaged or contaminated by industrial process gases that can degrade other secondary measurement schemes such as saturated salt and polymer-based sensors. If the sensor or sampling components should become contaminated with oils, salts, etc., they can be cleaned without harm to the sensor or impairment to the system accuracy. The performance of the hygrometer can be checked at any time by heating the mirror above the dew point, causing the dew deposit to evaporate, then reclosing the servoloop and checking to see that the system cools and returns to the same dew point.
The GE Infrastructure Sensing optical condensation sensors cover a wide range of applications limited only by the heat pumping capabilities of the thermoelectrically-cooled mirror.
At high dew points (up to 100°C), the sensor is limited by the thermal properties of the solid state optical components as well as the thermoelectric heat pump capacity.
In a typical application measuring sub-ambient dew points, a two-stage thermoelectrically-cooled mirror can reach a temperature approximately 65°C lower than an ambient (heat sink) temperature of +25°C. The thermoelectric cooler pumps heat from the mirror into the heat sink. By reducing the temperature of the heat sink with a coolant such as chilled water, or by applying the sensor in a low-temperature condition such as monitoring of a test chamber, even lower dew points can be measured. In meteorological applications where the heat sink temperature is considerably lower, frost points down to –75°C can be monitored.
Four- and five-stage sensors are available for measuring the lowest dew/frost points.
The PACER Cycle GE Infrastructure Sensing has developed and patented a compensation technique called PACER (Programmable Automatic Contaminant Error Reduction) that is very effective in reducing the Raoult Effect error associated with soluble contaminants, particularly for near-ambient dew points. The Optica is equipped with the PACER cycle as well as AUTO balance as found on earlier models. The user can choose which self-cleaning and balancing routine to run depending on the severity of contamination.
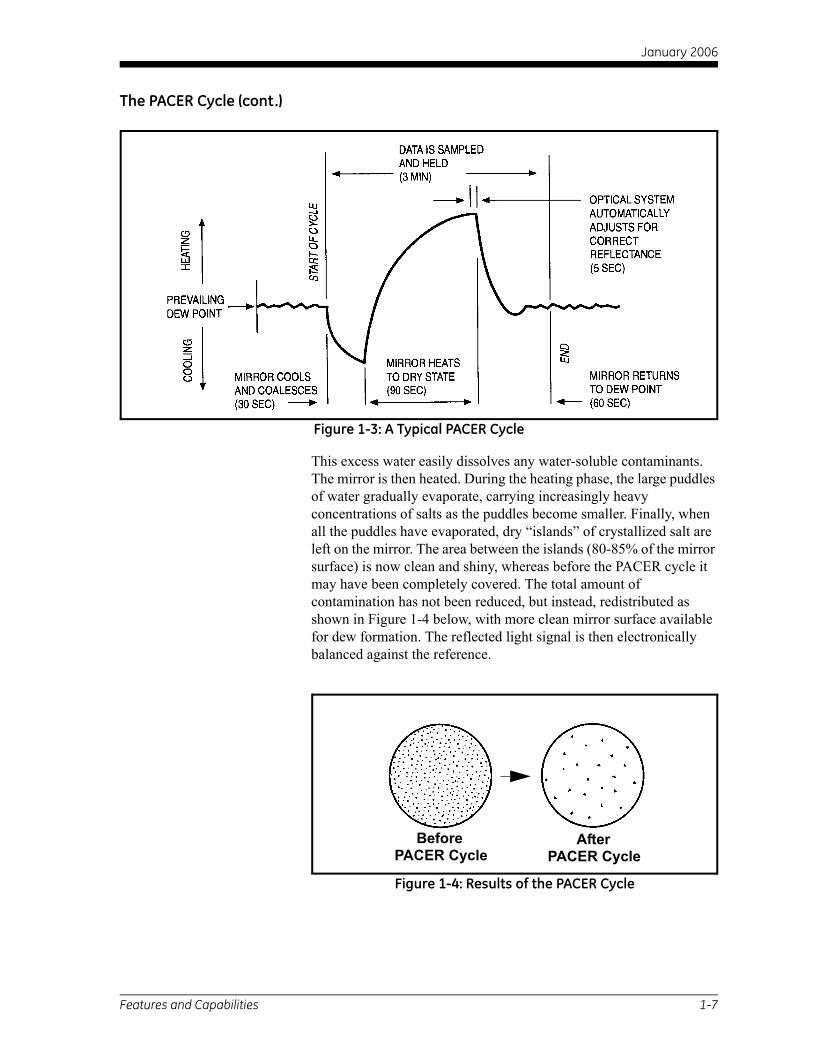
The PACER cycle, diagrammed in Figure 1-3 on page 1-7, begins with a coalescence period, during which the mirror is cooled well below the dew point of the sample gas, condensing out a large amount of water.
1-6 Features and Capabilities
January 2006
The PACER Cycle (cont.)
Figure 1-3: A Typical PACER Cycle
This excess water easily dissolves any water-soluble contaminants. The mirror is then heated. During the heating phase, the large puddles of water gradually evaporate, carrying increasingly heavy concentrations of salts as the puddles become smaller. Finally, when all the puddles have evaporated, dry “islands” of crystallized salt are left on the mirror. The area between the islands (80-85% of the mirror surface) is now clean and shiny, whereas before the PACER cycle it may have been completely covered. The total amount of contamination has not been reduced, but instead, redistributed as shown in Figure 1-4 below, with more clean mirror surface available for dew formation. The reflected light signal is then electronically balanced against the reference.
Figure 1-4: Results of the PACER Cycle
BeforePACER Cycle
AfterPACER Cycle
Features and Capabilities 1-7

Chapter 2

Installation
Introduction. . . . . . . . . . . . . . . . . . . . . . . . . . . . . . . . . . . . . . . . . . . . . . . . . . . . 2-1
Benchtop Installation . . . . . . . . . . . . . . . . . . . . . . . . . . . . . . . . . . . . . . . . . . . 2-1
Wall-Mount Installation . . . . . . . . . . . . . . . . . . . . . . . . . . . . . . . . . . . . . . . . . 2-6
Output Wiring . . . . . . . . . . . . . . . . . . . . . . . . . . . . . . . . . . . . . . . . . . . . . . . . . . 2-8
Sensor Information . . . . . . . . . . . . . . . . . . . . . . . . . . . . . . . . . . . . . . . . . . . . 2-12
Sensor Installation . . . . . . . . . . . . . . . . . . . . . . . . . . . . . . . . . . . . . . . . . . . . . 2-16
January 2006
Introduction This chapter explains the installation of the benchtop and wall-mount versions of the Optica, the various sensors used with the system, and the I/O and power wiring.
Benchtop Installation
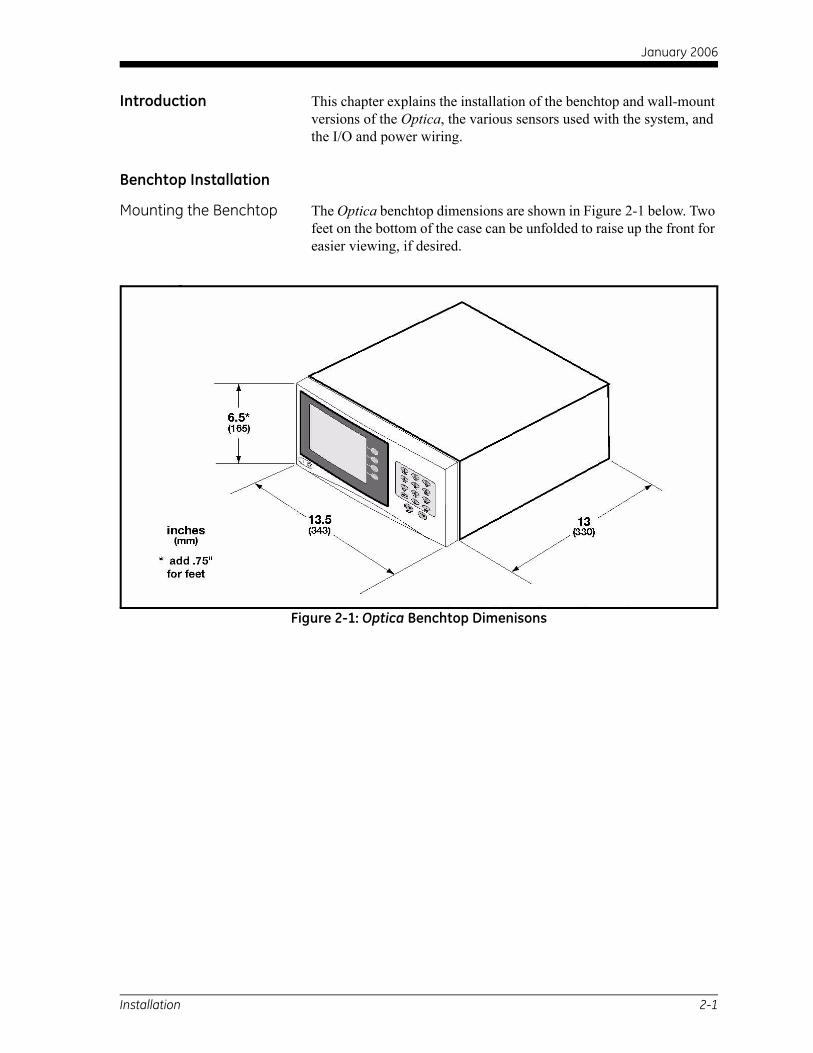
Mounting the Benchtop The Optica benchtop dimensions are shown in Figure 2-1 below. Two feet on the bottom of the case can be unfolded to raise up the front for easier viewing, if desired.
Figure 2-1: Optica Benchtop Dimenisons
Installation 2-1

January 2006
Using the Rack Mounting Option
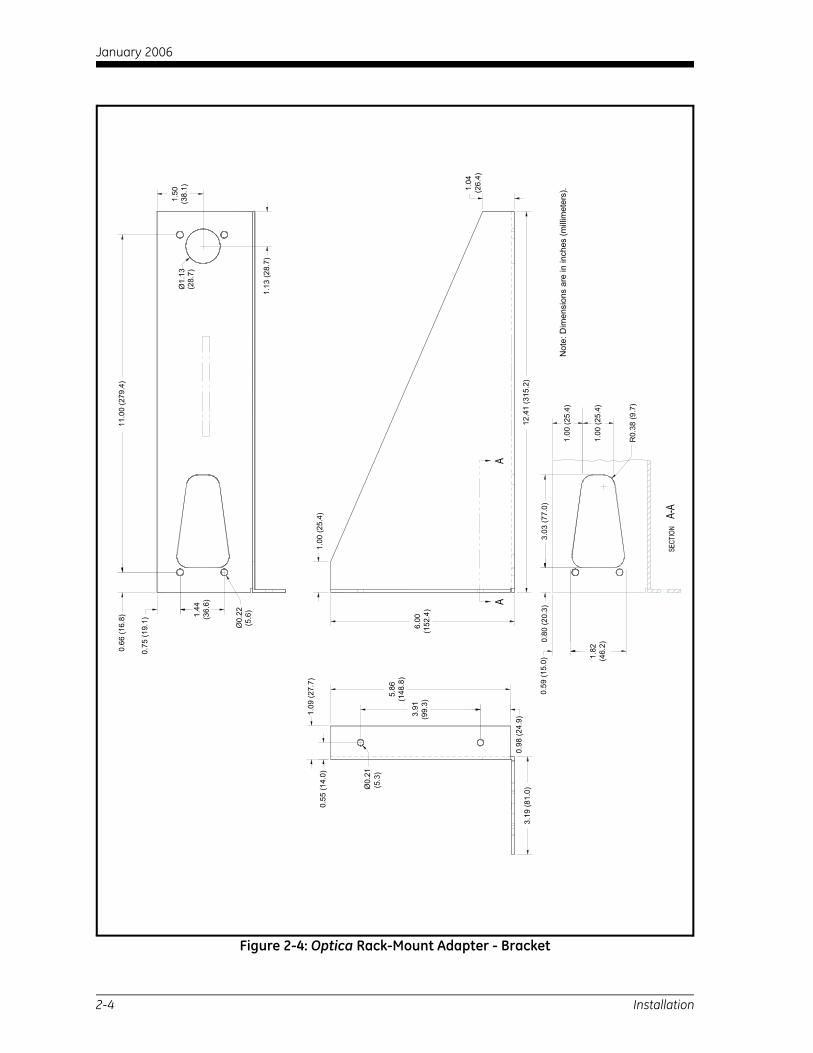
There is an optional kit for mounting the benchtop unit in a standard 19-inch rack (see Figure 2-2 below, Figure 2-3 on page 2-3, and Figure 2-4 on page 2-4). The two brackets are attached to the front panel using four No. 8 screws. The Optica is mounted to the brackets using the eight mounting holes located just in front of and behind the unit’s feet.
Figure 2-2: Optica Rack-Mount Adapter
2-2 Installation

January 2006
Figure 2-3: Optica Rack-Mount Adapter - Front Panel
1.32
(33.
5)
1.11
(28.
2)
6.52
(165
.6)
2.69
(68.
3)
3.91
(99.
3)
19.0
0 (4
82.6
)
14.6
2 (3
71.3
)
12.5
3 (3
18.3
)0.
50 (1
2.7)
2.19
(55.
6)
1.32
(33.
5)
2.88
(73.
2)
2.38
(60.
5)
8.75
(222
.3)
4.00
(101
.6)
3.00
(76.
2)
2.74
(69.
6)
3.23
(82.
0)
18.2
5 (4
63.6
)
13.5
3 (3
43.7
)
7.07
(179
.6)
0.59
(15.
0)
0.09
(2.3
)
FH-0
32-8
4 pl
aces
0.38
(9.7
)
Not
e: D
imen
sion
s ar
e in
inch
es (m
illim
eter
s).
Installation 2-3
January 2006
Figure 2-4: Optica Rack-Mount Adapter - Bracket
Not
e: D
imen
sion
s ar
e in
inch
es (m
illim
eter
s).
0.66
(16.
8)
0.75
(19.
1)
1.44
(36.
6)
11.0
0 (2
79.4
)
1.50
(38.
1)
1.13
(28.
7)
1.00
(25.
4)1.
09 (2
7.7)
0.55
(14.
0)
3.91
(99.
3)
5.86
(148
.8)
6.00
(152
.4)
0.98
(24.
9)3.
19 (8
1.0)
1.82
(46.
2)
0.59
(15.
0)0.
80 (2
0.3)
3.03
(77.
0)
1.00
(25.
4)
1.00
(25.
4)
12.4
1 (3
15.2
)
1.04
(26.
4)
2-4 Installation
January 2006
Wiring the Benchtop
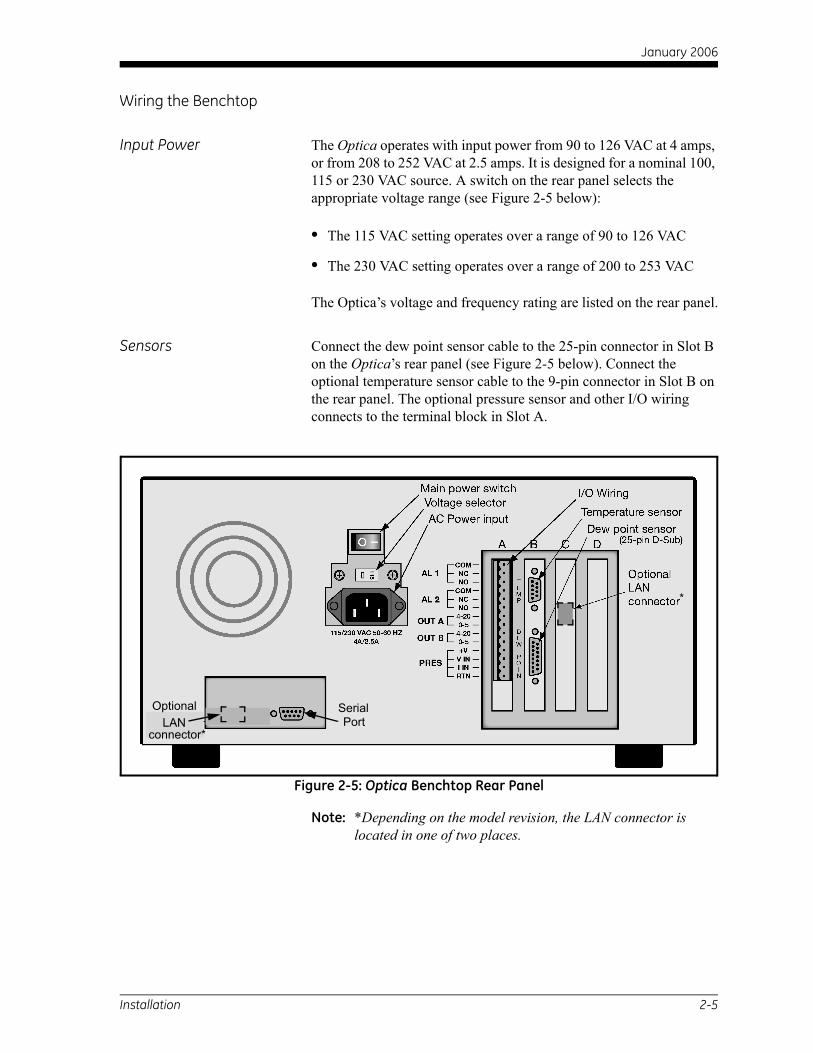
Input Power The Optica operates with input power from 90 to 126 VAC at 4 amps, or from 208 to 252 VAC at 2.5 amps. It is designed for a nominal 100, 115 or 230 VAC source. A switch on the rear panel selects the appropriate voltage range (see Figure 2-5 below):
• The 115 VAC setting operates over a range of 90 to 126 VAC
• The 230 VAC setting operates over a range of 200 to 253 VAC
The Optica’s voltage and frequency rating are listed on the rear panel.
Sensors Connect the dew point sensor cable to the 25-pin connector in Slot B on the Optica’s rear panel (see Figure 2-5 below). Connect the optional temperature sensor cable to the 9-pin connector in Slot B on the rear panel. The optional pressure sensor and other I/O wiring connects to the terminal block in Slot A.
Figure 2-5: Optica Benchtop Rear Panel
Note: *Depending on the model revision, the LAN connector is located in one of two places.
OptionalLAN
connector*
SerialPort
*
Installation 2-5

January 2006
Wall-Mount Installation The Optica Wall-Mount unit is designed to mount on a flat, vertical surface, such as a wall or panel. To mount the wall-mount version, see Figure 2-6 and Figure 2-7 below.
Mounting the Wall-Mount
Figure 2-6: Optica Wall-Mount Dimenisons
Figure 2-7: Optica Wall-Mount - Mounting Hole Locations
is recommended.1/4" hardware
below unit for cabling.Allow adequate space
17.43"(443 mm)
Ø.261 (6.63 mm)2 places
2-6 Installation

January 2006
Wiring the Wall-Mount All connections to the wall-mount unit are made through the panel at the bottom of the case as shown in Figure 2-8 below. Any I/O cabling is brought into the unit through a gland at the lower left of the case and connects to the terminal blocks on the left side of the case. Wiring for these connections is shown in Figure 2-11 on page 2-8. The dew point sensor and temperature sensor cable connectors are located near the center of this panel.
Figure 2-8: Wall-Mount Wiring Entrance Locations
Figure 2-9: Wall-Mount Bottom Panel (viewed from under the unit)
DEW POINT
Gland forI/O Wiring
IN/OUT
LANCOM
Optional EthernetLAN Connector
Serial Port
Dew Point Sensor
Gland forAC PowerWiring
4 ASB 250V TYPE T90/250 VAC 47-63 Hz
AC LINE
TEMP
Temperature Sensor
Installation 2-7
January 2006
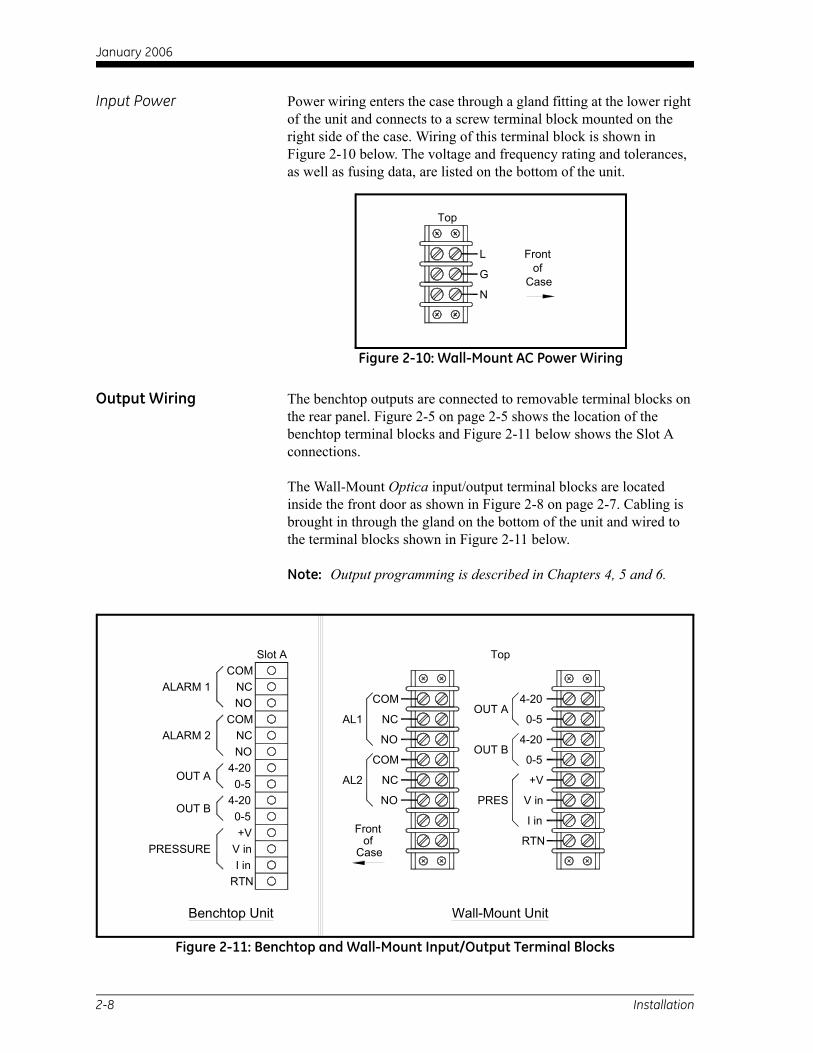
Input Power Power wiring enters the case through a gland fitting at the lower right of the unit and connects to a screw terminal block mounted on the right side of the case. Wiring of this terminal block is shown in Figure 2-10 below. The voltage and frequency rating and tolerances, as well as fusing data, are listed on the bottom of the unit.
Figure 2-10: Wall-Mount AC Power Wiring
Output Wiring The benchtop outputs are connected to removable terminal blocks on the rear panel. Figure 2-5 on page 2-5 shows the location of the benchtop terminal blocks and Figure 2-11 below shows the Slot A connections.
The Wall-Mount Optica input/output terminal blocks are located inside the front door as shown in Figure 2-8 on page 2-7. Cabling is brought in through the gland on the bottom of the unit and wired to the terminal blocks shown in Figure 2-11 below.
Note: Output programming is described in Chapters 4, 5 and 6.
Figure 2-11: Benchtop and Wall-Mount Input/Output Terminal Blocks
Top
FrontL
CaseN
G of
AL2 NCOUT A0-5
PRESSUREI in
Benchtop Unit
RTN
4-20OUT B
0-5
V in+V
Caseof
Front
NO
ALARM 1
ALARM 2
NC
COM
4-20
NCNO
NO
COMSlot A
COM
NO
COM
AL1 NC
+V
Wall-Mount Unit
PRES
I in
RTN
V in
Top
OUT B
OUT A4-20
4-20
0-5
0-5
2-8 Installation

January 2006
Analog Outputs Note: When the Optica is being programmed, the analog outputs provide 4–20mA and 0–5 VDC signals representing the designated parameters.
• For 4–20mA output, connect to terminals labelled 4–20 (+) and RTN (–).
Note: The maximum load allowed for current output is 500 Ohms.
• For 0–5 VDC output, connect to terminals labelled 0–5 (+) and RTN (–).
Note: The maximum load allowed for voltage output is 5 mA.
Example: Assume a temperature output, scaled to range from 0°C (Tlower) to 100°C (Tupper), with a measured actual temperature of 23°C (Tactual):
The voltage output is calculated by:
yielding an output voltage of 1.15V.
The current output is calculated by:
yielding an output current of 7.68 mA.
Vout Tactual Tlower–( )Tupper Tlower–( )
---------------------------------------------- 5×=
23 0–( )100 0–( )
--------------------- 5× 1.15V=
Iout mA( ) Tactual Tlower–( )Tupper Tlower–( )
---------------------------------------------- 20 4–( )× 4+=
23 0–( )100 0–( )
--------------------- 16( )× 4+ 7.68mA=
Installation 2-9

January 2006
Additional Voltage Outputs It is possible to use either of the analog current outputs as an additional voltage output by connecting a precision resistor from the current output to its return. A voltage will be produced equal to the output current times the load resistance. To produce a voltage output range of 1 to 5 volts, connect a 250 ohm resistor (0.1% tolerance recommended).
Using a 250 ohm resistor, the voltage output is calculated by::
yielding an output voltage of 1.92V for this example.
Alarm Outputs Each alarm output connects to the contacts of a 5-Amp, Form C (SPDT) relay.
Make connections as follows:
• For normally open contacts, connect to NO and COM.
• For normally closed contacts, connect to NC and COM.
Any available parameter can be used to control an alarm relay by programming the parameter name and its threshold values. An alarm can also be programmed to monitor the state of the Control, PACER Balance, or Service indicators. (See Chapter 4, 5 or 6 for programming instructions).
Two threshold values are programmed for each parameter—an upper and a lower value. These values designate an alarm band. How they are used depends on the alarm type programmed. Details of the alarm bands are shown below.
Vout Tactual Tlower–( )Tupper Tlower–( )
---------------------------------------------- 5 1–( )× 1+=
23 0–( )100 0–( )
--------------------- 4× 1+ 1.92V=
2-10 Installation

January 2006
Set Point Alarm For the Set Point alarm type, the alarm band provides hysteresis to prevent frequent operation of the alarm relay when the parameter is near the specified value. The relay is activated when the parameter exceeds the upper limit, and deactivated when the parameter goes below the lower limit.
Figure 2-12: Set Point Alarm
Inner Band Alarm For the Inner Band alarm type, the alarm relay activates whenever the parameter value is between the lower and upper limits.
Figure 2-13: Inner Band Alarm
Outer Band Alarm For the Outer Band alarm, the alarm relay activates whenever the parameter value is greater than the upper limit or less than the lower limit.
Figure 2-14: Outer Band Alarm
Installation 2-11

January 2006
Serial Output The Serial Output connector is located at the lower left of the rear panel of the bench-mount unit, and the bottom panel of the wall-mount unit. The output provides RS-232C serial communications between the unit and a terminal or a PC running in terminal emulation mode.
The connector is a standard 9-pin D connector. For connection to another serial device, the cable is wired as shown below. For a basic interface without handshaking, only pins 2, 3 and 5 (RX, TX and GND) on the Optica connector are needed. Pin connections are given for both 25-pin and 9-pin devices.
The baud rate, format of the data, number of stop bits, number of data bits, and parity can all be programmed using the menus.
Sensor Information GE Infrastructure Sensing produces a variety of sensors compatible with the Optica, ranging from one to five stages of thermoelectric cooling. A comparison chart listing specifications of each sensor is given in Appendix E. The following sections provide information on installing the following GE Infrastructure Sensing dew point sensors:
• Model 1111H — Single-stage sensor
• Model 1211H — Two-stage sensor; for high pressure and temp.
• Model D-2 — Two-stage sensor
• Model SIM-12H — Two-stage heated sensor
• Model 1311DR — Four-stage heated sensor
• Model 1311XR — Five-stage water-cooled sensor
Table 2-1: Serial Output Connections
Optica Connector 25-Pin Device 9-Pin Device
Pin Connection Pin Connection Pin Connection
2 (RX) 3 (TX) 3 (TX)
3 (TX) 2 (RX) 2 (RX)
4 (DTE) 6 (DSR) 6 (DSR)
5 (GND) 7 (GND) 5 (GND)
6 (DSR) 20 (DTE) 4 (DTE)
7 (RTS) 4 (CTS) 8 (CTS)
8 (CTS) 5 (RTS) 7 (RTS)
2-12 Installation

January 2006
Sensor Information (cont.)
When selecting a location for installing a sensor, consider the following criteria:
• Locate the sensor as close as is practical to the source of the gas to be measured, to keep the sampling lines as short as possible. This minimizes the system response time and reduces the error rate at low frost points due to sample line outgassing.
• Choose a sensor location that provides access to the dewpoint sample cavity cover, to facilitate periodic mirror cleaning.
Caution!Never place the sensor in a location where temperatures
rise above the maximum rated temperature for the device. See Appendix D for complete sensor specifications.
Sampling Lines Keep the length of sample tubing between the source and the sensor short, for quick response and highest accuracy.
All sampling line compression fittings provided with the sensor are for ¼-inch diameter tubing, unless otherwise specified at the time of order.
The material used for the inlet lines can have an important effect on the validity of the readings. Do not use rubber hose or plastic tubing such as PVC or Tygon, because of their hygroscopic nature.
When measuring frost points below –30°C, sample gas leaving the sensor outlet should be vented through an additional line three to six feet long, since backflow of ambient moisture into the sensor can take place even under positive pressure. Use stainless steel tubing and fittings, and ensure that all plumbing is completely free from leaks.
At dew/frost points above –20°C, tubing material is not as critical. Copper, Teflon, polypropylene, aluminum or brass tubing and fittings may be used. The sampling system should allow for periodic cleaning. It may be helpful to install a tee and closing valve on the inlet side, to permit the sensor to be shut off while the sampling lines are flushed. At very low humidities, even a trace amount of contamination can alter measured frost point, so cleanliness is particularly important.
Installation 2-13
January 2006
Ensuring Heat Transfer Be sure the sensor has an adequate heat sink when operating in hot environments. The sensor must never be allowed to reach a temperature above its rated limit. It is not sufficient merely to ensure that the sensor is in an environment whose temperature is below the rated limit; a means must be supplied to remove heat from the sensor.
When the Model 1111H or D-2 sensors are used at ambient temperatures of 20° to 24°C, full rated depression can be achieved by mounting the sensor on a smooth, thermally conductive surface (such as metal), which tends to remain at the ambient temperature.
If possible, do not operate the sensor continuously at or near full depression. Doing so may decrease the anticipated life of the thermoelectric heat pump.
High Dew Point Measurements
Using Heated Sensors When measuring dew points at or above the ambient temperature, the sensor must be heated to a temperature of at least 5 to 10°C above the highest anticipated dew point (but not higher than the sensor temperature rating). Some sensors can be mounted on a liquid heat exchanger, or a temperature-controlled electric hot plate, or installed in a heated enclosure. GE Infrastructure Sensing recommends closed-loop active control of the elevated sensor body temperature.
The sensor base should be coated with zinc-oxide-filled silicone thermal grease and securely anchored to the heat sink with suitable fasteners. Allow ½ hour for the sensor to reach thermal equilibrium after adjusting the temperature of the heat sink.
The GE Infrastructure Sensing SIM-12H high temperature sensor is designed for high-temperature applications. It measures dew points above ambient temperature without condensation problems.
Sample Lines for High Dew Point Measurements
Sampling lines carrying gas to the sensor must be heated and insulated when the dew point of the gas is above the sample line’s ambient temperature. The simplest way to achieve this is to use heater tape (either thermostatically controlled, or continuously operating, and sized to provide the required temperature rise). At high temperatures, use stainless steel tubing with adequate insulation to avoid hot and cold sections in the line and to avoid water absorption/desorption cycling as the heater is thermostatically controlled. Heated sampling lines (HSL) are available from GE Infrastructure Sensing.
2-14 Installation

January 2006
Filter Requirements If the gas to be monitored is free from particulates and hydrocarbon liquids or vapor, filtering is not necessary. However, most sample gas streams contain some particulates, and using a filter reduces the need for frequent mirror cleaning. On the other hand, filtering tends to slow the system’s response, particularly at low frost points.
The series 912 filters manufactured by Balston Company (or equivalent) are effective for most applications. For particulates and liquid hydrocarbons, use a Balston type DX filter element.
To filter out very fine particles, the type DX can be followed by a type BX filter. A type CI filter can be used to remove hydrocarbon vapors.
If the sample gas is heavily and routinely contaminated, we recommend using a quick-change filter element. Avoid using glass wool, cellulose, and other hygroscopic materials as a filter medium.
Flow Rate It is important to have adequate flow through the sensor. Too little flow can slow the response (particularly at very low frost points). Too much flow can cause instability of the control system at high dew points and can reduce the depression capability of the thermoelectric cooler at very low dew points. Too much flow also accelerates the rate of system contamination. A flow rate of 2 to 2.5 ft3/h (a little over 1 liter/min) is ideal for most applications. In many cases, flow rates between 0.2 and 5 ft3/h (0.1 and 2.5 liter/min) may be used.
Installation 2-15

January 2006
Sensor Installation This section provides installation details for the GE Infrastructure Sensing line of chilled-mirror humidity sensors.
Model 1111H Sensor The Model 1111H is an open-type sensor (see Figure 2-15 below). It can be threaded into standard pipe fittings or mounted in a type 0111D pressure boss, which encloses it and adapts it for ¼-inch compression fittings. When installing the sensor in the pressure boss, remove the black aluminum sensor cover.
For maximum thermal conductivity, the base of the Model 0111D pressure boss should be coated with heat-conducting grease. When so installed on a surface suitable for dissipating heat, the sensor will achieve its maximum rated depression. See the Chilled Mirror Sensor Comparison Chart in Appendix D.
Figure 2-15: Model 111H Sensor
Model D-2 Sensor The Model D-2 is a general purpose, two-stage sensor with 65°C (117°F) of depression capability. It features wetted parts of stainless steel and glass, for durability in demanding industrial applications. The Model D-2 can be used as a benchtop sensor, mounted to a heat sink, or mounted to a cooling fan for maximum operating range. Advanced features include field-replaceable optics and cooler assemblies, and auxiliary visible light optics with a viewing window for inspecting the mirror during operation (see Figure 2-16 below).
For maximum thermal conductivity, the base of the Model D-2 sensor should be coated with heat-conducting grease. When so installed on a surface suitable for dissipating heat, the sensor will achieve its maximum rated depression. See the Chilled Mirror Sensor Comparison Chart in Appendix D.
Figure 2-16: Model D-2 Sensor
2-16 Installation

January 2006
Model 1311DR Sensor The 1311DR is a stainless steel, liquid cooled, four-stage sensor suitable for measuring dew points between –75°C and +25°C.
Mount the 1311DR sensor so that the air inlet and exhaust openings are free from obstruction (see Figure 2-17 below). If the sensor is liquid cooled, vertical wall mounting is recommended, observing the “UP” arrow on the case. This ensures that condensation forming on cold portions of the 1311DR will drain from the enclosure.
At room temperatures (25°C) with air cooling, dew points from –65°C to +25°C can be measured. When operating it without liquid cooling, switch on the built-in fan. For lower frost point measurements, a chilled-water coolant loop can be used for cooling. Make sure the fan switch is off when using liquid cooling.
Sample flow rates from 0.5 to 5 standard cubic feet per hour (0.25 to 2.5 liters per minute) should be used.
Caution!If it can be avoided, do not operate the sensor
continuously at or near full depression. Doing so may decrease the life of the thermoelectric heat pump.
Liquid cooling is required for measuring frost points below –65°C (at 25°C ambient), and may be used to create faster response at higher dew point temperatures. If a recirculating chiller is used, it should have a capacity of at least 300 watts at the coolant temperature.
Switch the internal fan ON if air cooling is used; leave it OFF for liquid cooling.
Install the gas sampling lines according to the instructions listed in the section Sampling Lines on page 2-13.
Figure 2-17: Model 1311DR Sensor
Installation 2-17

January 2006
Model 1311XR Sensor The 1311XR is a stainless steel, water cooled, five-stage sensor (see Figure 2-18 below) that can measure frost points as low as –80°C. The sample gas flow rate should be between 1 and 5 ft3/h. The maximum permissible coolant temperature is +50°C; the minimum is –10°C. A minimum coolant flow rate of 0.1 gallons per minute must be maintained for most dew point measurements. If the fourth stage power supply control is set below –65°C, the minimum coolant flow rate is 0.25 gal/min. The coolant temperature affects the maximum dew/frost point depression. For frost points of –80°C, coolant temperature should be below 20°C.
Figure 2-18: Model 1311XR Sensor
Electrical Connections All the electrical connectors on the Model 1311XR dew/frost point sensor are unique. The cables supplied with the sensor can only interconnect the system in one way. Connect the cables as follows:
1. Plug the instrument into a 115/230 VAC power outlet.
2. Connect the 37-pin round black connector on the back of the instrument to the 19-pin military-style connector on the back of the 1311XR sensor.
3. Connect the 17-pin military style connector on the back of the 1311XR sensor to the 24-pin round connector on the back of the heat pump controller module.
4. Connect the 9-pin round connector on the back of the heat pump controller module to the 8-pin rectangular connector on the back of the fourth stage heat pump power supply.
5. Plug the heat pump power supply into a 115/230 VAC outlet.
Coolant Connect the two 3/8-inch brass compression fittings on the back of the 1311XR sensor to the coolant lines. Do not run the instrument without sufficient coolant flow.
Suitable coolants include water, glycol and other noncorrosive liquids. The coolant can be recirculated liquid or tap water that is cooled or chilled. If a recirculating chiller is used, it should have a capacity of at least 600 watts at the coolant temperature.
Sample Gas Fittings The 1311XR sensor has 1/4-inch stainless steel compression fittings for sample gas inlet and outlet at the back of the sensor chassis.
2-18 Installation

January 2006
Heat Pump Controller Settings
The 1311XR’s heat pump controller module has the following settings:
Note: The third-stage power indicator may blink in any setting. This is normal.
Fourth-Stage Power Supply Control Knob
The control knob on the 1311XR’s fourth-stage power supply sets the power consumption limit and the coolant requirement when measuring dew/frost points using the AUTO or BELOW –55°C settings. Set this knob to the lowest anticipated dew/frost point.
If the control is set lower than necessary, the system dissipates excess power and requires additional cooling to remove the extra heat generated. If the setting is too high, the system may not be able to reach the true dew/frost point.
To allow the 1311XR sensor to act as a turnkey system (whereby it will cover its entire range automatically), set the switch to AUTO and the power supply control knob to the –80°C position.
Heat Pump Controller Error Indicators
The heat pump controller module has two overheat indicators connected to thermal shutdown switches. If either indicator comes on, check for and correct any problems before continuing operation. Check the cable connections, coolant flow and coolant temperature.
Table 2-2: Model 1311XR Heat Pump Controller Settings
Setting Function
AUTO
When set to AUTO, the system operates fully automatically, controlling the heat pump in response to any dew/frost point within its operating range. In AUTO mode, the controller senses the current supplied by the Optica to the top two stages of the thermoelectric coolers. The controller switches on the fourth stage power supply, as required to maintain the mirror temperature at the dew/frost point.
The AUTO setting is recommended for most applications.
Below –55°CIf the frost point is known to be below –55°C, the switch can be set to this position to provide slightly faster response than the AUTO setting. However, depression is limited at this setting. If frost points approaching –80°C are to be measured, use the AUTO setting.
–65°C to –10°C If the dew/frost point is known to be between –65°C and –10°C, the switch can be set to this position to reduce overshoot and settling time.
Above –25°C If the dew/frost point is known to be above –25°C, the switch can be set to this position to reduce overshoot and settling time.
Installation 2-19
January 2006
Purging the Sensor Caution!The 1311XR must be purged after each use, either with the sample gas after measuring it, or with another dry
gas source. Otherwise, condensation inside the sensor housing may cause corrosion and eventual failure of the
thermoelectric coolers.
For extremely dry gas measurements, the 1311XR sensor enclosure must be purged with a gas having a frost point lower than –20°C. For intermediate temperatures, any gas having a frost point at least as low as the sample gas can be used.
The sample gas outflow from the sensor can be used for this purpose, if it is suitable (non-explosive, non-lethal, etc). Introduce the purge gas to the enclosure via the purge fitting on the rear of the sensor. The simplest method for purging is to run the sample gas outflow through the U-tube supplied with the sensor.
Model SIM-12H Heated Sensor and Components
The SIM-12H heated sensor module is suitable for measuring dew/frost points between –10°C and +85°C. It contains precision heating, as well as cooling, capability. Three separate heaters are located in the sensor walls, 120 degrees apart. Three temperature sensors measure the body temperature at those points, and three control circuits precisely adjust the temperature of each heater. Any detected temperature gradient across the sensor cavity is immediately eliminated, resulting in very even control. All three heaters are controlled by the temperature set by the front panel selector knob. The sensor is a two-stage unit, providing 65°C of depression capability, and 60°C actual measurement range.
Type SIM-HFT Heated Filter Module
The SIM-HFT heated filter module allows the sample gas to be purged of particulate contaminants prior to entering the sensor. The incoming gas is first passed through a 90-micron prefilter, then a 15-micron final filter. All parts in contact with the sample are heated to a constant 105°C, eliminating any possibility of condensation. The sintered filters are easily removed for cleaning or replacing if required.
Type SIM-HFM Heated Flow Meter
The SIM-HFM heated flow meter module allows the sample gas flow rate to be both measured and controlled at a rate that is optimum for the sensor. A metering valve mounted on the front panel allows control over a range of 0 to 2 ft3/h. All parts in contact with the sample gas are heated to a constant 105°C, so that no condensation occurs. The flow meter is normally mounted downstream from the heated sensor.
2-20 Installation

January 2006
Type SIM-HSL Heated Sampling Line
The SIM-HSL heated sampling line is self-regulated at a temperature high enough to ensure that no condensation occurs. The line is made of ¼-inch outside diameter Teflon, with stainless steel fittings.
Type SIM-MPL Mounting Plate
The SIM-MPL mounting plate is designed to accept one, two or three heated modules: the heated sensor, the heated filter, and the heated flow meter. The mounting plate provides a convenient method of wall-mounting the entire heated sampling system. When ordered with one or more modules, the factory performs all mounting, plumbing and wiring work, thus providing a complete system ready for installation.
Connecting the Sensors Dew point, temperature and pressure sensors provided by GE Infrastructure Sensing for the Optica monitor are pre-wired with connectors installed. Plug these connectors into their corresponding sockets as shown in Figure 2-5 on page 2-5 for the benchtop unit, or Figure 2-8 on page 2-7 for the wall-mount unit.
Installation 2-21

Chapter 3

Operation
Introduction. . . . . . . . . . . . . . . . . . . . . . . . . . . . . . . . . . . . . . . . . . . . . . . . . . . . 3-1
Normal Operation . . . . . . . . . . . . . . . . . . . . . . . . . . . . . . . . . . . . . . . . . . . . . . 3-1
Operating the VGA Optica . . . . . . . . . . . . . . . . . . . . . . . . . . . . . . . . . . . . . . . 3-2
Operating the 4x40 Optica. . . . . . . . . . . . . . . . . . . . . . . . . . . . . . . . . . . . . . . 3-3
Network Operation . . . . . . . . . . . . . . . . . . . . . . . . . . . . . . . . . . . . . . . . . . . . . 3-3
Process Pressure . . . . . . . . . . . . . . . . . . . . . . . . . . . . . . . . . . . . . . . . . . . . . . . 3-4
Status Line Indications . . . . . . . . . . . . . . . . . . . . . . . . . . . . . . . . . . . . . . . . . . 3-8
Sensor Balancing . . . . . . . . . . . . . . . . . . . . . . . . . . . . . . . . . . . . . . . . . . . . . . 3-10
Helpful Hints For Operating the Unit . . . . . . . . . . . . . . . . . . . . . . . . . . . . . 3-10

January 2006
Introduction Operating instructions fall into three categories:
• Normal Operation - Using the unit’s controls.
• Setup and Programming - Customizing the unit for specialized applications (not required for many conventional applications).
Note: The unit is shipped pre-programmed to meet typical requirements. The factory default settings are listed in Table 3-2 on page 3-9. Complete programming instructions are given in Chapters 4, 5, and 6.
• Maintenance - Manually testing the unit’s cooling capacity, cleaning the mirror, and other operations that might be required on a regular basis, or when a problem is suspected, depending on the application. Details are given in Chapter 7, Maintenance.
Normal Operation Normal operation of the Optica is very simple. To turn the unit on, check that the main power switch on the rear of the benchtop unit is set to ON (—), then press the right-hand side of the power switch (located at the lower left corner on the front of the unit).
The Optica begins its power-up sequence, which lasts about a minute. The unit’s software version is displayed on the initial screen. The status line displays Initializing. Next, the Optica performs a PACER balance. The PACER balance typically requires five to fifteen minutes, depending on the sensor chosen and the humidity of the sample gas during the balance cycle. The status line displays Balance Acquiring.
Once the balance cycle is completed and the unit reaches steady state, Control is displayed in the status bar at the bottom of the screen.
The sensor can be controlled using the softkeys to the right of the display, shown on the screen below. The operator can manually heat or cool the sensor, or initiate a PACER balance cycle.
Operation 3-1

January 2006
Operating the VGA Optica
The parameters chosen during programming are displayed numerically in the top half of the screen, and graphically at the bottom (see Figure 3-1 below). To program the unit, see Chapter 4.
A balance indicator is shown as a vertical bar on the right side of the screen. It shows the state of the feedback control loop controlling the mirror temperature. When the system reaches steady-state (the Control status indicator is displayed), the balance indicator should be near the center of its range. If the balance indicator is near the top or bottom of its range, the dew point sensor may need to have its optics signal level adjusted (see Balancing the Sensor Optics on page 7-2).
Figure 3-1: Typical VGA Display Screen
3-2 Operation

January 2006
Operating the 4x40 Optica
The parameters chosen during programming are displayed numerically on the top three lines of the display. For programming, see Chapter 5. A typical 4x40 display screen is shown below. The system status is shown in the lower left, and the balance indicator is shown in the lower right.
Figure 3-2: Typical 4x40 Display Screen
The balance indicator should show about five to seven blocks in normal operation. If it shows fewer than four or more than eight, the dew point sensor may need to have its optics signal level adjusted (see Figure 3-3 below and Balancing the Sensor Optics on page 7-2).
Figure 3-3: Possible Balance Indicator Displays
Network Operation The VGA Optica can be operated and programmed remotely over a network. Networked operation is very similar to operation using the front panel. For programming from a network, see Chapter 6. A typical network screen is shown in Figure 3-4 below.
Figure 3-4: Typical Network Screen
ControlTmp ° C 25.355
%RH 10.3Tdew ° C 8.47996 Heat
PacerCool
well-balancedSensor not
CoolPacer
Heat
Sensor notwell-balanced
Sensorbalanced
PacerCoolHeat
CoolPacer
Heat
Operation 3-3
January 2006
Process Pressure The Optica provides several ways of measuring or specifying sample gas pressure (needed for pressurized humidity measurements). You can:
• actively measure the pressure at the dew point sensor, or
• manually enter the pressure, if it is known and stable, or
• “sample-off” a high-pressure gas sample for measurement at a lower pressure (usually atmospheric) and let the Optica calculate dew point at the process pressure.
For example: a sensor with a maximum pressure rating of 300psi cannot be subjected to a process pressure of 500 psi. A sampling system can be arranged to allow the measurement to be made at atmospheric pressure. The Optica can then calculate and display the dew point at the process pressure (see Scenario 2 on page 3-6).
Actively Measuring Process Pressure
Use when the process pressure is within the specifications of the dew point sensor and can be measured directly. In the Pressure Input menu, set the Pressure Input to V or I as appropriate for the pressure sensor. Set the Process Pressure Status to Disabled.
Note: The pressure measured by the pressure sensor will be used to compute the vapor pressure.
Manually Entering Pressure
Use when the process pressure is a known and fixed value, and will not be actively measured. In the Pressure Input menu, set the Pressure Input to Use Default. Enter the pressure into the Default field. Set the Process Pressure Status to Disabled.
Note: The default pressure entered will be used to compute the vapor pressure.
Measuring at a Different Pressure
Use when: the humidity must be measured at a pressure that is lower or higher than the process pressure, but the reported value must represent the humidity at the process pressure. Scenario 2 below gives examples of programming the Optica for this case.
Note: The process pressure is entered manually and the humidity sensor pressure may be measured or manually entered.
Examples of the use of the Process Pressure menu are shown
3-4 Operation
January 2006
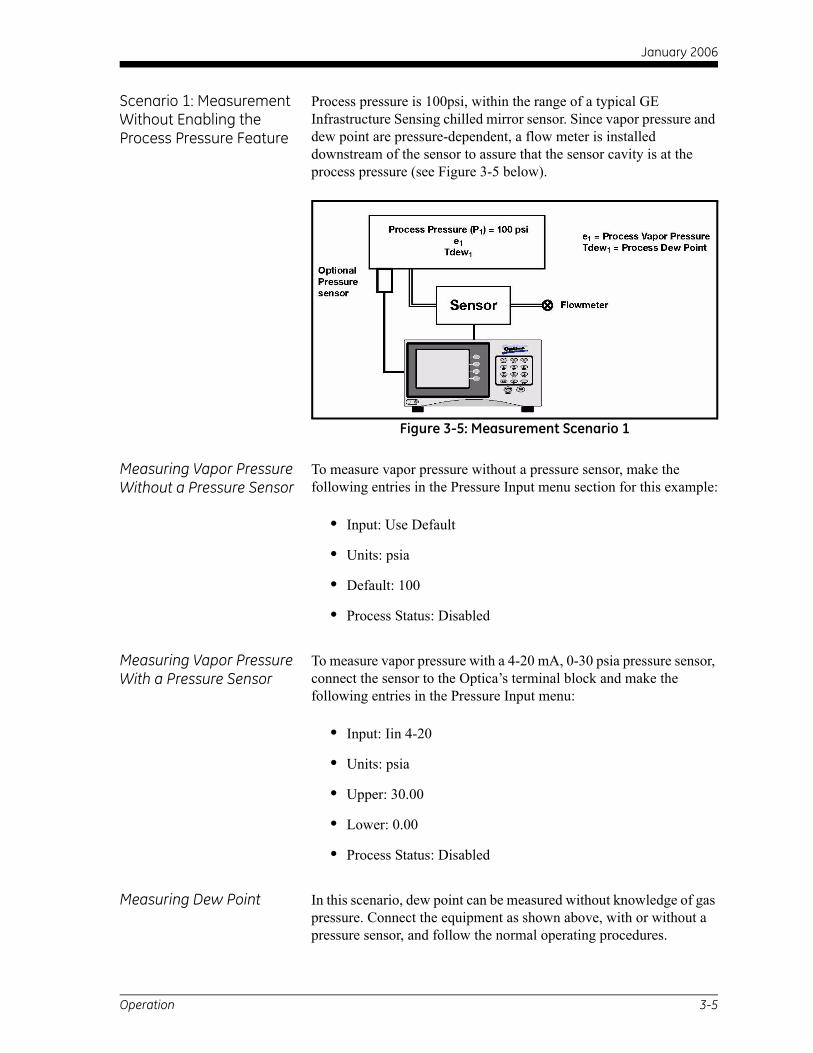
Scenario 1: Measurement Without Enabling the Process Pressure Feature
Process pressure is 100psi, within the range of a typical GE Infrastructure Sensing chilled mirror sensor. Since vapor pressure and dew point are pressure-dependent, a flow meter is installed downstream of the sensor to assure that the sensor cavity is at the process pressure (see Figure 3-5 below).
Figure 3-5: Measurement Scenario 1
Measuring Vapor Pressure Without a Pressure Sensor
To measure vapor pressure without a pressure sensor, make the following entries in the Pressure Input menu section for this example:
• Input: Use Default
• Units: psia
• Default: 100
• Process Status: Disabled
Measuring Vapor Pressure With a Pressure Sensor
To measure vapor pressure with a 4-20 mA, 0-30 psia pressure sensor, connect the sensor to the Optica’s terminal block and make the following entries in the Pressure Input menu:
• Input: Iin 4-20
• Units: psia
• Upper: 30.00
• Lower: 0.00
• Process Status: Disabled
Measuring Dew Point In this scenario, dew point can be measured without knowledge of gas pressure. Connect the equipment as shown above, with or without a pressure sensor, and follow the normal operating procedures.
Operation 3-5

January 2006
Scenario 2: Measurement Requiring the Process Pressure Feature
Process pressure is 500 psi, above the measurement range of a typical GE Infrastructure Sensing chilled mirror sensor. A flow meter is installed upstream of the sensor cavity to expand the gas to be within the measurable range of the dew point sensor. Since we wish to measure the dew point of the process gas and dew point is pressure dependent, an accurate dew point measurement at the process pressure requires accommodating for the expansion to the sensor cavity pressure by using the Optica’s Process Pressure feature (see Figure 3-6 below).
Figure 3-6: Measurement Scenario 2
Measuring Vapor Pressure Without a Pressure Sensor
To measure vapor pressure without a pressure sensor, make the following entries in the Pressure input menu section for this example:
• Input: Use default
• Units: psia
• Default: 14.7 (the pressure at the dew point sensor)
In addition, to accommodate the pressure expansion, the following entries are required in the Process section:
• Status: enabled
• Pressure: 500 (specify the process pressure with the same units as the default pressure specified above)
3-6 Operation

January 2006
Measuring Vapor Pressure With a Pressure Sensor
To measure vapor pressure with a 4-20 mA, 0-30 psia pressure sensor, connect the equipment as shown above and make the following entries in the Pressure Input menu section.
• Input: Iin 4-20
• Units: psia
• Upper: 30.00
• Lower: 0.00
In addition, to accommodate the pressure expansion, the following entries are required in the Process section:
• Status: enabled
• Pressure: 500 (specify the process pressure with the same units as the default pressure specified above)
Measuring Dew Point With or Without a Pressure Sensor
In Scenario 2, the dew point measurement requires both the sensor pressure and the process pressure to be known. Sensor pressure can be entered as a default value, or measured, as above, and the process pressure must be entered in the Process Pressure field.
Example (using standard atmospheric conditions at 25°C)
P1 = 500 psiaP2 = 14.7 psia
As measured by the GEI chilled mirror dew point sensor:
Tdew2 = –40°C @ P2e2 = 0.1283 mbar
Per Dalton’s Law of Partial Pressure:
e1 = (P2/P1) × e2 = (500/14.7) × 0.1283 = 4.36 mbar
Using standard vapor pressure equations, the actual pressurized dew point is calculated by the Optica to be:
Tdew1 = –4.022°C
Operation 3-7

January 2006
Status Line Indications The status line at the bottom of the display shows whether the unit is ready for normal operation, or is still in its start-up phase, or needs service. The following is a complete list of status indications:
Table 3-1: Status Indications
Indication Meaning
Initializing The unit is initializing.
Balance The unit is performing a PACER balance to clear the mirror.
Acquiring The unit is acquiring stable mirror temperature.
Service The sensor optics require service, cleaning or adjustment.
Control The unit is actively controlling the mirror temperature at a stable dew point.
Alarm 1 Alarm 1 has activated.
Alarm 2 Alarm 2 has activated.
Lockout Heat, Cool, and PACER front panel controls aredisabled.
Heat Sensor Heating is active.
Cool Sensor Cooling is active.
3-8 Operation

January 2006
Factory Default Settings As shipped from the factory, the Optica is normally programmed with the configuration shown in Table 3-2 below.
Table 3-2: Factory Default Values
Function Setting
Analog Output AAnalog Output B
Humidity, Units: Tdew °C, Range: –40°C to +60°CTemperature, Units: Tmp °C, Range: 0 to 100°C
Pressure Input 1 Units: psia, Range: 0–30, Default pressure: 14.70,Process pressure: disabled, 14.70
Alarm 1Alarm 2
Disabled, Humidity, Units: Tdew °C, Set Point: 100.00Disabled, Temperature, Units: Tmp °C, Set Point: 100.00
Auto Balance Interval: 720 minutes, Automatic, Disabled, Hold
Data Field 1Data Field 2Data Field 3Data Field 4Data Field 5Data Field 6
Humidity, Units: Tdew °C, Range: –40.000 to +60.000°C, Color: green, 1 decimalHumidity, Units: %RH, Range: 0 to 100, Color: blue, 1 decimalTemperature, Units: Tmp °C, Range: 0 to 100, Color: red, 1 decimalPressure, Units: psia, Range: 0 to 100, Color: yellow, 1 decimalHumidity, Units: ppmv, Range: 0 to 1,000,000, Color: brown, 1 decimalHumidity, Units: ppmw, Range: 0 to 100, Color: violet, 1 decimal
Buzzer 15 msec
General Data Fields: 3, Lockout: disabled, Offsets and filters: 0
Special Molecular Weight of Gas: 28.9645
User Equation None entered
Communication Parameters
Mode: All, Baud rate: 9600, Parity: none, Data bits: 8, Stop bits: 1,Flow control: none
Serial Outputs
Humidity: Units: Tdew °C, Format: DP=##.#, Separator: CR-LF, Terminator: CR-LF, Interval: 1 second, Time Stamp: Enabled, Show Status: EnabledTemperature: Units: Tmp °C, Format: DP=##.#, Separator: CR-LF, Terminator: CR-LF, Interval: 1 second, Time Stamp: Enabled, Show Status: EnabledPressure: Units: psia, Format: DP=##.#, Separator: CR-LF, Terminator: CR-LF, Interval: 1 second, Time Stamp: Enabled, Show Status: Enabled
SelectedOutputs
Humidity, Units: Tdew °CHumidity, Units: % RHTemperature, Units: Tmp °C
Data Log Status: Disabled, Interval: 1 second, Separator: comma, Terminator: CR-LF, Parameters: humidity, Units: Tdew °C
Operation 3-9
January 2006
Sensor Balancing During normal operation, the sensor mirror surface may become partially obscured with salts or other contaminants from the sample gas. The balance indicator displayed on the screen shows whether the system is operating near the center of its normal range, or has been forced away from the center by mirror contamination. In general, it is recommended to start with an AUTO balance cycle provided relatively clean gases are being used. If the Service status indicator is displayed after an AUTO cycle, the mirror is likely still dirty and may require use of a PACER cycle (described in detail on page 1-6). In most applications, it is desirable to perform a balance operation periodically to maintain optimum performance. The interval and type of balance are configurable as described in chapters on Optica programming.
If the Service indicator is displayed after a balance operation, the sensor may need to be adjusted (see Balancing the Sensor Optics on page 7-2).
Helpful Hints For Operating the Unit
Time response At dew points above 0°C, the system stabilizes within a few minutes at a consistent dew layer. The status Control is displayed when the system is stable and readings are valid.
When the system is operating at low frost points (below –40°C), extra care may be required when interpreting readings because of the longer response times of the system. Time response depends on a number of factors including dew/frost point, slew rate, upstream filtering, and flow rate.
• As the dew/frost point becomes lower, water molecules in the air sample become scarcer, and it takes longer to condense a frost layer on the mirror thick enough to establish an equilibrium condition.
• Mirror temperature slew rate depends on dew point and depression (the temperature difference between the mirror and the sensor body); at higher dew points and moderate depressions, it is typically 1.5°C/second. At lower dew points and/or larger depressions, the slew rate is slower.
• Flow rate affects response by determining the rate at which water vapor is supplied or carried off.
There is, of course, a trade-off between response time, control system stability, and sensitivity to contamination.
3-10 Operation
January 2006
Supercooled Dew Points Slightly below the freezing point, water can exist in a supercooled liquid state for extended periods of time. Extra care may be needed when making measurements in the frost point region of 0 to –20°C, because the mirror temperature may temporarily stabilize at the supercooled dew point, 0.5 to 1°C below the actual frost point.
To assure that the unit is operating in the ice phase within this temperature range, allow the instrument to operate continuously. Before manually clearing a frost layer, take a reading, and afterwards allow sufficient time to reform a stable frost layer before taking further readings.
Contamination
Mirror Cleanliness Proper operation of a condensation hygrometer depends on the condition of the mirror surface. In general, accuracy is reduced when contaminants accumulate on the mirror.
However, the mirror does not have to be microscopically clean. In fact, the mirror performs best a few hours after cleaning, when nucleation sites have formed. On an unscratched, freshly cleaned mirror, there are relatively few nucleation sites on which dew or frost deposits can form, and more time is required to collect a condensation layer at low frost points. Also, overshoot may occur, which can cause oscillations as the temperature stabilizes.
Particulate Contaminants Particulate matter that is insoluble in water may accumulate on the mirror surface, but does not affect the instrument accuracy until the mirror reflectance is reduced substantially. In many cases, particulates improve instrument response by providing condensation sites.
Operation 3-11

January 2006
Water-Soluble Contaminants
Contaminants which readily dissolve in water, such as naturally occurring salts, are detrimental to accurate vapor concentration measurement by any condensation method. These materials readily go into solution with the water condensate on the mirror surface, and then reduce the vapor pressure in accordance with Raoult’s Law. As the concentration increases with time, the saturation vapor pressure of the liquid solution decreases.
The unit responds to this lower vapor pressure by elevating the mirror temperature in order to maintain a vapor pressure that is in equilibrium with the partial pressure of atmospheric water vapor. The displayed dew point, therefore, drifts upward above the true dew point. Because the measurement error increases gradually, it often goes undetected.
To determine whether dissolved contaminants are affecting dew point measurement, perform the following steps:
1. Note the indicated dew point.
2. Clean the mirror.
3. Balance the detector by initiating a PACER cycle.
4. Measure the dew point again.
If the new reading is lower than the first reading, it is likely that soluble material was present in sufficient quantity to cause a measurement error.
Gaseous Contaminants When a gaseous material that has a higher condensation temperature than that of water is present (even in very low concentrations), the unit will eventually control on that material, rather than on water. The system then displays the condensation temperature of the contaminant, not of water. Such material accumulates on the mirror only when chilled. In the normal atmosphere, gaseous contaminants do not have a detectable effect.
3-12 Operation

January 2006
Minimizing the Effects of Contaminants
The following steps are suggested for maintaining optimum performance:
• Use the PACER feature to reduce the effect of contaminants on the unit’s performance (see The PACER Cycle on page 1-6).
• Reduce the gas flow rate to reduce the rate of accumulation of contaminants on the mirror.
• Clean the mirror according to the recommended optics cleaning procedure (see Cleaning the Sensor Mirror on page 7-1). To determine the proper cleaning interval for a given set of conditions, take a dew point reading before and after the cleaning. Any appreciable shift indicates that under these conditions, the mirror should be cleaned more often.
Mirror Flooding If there is an abrupt transition from dry to moist conditions (particularly when accompanied by a transition from cold to warm temperatures), the mirror may accumulate an overload of moisture. It then may take several minutes before the sensor dries out and valid readings can be obtained. The drying process can be accelerated by heating the sensor.
Sample Line Maintenance Contaminated sample lines slow the unit’s response time and can cause erroneous readings, usually on the high side. Clean the sample lines as often as necessary. To determine the required cleaning frequency, take dew point readings before and after cleaning the lines, sensor cavity, and mirror. If the two readings differ appreciably, the sampling lines should be cleaned more often. To reduce the rate of contamination, reduce flow and/or install a filter upstream.
Pressure Effects If the pressure of the gas is increased or reduced from atmospheric pressure, but the mixing ratio (moisture content) stays constant, the dew point is correspondingly increased or decreased. The Optica displays the dew/frost point at the pressure to which the sensor chamber is exposed. The sensor location and hookup arrangement can influence the pressure.
When the pressure at the sensor is different from the process pressure, the Optica can perform a conversion from the measured pressure to the desired process pressure (see Process Pressure on page 3-4 for details).
Alternatively, the dew point change due to pressure change can be calculated by using Dalton’s Law and the Smithsonian Tables or a proper nomograph. Appendix C contains basic data for these calculations.
Operation 3-13

Chapter 4
Programming the VGA Optica
Introduction. . . . . . . . . . . . . . . . . . . . . . . . . . . . . . . . . . . . . . . . . . . . . . . . . . . . 4-1
Programming Fundamentals. . . . . . . . . . . . . . . . . . . . . . . . . . . . . . . . . . . . . 4-1
Units of Measure. . . . . . . . . . . . . . . . . . . . . . . . . . . . . . . . . . . . . . . . . . . . . . . . 4-4
User Equations . . . . . . . . . . . . . . . . . . . . . . . . . . . . . . . . . . . . . . . . . . . . . . . . . 4-4
Menu 1 . . . . . . . . . . . . . . . . . . . . . . . . . . . . . . . . . . . . . . . . . . . . . . . . . . . . . . . . 4-6
Menu 2 . . . . . . . . . . . . . . . . . . . . . . . . . . . . . . . . . . . . . . . . . . . . . . . . . . . . . . . 4-15
Saving Configuration Files . . . . . . . . . . . . . . . . . . . . . . . . . . . . . . . . . . . . . . 4-20
January 2006
Introduction The Optica is programmed at the factory to display and output the data required for many applications (see Table 3-2 on page 3-9). In these cases, no further programming is required.
By programming the Optica, the following categories of data can be customized for your application:
• the front panel display (up to six parameters displayed numerically and, on the VGA screen, a graphical display)
• pressure input
• analog outputs
• serial output
• built-in alarms
• datalogging
• miscellaneous functions
A built-in help system is included to answer questions you may have while operating the unit. Select the HELP button and press ENTER to access it.
Programming Fundamentals
Programming is accomplished using two main menu screens and several secondary screens. Each screen displays data fields and control buttons. Use the TAB key to step through the fields on each screen—through both the data fields and the control buttons.
• when a data field is selected, you can change the value of the field as described on page 4-2.
• when a control button is selected, pressing ENTER performs the button’s function.
• The MORE control button accesses the next programming menu.
• The OK control button returns to the previous level.
• The HELP button accesses the unit’s built-in help system.
Programming the VGA Optica 4-1

January 2006
The Keys The following keys on the Optica’s front panel are used for programming:
• ENTER Performs the function shown on a selected control button.
• TAB Moves cursor to the next field or control button to select it.
• SHIFT An alternate action key—each press toggles SHIFT-KEY mode on or off. When SHIFT-KEY mode is on, a green annunciator is displayed in the lower left corner of the screen. SHIFT-KEY mode does the following:
• accesses the alphabetic characters below the keys on the alphanumeric keyboard.
• causes the TAB key to move the cursor backwards through the fields.
• Ten alphanumeric keys For entering numbers, letters and math functions.
• BSP (Backspace) During direct data entry, deletes the character to the left of the cursor.
• Four softkeys:
• during normal operation, control the sensor heating and cooling, and balance function.
• during programming, move the cursor on the screen and select specific characters for each key on the alphanumeric keyboard.
Data Entry Fields There are two types of data entry fields:
• direct entry
• drop-down boxes
Direct-Entry Fields Direct-entry fields allow new values to be entered directly from the alphanumeric keyboard. Use the left and right softkeys to move the flashing cursor on the screen to the desired character.
• To enter numeric data, just press the appropriate key.
• To enter alphanumeric data, first press SHIFT to access the letters on the keypad, and then press the appropriate key containing the desired letter. Finally, press the UP or DOWN arrow softkeys to step through the letters available for that key, both upper and lower case.
4-2 Programming the VGA Optica
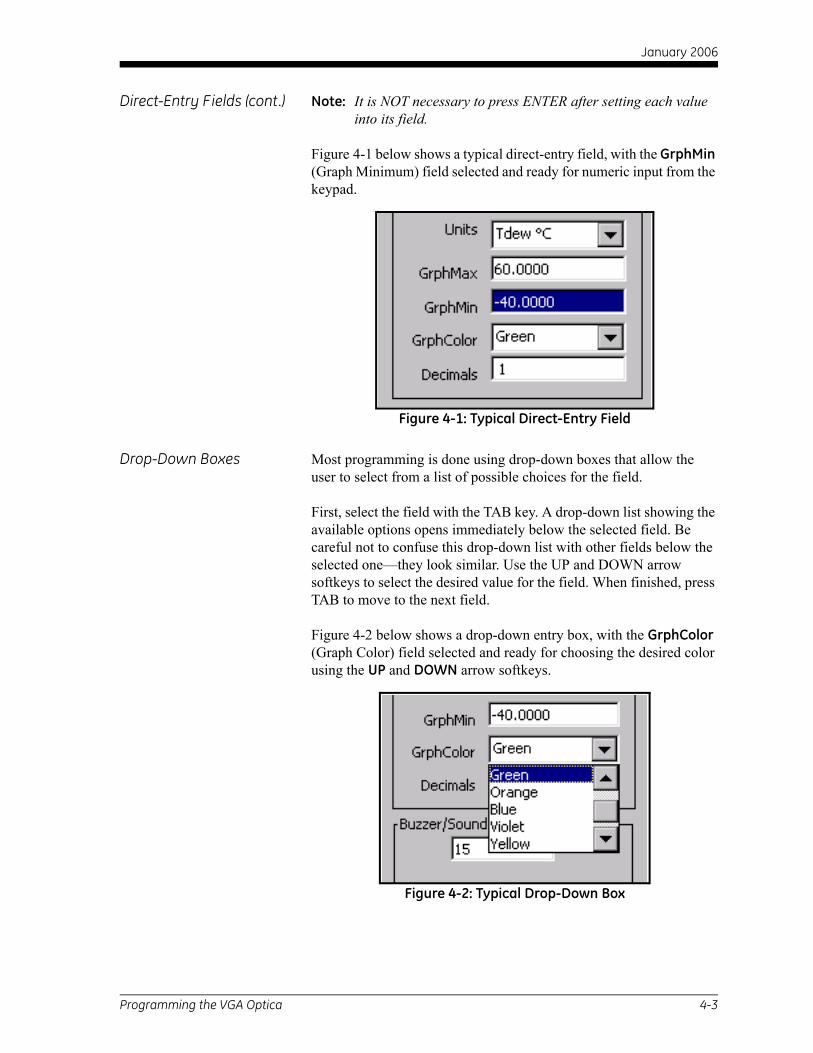
January 2006
Direct-Entry Fields (cont.) Note: It is NOT necessary to press ENTER after setting each value into its field.
Figure 4-1 below shows a typical direct-entry field, with the GrphMin (Graph Minimum) field selected and ready for numeric input from the keypad.
Figure 4-1: Typical Direct-Entry Field
Drop-Down Boxes Most programming is done using drop-down boxes that allow the user to select from a list of possible choices for the field.
First, select the field with the TAB key. A drop-down list showing the available options opens immediately below the selected field. Be careful not to confuse this drop-down list with other fields below the selected one—they look similar. Use the UP and DOWN arrow softkeys to select the desired value for the field. When finished, press TAB to move to the next field.
Figure 4-2 below shows a drop-down entry box, with the GrphColor (Graph Color) field selected and ready for choosing the desired color using the UP and DOWN arrow softkeys.
Figure 4-2: Typical Drop-Down Box
Programming the VGA Optica 4-3

January 2006
Units of Measure Table 4-1 below shows the units of measure available for each parameter:
User Equations In some applications an output may be needed that is not a simple function of a single parameter, but a combination of two or three. One or more user equations can be defined within the Optica to calculate new parameters that meet the application’s requirements. The equation can be formed from following elements:
• the identifiers for the measured or derived parameter units (listed in Table 4-2 on page 4-5).
• the math operators +, –, ×, /, (, ) and ^ (accessed through the math key in SHIFT mode)
• the math functions LOG and LN
• constants
• other user equations
The new parameter defined by this equation is given a name and can be displayed or output just like any other parameter.
User Equations are entered from Menu 2 (see page 4-15). A list of parameters and other elements is displayed. Each element is specified by an identifier such as “A1.” Use these identifiers to form the equation. In addition, another user equation can be used as an equation element by entering its identifier.
Table 4-1: Available Units of Measure
Parameter Available Units
HumidityTdew °C, Tdew °F, %RH, Twet °C, Twet °F, ppmv, ppmw, Grains/lb, Grains/SCF, g/kg, g/m3, lb/mft3, kj/kg(0), kj/kg(32), BTU/lb(0), BTU/lb(32), pw(mbar)
Temperature Tmp °C, Tmp °F, Tmp °K, Tmp °R
Pressure psia, mbar, bar, Pa, kPa, mmHg, inHg, kg/Cm2, Dyne/Cm2
4-4 Programming the VGA Optica

January 2006
User Equations (cont.)
The equation 2 × Tdew °F + (%RH / Twet°C) would be entered as 2 × A1 + (A2 / A3)
Table 4-2: User Equation Parameters
Identifier Units Identifier Units
Humidity Units: Temperature Units:
A0 Tdew °C A17 Tmp °C
A1 Tdew °F A18 Tmp °F
A2 %RH A19 Tmp °K
A3 Twet °C A20 Tmp °R
A4 Twet °F Pressure Units:
A5 ppmv A21 PSIA
A6 ppmw A22 mbar
A7 grains/lb A23 bar
A8 grains/scf A24 Pa
A9 g/kg A25 kPa
A10 g/m3 A26 mmHg
A11 lb/mft3 A27 inHg
A12 kj/kg(0) A28 kg/cm2
A13 kj/kg(32) A29 Dynes/cm2
A14 BTU/lb(0) A31 User Equation 1
A15 BTU/lb(32) A32 User Equation 2
A16 pw(mbar) A33 User Equation 3
Programming the VGA Optica 4-5

January 2006
Menu 1 The first menu is shown in Figure 4-3 below. This menu is accessed by selecting the Menu control button on the main screen and pressing ENTER.
Figure 4-3: Menu 1
Menu 1 allows programming of the following items:
Analog Outputs For more information on using the analog outputs, see Analog Outputs on page 2-9.
Table 4-3: Analog Output Options
Item Function Available Options
Output Choose which output channel is being programmed A and/or B
Parameter Choose which parameter will be output on the selected channel
Humidity, Temperature, Pressure or User Equation
Units Choose the units for this parameter (See Table 4-1 on page 4-4 for the parameter chosen)
Upper Limit Set the parameter value that will produce full-scale output (Enter a number)
Lower Limit Set the parameter value that will produce zero output (Enter a number)
4-6 Programming the VGA Optica

January 2006
Pressure Input For more information on using these items, see Process Pressure on page 3-4.
Table 4-4: Pressure Input Options
Item Function Available Options
Input Choose which pressure input channel is in use, or disable this input.
V in (0-5), I in (4-20), or Use Default
Units Choose the units for the pressure input. (See Table 4-1 on page 4-4 for parameter chosen.)
Upper Limit Set the pressure that corresponds to full-scale input. (Enter a number.)
Lower Limit Set the pressure that corresponds to zero volts or 4 mA input.
(Enter a number.)
Default Pressure value to be used if the measured input is disabled.
(Enter a number.)
Process Enter a process pressure when it is different from the pressure at the dew point sensor (see page 3-4).
Status Set whether the process pressure is active (enabled). Enable/Disable
Pressure Enter the process pressure, if this feature is enabled. (Enter a number.)
Programming the VGA Optica 4-7

January 2006
Alarms For more information on using the alarms, see Alarm Outputs on page 2-10.
The Upper and Lower limits set the alarm thresholds as described below for each alarm type (see details on page 2-10):
• SetPoint: alarm activates when parameter exceeds upper limit, and deactivates when parameter is less than lower limit.
• Inner Band: alarm activates when parameter is between upper and lower limits.
• Outer band: alarm activates when parameter is outside upper and lower limits.
• Control: alarm activates when Optica is actively controlling mirror temperature.
• Service: alarm activates when Service indicator is activated.
• PACER: alarm activates when PACER balance is active.
Table 4-5: Alarm Options
Item Function Available Options
Alarm Choose which alarm relay is being programmed. 1 and/or 2
Status Set whether or not the alarm is enabled. Enabled or Disabled
Parameter* Set the parameter that can activate this alarm. Humidity, Temperature, Pressure or User Equation
Units* Set the units for this parameter. (See Table 4-1 on page 4-4for parameter chosen.)
Type Set the type of condition that will activate the alarm SetPoint, Inner Band, Outer Band, Control, Service, PACER
Upper* The upper side of the alarm band Enter a number.
Lower* The lower side of the alarm band Enter a number.
*These fields ar ignored if the alarm is set to Control, Service, or PACER.
4-8 Programming the VGA Optica

January 2006
Automatic Cleaning and Balance Function
Note: For Optica Analyzers with earlier versions of software, see Appendix F.
Optica Analyzers with version XXX software have been upgraded to include the ability to program the PACER self-cleaning and rebalancing cycle to run once per day at a preset time. This is referred to as a Clock Time Interval. When the unit is programmed in this manner, the front panel PACER softkey is disabled. The Elapsed Time Interval initiates the PACER at a preset time after the last PACER was run. The automatic balance cycle will always run upon power up of the analyzers.
To program the Automatic Cleaning & Balance Function on the Optica VGA monitor:
1. Make sure the internal clock of the Optica has the correct time.
a. From the main screen enter Menu, then More, then Set Time and Date.
b. Highlight the Date and Time fields and use the Keypad and Softkeys to set the correct time.
2. Set the Time Programmed Balance Cycle.
a. Enter Menu and go to the Automatic Balance Section.
b. Open the Type pull down menu and choose one of the four selections (see Table 4-6 below).
Note: The PACER function will provide more thorough cleaning than the AUTO function because it first develops a thick dew/frost layer into which soluble contaminants dissolve. When heated, some of the contaminants are flash-evaporated and the remaining residue accumulates in clusters, resulting in an approximately 85% cleaner surface. The PACER cycle generally takes longer to complete.
Table 4-6: Automatic Cleaning and Balance Functions
Item Function Type
AUTO Heats the mirror and balances the optics. Elapsed Time Interval
PACER First cools the mirror to develop a thick dew/frost layer, then heats and balances the optics. Elapsed Time Interval
AUTO-D Heats the mirror and balances the optics. Clock Time Interval
PACER-D First cools the mirror to develop a thick dew/frost layer, then heats and balances the optics. Clock Time Interval
Programming the VGA Optica 4-9
January 2006
Automatic Cleaning and Balance Function (cont.)
3. Manually clean the mirror as required.
Note: Manual cleaning provides the most thorough cleaning.
4. After manual cleaning, initiate the Automatic Cleaning & Balancing.
5. To program a specific time of day at which to initiate the Automatic Cleaning and Balancing:
a. Highlight either Auto-D or Pacer-D.
b. In the Enter Time dialog box, input the time of day that you would like to initiate the balance cycle in a 24-hour format (for example, 13:30 would be 1:30 PM).
Note: In this mode the front panel Pacer initiation function is disabled. Powering down and restarting the unit will have no effect on the time programmed, however the PACER will run on startup as is the normal function.
6. To program an elapsed time to initialize the Automatic Cleaning and Balancing:
a. Highlight either Auto or Pacer.
b. In Interval dialog box, input the elapsed time in minutes (for example, 720 would enable the balance cycle to run every 12 hours).
Note: If the unit is powered down and restarted, or the Automatic Balance is initiated from the font or by using a LAN, the elapsed time will reset.
Note: Show Status should read “Enabled”.
7. Select either Track or Hold for the analog outputs (4-20mA/0-5VDC).
Note: If Track is selected, the actual temperature of the mirror will be transmitted. If Hold is selected, the last prevailing dew point, measured before the balance cycle was initiated, will be transmitted during the time that the balance cycle is running.
IMPORTANT: For environments or a gas sample where the mirror accumulates contamination rapidly, the use of an inline filter is recommended. Lower flow rates will also reduce the accumulation of contaminants.
4-10 Programming the VGA Optica

January 2006
Data Fields
Buzzer/Sound
Table 4-7: Data Field Options
Item Function Available Options
Field Graph line number and numeric display number to be programmed 1, 2, 3, 4, 5 or 6
Parameter For the field selected above, choose which parameter will be output.
Humidity, Temperature, Pressure or User Equation
Units Choose the units for this parameter See Table 4-1 on page 4-4 for the parameter chosen.
GrphMax Set the parameter value that will produce full-scale on the graph.
(enter a number)
GrphMin Set the parameter value that will produce zero on the graph.
(Enter a number.)
GrphColor Set the color for the selected graph line. Black, Red, Green, Orange, Blue, Violet, Yellow or Brown
Decimals The number of decimal places for the numeric dis-play
Enter a number (6 maximum).
Table 4-8: Buzzer/Sound Option
Item Function Available Options
Buzzer/Sound Sets the length (apparent loudness) of keyclick sounds.
Enter length of keyclick sound in msec (150 msec maximum).
Programming the VGA Optica 4-11

January 2006
Network Menu Networking settings including IP Address, Subnet Mask and Default Gateway. Generally, you will obtain these settings from your network administrator. This menu is accessed by selecting the Network control button on Menu 1 and pressing ENTER.
Figure 4-4: Network Menu
Table 4-9: Network Settings Options
Item Function Available Options
Host Name Enter the host name for the Optica unit of the LAN.
Domain Enter the Domain name for the local network.
IP Address Type*
Use the left and right arrow keys to select between DHCP and Static IP.
Get the IP from the Server,or Specify an IP Address.
IP Address* If you choose to specify an IP address, you must enter it here.
Enter four decimal integers between 0 and 255.
Subnet Mask* If you choose to specify an IP address, you must enter a Subnet Mask.
Enter four decimal integers between 0 and 255.
DefaultGateway*
If you choose to specify an IP address, you must enter a Default gateway.
Enter four decimal integers between 0 and 255.
OK button Save changes and return to the previous screen. Enter a number (6 maximum).
Help button Display help for the network screen.
*You may need to contact your local network administrator for this information.
4-12 Programming the VGA Optica

January 2006
Datalog Enter parameters for automatically logging data within the Optica. This menu is accessed by selecting the Data Log control button on Menu 1 and pressing ENTER.
Figure 4-5: Datalog Menu
The large window below the center of the screen shows a list of parameters chosen for logging.
Table 4-10: Datalog Options
Item Function Available Options
Status* Enable or disable datalog. Enabled/Disabled
Interval* Enter the logging interval in seconds. Enter a number.
Decimals Enter the number of decimal places for logged data. Enter a number (6 maximum).
Separator* Choose separator to be used between parameters. Space, Comma, Tab
Terminator* Choose the terminator(s) for each group of data. CR, CR-LF, LF
Parameters Set the parameter to be programmed (below). Humidity, Temperature,Pressure, or User Equation
Units Set the units for the selected parameter. See Table 4-1 on page 4-4.
REMOVE Control button to remove selected item from the list. Select button and press ENTER.
ADD Control button to add the selected unit to the list . Select button and press ENTER.
RESET Delete datalog files. Select button and press ENTER.
DOWNLOAD Control button to display the logged data on the Download screen (see below).
Select button and press ENTER.
*Indicated items apply to the entire datalog file.
Programming the VGA Optica 4-13

January 2006
Datalog (cont.) Use the UP and DOWN arrow keys to select items in the center window.
Logged data are stored in a file, named with the file’s creation time and date. If logging is in progress at midnight, a new file is automatically started at that time. To view or output the logged data, select the Download control button and press ENTER. The Optica will display the Download screen, described below.
Download Screen The Download Screen is accessed by pressing Download on the Datalog screen. It contains the following elements:
• a list of any saved files containing logged data (upper left)
• an area for displaying logged data (center)
• View button — displays the contents of the selected file name
• OK button — return to the previous screen
• Download button — send the selected file to the serial port
• HELP button — display help system
• Up arrow button — scroll the displayed data upwards
• Down arrow button — scroll the displayed data downwards
Figure 4-6: Download Screen
4-14 Programming the VGA Optica

January 2006
Menu 2 Menu 2 is shown in below. This menu is accessed by selecting More on Menu 1, and pressing ENTER.
Figure 4-7: Menu 2
Programming the VGA Optica 4-15

January 2006
General
Special
User Equation
Table 4-11: General Options
Item Function Available Options
Number of Data Fields
Set the number of parameters to be displayed. 1, 2, 3, 4, 5, 6
Lockout Set whether or not Heat, Cool, and PACER functions can be activated by the softkeys on the front panel. Disabled/Enabled
Dew Point Offset Enter offset value for Dew Point parameter in °C.
Enter value by which the Dew Point parameter will be offset.
Dew PointFilter Enter filter value for Dew Point parameter.
Enter number of readings to be averaged to create filtered Dew Point.
Temperature Offset
Enter offset value for Temperature parameter in °C.Enter the value by which the Temperature parameter will be offset.
Temperature Filter
Enter filter value for Temperature parameter.Enter number of readings to be averaged to create filtered Temperature.
PressureOffset Enter offset value for Pressure parameter in psia.
Enter value by which Pressure parameter will be offset.
PressureFilter
Enter filter value for Pressure parameter.Enter number of readings to be averaged to create filtered Pressure.
Table 4-12: Special Option
Item Function Available Options
Mol. Wt. Gas: The molecular weight of the gas being analyzed (Default value is molecular weight of dry air: 28.9645) Enter a number.
Table 4-13: User Equation Options
Item Function Available Options
Selection Select which equation to enter or edit. 1, 2, 3
Label: Enter the test label for the selected equation. Enter an alphanumeric name.
Equation Enter the user equation (see User Equations onpage 4-4).
Using the keypad, enter the alphanumeric codes for the equation elements, shown in Table 4-2 on page 4-5.
4-16 Programming the VGA Optica
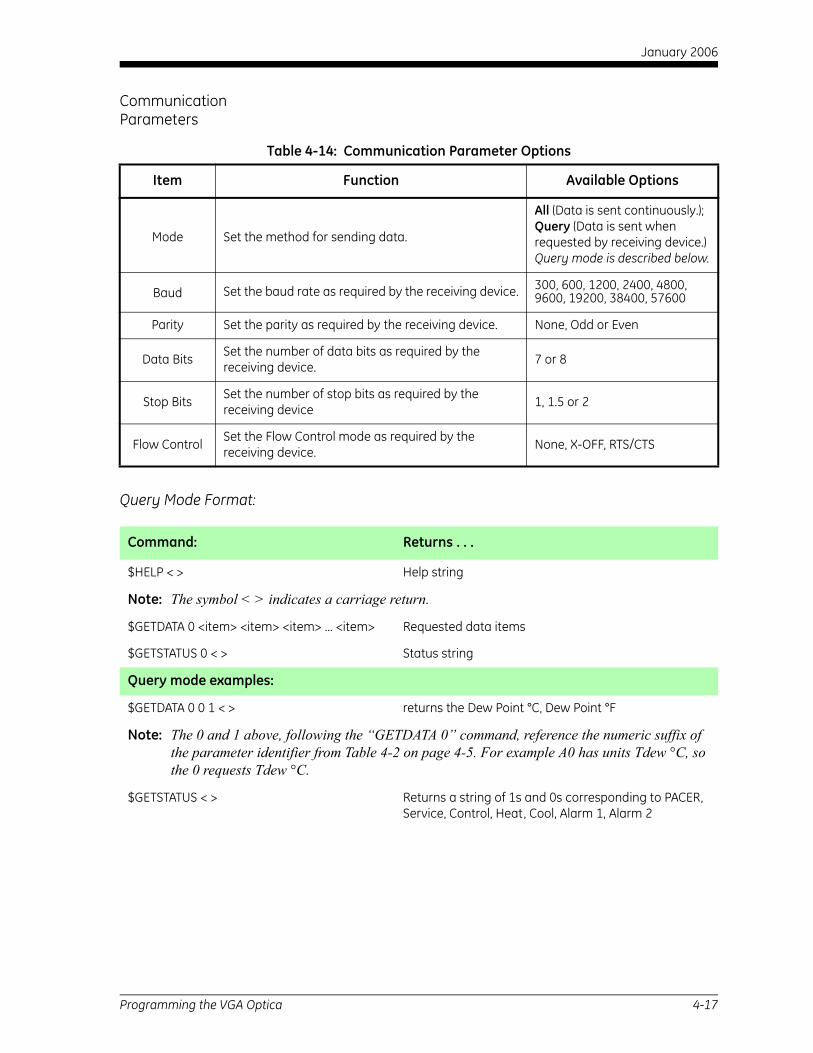
January 2006
Communication Parameters
Query Mode Format:
Table 4-14: Communication Parameter Options
Item Function Available Options
Mode Set the method for sending data.
All (Data is sent continuously.);Query (Data is sent when requested by receiving device.) Query mode is described below.
Baud Set the baud rate as required by the receiving device. 300, 600, 1200, 2400, 4800, 9600, 19200, 38400, 57600
Parity Set the parity as required by the receiving device. None, Odd or Even
Data Bits Set the number of data bits as required by the receiving device. 7 or 8
Stop Bits Set the number of stop bits as required by thereceiving device 1, 1.5 or 2
Flow Control Set the Flow Control mode as required by thereceiving device. None, X-OFF, RTS/CTS
Command: Returns . . .
$HELP < > Help string
Note: The symbol < > indicates a carriage return.
$GETDATA 0 <item> <item> <item> ... <item> Requested data items
$GETSTATUS 0 < > Status string
Query mode examples:
$GETDATA 0 0 1 < > returns the Dew Point °C, Dew Point °F
Note: The 0 and 1 above, following the “GETDATA 0” command, reference the numeric suffix of the parameter identifier from Table 4-2 on page 4-5. For example A0 has units Tdew °C, so the 0 requests Tdew °C.
$GETSTATUS < > Returns a string of 1s and 0s corresponding to PACER, Service, Control, Heat, Cool, Alarm 1, Alarm 2
Programming the VGA Optica 4-17

January 2006
Serial Output Data
Table 4-15: Serial Output Data Options
Item Function Available Options
SelectedOutputs
The units of currently selected parameters are shown, along with the number of decimals for each unit.
Units of selected output are displayed. Select one with the UP/DOWN keys to change it or delete it using REMOVE.
Time Stamp* Output date and time with each data string. Enabled/Disabled
Show Status*Output dew point sensor status with each data string (Heat, Cool, Balance, PACER, Service, Alarm 1,Alarm 2).
Enabled/Disabled
Parameter Select a parameter to configure. Humidity, Temperature, Pres-sure or User Equation
Units Set the units for the selected parameter. See Table 4-1 on page 4-4 for available units.
Format* Choose output format for the selected parameter. Dp=##.#, ###.#(Dp), No Label
Separator* Choose separator to be used between parameters. Space, Comma, TAB, CR, CR-LF
Terminator* Choose the terminator(s) for each group of data. Comma, CR, CR-LF
Interval (sec)* Enter the output interval in seconds. Enter a number.
Decimals Enter the number of decimal places for the selected parameter. Enter a number (6 maximum).
ADD buttonControl button to add the configured parameter to the output list, using the units and number ofdecimals designated.
Select button and press ENTER.
REMOVEbutton
Control button to remove from the output list the parameter selected at the top of the serial output menu.
Select button and press ENTER
4-18 Programming the VGA Optica
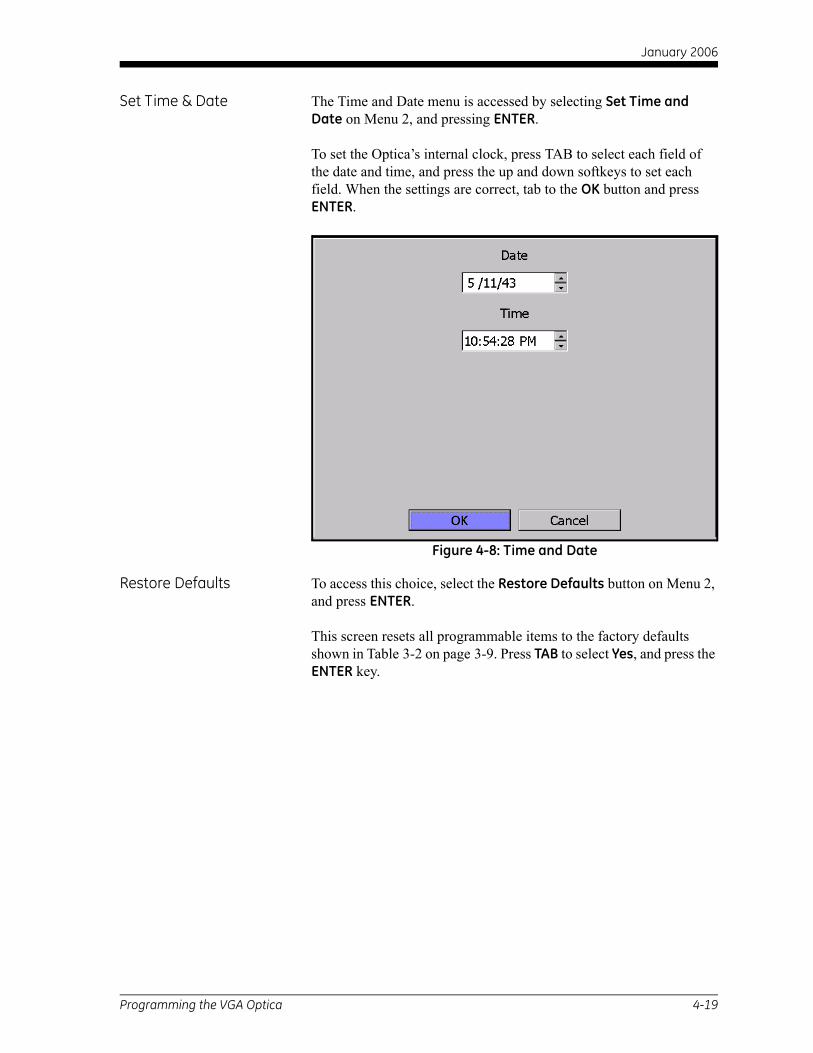
January 2006
Set Time & Date The Time and Date menu is accessed by selecting Set Time and Date on Menu 2, and pressing ENTER.
To set the Optica’s internal clock, press TAB to select each field of the date and time, and press the up and down softkeys to set each field. When the settings are correct, tab to the OK button and press ENTER.
Figure 4-8: Time and Date
Restore Defaults To access this choice, select the Restore Defaults button on Menu 2, and press ENTER.
This screen resets all programmable items to the factory defaults shown in Table 3-2 on page 3-9. Press TAB to select Yes, and press the ENTER key.
Programming the VGA Optica 4-19
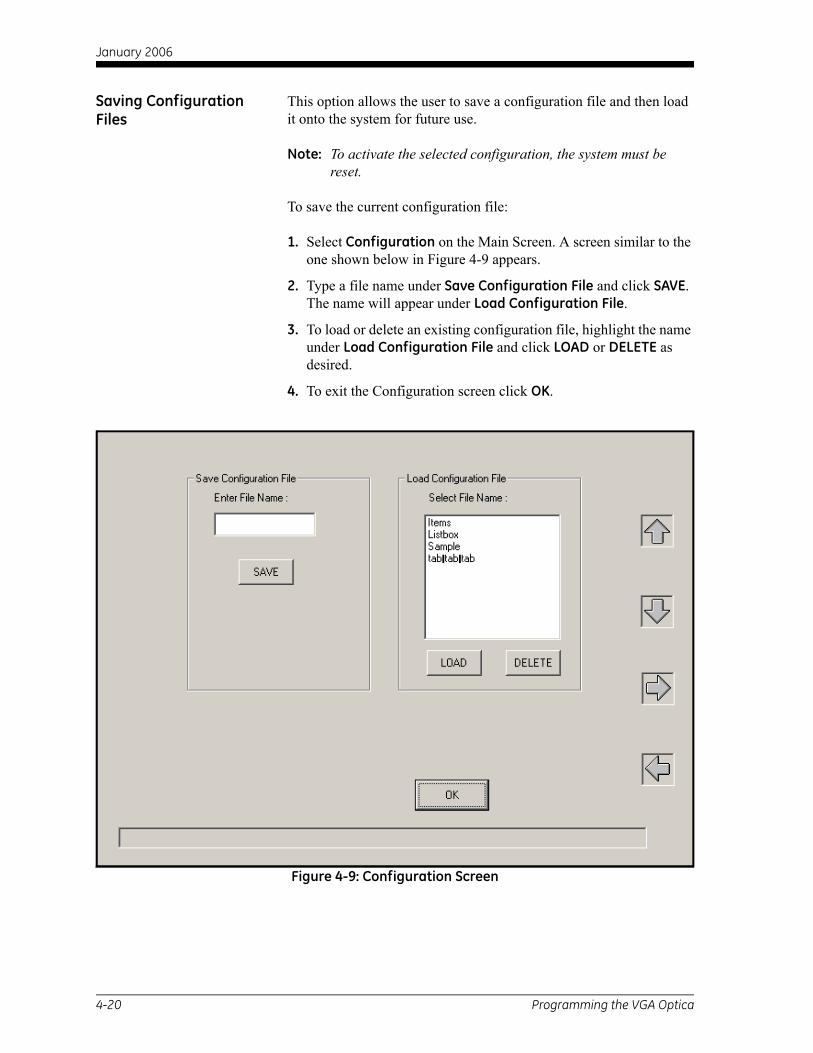
January 2006
Saving Configuration Files
This option allows the user to save a configuration file and then load it onto the system for future use.
Note: To activate the selected configuration, the system must be reset.
To save the current configuration file:
1. Select Configuration on the Main Screen. A screen similar to the one shown below in Figure 4-9 appears.
2. Type a file name under Save Configuration File and click SAVE. The name will appear under Load Configuration File.
3. To load or delete an existing configuration file, highlight the name under Load Configuration File and click LOAD or DELETE as desired.
4. To exit the Configuration screen click OK.
Figure 4-9: Configuration Screen
4-20 Programming the VGA Optica

Chapter 5
Programming the 4x40 Optica
Introduction. . . . . . . . . . . . . . . . . . . . . . . . . . . . . . . . . . . . . . . . . . . . . . . . . . . . 5-1
Programming Technique . . . . . . . . . . . . . . . . . . . . . . . . . . . . . . . . . . . . . . . . 5-2
Programmable Functions. . . . . . . . . . . . . . . . . . . . . . . . . . . . . . . . . . . . . . . . 5-4

January 2006
Introduction The 4x40 Optica can be easily programmed to choose the data to be displayed, the data to be output on the analog or serial outputs, and the alarm settings. A typical data display is shown in Figure 5-1 below:
Figure 5-1: 4x40 Optica Typical Data Display
Table 5-1 below lists the 4x40 Optica’s programmable functions. Each function has a number of settings (listed on the following pages). Values for some settings are selected from a list of choices; others are entered as numeric or alphanumeric data using the keypad.
Table 5-1: Programming Functions
Function Settings
About Displays software version
Analog Outputs Parameter choice, units and scaling
Communication Parameters Baud rate, parity, # data bits, etc.
Serial Output Units Parameter choice, units/data format
Serial Output Setup Serial data string format
Alarms Parameter choice and alarm limits
Data Fields Parameters & units for displayed data
Pressure Input Units, scaling and default values
Automatic Balance Frequency and type of balance
Buzzer and Sounds Keyclick loudness
General Settings Offsets, filters, lockout
User Equations Set user defined calculated values.
Set Time and Date Enter the current time and date.
Special Set molecular weight of sample gas.
User Default Settings Restore default settings.
Factory Calibration For factory use only.
ControlTmp ° C 25.355
%RH 10.3Tdew ° C 8.47996 Heat
PacerCool
Programming the 4x40 Optica 5-1

January 2006
Programming Technique The functions of the four softkeys to the right of the display change according to the current state of the unit. These functions, if any, are displayed at the right edge of the screen. While programming, these keys are labelled UP, DOWN, LEFT (displayed as <<<<) and RIGHT (displayed as >>>>).
Below is the general method for programming the unit:
1. To access the programming menus, press the ENTER/MENU key.
2. Press the DOWN key to step through the functions that can be programmed (shown in Table 5-1 on page 5-1).
3. For a particular function, press the RIGHT key to display the first setting for the function. Press the DOWN key to step through its available settings.
4. For a particular setting, press the RIGHT key to open the setting for editing.
If the setting uses a list of specific choices, the DOWN key and/or UP key are shown. Press them to step through the choices.
If the setting requires a numeric or alphanumeric entry, use the keypad to enter the data.
Note: To enter numeric data, just press the appropriate key.
To enter alphanumeric data, first press SHIFT to access the letters on the keypad, and then press the appropriate key containing the desired letter. Finally, press the up or down arrow softkeys to step through the letters available for that key, both upper and lower case.
Note that certain settings have numeric values that are restricted to certain choices. For example, the number of stop bits for serial output may be 1, 1.5, or 2, and may have no other values. This entry is selected from a list of choices, not entered as a numeric value.
5. After choosing a value for a setting, press ENTER to lock it in.
Or, you can press the LEFT key to cancel the entry (restoring the original value) and return to choose another setting.
To return to the function choice, press the LEFT key.
5-2 Programming the 4x40 Optica

January 2006
Programming Technique (cont.)
A typical programming screen (for setting the Analog Outputs) is shown in Figure 5-2 below.
Figure 5-2: Typical Analog Outputs Programming Screen
An example of programming the Serial Baud Rate is shown in below. Press the DOWN and RIGHT (>>>>) softkeys as shown to select the parameter to be programmed, choose the value using the UP and DOWN softkeys, and press ENTER.
Figure 5-3: Programming the 4x40 Optica
>> TemperatureOutput A Parameter
Analog Outputs UP
<<<<
DOWN
and/or return to previous position.Press "left" softkey (<<<<) to cancel
Down
Serial Output
Up
Units
Parity
DOWN UP
DOWN
Baud
UP
Analog Outputs
Down
ParametersCommunication
Down
Up
Up
>>>> Serial Mode
DOWN UP
ENTER
DOWN300
UP
1200
DOWN
DOWN
>>>>
600UP
UP
setBaud rate
Programming the 4x40 Optica 5-3
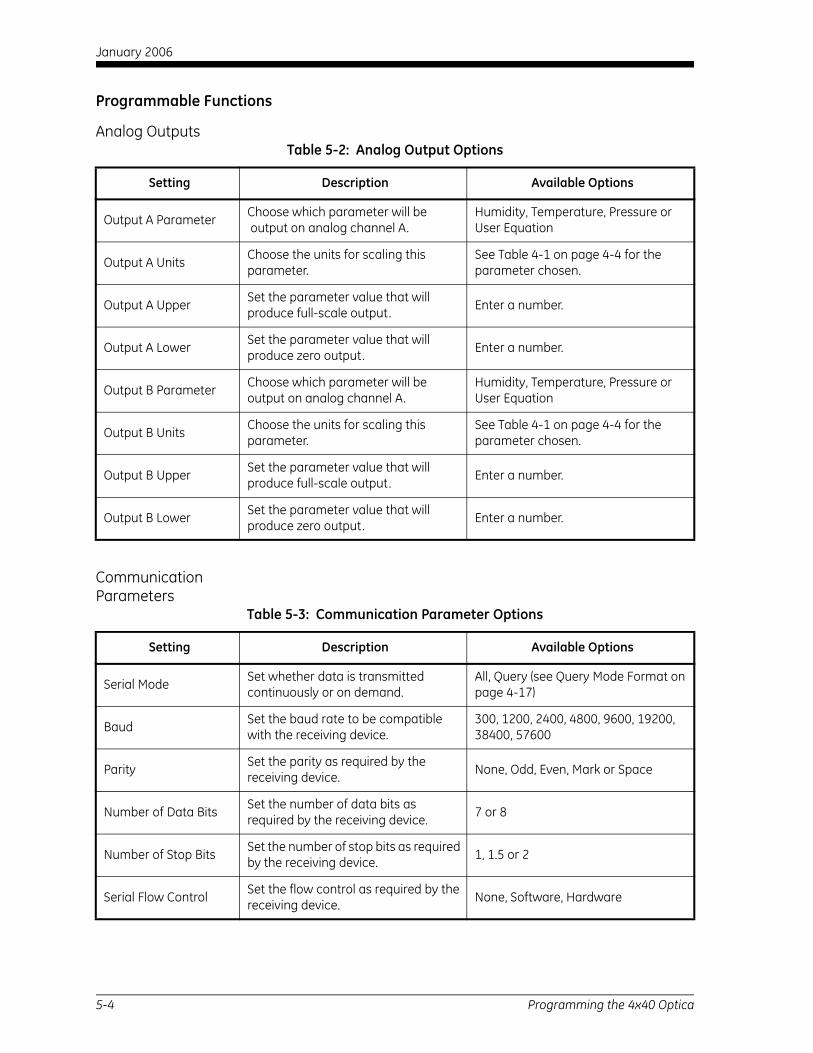
January 2006
Programmable Functions
Analog Outputs
Communication Parameters
Table 5-2: Analog Output Options
Setting Description Available Options
Output A Parameter Choose which parameter will be output on analog channel A.
Humidity, Temperature, Pressure or User Equation
Output A Units Choose the units for scaling this parameter.
See Table 4-1 on page 4-4 for the parameter chosen.
Output A Upper Set the parameter value that will produce full-scale output. Enter a number.
Output A Lower Set the parameter value that will produce zero output. Enter a number.
Output B Parameter Choose which parameter will be output on analog channel A.
Humidity, Temperature, Pressure or User Equation
Output B Units Choose the units for scaling this parameter.
See Table 4-1 on page 4-4 for the parameter chosen.
Output B Upper Set the parameter value that will produce full-scale output. Enter a number.
Output B Lower Set the parameter value that will produce zero output. Enter a number.
Table 5-3: Communication Parameter Options
Setting Description Available Options
Serial Mode Set whether data is transmitted continuously or on demand.
All, Query (see Query Mode Format on page 4-17)
Baud Set the baud rate to be compatible with the receiving device.
300, 1200, 2400, 4800, 9600, 19200, 38400, 57600
Parity Set the parity as required by the receiving device. None, Odd, Even, Mark or Space
Number of Data Bits Set the number of data bits as required by the receiving device. 7 or 8
Number of Stop Bits Set the number of stop bits as required by the receiving device. 1, 1.5 or 2
Serial Flow Control Set the flow control as required by the receiving device. None, Software, Hardware
5-4 Programming the 4x40 Optica
January 2006
Serial Output Units
Serial Output Setup
Table 5-4: Serial Output Unit Options
Setting Description Available Options
Humidity Units* Set the units for humidity. See Table 4-1 on page 4-4 for the parameter chosen.
Temperature Units* Set the units for temperature. See Table 4-1 on page 4-4 for the parameter chosen.
Pressure Units* Set the units for pressure. See Table 4-1 on page 4-4 for the parameter chosen.
User Units* Set the selected user equation. Choose from any available User Equation.
*Note: The TAB key selects or deselects the desired output units. If selected, the number of decimals can be set using a keypad entry (0-6).
Table 5-5: Serial Output Setup Options
Setting Description Available Options
Format Choose the output format for the selected parameter.
For humidity, e.g., Dp=##.#, ###.#(Dp), No Prompt
Field Separator Choose the separator to be used between parameters. Space, Comma, Tab, CR, CR-LF
Record Terminator Choose the terminator(s) for each group of data. Comma, CR, CR-LF
Interval in seconds Enter the output interval in seconds (for Serial Mode: All). Enter a number.
Show Status*Output dew point sensor status with each data string (Heat, Cool, Balance, PACER, Service, Alarm 1, Alarm2).
Enabled/Disabled
Time Stamp Output date and time with each data string. Enabled/Disabled
Programming the 4x40 Optica 5-5
January 2006
Alarms For more information on using the alarms, see Alarm Outputs onpage 2-10.
The Upper and Lower limits set the alarm thresholds. Alarm types are listed below (see details on page 2-10):
• SetPoint: Alarm activates when parameter exceeds upper limit; deactivates when parameter is less than lower limit.
• Inner Band: Alarm activates when parameter is between upper and lower limits.
• Outer band: Alarm activates when parameter is outside upper and lower limits.
• Control: Alarm activates when the Optica is actively controlling mirror temperature.
• Service: Alarm activates when the Service indicator is activated.
• PACER: Alarm activates when the PACER balance is active.
Table 5-6: Alarm Options
Setting Description Available Options
Alarm #1 Enable or disable Alarm 1. Enabled/Disabled
Alarm #1 Parameter Choose the parameter to control Alarm 1.
Humidity, Temperature, Pressure or User Equation
Alarm #1 Units Set the units for this parameter. See Table 4-1 on page 4-4 for the parameter chosen.
Alarm #1 Type Set the type of condition that will acti-vate Alarm 1.
Set Point, Inner Band, Outer Band, Control, Service, PACER
Alarm #1 Upper The upper side of the alarm band. Enter a number.
Alarm #1 Lower The lower side of the alarm band. Enter a number.
Alarm #2 Enable or disable Alarm 2. Enabled/Disabled
Alarm #2 Parameter Choose the parameter to control Alarm 2.
Humidity, Temperature, Pressure or User Equation
Alarm #2 Units Set the units for this parameter. See Table 4-1 on page 4-4 for the parameter chosen.
Alarm #2 Type Set the type of condition that will acti-vate Alarm 2.
Set Point, Inner Band, Outer Band, Control, Service, PACER
Alarm #2 Upper The upper side of the alarm band. Enter a number.
Alarm #2 Lower The lower side of the alarm band. Enter a number.
5-6 Programming the 4x40 Optica

January 2006
Data Fields
Pressure Input
Table 5-7: Data Field Options
Setting Description Available Options
Line 1 Parameter Choose which parameter will be output on Line 1.
Humidity, Temperature, Pressure or User
Line 1 Units Set the units for the selected parameter.
See Table 4-1 on page 4-4 for the parameter chosen.
Line 1 Decimals Enter the number of decimal places for displayed data. Enter a number (0-6).
Line 2 Parameter Choose which parameter will be output on Line 2.
Humidity, Temperature, Pressure or User
Line 2 Units Set the units for the selected parameter.
See Table 4-1 on page 4-4 for the parameter chosen.
Line 2 Decimals Enter the number of decimal places for displayed data. Enter a number (0-6).
Line 3 Parameter Choose which parameter will be output on Line 3.
Humidity, Temperature, Pressure or User
Line 3 Units Set the units for the selected parameter.
See Table 4-1 on page 4-4 for the parameter chosen.
Line 3 Decimals Enter the number of decimal places for displayed data. Enter a number (0-6).
Table 5-8: Pressure Input Options
Setting Description Available Options
Analog Input # Choose which pressure input channel is in use, or disable this input. 4-20 mA, 0-5 volt, User Default
Input Units Choose the units for pressure units. See Table 4-1 on page 4-4 for units.
Input Upper Set the pressure that corresponds to full-scale input. Enter a number.
Input Lower Set the pressure that corresponds to zero volts or 4 mA input. Enter a number.
Input Default Pressure value to be used if a measured input is disabled. Enter a number.
Process Pressure Default
Set whether the process pressure is active (enabled) (see page 3-4). Enabled/Disabled
Process Pressure Enter the process pressure (if this feature is enabled). Enabled/Disabled
Programming the 4x40 Optica 5-7

January 2006
Automatic Cleaning and Balance Function
Note: For Optica Analyzers with earlier versions of software, see Appendix F.
Optica Analyzers with version XXX software have been upgraded to include the ability to program the PACER self-cleaning and rebalancing cycle to run once per day at a preset time. This is referred to as a Clock Time Interval. When the unit is programmed in this manner, the front panel PACER softkey is disabled. The Elapsed Time Interval initiates the PACER at a preset time after the last PACER was run. The automatic balance cycle will always run upon power up of the analyzers.
To program the Automatic Cleaning & Balance Function on the Optica 4X40 monitor:
1. Make sure the internal clock of the Optica has the correct time. From the main screen:
a. Press the ENTER key.
b. Press the DOWN soft key until Set Time and Date is displayed.
c. Press the >>>> soft key.
d. Press the >>>> soft key.
e. Highlight the Date and Time fields using the tab key. Use the keypad and softkeys to set the correct time.
5-8 Programming the 4x40 Optica

January 2006
Automatic Cleaning and Balance Function (cont.)
2. Set the Time Programmed Balance Cycle:
a. Press the ENTER key to access the Main menu.
b. Press the DOWN soft key until Auto Balance is shown.
c. Press the >>>> soft key.
d. Press the >>>> to set the interval. Use the soft keys and the key pad.
e. Press the ENTER key when done.
f. Press the DOWN soft key to select the pacer type.
g. Press the >>>> to enter selection mode.
h. Press the DOWN soft key until the desired pacer type is displayed.
i. Press the ENTER key to select.
j. Press the DOWN soft key to enable the PACER status.
k. Press the >>>> soft key to enter selection mode.
l. Press the UP or DOWN soft key until the enabled status is displayed.
m. Press the ENTER key to save the selection.
n. Press the <<<< key several times to exit the menu.
o. Under the Type pull down menu there will be four selections (see Table 5-9 below).
Note: The PACER function will provide more thorough cleaning than the AUTO function because it first develops a thick dew/frost layer into which soluble contaminants dissolve. When heated, some of the contaminants are flash evaporated and the remaining residue accumulates in clusters, resulting in the cleaning of much of the mirror’s surface. The PACER cycle generally takes longer to complete.
Table 5-9: Automatic Cleaning and Balance Functions
Item Function Type
AUTO Heats the mirror and balances the optics. Elapsed Time Interval
PACER First cools the mirror to develop a thick dew/frost layer, then heats and balances the optics. Elapsed Time Interval
AUTO-D Heats the mirror and balances the optics. Clock Time Interval
PACER-D First cools the mirror to develop a thick dew/frost layer, then heats and balances the optics. Clock Time Interval
Programming the 4x40 Optica 5-9

January 2006
Automatic Cleaning and Balance Function (cont.)
3. Manually clean the mirror as required.
Note: Manual cleaning provides the most thorough cleaning.
4. After manual cleaning, initiate the Automatic Cleaning & Balancing cycle. (This can be done by powering the analyzer off then on again, if the front panel softkey is disabled).
5. To program a specific time of day at which to initiate the Automatic Cleaning and Balancing:
a. Highlight either Auto-D or Pacer-D.
b. In the Set Time section, input the time of day that you would like to initiate the balance cycle in a 24-hour format (for example, 13:30 will be 1:30 PM ).
Note: In this mode the front panel Pacer initiation function is disabled. Powering down and restarting the unit will have no effect on the time programmed, however the PACER will run on startup as is the normal function.
6. To program an elapsed time to initialize the Automatic Cleaning and Balancing:
a. Highlight either AUTO or Pacer.
b. In the set time section, input the elapsed time in minutes. (For example: 720 would enable the balance cycle to run every 12 hours).
Note: If the unit is powered down and restarted, or the Automatic Balance is initiated from the font or using a LAN, the elapsed time will reset.
Note: Show Status should read "Enabled".
7. Select either Track or Hold for the analog outputs (4-20mA/0-5VDC).
Note: If Track is selected, the actual temperature of the mirror will be transmitted. If Hold is selected, the last prevailing dew point, measured before the balance cycle was initiated, will be transmitted during the time that the balance cycle is running.
8. Power down and restart the Optica 4x40 display analyzer for the settings to take effect.
IMPORTANT: For environments or a gas sample where the mirror accumulates contamination rapidly, the use of an inline filter is recommended. Lower flow rates will also reduce the accumulation of contaminants
5-10 Programming the 4x40 Optica
January 2006
Buzzer and Sounds
General Settings
User Equations See User Equations on page 4-4 for programming information.
Table 5-10: Buzzer and Sounds Option
Setting Description Available Options
Buzzer Timing Sets the length (apparent loudness) of keyclick sounds.
Enter length of keyclick sound in msec (150 msec maximum).
Table 5-11: General Setting Options
Setting Description Available Options
Dew Point Offset Enter the offset value for the Dew Point parameter.
Enter the value by which the Dew Point parameter will be offset.
Dew Point Filter Enter the filter value for the Dew Point parameter.
Enter the number of readings to be averaged to create filtered Dew Point.
Temperature Offset Enter the offset value for the Temperature parameter.
Enter the value by which the Temperature parameter will be offset.
Temperature Filter Enter the filter value for the Temperature parameter.
Enter the number of readings to be averaged to create filtered Temp.
Pressure Offset Enter the offset value for the Pressure parameter.
Enter the value by which the Pressure parameter will be offset.
Pressure Filter Enter the filter value for the Pressure parameter.
Enter the number of readings to be averaged to create filtered Pressure.
Lockout Set whether or not the Heat, Cool, and PACER functions can be activated by the softkeys on the front panel.
OFF / ON
Table 5-12: User Equation Options
Setting Description Available Options
Select Equation Choose an equation to enter or edit . 1, 2, or 3
Edit Label #1* Enter or edit the label identifying equation 1. Alphanumeric
Edit Equation #1*Enter or edit equation 1 using the equation elements shown in Table 4-2 on page 4-5.
See Table 4-2 on page 4-5.
*The equation number shown is the one chosen in “Select Equation.”
Programming the 4x40 Optica 5-11

January 2006
Set Time and Date
Special
User Default Settings
Factory Calibrations
Table 5-13: Set Time and Date Options
Setting Description Available Options
Set Time Sets the time. Enter digits, one at a time, pressing TAB to move to the next digit.
Set Date Sets the date.
Table 5-14: Special Options
Setting Description Available Options
Gas Mole WeightThe molecular weight of the gas being analyzed. (The default value is the molecular weight of air: 28.9645)
Enter a number.
Table 5-15: User Default Setting Options
Setting Description Available Options
Restore Defaults Restore settings to factory defaults shown in Table 3-2 on page 3-9. NO, YES
Table 5-16: Factory Calibration Options
Setting Description Available Options
For factory use only.
5-12 Programming the 4x40 Optica

Chapter 6
Network-Based Programming
Introduction. . . . . . . . . . . . . . . . . . . . . . . . . . . . . . . . . . . . . . . . . . . . . . . . . . . . 6-1
Programming Screens. . . . . . . . . . . . . . . . . . . . . . . . . . . . . . . . . . . . . . . . . . . 6-1

January 2006
Introduction The VGA Optica can also be programmed remotely from a computer over a network, using a browser program such as Internet Explorer.
It may be necessary to download and install the Sun Java Runtime Environment (JRE) obtained from the GE Infrastructure Sensing distribution CD or Sun’s website. If the Sun JRE is not installed on a machine that connects to Optica via Ethernet, a web page will direct the user to Sun’s website.
To set up the Optica’s networking configuration, see Chapter 4 for programming using the Optica’s VGA programming method, and follow the instructions listed in Network Menu on page 4-12.
Programming Screens Detailed information on using the Optica Web interface is available via the Help buttons. Programming is very similar to programming of the VGA unit described in Chapter 4, Programming the VGA Optica. Of course, you use the mouse to click directly on fields and control buttons instead of selecting items with the TAB key described in Chapter 4.
A typical main data screen is shown below:
Figure 6-1: Typical Main Data Screen
Network-Based Programming 6-1

January 2006
Programming Screens (cont.)
Click on Menu to display the Data programming screen:
Figure 6-2: Data Programming Screen
Press More... to display the Other Options screen.
Figure 6-3: Typical Main Data Screen
6-2 Network-Based Programming
January 2006
Programming Screens (cont.)
Press Display from the main data screen to configure the Main Display screen.
Figure 6-4: Main Display Screen
Network-Based Programming 6-3

Chapter 7
Maintenance
Minor Maintenance of Sensor Optics. . . . . . . . . . . . . . . . . . . . . . . . . . . . . . 7-1
Field Replacement of Sensor Mirrors . . . . . . . . . . . . . . . . . . . . . . . . . . . . . . 7-4
Test and Calibration . . . . . . . . . . . . . . . . . . . . . . . . . . . . . . . . . . . . . . . . . . . . 7-6
Troubleshooting . . . . . . . . . . . . . . . . . . . . . . . . . . . . . . . . . . . . . . . . . . . . . . . . 7-6

January 2006
Minor Maintenance of Sensor Optics
Periodically inspect and maintain the sensor optics as described in the following paragraphs. These procedures can be performed at any time but are only necessary when the Service indicator appears on the status display, indicating that service is required.
Cleaning the Sensor Mirror Under normal conditions, the system is self-checking and self-balancing. However, there are occasions when particulate matter and water-soluble contaminants reduce sensor mirror reflectance and system accuracy (see Contamination on page 3-11). When necessary, use the procedure below to clean the sensor mirror.
1. Deactivate the sensor cooler, using one of the following actions:
• Turn the sensor power off, or
• Place the sensor switch to heat, or
• Disconnect the sensor cable
2. Turn off the sample gas. Make sure the sensor cavity is depressurized before continuing with the next step.
3. Open the sensor by removing the sensor cover.
4. Moisten a cotton swab with a cleaning solution suitable for mirrors, such as the cleaning solution in the GE Infrastructure Sensing maintenance kit, or dilute methanol or alcohol. Clean the mirror with a few light wipes. If the sensor has been exposed to significant contamination, clean the other optical surfaces in the sensor and the sensor cavity itself.
5. Replace the sensor cover.
6. Return the switches to normal, initiate a PACER cycle, and continue operation.
Maintenance 7-1
January 2006
Balancing the Sensor Optics
If the Service indicator reappears after a PACER cycle (even after performing the mirror cleaning procedure above) check the sensor balance adjustment. Improper adjustment of the optical balance is the most common cause of instrument malfunction. In addition, new systems may require an optical balance adjustment after one or two months of operation.
IMPORTANT: Always clean the mirror as described above before performing an optical balance.
Set the sensor mode to HEAT, wait one minute, then observe the balance indicator. If only the lowest bar is illuminated, or the lower 1/2 inch of the status bar, the sensor is properly balanced. If not, balance the sensor according the procedure below. The location of the balance adjustment screw for various sensors is shown in Figure 7-1 below.
Figure 7-1: Balance Adjustment Screw Locations
Sensor Balanceadjustment screw
Model D2
Model 1111H Model 1311H
7-2 Maintenance
January 2006
Balancing the Sensor Optics (cont.)
1. Clean the mirror as described in Cleaning the Sensor Mirror on page 7-1, if you have not already done so. Make sure the sensor cover is replaced before checking the balance.
2. Set the sensor mode to HEAT and wait one minute for any condensation to evaporate.
3. The balance indicator should be about 1/2” high (or 1 bar). Turn the balance screw on the sensor counterclockwise to increase the bar height, or clockwise to decrease it.
Note: Be sure the mirror cavity is covered while adjusting the balance screw, since ambient light can cause an error. The 1111H sensor should be installed in the optional pressure boss or have the cover installed. The D-2 cover should be latched. On the 1311DR and XR sensors, place your thumb over the hole (or use a coin, if the sensor is horizontal).
4. Replace the sensor cover, if necessary, and verify that the balance indicator is still correct. If not, repeat Step 2, being sure that no light enters the cavity. Return the sensor mode to OPERATE (if applicable) to stop heating the mirror.
5. Initiate a PACER cycle by pressing the PACER button on the Optica panel.
At the completion of the PACER cycle, the system is properly balanced. For more information on the PACER cycle, see The PACER Cycle on page 1-6.
Finally, initiate a PACER cycle as described above. At the end of this cycle, the service indicator should not appear and the dew point reading should be correct.
Maintenance 7-3

January 2006
Field Replacement of Sensor Mirrors
One advantage of using a GE Infrastructure Sensing chilled mirror dew point sensor is that the mirror is user-replaceable. The sensor does not have to be returned to the factory for replacement of the reflective surface, unless that is desired.
A mirror may require replacement for any of the following reasons:
The mirror is constructed of silver/rhodium plated copper. Copper provides excellent thermal conductivity to the platinum thermometer. However, some gas constituents, such as sulfur dioxide (SO2) may react with the copper and eventually pit the surface or form a copper sulfate coating.
The reflective surface may be gradually abraded by sharp dirt particles in the gas being measured.
The mirror surface may be accidentally scratched or gouged during use or cleaning.
If the sensor mirror has reacted with a corrosive material in the gas sample, such as an acid or sulfur compound, it should be replaced with a solid platinum mirror to remove any possibility of copper corrosion.
In extreme cases, a solid platinum mirror can make possible a successful application of chilled mirror technology. For example, measurements in tobacco factories and malting houses have drastically improved after this change, since both locations have sample gas constituents that attack copper.
In addition, fine scratches can be buffed out of a solid platinum surface, restoring the mirror to new condition, since it is of solid construction.
7-4 Maintenance

January 2006
Replacing the Sensor Mirror
Required equipment: torque driver, set to 20-30 inch-ounces of torque. GE Infrastructure Sensing type TW-1 is recommended.
The kit supplied by the factory contains the replacement mirror, a container of white thermal compound for proper heat transfer, and (in some models) a mylar washer that is to be placed under the mirror.
1. Deactivate the sensor cooler, using one of the following actions:
• Turn the sensor power off, or
• Place the sensor switch to heat, or
• Disconnect the sensor cable
2. Turn off the sample gas. Make sure the sensor cavity is depressurized before continuing with the next step.
3. Open the sensor by removing the sensor cover.
4. Unscrew and discard the old mirror, using a 3/16-inch (0.187) hex socket.
5. Use a toothpick or similar tool to place a small amount of thermal compound in the hole supporting the mirror.
Caution!Do not apply thermal compound to the mirror stem.
Do not use an amount large enough to leak out when the mirror is tightened.
Do not allow any compound to get on the mirror surface, as it is very difficult to remove completely.
6. Carefully screw in the new mirror and tighten to the proper torque as specified for the particular sensor.
7. Carefully clean the mirror surface, using a cotton swab and the GE Infrastructure Sensing cleaning solution supplied with the maintenance kit. Distilled alcohol or diluted alcohol is also acceptable.
8. Replace the cover and return the sensor to normal operation. Under some circumstances, a new mirror may operate in a somewhat unstable manner for the first hour or two.
Maintenance 7-5

January 2006
Test and Calibration The procedures in this section effectively test and/or calibrate the following aspects of the Optica:
• Startup and power supply voltage
• Normal sensor operation
• Front panel display
• Digital and analog outputs.
The unit has been completely tested and calibrated at the factory, and is ready to plug in and operate. As shipped, it meets all of our published specifications.
When ordered as a complete hygrometer system with a chilled mirror sensor and cable, it is verified at a number of points against a dew point system that has been certified by the U.S. National Institute of Standards and Technology (NIST). A Certificate of Compliance is supplied with the unit to indicate traceability.
Troubleshooting
The Display Doesn’t Light Up
1. Check the POWER switch on the rear panel. Make sure it’s ON.
2. Check the line cord. Make sure both ends are plugged in and that it is plugged into a proper source of AC voltage.
3. Check the power supply. Make sure it is connected and has the proper output voltage.
4. Check the fuse. Make sure the proper fuse size is installed. Make sure the fuse is not open.
“Service” Appears on the STATUS Display Line
The text “Service” displayed on the STATUS line means service is required. The most frequent problem requiring service is that the mirror surface is contaminated and should be cleaned.
Clean the sensor mirror (refer to Cleaning the Sensor Mirror on page 7-1). Next, run the instrument through a PACER cycle. If, at the end of the cycle, the Service status appears again, balance the sensor optics (see Balancing the Sensor Optics on page 7-2).
7-6 Maintenance

January 2006
Incorrect Dew Point Display
If the dew/frost point reads incorrectly, first check the standard preventive maintenance items:
1. Clean the mirror (see Cleaning the Sensor Mirror on page 7-1).
2. Balance the sensor optics (see Balancing the Sensor Optics on page 7-2).
An alternative method for checking the accuracy of the unit’s electronics is to use a precision resistance decade box in place of the platinum thermometer. Wire the decade box to the unit’s sensor connector as shown in Figure 25, and verify that the resistance settings shown in the table produce the temperatures shown.
Figure 7-2: Using a Resistance Decade Box
0.0
–10.0
–60.0
°C (±0.1)
Display Reading
60.0
10.0
Din Type 100 Ohms at 0°C 0.385 Ohms/°CResistance TableRX10
123.24RX0.01
RX0.1
RX1
76.33
100.00
103.90
96.09
Resistance
Ohms
3
ResistanceDecade Box
RX100
LOWHIGH
14415
140.0
–76.0
32.0
50.0
14.0
°F (±0.2)
Optica
ConnectorCable
Sensor
Optica
ConnectorCableT
L
JK Sensor
D2
1123HK
Maintenance 7-7

January 2006
“Balance” Remains on the Status Line
When the word Balance remains displayed on the front panel for more than 15 minutes, the instrument has not recovered from a PACER cycle.
Check that the sensor and sensor cable are connected. If necessary, connect them, and the unit will complete the PACER cycle after a short time (5 to 15 minutes).
The sensor optical bridge may be out of balance (see Balancing the Sensor Optics on page 7-2).
No Analog Output If there is no analog output, but the digital display indicates correctly, check the analog output scaling. For the VGA unit, see Analog Outputs on page 4-6. For the 4x40 unit, see Function 1 — Analog Outputs on page 5-4.
No Serial Output Check the serial port programming for proper settings. For the VGA unit, see instructions on page 4-18. For the 4x40 unit, see instructions on page 5-5.
7-8 Maintenance

Appendix A

Specifications
Performance . . . . . . . . . . . . . . . . . . . . . . . . . . . . . . . . . . . . . . . . . . . . . . . . . . . A-1
Functionality . . . . . . . . . . . . . . . . . . . . . . . . . . . . . . . . . . . . . . . . . . . . . . . . . . . A-2
Physical (bench mount) . . . . . . . . . . . . . . . . . . . . . . . . . . . . . . . . . . . . . . . . . . A-2
Physical (wall mount). . . . . . . . . . . . . . . . . . . . . . . . . . . . . . . . . . . . . . . . . . . . A-2
Optional Accessories . . . . . . . . . . . . . . . . . . . . . . . . . . . . . . . . . . . . . . . . . . . . A-3

January 2006
Performance
Accuracy [complete system at 25°C (77°F)]
Dew/Frost Point: ± 0.2°C (± 0.36°F)
Temperature (optional): ± 0.15°C (± .27°F)
Pressure (optional): ± 0.5% of full scale
Relative Humidity (optional): Governed by accuracy of dew point and temperature sensors
Other Humidity Parameters:(optional)
Governed by accuracy of dew point, temperature and pressure sensors
Sensitivity > 0.05°C (0.09°F)
Repeatability ± 0.05°C (±0.09°F)
Hysteresis None
Measurement Ranges
Chilled Mirror Sensors:(available)
1111H, D-2, SIM-12H, 1311DR, 1311XR
Range: –80°C to +85°C (–112°F to +185°F)dew/frost point, depending on sensor used
Temperature Sensor:(optional)
T-100E: –100°C to +100°C (–148°F to +212°F)
Pressure Sensors (optional): PT-30A: 0 – 30 psia (0 to 2 bar)PT-300A: 0 to 300 psia (0 to 21 bar)User supplied 4-20mA or 0-5 volt signal
RecommendedSample Flow
0.5 to 5.0 scfh (0.25 to 2.5 L/min)
Response Time
Dew/Frost Point CoolingRate:
1.5°C (2.7° F)/sec [typical, above 0°C (32°F)]
Temperature Response:(optional)
< 7 sec for step change within +25°C to +70°C (+77°F to +158°F)
Pressure Response (optional): 1 sec to 90% of steady state (10% to 90% change)
Update Time 1 sec
Specifications A-1

January 2006
Functionality
Outputs 4–20mA DC, 500 Ohm maximum load, 0–5 VDC, 5mA maximum
Digital Output Serial port
Alarms
Relay (optional): Form C (SPDT) 5A, 250 VAC (resistive load)
Displays 640 X 480 pixel color LCD or 4-line X 40-char LCD
Power 100, 115 or 230 VAC (+/-10%), 50-60 Hz
Operating ranges
Dew Point Sensors
Ambient Temperature: –15°C to +80°C (+5°F to + 176°F), depending on sensor
Pressure: 0 to 300 psig (0 to 22 bar), depending on sensor)
Electronics
Ambient Temperature: 0°C to +50°C (+32°F to +122°F)
Relative Humidity: 85% maximum
Physical (bench mount)
Dimensions 13.5"W x 6.5"H x 13"D (353 x 165 x 330 mm)
Weight 10 lbs (5 kg)
Shipping Weight 15 lbs (7 kg)
Environmental General purpose bench-, panel-, or rack-mount
Physical (wall mount)
Dimensions 13.5"W x 16.5"H x 6.5"D (343 x 419 x 165 mm)
Weight 10 lbs (5 kg)
Shipping Weight 15 lbs (7 kg)
Environmental Surface-mount, industrial environment (NEMA-4)
A-2 Specifications

January 2006
Optional Accessories
19" rack mount adapter
T-100E Temperature sensor
PT-30A Pressure transducer (0 – 30 psia)
PT-300A Pressure transducer (0 – 300 psia)
Specifications subject to change without notice.
Specifications A-3

Appendix B

Humidity Equations and Conversion Chart
Introduction. . . . . . . . . . . . . . . . . . . . . . . . . . . . . . . . . . . . . . . . . . . . . . . . . . . . B-1
Vapor Pressure . . . . . . . . . . . . . . . . . . . . . . . . . . . . . . . . . . . . . . . . . . . . . . . . . B-1
Humidity. . . . . . . . . . . . . . . . . . . . . . . . . . . . . . . . . . . . . . . . . . . . . . . . . . . . . . . B-2

January 2006
Introduction The following symbols appear in the equations below:
e = Vapor Pressure, millibars
ei = Vapor Pressure with respect to ice, millibars
ew = Vapor Pressure with respect to water, millibars
eis = Saturation vapor pressure, ice, millibars
ews = Saturation vapor pressure, water, millibars
P = Total Pressure, millibars
T = Temperature, °C
Ta = Ambient temperature, °C
Td = Dew point temperature, °C
Tf = Frost point temperature, °C
Vapor Pressure Saturation vapor pressure with respect to water is a function of temperature only and is given by the following:
(B-1)
Saturation vapor pressure with respect to ice requires a minor adjustment of the constants as given by the following:
(B-2)
In addition to yielding saturation vapor pressure as a function of ambient temperature, the above equations also yield ambient vapor pressure as a function of dew/frost point.
The total pressure of a gas mixture is equal to the sum of the partial pressure each gas would exert, were it to occupy the same total volume, according to Dalton’s law.
EWS 6.1121EXP 17.502T240.97 T+------------------------=
EIS 6.1115EXP 22.452T272.55 T+------------------------=
Humidity Equations and Conversion Chart B-1

January 2006
Humidity Relative Humidity is defined as the ratio of the water vapor pressure (e) to the saturation vapor pressure (eS) at the prevailing ambient or dry bulb temperature (Ta):
(B-3)
Absolute humidity is expressed as water vapor density: water vapor mass per unit volume of dry air, according to the following:
(B-4)
Water vapor content expressed as parts per million by volume is given by the following:
(B-5)
Expressing water vapor content as parts per million by weight (or mixing ratio) requires multiplication of the above by the ratio of the molecular weight of water to that of air as given by the following:
(B-6)
See Figure B-1 on page B-3 for a graphical humidity conversion chart.
%RH 100 EES-----⎝ ⎠⎛ ⎞ 100
EW TD( )
EWS TA( )--------------------= =
G
M3-------
216.7E TD( )
T 273.16+--------------------------=
PPMV 106 E TD( )
P E TD( )–----------------------=
PPMW 0.622 106× EP E–-----------=
B-2 Humidity Equations and Conversion Chart

January 2006
Figure B-1: Graphical Humidity Conversion Chart
Humidity Equations and Conversion Chart B-3

Appendix C

Configuring the Serial Interface
Wiring to a Personal Computer. . . . . . . . . . . . . . . . . . . . . . . . . . . C-1

January 2006
Wiring to a Personal Computer
The Optica is configured as Data Terminal Equipment (DTE). The following pins are used on the Serial interface:
• 2 - Transmitted data (TXD)
• 3 - Received data (RXD)
• 5 - Signal ground (GND)
To send the output of the Optica to a personal computer, use the cable arrangement shown in Figure C-1 below.
Figure C-1: Wiring Diagram - Optica to Personal Computer
Optica
9-Pin Male
PC
3 29-Pin
2 3
5
5
Configuring the Serial Interface C-1

Appendix D

Chilled Mirror Sensors
Introduction. . . . . . . . . . . . . . . . . . . . . . . . . . . . . . . . . . . . . . . . . . . . . . . . . . . .D-1
Depression. . . . . . . . . . . . . . . . . . . . . . . . . . . . . . . . . . . . . . . . . . . . . . . . . . . . .D-1
Measurement Range . . . . . . . . . . . . . . . . . . . . . . . . . . . . . . . . . . . . . . . . . . . .D-2
Comparing Optica Models . . . . . . . . . . . . . . . . . . . . . . . . . . . . . . . . . . . . . . .D-3

January 2006
Introduction GE Infrastructure Sensing offers a choice of five, fully interchangeable, chilled mirror sensors which differ primarily in their depression (cooling) capability. Depression capacity determines the minimum dew point that can be measured. All of the sensors feature low-noise, infrared optics, a field-replaceable mirror, and can be located up to 300 ft (91 m) from the electronics. Other advanced features—depending on the sensor selected—include heating capability, four- or five-stage thermoelectric cooling, air and water cooling for additional depression, and modular, field-replaceable optics and cooling assemblies
Many of these features were pioneered by GE Infrastructure Sensing, and are available only on GE Infrastructure Sensing products.
A chilled mirror sensor is generally selected so that its depression capability will allow it to measure the lowest dew/frost point anticipated for the application.
Depression A Peltier device is a solid-state heat pump. It has one surface thermally bonded to the body (base) of a dew point sensor and the other surface bonded to the mirror block. When current is supplied to the Peltier device, heat is “pumped” from the mirror block to the sensor body where it is dissipated. With full cooling current, the mirror block will eventually cool to its minimum temperature. The difference between the temperatures of the mirror block and the sensor body when the mirror block is at this minimum temperature is defined as the depression capability of the sensor.
Depression capability is a function of how many “stages” the Peltier device has stacked in series. Thus, a two-stage sensor typically has 60°C to 65°C (108°F to 117°F) of depression capability, and can measure lower dew/frost points than a one-stage sensor which has 45°C (81°F) of depression capability. Depression is normally specified at 25°C (77°F) ambient temperature. For liquid-cooled sensors, it is specified at the coolant temperature. As ambient temperature (and, therefore, sensor body temperature) is decreased, depression capability also decreases, due to the drop-off in efficiency of the thermoelectric cooler.
Therefore, there are limitations to using liquid-cooled sensors to increase low-end measurement range. At nominal dew/frost points, approximately one third of the additional cooling is lost due to cooler inefficiency, and does not result in additional measurement range. At low dew/frost points, as much as one half may be lost. As ambient temperature is increased, depression capability increases, resulting in a wider measurement range.
Chilled Mirror Sensors D-1

January 2006
Measurement Range The measurement range of a chilled mirror sensor is defined as the temperature range over which a stable dew or frost layer can be maintained on the mirror. Note that in order to acquire a dew or frost layer on the mirror, the depression capability of a sensor must extend below its measurement range. The minimum required differential between depression range and measurement range is 5°C (9°F) at nominal dew/frost points, and increases to 10°C to 12°C (18°F to 22°F) at very low frost points.
Measurement range is normally specified at 25°C (77°F) ambient temperature in air at atmospheric pressure. For sensor body temperatures other than 25°C (77°F), measurement range can be estimated by first estimating depression capability, and then decreasing this range according to the minimum required differential. For most gases other than air, the effect on measurement range is negligible. However, gases such as hydrogen or helium, which are more thermally conductive than air, will result in a decrease of several degrees in the measurement range. Measurement range will decrease as gas pressure is increased, because the increased density (and, therefore, increased thermal conductivity) of the gas results in an increased heat load. For air or nitrogen, each 50 psi (3 bar) increase above atmospheric pressure will result in a loss of approximately 2°C (4°F) of depression capability. Conversely, operating under vacuum may result in a small increase.
Other factors influencing sensor selection include temperature and pressure ratings, and whether anticipated dew points will be higher than ambient temperature.
D-2 Chilled Mirror Sensors

January 2006
Comparing Optica Models
Table D-1: Chilled Mirror Sensor Comparison Chart
Model111H
ModelD-2
ModelSIM-12H
Model1311DR
Model1311XR
System Performance
Standard Accuracy* 0.2°C 0.2°C 0.2°C 0.2°C 0.15°C
Optical Accuracy* 0.15°C 0.15°C 0.15°C 0.15°C
Cooling Stages 1 2 2 4 5
Depression (at 25°C (77°F), 1 atm, in air) 45°C 65°C 65°C
95°C, air;105°C with
15°C coulant
112°C with15°C coulant
Typical Measurement Range (at given ambient, 1 atm)
at 25°Cambient
at 25°Cambient
at 85°Cambient
at 25°Cambient
at 25°Cambient
Dew/Frost Point –15° to +25°C –35° to +25°C –10° to +85°C –60° to +25°C, air–70°C to +25°C, liquid
–80° to +25°C
RH (equivalent) 6% to 100% 1.5% to 100% 1% to 100% 0.03% to 100%, air0.007% to 100%, liq.
0.0003% to 100%
Functional Characteristics:
Power From Optica From Optica 115/230VAC75 watts
115/230VAC300 watts
115/230VAC700 watts
Ambient Temperature Range
–15° to +80°C –25° to +85°C –15° to +50°C 0° to +35°C 0° to +35°C
Pressure Range (psig) –3 to +200 –14.7 to +150 –3 to +50 0 to +300 0 to +100
Auxiliary Cooling No No No Standard: air or liquid Standard: liquid
Sensor CavityMaterial
Epoxy-coated Aluminum
Stainless Steel Anodized Aluminum
Stainless Steel Stainless Steel
*Complete system at 25°C (77°F)
Chilled Mirror Sensors D-3

Appendix E

Glossary
January 2006
Depression Capability The temperature difference by which the chilled mirror can be lowered from the ambient temperature.
Network A Local Area computer Network (LAN) or Wide Area Network (WAN) such as the Internet. The Optica can be operated or programmed remotely over a network.
PACER GE Infrastructure Sensing patented Programmable Automatic Contaminant Error Reduction system, which consolidates soluble contaminants to reduce their effect on system accuracy (see The PACER Cycle on page 1-6).
Parameter A measured quantity available for display by the unit, such as Dew Point in °C, Humidity in Grams/Kilograms, or Pressure in Bar.
Process Pressure The gas pressure of the system under test. In some applications, humidity of this gas may be measured at a lower pressure.
Scaling The process of selecting the maximum and minimum output values of a chosen parameter.
SHIFT Pressing the SHIFT key enters Shift Key mode, reversing the direction of the cursor motion when pressing TAB, and accessing the non-numeric characters on the keypad.
Softkeys The four keys to the right of the display. The functions of these keys change depending on the context, and the current function is displayed to the left of each key.
VGA Video Graphics Array Generic description of a 640 by 480 pixel display; used to identify the large-screen Optica.
4x40 Four lines by 40 characters per line; used to identify the small-screen Optica.
Glossary E-1

Appendix F
Automatic Balance (for earlier software versions)
Programming Automatic Balance for a VGA Optica. . . . . . . . . . .F-1
Programming Automatic Balance for a 4x40 Optica. . . . . . . . . . .F-1

January 2006
Programming Automatic Balance for a VGA Optica
Note: For Optica Analyzers with software version XXX or later, see Automatic Cleaning and Balance Function on page 4-9.
Programming Automatic Balance for a 4x40 Optica
Note: For Optica Analyzers with software version XXX or later, see Automatic Cleaning and Balance Function on page 5-8.
Table F-1: Automatic Balance Options
Item Function Available Options
Interval Set how often the automatic balance takes place. Enter the interval in minutes (60 minutes minimum).
Type Set the type of balance (see Sensor Balancing on page 3-10). Auto, PACER
Status Set whether the balance will take place. Enabled, Disabled
Track/Hold
Set whether the display, analog outputs, and alarms will track the sensor condition during a cleaning cycle, or hold the last process reading.(Serial outputs always hold the process reading).
Track, Hold
Table F-2: Automatic Balance Options
Setting Description Available Options
Interval in Minutes Set how often the balance takes place. Enter the interval in minutes (60 minutes minimum).
Type Set the type of balance (see Sensor Balancing on page 3-10). Auto, PACER
Enable Set whether the balance will take place. Enabled, Disabled
Analog OutputTracking
Set whether display, analog outputs and alarms will track the sensor condition during a cleaning cycle, or hold the last process reading. (Serial output will always track the process reading.)
Track, Hold
Automatic Balance (for earlier software versions) F-1

Appendix G
Communicating with the OPTICA Using Ethernet
Direct Communication . . . . . . . . . . . . . . . . . . . . . . . . . . . . . . . . . . G-1
Computer Communication . . . . . . . . . . . . . . . . . . . . . . . . . . . . . . G-1

January 2006
Direct Communication The networking configuration for an OPTICA VGA model can be done using the front panel. The networking configuration for a 4x40 with Ethernet capability can be configured using the RS-232 port and the following commands:
Note: <> means carriage return.
$SetIPAddress <IPADDRESS><> (i.e 127 0 0 0)\r\n
Example: $SetIpAddress 127 0 0 0 0 <>
$SetSubnetMask <SubNetMask> (i.e 255 255 255 0)\r\n
Example: $SetSubnetMask 255 255 255 0 <>
$SetDefaultGateway <Gateway> (i.e 0 0 0 0)\r\n
$SetHostName <HostName><> (i.e Optica)\r\n
$SetIPSource <STATIC><> (STATIC IP)\r\n
$SetIPSource <DHCP><> (DHCP IP)\r\n
$GetNetworkSettings<> Displays the network settings\r\n
$SaveNetworkSettings<> (Write Network settings to the registry)\r\n
$DeleteNetworkSettings<> (Deletes registry entries - removes .FDF & .CRC File)\r\n
$SaveAllSettings<> (Write all settings to non-volatile memory)\r\n
Computer Communication
The Optica communicates over port 28005. The general format for accessing the Optica is:
<IP address>:28005/Command
The command set of the Optica is broken into two categories: Those used to set parameters and those used to retrieve parameters from the Optica. Commands that are used to retrieve information from the Optica are preceded with the prefix Get, and those that are used to set parameters at the Optica are preceded with the prefix Set. Only the commands that enable the user to retrieve information from the Optica are detailed in this document. The examples below assume that a web browser is being used.
Communicating with the OPTICA Using Ethernet G-1
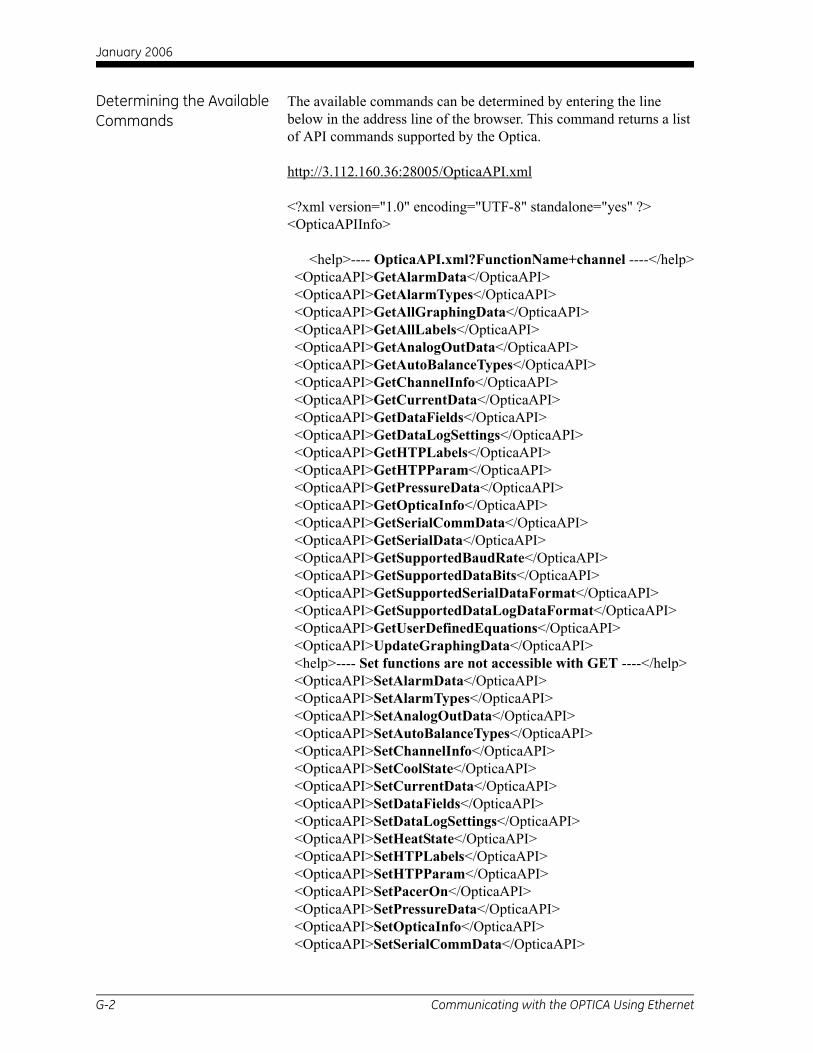
January 2006
Determining the Available Commands
The available commands can be determined by entering the line below in the address line of the browser. This command returns a list of API commands supported by the Optica.
http://3.112.160.36:28005/OpticaAPI.xml
<?xml version="1.0" encoding="UTF-8" standalone="yes" ?><OpticaAPIInfo>
<help>---- OpticaAPI.xml?FunctionName+channel ----</help> <OpticaAPI>GetAlarmData</OpticaAPI> <OpticaAPI>GetAlarmTypes</OpticaAPI> <OpticaAPI>GetAllGraphingData</OpticaAPI> <OpticaAPI>GetAllLabels</OpticaAPI> <OpticaAPI>GetAnalogOutData</OpticaAPI> <OpticaAPI>GetAutoBalanceTypes</OpticaAPI> <OpticaAPI>GetChannelInfo</OpticaAPI> <OpticaAPI>GetCurrentData</OpticaAPI> <OpticaAPI>GetDataFields</OpticaAPI> <OpticaAPI>GetDataLogSettings</OpticaAPI> <OpticaAPI>GetHTPLabels</OpticaAPI> <OpticaAPI>GetHTPParam</OpticaAPI> <OpticaAPI>GetPressureData</OpticaAPI> <OpticaAPI>GetOpticaInfo</OpticaAPI> <OpticaAPI>GetSerialCommData</OpticaAPI> <OpticaAPI>GetSerialData</OpticaAPI> <OpticaAPI>GetSupportedBaudRate</OpticaAPI> <OpticaAPI>GetSupportedDataBits</OpticaAPI> <OpticaAPI>GetSupportedSerialDataFormat</OpticaAPI> <OpticaAPI>GetSupportedDataLogDataFormat</OpticaAPI> <OpticaAPI>GetUserDefinedEquations</OpticaAPI> <OpticaAPI>UpdateGraphingData</OpticaAPI> <help>---- Set functions are not accessible with GET ----</help> <OpticaAPI>SetAlarmData</OpticaAPI> <OpticaAPI>SetAlarmTypes</OpticaAPI> <OpticaAPI>SetAnalogOutData</OpticaAPI> <OpticaAPI>SetAutoBalanceTypes</OpticaAPI> <OpticaAPI>SetChannelInfo</OpticaAPI> <OpticaAPI>SetCoolState</OpticaAPI> <OpticaAPI>SetCurrentData</OpticaAPI> <OpticaAPI>SetDataFields</OpticaAPI> <OpticaAPI>SetDataLogSettings</OpticaAPI> <OpticaAPI>SetHeatState</OpticaAPI> <OpticaAPI>SetHTPLabels</OpticaAPI> <OpticaAPI>SetHTPParam</OpticaAPI> <OpticaAPI>SetPacerOn</OpticaAPI> <OpticaAPI>SetPressureData</OpticaAPI> <OpticaAPI>SetOpticaInfo</OpticaAPI> <OpticaAPI>SetSerialCommData</OpticaAPI>
G-2 Communicating with the OPTICA Using Ethernet

January 2006
Determining the Available Commands (cont.)
<OpticaAPI>SetSerialData</OpticaAPI> <OpticaAPI>SetSupportedBaudRate</OpticaAPI> <OpticaAPI>SetSupportedDataBits</OpticaAPI> <OpticaAPI>SetSupportedSerialDataFormat</OpticaAPI> <OpticaAPI>SetUserDefinedEquations</OpticaAPI></OpticaAPIInfo>
Retrieving the Alarm Settings
Command: http://3.112.160.36:28005/OpticaAPI.xml?GetAlarmData+0Function Name: GetAlarmDataChannel: 0
Response: <?xml version="1.0" encoding="UTF-8" standalone="yes" ?> <OpticaAPIReturn Function="GetAlarmData"> <channel>0</channel>
<AlarmType>2</AlarmType> <Enabled>true</Enabled> <UnitOffset>2</UnitOffset> <type>2</type> <LowerLimit>30.000000</LowerLimit> <UpperLimit>60.000000</UpperLimit>
<AlarmType>2</AlarmType> <Enabled>true</Enabled> <UnitOffset>17</UnitOffset> <type>17</type> <LowerLimit>18.000000</LowerLimit> <UpperLimit>26.000000</UpperLimit> <retval>GEIAPI_SUCCESS</retval></OpticaAPIReturn
The Optica supports two alarm set points: The above response shows the settings for alarm 1 and alarm 2 in that order. (Note that the index is referenced from 0 , not 1). Alarm 1 parameters are described below.
Alarm 1 Settings: Alarm type = 2 (SetPoint, InnerBand, Outerband, Control, Service, Pacer) 2 here indicates Outerband
Enabled = True (Alarm 1 is enabled.)
Unit Offset = 2 (% RH) See the Optica manual or use the GetHTPLabels for the list of available units and the order.
Type = 2 ( ignore this value)
LowerLimit = 18.000000 (the Lower limit is 18 %RH)
UpperLimit = 26.000000 (The Upper limit is 26 %RH)
Communicating with the OPTICA Using Ethernet G-3

January 2006
Retrieving the Alarm Types
This command enables the user to retrieve different alarm types that are supported by the Optica, and the order in which they are referenced.
Command: http://3.112.160.36:28005/OpticaAPI.xml?GetAlarmTypesFunction Name: GetAlarmTypesChannel: 0
Response:<?xml version="1.0" encoding="UTF-8" standalone="yes" ?> <OpticaAPIReturn Function="GetAlarmTypes"> <NumAlarmTypes>6</NumAlarmTypes> <AlarmType>SetPoint</AlarmType> <AlarmType>Inner Band</AlarmType> <AlarmType>Outer Band</AlarmType> <AlarmType>Control</AlarmType> <AlarmType>Service</AlarmType> <AlarmType>Pacer</AlarmType> <retval>GEIAPI_SUCCESS</retval></OpticaAPIReturn>
This Response indicates that 6 alarm types are supported. They are listed in order with the reference being 0.
G-4 Communicating with the OPTICA Using Ethernet

January 2006
Retrieving Supported Units
This command enables the user to retrieve different units that are supported by the Optica and the order in which they are referenced.
Command: http://3.112.160.36:28005/OpticaAPI.xml?GetAllLabelsFunction Name: GetAlarmTypesChannel: 0
Response:<?xml version="1.0" encoding="UTF-8" standalone="yes" ?> <OpticaAPIReturn Function="GetAllLabels"> <channel>0</channel> <sLabels>Tdew °C</sLabels> <sLabels>Tdew °F</sLabels> <sLabels>%RH</sLabels> <sLabels>Twet °C</sLabels> <sLabels>Twet °F</sLabels> <sLabels>ppmv</sLabels> <sLabels>ppmw</sLabels> <sLabels>Grains/lb</sLabels> <sLabels>Grains/SCF</sLabels> <sLabels>g/kg</sLabels> <sLabels>g/m3</sLabels> <sLabels>lb/Mft3</sLabels> <sLabels>Kj/Kg (0)</sLabels> <sLabels>Kj/Kg (32)</sLabels> <sLabels>Btu/lb (0)</sLabels> <sLabels>Btu/lb (32)</sLabels> <sLabels>pw(mbar)</sLabels> <sLabels>Tmp °C</sLabels> <sLabels>Tmp °F</sLabels> <sLabels>Tmp °K</sLabels> <sLabels>Tmp °R</sLabels> <sLabels>psia</sLabels> <sLabels>mbar</sLabels> <sLabels>bar</sLabels> <sLabels>Pa</sLabels> <sLabels>kPa</sLabels> <sLabels>mmHg</sLabels> <sLabels>inHg</sLabels> <sLabels>KgCm2</sLabels> <sLabels>DyneCm2</sLabels> <sLabels /> <sLabels>UserEquation2</sLabels> <sLabels>UserEquation3</sLabels> <retval>GEIAPI_SUCCESS</retval></OpticaAPIReturn>
Communicating with the OPTICA Using Ethernet G-5

January 2006
Retrieving Labels and Functions
This command enables the user to retrieve different units that are supported by the Optica, and the order in which they are referenced. It also indicates which labels are humidity labels, temperature labels and pressure labels.
Command: http://3.112.160.36:28005/OpticaAPI.xml?GetHTPLabels+0Function Name: GetHTPLablesChannel: 0
Response: <?xml version="1.0" encoding="UTF-8" standalone="yes" ?><OpticaAPIReturn Function="GetHTPLabels"><channel>0</channel> <iHumidityLabels>17</iHumidityLabels> <sHumidityLabels>Tdew °C</sHumidityLabels> <sHumidityLabels>Tdew °F</sHumidityLabels> <sHumidityLabels>%RH</sHumidityLabels> <sHumidityLabels>Twet °C</sHumidityLabels> <sHumidityLabels>Twet °F</sHumidityLabels> <sHumidityLabels>ppmv</sHumidityLabels> <sHumidityLabels>ppmw</sHumidityLabels> <sHumidityLabels>Grains/lb</sHumidityLabels> <sHumidityLabels>Grains/SCF</sHumidityLabels> <sHumidityLabels>g/kg</sHumidityLabels> <sHumidityLabels>g/m3</sHumidityLabels> <sHumidityLabels>lb/Mft3</sHumidityLabels> <sHumidityLabels>kj/kg (0)</sHumidityLabels> <sHumidityLabels>kj/kg (32)</sHumidityLabels> <sHumidityLabels>Btu/lb (0)</sHumidityLabels> <sHumidityLabels>Btu/lb (32)</sHumidityLabels> <sHumidityLabels>pw(mbar)</sHumidityLabels> <iTemperatureLabels>4</iTemperatureLabels> <sTemperatureLabels>Tmp °C</sTemperatureLabels> <sTemperatureLabels>Tmp °F</sTemperatureLabels> <sTemperatureLabels>Tmp °K</sTemperatureLabels> <sTemperatureLabels>Tmp °R</sTemperatureLabels> <iPressureLabels>9</iPressureLabels> <sPressureLabels>psia</sPressureLabels> <sPressureLabels>mbar</sPressureLabels> <sPressureLabels>bar</sPressureLabels> <sPressureLabels>Pa</sPressureLabels> <sPressureLabels>kPa</sPressureLabels> <sPressureLabels>mmHg</sPressureLabels> <sPressureLabels>inHg</sPressureLabels> <sPressureLabels>kg/cm2</sPressureLabels> <sPressureLabels>DyneCm2</sPressureLabels> <iUserLabels>3</iUserLabels> <sUserLabels />
G-6 Communicating with the OPTICA Using Ethernet

January 2006
Retrieving Labels and Functions (cont.)
<sUserLabels>UserEquation2</sUserLabels> <sUserLabels>UserEquation3</sUserLabels> <iLabels>33</iLabels> <sLabels>Tdew °C</sLabels> <sLabels>Tdew °F</sLabels> <sLabels>%RH</sLabels> <sLabels>Twet °C</sLabels> <sLabels>Twet °F</sLabels> <sLabels>ppmv</sLabels> <sLabels>ppmw</sLabels> <sLabels>Grains/lb</sLabels> <sLabels>Grains/SCF</sLabels> <sLabels>g/kg</sLabels> <sLabels>g/m3</sLabels> <sLabels>lb/Mft3</sLabels> <sLabels>Kj/Kg (0)</sLabels> <sLabels>Kj/Kg (32)</sLabels> <sLabels>Btu/lb (0)</sLabels> <sLabels>Btu/lb (32)</sLabels> <sLabels>pw(mbar)</sLabels> <sLabels>Tmp °C</sLabels> <sLabels>Tmp °F</sLabels> <sLabels>Tmp °K</sLabels> <sLabels>Tmp °R</sLabels> <sLabels>psia</sLabels> <sLabels>mbar</sLabels> <sLabels>bar</sLabels> <sLabels>Pa</sLabels> <sLabels>kPa</sLabels> <sLabels>mmHg</sLabels> <sLabels>inHg</sLabels> <sLabels>KgCm2</sLabels> <sLabels>DyneCm2</sLabels> <sLabels /> <sLabels>UserEquation2</sLabels> <sLabels>UserEquation3</sLabels> <HumidityUnitsBaseIndex>0</HumidityUnitsBaseIndex> <TemperatureUnitsBaseIndex>17</TemperatureUnitsBaseIndex> <PressureUnitsBaseIndex>21</PressureUnitsBaseIndex> <UserUnitsBaseIndex>30</UserUnitsBaseIndex> <retval>GEIAPI_SUCCESS</retval> </OpticaAPIReturn>
This response indicates how many humidity labels (iHumidityLabels), temperature labels (iTemperatureLabels), pressure labels (iPressureLabels) and UserLabels there are. The iLabels value indicates how many labels there are all together (33).
Communicating with the OPTICA Using Ethernet G-7

January 2006
Retrieving Analog Output Information
This command enables the user to retrieve settings for the two analog outputs.
Command: http://3.112.160.36:28005/OpticaAPI.xml?GetAnalogOutData+0Function Name: GetAnalogOutDataChannel: 0
Response:<?xml version="1.0" encoding="UTF-8" standalone="yes" ?> <OpticaAPIReturn Function="GetAnalogOutData"> <channel>0</channel> <UnitOffset>0</UnitOffset> <LowerLimit>-40.000000</LowerLimit> <UpperLimit>60.000000</UpperLimit> <UnitOffset>17</UnitOffset> <LowerLimit>0.000000</LowerLimit> <UpperLimit>100.000000</UpperLimit> <retval>GEIAPI_SUCCESS</retval> </OpticaAPIReturn>
UnitOffset is an index to the list of labels. In this case 0 refers to Tdew °C
Retrieving the Measured and Calculated Values
This command enables the user to retrieve measured and calculated values for all supported units. The status information is also returned.
Command: http://3.112.160.36:28005/OpticaAPI.xml?GetCurrentData+0Function Name: GetCurrentDataChannel: 0
Response:<?xml version="1.0" encoding="UTF-8" standalone="yes" ?> <OpticaAPIReturn Function="GetCurrentData"> <channel>0</channel> <channelName />
Note: iNumber is the number of data values returned.
This number is the same as "iLabels" of GetHTPLabels and those labels coincide with these values.
<iNumber>33</iNumber> <fAllData>-4.892536</fAllData> <fAllData>23.193436</fAllData> <fAllData>16.158667</fAllData> <fAllData>9.333572</fAllData>
G-8 Communicating with the OPTICA Using Ethernet
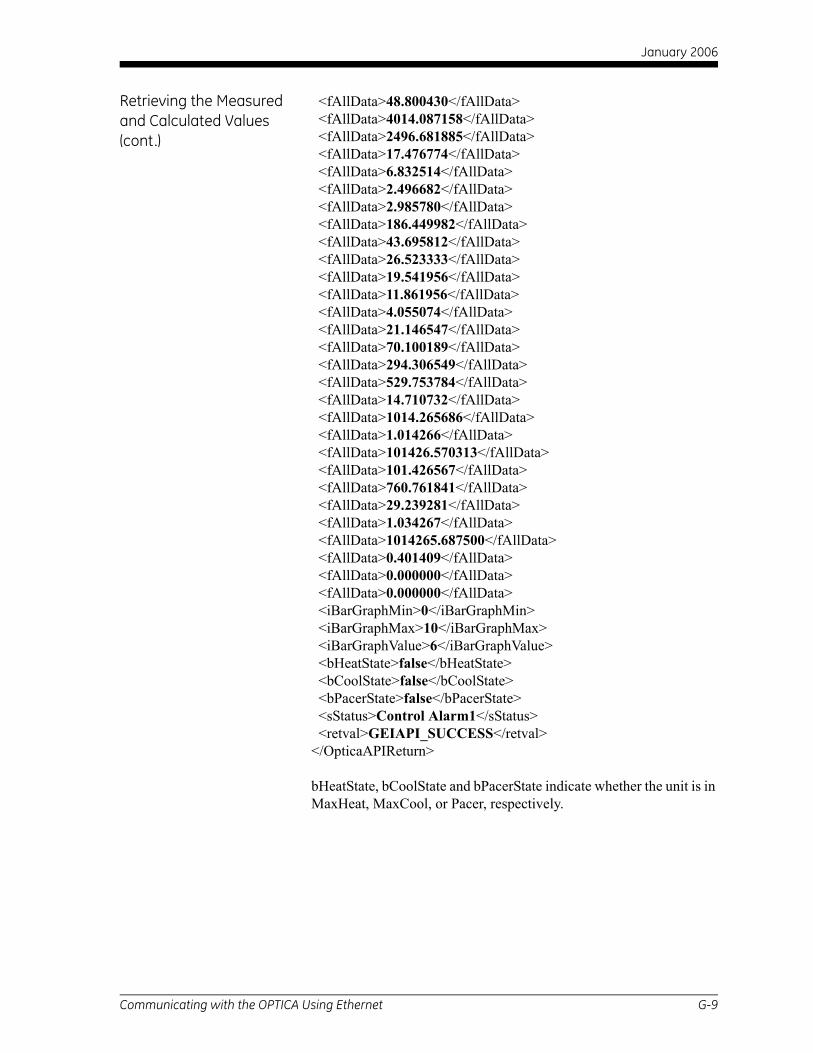
January 2006
Retrieving the Measured and Calculated Values (cont.)
<fAllData>48.800430</fAllData> <fAllData>4014.087158</fAllData> <fAllData>2496.681885</fAllData> <fAllData>17.476774</fAllData> <fAllData>6.832514</fAllData> <fAllData>2.496682</fAllData> <fAllData>2.985780</fAllData> <fAllData>186.449982</fAllData> <fAllData>43.695812</fAllData> <fAllData>26.523333</fAllData> <fAllData>19.541956</fAllData> <fAllData>11.861956</fAllData> <fAllData>4.055074</fAllData> <fAllData>21.146547</fAllData> <fAllData>70.100189</fAllData> <fAllData>294.306549</fAllData> <fAllData>529.753784</fAllData> <fAllData>14.710732</fAllData> <fAllData>1014.265686</fAllData> <fAllData>1.014266</fAllData> <fAllData>101426.570313</fAllData> <fAllData>101.426567</fAllData> <fAllData>760.761841</fAllData> <fAllData>29.239281</fAllData> <fAllData>1.034267</fAllData> <fAllData>1014265.687500</fAllData> <fAllData>0.401409</fAllData> <fAllData>0.000000</fAllData> <fAllData>0.000000</fAllData> <iBarGraphMin>0</iBarGraphMin> <iBarGraphMax>10</iBarGraphMax> <iBarGraphValue>6</iBarGraphValue> <bHeatState>false</bHeatState> <bCoolState>false</bCoolState> <bPacerState>false</bPacerState> <sStatus>Control Alarm1</sStatus> <retval>GEIAPI_SUCCESS</retval> </OpticaAPIReturn>
bHeatState, bCoolState and bPacerState indicate whether the unit is in MaxHeat, MaxCool, or Pacer, respectively.
Communicating with the OPTICA Using Ethernet G-9

January 2006
4X40 Optica Configuration
Using an RS-232 communication link, the user can set the network settings. To see the set of supported commands, type "$Help<>"
1. $SetIPAddress <IP ADDRESS><> (i.e. $SetIPAddress 3 112 60 36)
2. $SetIPSource <STATIC><> (Assuming STATIC IP)
3. $SaveNetworkSettings<>
4. $GetNetworkSettings<> (Displays the current network settings)
It takes time to execute the "SaveNetworkSettings" command. Wait until the display updates to determine when to reset the unit. In order for the settings to take effect, power to the unit must be cycled.
G-10 Communicating with the OPTICA Using Ethernet

January 2006
Index
AAccessory Specifications . . . . . . . . . . . . . . . .A-3Alarm Outputs
Inner Band Alarm. . . . . . . . . . . . . . . . . . . 2-11Outer Band Alarm . . . . . . . . . . . . . . . . . . 2-11Set Point Alarm . . . . . . . . . . . . . . . . . . . . 2-11Wiring. . . . . . . . . . . . . . . . . . . . . . . . . . . . 2-10
Alarms4x40 Optica . . . . . . . . . . . . . . . . . . . . . . . . 5-6Retrieving Settings with Ethernet . . . . . . .G-3Retrieving Types with Ethernet . . . . . . . . .G-4VGA Optica . . . . . . . . . . . . . . . . . . . . . . . . 4-8
Analog Outputs4x40 Optica . . . . . . . . . . . . . . . . . . . . . . . . 5-4Retrieving Information with Ethernet . . . .G-8Troubleshooting . . . . . . . . . . . . . . . . . . . . . 7-8VGA Optica . . . . . . . . . . . . . . . . . . . . . . . . 4-6Wiring. . . . . . . . . . . . . . . . . . . . . . . . . . . . . 2-9
Automatic Balance4x40 Optica (earlier software) . . . . . . . . . . F-1VGA Optica (earlier software). . . . . . . . . . F-1
Automatic Cleaning and Balancing4x40 Optica . . . . . . . . . . . . . . . . . . . . . . . . 5-8VGA Optica . . . . . . . . . . . . . . . . . . . . . . . . 4-9
BBalancing a Sensor. . . . . . . . . . . . . . . . . . . . 3-10Balancing, Automatic
4x40 Optica . . . . . . . . . . . . . . . . . . . . . . . . 5-84x40 Optica (earlier software) . . . . . . . . . . F-1VGA Optica . . . . . . . . . . . . . . . . . . . . . . . . 4-9VGA Optica (earlier software). . . . . . . . . . F-1
BenchtopSpecifications . . . . . . . . . . . . . . . . . . . . . . .A-2Wiring Input Power . . . . . . . . . . . . . . . . . . 2-5Wiring Outputs . . . . . . . . . . . . . . . . . . . . . . 2-8Wiring Sensors . . . . . . . . . . . . . . . . . . . . . . 2-5
CCalibration. . . . . . . . . . . . . . . . . . . . . . . . . . . .7-6Chilled Mirror Sensor
Comparison Chart . . . . . . . . . . . . . . . . . . . D-3Chilled Mirror Sensors . . . . . . . . . . . . . . . . . D-1Cleaning, Automatic
4x40 Optica . . . . . . . . . . . . . . . . . . . . . . . . .5-8VGA Optica . . . . . . . . . . . . . . . . . . . . . . . .4-9
Communication Parameters4x40 Optica . . . . . . . . . . . . . . . . . . . . . . . . .5-4Setting with Ethernet. . . . . . . . . . . . . . . . . G-1
Computer Communication with Ethernet . . . G-1Configuration Files, Saving . . . . . . . . . . . . .4-20Contamination
Gaseous Contaminants . . . . . . . . . . . . . . .3-12Minimizing the Effects . . . . . . . . . . . . . . .3-13Mirror Cleanliness . . . . . . . . . . . . . . . . . .3-11Particulate Matter . . . . . . . . . . . . . . . . . . .3-11Water-Soluble Contaminants . . . . . . . . . .3-12
CoolantModel 1311XR Sensor . . . . . . . . . . . . . . .2-18
DData Fields
4x40 Optica . . . . . . . . . . . . . . . . . . . . . . . . .5-7VGA Optica . . . . . . . . . . . . . . . . . . . . . . .4-11
Default Settings. . . . . . . . . . . . . . . . . . . . . . . .3-9Definitions. . . . . . . . . . . . . . . . . . . . . . . . . . . E-1Depression Capability. . . . . . . . . . . . . . D-1, E-1Dew Point
High Measurements . . . . . . . . . . . . . . . . .2-14Sampling Lines . . . . . . . . . . . . . . . . . . . . .2-14Supercooled. . . . . . . . . . . . . . . . . . . . . . . .3-11
Direct Communication with Ethernet . . . . . . G-1Display
"Balance" Displayed . . . . . . . . . . . . . . . . . .7-8Incorrect Dew Point . . . . . . . . . . . . . . . . . .7-7Troubleshooting . . . . . . . . . . . . . . . . . . . . .7-6VGA . . . . . . . . . . . . . . . . . . . . . . . . . . . . . E-1
Index 1
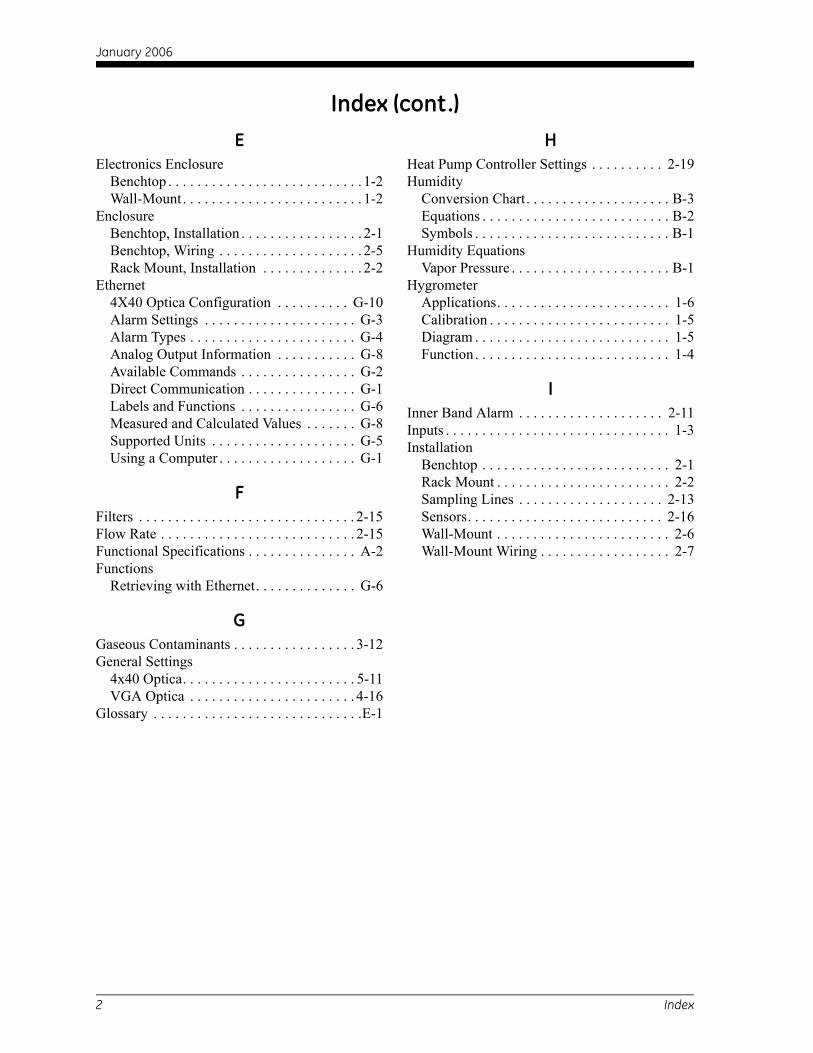
January 2006
Index (cont.)
EElectronics EnclosureBenchtop . . . . . . . . . . . . . . . . . . . . . . . . . . . 1-2Wall-Mount . . . . . . . . . . . . . . . . . . . . . . . . . 1-2
EnclosureBenchtop, Installation . . . . . . . . . . . . . . . . . 2-1Benchtop, Wiring . . . . . . . . . . . . . . . . . . . . 2-5Rack Mount, Installation . . . . . . . . . . . . . . 2-2
Ethernet4X40 Optica Configuration . . . . . . . . . . G-10Alarm Settings . . . . . . . . . . . . . . . . . . . . . G-3Alarm Types . . . . . . . . . . . . . . . . . . . . . . . G-4Analog Output Information . . . . . . . . . . . G-8Available Commands . . . . . . . . . . . . . . . . G-2Direct Communication . . . . . . . . . . . . . . . G-1Labels and Functions . . . . . . . . . . . . . . . . G-6Measured and Calculated Values . . . . . . . G-8Supported Units . . . . . . . . . . . . . . . . . . . . G-5Using a Computer . . . . . . . . . . . . . . . . . . . G-1
FFilters . . . . . . . . . . . . . . . . . . . . . . . . . . . . . . 2-15Flow Rate . . . . . . . . . . . . . . . . . . . . . . . . . . . 2-15Functional Specifications . . . . . . . . . . . . . . . A-2Functions
Retrieving with Ethernet. . . . . . . . . . . . . . G-6
GGaseous Contaminants . . . . . . . . . . . . . . . . . 3-12General Settings
4x40 Optica. . . . . . . . . . . . . . . . . . . . . . . . 5-11VGA Optica . . . . . . . . . . . . . . . . . . . . . . . 4-16
Glossary . . . . . . . . . . . . . . . . . . . . . . . . . . . . .E-1
HHeat Pump Controller Settings . . . . . . . . . . 2-19Humidity
Conversion Chart. . . . . . . . . . . . . . . . . . . . B-3Equations . . . . . . . . . . . . . . . . . . . . . . . . . . B-2Symbols . . . . . . . . . . . . . . . . . . . . . . . . . . . B-1
Humidity EquationsVapor Pressure . . . . . . . . . . . . . . . . . . . . . . B-1
HygrometerApplications. . . . . . . . . . . . . . . . . . . . . . . . 1-6Calibration . . . . . . . . . . . . . . . . . . . . . . . . . 1-5Diagram . . . . . . . . . . . . . . . . . . . . . . . . . . . 1-5Function . . . . . . . . . . . . . . . . . . . . . . . . . . . 1-4
IInner Band Alarm . . . . . . . . . . . . . . . . . . . . 2-11Inputs . . . . . . . . . . . . . . . . . . . . . . . . . . . . . . . 1-3Installation
Benchtop . . . . . . . . . . . . . . . . . . . . . . . . . . 2-1Rack Mount . . . . . . . . . . . . . . . . . . . . . . . . 2-2Sampling Lines . . . . . . . . . . . . . . . . . . . . 2-13Sensors. . . . . . . . . . . . . . . . . . . . . . . . . . . 2-16Wall-Mount . . . . . . . . . . . . . . . . . . . . . . . . 2-6Wall-Mount Wiring . . . . . . . . . . . . . . . . . . 2-7
2 Index

January 2006
Index (cont.)
MMaintenanceBalancing the Sensor Optics . . . . . . . . . . . 7-2Calibration . . . . . . . . . . . . . . . . . . . . . . . . . 7-6Cleaning the Sensor Mirror . . . . . . . . . . . . 7-1Replacing Sensor Mirrors . . . . . . . . . . . . . 7-4Sample Line . . . . . . . . . . . . . . . . . . . . . . . 3-13Sensor Optics . . . . . . . . . . . . . . . . . . . . . . . 7-1Testing . . . . . . . . . . . . . . . . . . . . . . . . . . . . 7-6Troubleshooting . . . . . . . . . . . . . . . . . . . . . 7-6
MeasurementAt a Different Pressure. . . . . . . . . . . . . . . . 3-4Dew Point. . . . . . . . . . . . . . . . . . . . . . 3-5, 3-7High Dew Point . . . . . . . . . . . . . . . . . . . . 2-14Process Pressure . . . . . . . . . . . . . .3-4, 3-5, 3-6Range . . . . . . . . . . . . . . . . . . . . . . . . . . . . .D-2Ranges . . . . . . . . . . . . . . . . . . . . . . . . . . . . 1-1Retrieving Values with Ethernet. . . . . . . . .G-8Units of Measure . . . . . . . . . . . . . . . . . . . . 4-4Vapor Pressure with a Sensor . . . . . . . 3-5, 3-7Vapor Pressure without a Sensor . . . . 3-5, 3-6
MirrorCleaning . . . . . . . . . . . . . . . . . . . . . . . . . . . 7-1Flooding . . . . . . . . . . . . . . . . . . . . . . . . . . 3-13
Model 1311XR Sensor . . . . . . . . . . . . . . . . . 2-18Control Knob . . . . . . . . . . . . . . . . . . . . . . 2-19Coolant . . . . . . . . . . . . . . . . . . . . . . . . . . . 2-18Electrical Connections . . . . . . . . . . . . . . . 2-18Error Indicators . . . . . . . . . . . . . . . . . . . . 2-19Heat Pump Controller Settings. . . . . . . . . 2-19Purging the Sensor . . . . . . . . . . . . . . . . . . 2-20Sample Gas Fittings . . . . . . . . . . . . . . . . . 2-18
Model SIM-12H Sensor . . . . . . . . . . . . . . . . 2-20
NNetwork
Definition . . . . . . . . . . . . . . . . . . . . . . . . . . E-1Menu . . . . . . . . . . . . . . . . . . . . . . . . . . . . 4-12Operation . . . . . . . . . . . . . . . . . . . . . . . . . . 3-3Screen. . . . . . . . . . . . . . . . . . . . . . . . . . . . . 3-3
Network-Based Programming . . . . . . . . . . . . 6-1
OOperation
4x40 Optica . . . . . . . . . . . . . . . . . . . . . . . . .3-3Helpful Hints. . . . . . . . . . . . . . . . . . . . . . .3-10Network. . . . . . . . . . . . . . . . . . . . . . . . . . . .3-3Normal . . . . . . . . . . . . . . . . . . . . . . . . . . . .3-1Theory of. . . . . . . . . . . . . . . . . . . . . . . . . . .1-4VGA Optica . . . . . . . . . . . . . . . . . . . . . . . .3-2
Optica 4X40Configuration with Ethernet . . . . . . . . . . G-10
Optica 4x40Alarms. . . . . . . . . . . . . . . . . . . . . . . . . . . . .5-6Analog Outputs . . . . . . . . . . . . . . . . . . . . . .5-4Automatic Balance . . . . . . . . . . . . . . . . . . .F-1Balance . . . . . . . . . . . . . . . . . . . . . . . . . . . .3-3Buzzer and Sounds . . . . . . . . . . . . . . . . . .5-11Communication Parameters . . . . . . . . . . . .5-4Data Fields . . . . . . . . . . . . . . . . . . . . . . . . .5-7Definition . . . . . . . . . . . . . . . . . . . . . . . . . E-1Display Screen . . . . . . . . . . . . . . . . . . . . . .3-3Factory Calibrations . . . . . . . . . . . . . . . . .5-12General Settings . . . . . . . . . . . . . . . . . . . .5-11Operation. . . . . . . . . . . . . . . . . . . . . . . . . . .3-3Pressure Input . . . . . . . . . . . . . . . . . . . . . . .5-7Programmable Functions . . . . . . . . . . . . . .5-4Programming. . . . . . . . . . . . . . . . . . . . . . . .5-1Serial Output Setup . . . . . . . . . . . . . . . . . . .5-5Serial Outputs . . . . . . . . . . . . . . . . . . . . . . .5-5Setting Time and Date. . . . . . . . . . . . . . . .5-12Special Options . . . . . . . . . . . . . . . . . . . . .5-12User Default Settings . . . . . . . . . . . . . . . .5-12User Equations . . . . . . . . . . . . . . . . . . . . .5-11
Optica Models Comparison . . . . . . . . . . . . . D-3Outer Band Alarm. . . . . . . . . . . . . . . . . . . . .2-11Outputs . . . . . . . . . . . . . . . . . . . . . . . . . . . . . .1-3
Index 3

January 2006
Index (cont.)
PPACERCycle . . . . . . . . . . . . . . . . . . . . . . . . . . . . . . 1-6Definition . . . . . . . . . . . . . . . . . . . . . . . . . .E-1
Parameter Definition. . . . . . . . . . . . . . . . . . . .E-1Particulate Contaminants . . . . . . . . . . . . . . . 3-11Performance . . . . . . . . . . . . . . . . . . . . . . . . . A-1Pressure
Effects . . . . . . . . . . . . . . . . . . . . . . . . . . . . 3-13Manually Entering . . . . . . . . . . . . . . . . . . . 3-4Measuring . . . . . . . . . . . . . . . . . . . . . . . . . . 3-4Process . . . . . . . . . . . . . . . . . . . . . . . . . . . . 3-4Vapor. . . . . . . . . . . . . . . . . . . . . . . . . . . . . B-1
Pressure Input4x40 Optica. . . . . . . . . . . . . . . . . . . . . . . . . 5-7VGA Optica . . . . . . . . . . . . . . . . . . . . . . . . 4-7
Process Pressure . . . . . . . . . . . . . . . . . . . . . . . 3-4Definition . . . . . . . . . . . . . . . . . . . . . . . . . .E-1Measuring . . . . . . . . . . . . . . . . . . . . . . . . . . 3-4
Programming4x40 Optica. . . . . . . . . . . . . . . . . . . . . . . . . 5-1Network-Based . . . . . . . . . . . . . . . . . . . . . . 6-1VGA Optica . . . . . . . . . . . . . . . . . . . . . . . . 4-1
SSample Gas Fittings
Model 1311XR Sensor . . . . . . . . . . . . . . 2-18Sample Line Maintenance . . . . . . . . . . . . . . 3-13Sampling Lines . . . . . . . . . . . . . . . . . .2-13, 2-14Scaling, Definition. . . . . . . . . . . . . . . . . . . . . E-1Sensors. . . . . . . . . . . . . . . . . . . . . . . . . . . . . . 1-3
Balancing . . . . . . . . . . . . . . . . . . . . . . . . . 3-10Balancing Optics . . . . . . . . . . . . . . . . . . . . 7-2Chilled Mirror . . . . . . . . . . . . . . . . . . . . . . D-1Cleaning the Mirror . . . . . . . . . . . . . . . . . . 7-1Comparison Chart . . . . . . . . . . . . . . . . . . . D-3Connecting. . . . . . . . . . . . . . . . . . . . . . . . 2-21Dew Point . . . . . . . . . . . . . . . . . . . . . . . . . 1-3Heat Transfer . . . . . . . . . . . . . . . . . . . . . . 2-14Heated . . . . . . . . . . . . . . . . . . . . . . . . . . . 2-14Information . . . . . . . . . . . . . . . . . . . . . . . 2-12Installation . . . . . . . . . . . . . . . . . . . .2-12, 2-16Maintenance . . . . . . . . . . . . . . . . 7-1, 7-2, 7-4Model 1111H . . . . . . . . . . . . . . . . . . . . . . 2-16Model 1311DR . . . . . . . . . . . . . . . . . . . . 2-17Model 1311XR . . . . . . . . . . . . . . . . . . . . 2-18Model D-2 . . . . . . . . . . . . . . . . . . . . . . . . 2-16Model SIM-12H . . . . . . . . . . . . . . . . . . . 2-20Pressure . . . . . . . . . . . . . . . . . . . . . . . . . . . 1-3Replacing Mirrors . . . . . . . . . . . . . . . . . . . 7-4Temperature . . . . . . . . . . . . . . . . . . . . . . . . 1-3
Serial Outputs4x40 Optica . . . . . . . . . . . . . . . . . . . . . . . . 5-5Troubleshooting. . . . . . . . . . . . . . . . . . . . . 7-8Wiring . . . . . . . . . . . . . . . . . . . . . . . . . . . 2-12
Service Required . . . . . . . . . . . . . . . . . . . . . . 7-6Set Point Alarm . . . . . . . . . . . . . . . . . . . . . . 2-11SHIFT Key . . . . . . . . . . . . . . . . . . . . . . . . . . E-1Softkeys . . . . . . . . . . . . . . . . . . . . . . . . . . . . . E-1Specifications
Functional . . . . . . . . . . . . . . . . . . . . . . . . . A-2Optional Accessories . . . . . . . . . . . . . . . . . A-3Performance. . . . . . . . . . . . . . . . . . . . . . . . A-1Physical (Benchtop). . . . . . . . . . . . . . . . . . A-2Physical (Wall-Mount) . . . . . . . . . . . . . . . A-2
Status Line Indications . . . . . . . . . . . . . . . . . 3-8Supercooled Dew Points . . . . . . . . . . . . . . . 3-11System
Components . . . . . . . . . . . . . . . . . . . . . . . . 1-3Planning. . . . . . . . . . . . . . . . . . . . . . . . . . . 1-3
4 Index

January 2006
Index (cont.)
TTesting . . . . . . . . . . . . . . . . . . . . . . . . . . . . . . 7-6Troubleshooting . . . . . . . . . . . . . . . . . . . . . . . 7-6
"Balance" on Display . . . . . . . . . . . . . . . . . 7-8"Service" Required. . . . . . . . . . . . . . . . . . . 7-6Incorrect Dew Point Display . . . . . . . . . . . 7-7No Analog Output . . . . . . . . . . . . . . . . . . . 7-8No Display . . . . . . . . . . . . . . . . . . . . . . . . . 7-6No Serial Output . . . . . . . . . . . . . . . . . . . . 7-8
UUnits
Retrieving with Ethernet . . . . . . . . . . . . . .G-5User Default Settings
4x40 Optica . . . . . . . . . . . . . . . . . . . . . . . 5-12User Equations
4x40 Optica . . . . . . . . . . . . . . . . . . . . . . . 5-11VGA Optica . . . . . . . . . . . . . . . . . . . . . . . . 4-4
VVapor Pressure . . . . . . . . . . . . . . . . . . . . . . . B-1
Measuring . . . . . . . . . . . . . . . . . . . . . . . . . .3-5VGA Optica
Alarms. . . . . . . . . . . . . . . . . . . . . . . . . . . . .4-8Analog Outputs . . . . . . . . . . . . . . . . . . . . . .4-6Automatic Balance (earlier software) . . . . .F-1Buzzer/Sound . . . . . . . . . . . . . . . . . . . . . .4-11Communication Parameters . . . . . . . . . . .4-17Data Categories . . . . . . . . . . . . . . . . . . . . . .4-1Data Entry Fields . . . . . . . . . . . . . . . . . . . .4-2Data Fields . . . . . . . . . . . . . . . . . . . . . . . .4-11Data Log . . . . . . . . . . . . . . . . . . . . . . . . . .4-13Download Screen . . . . . . . . . . . . . . . . . . .4-14General Options . . . . . . . . . . . . . . . . . . . .4-16Menu 1 . . . . . . . . . . . . . . . . . . . . . . . . . . . .4-6Menu 2 . . . . . . . . . . . . . . . . . . . . . . . . . . .4-15Network Menu . . . . . . . . . . . . . . . . . . . . .4-12Operation. . . . . . . . . . . . . . . . . . . . . . . . . . .3-2Pressure Input . . . . . . . . . . . . . . . . . . . . . . .4-7Programming. . . . . . . . . . . . . . . . . . . . . . . .4-1Programming Keys . . . . . . . . . . . . . . . . . . .4-2Query Mode Format . . . . . . . . . . . . . . . . .4-17Restoring Defaults . . . . . . . . . . . . . . . . . .4-19Serial Output Data. . . . . . . . . . . . . . . . . . .4-18Setting Time and Date. . . . . . . . . . . . . . . .4-19Special Options . . . . . . . . . . . . . . . . . . . . .4-16Units of Measure. . . . . . . . . . . . . . . . . . . . .4-4User Equations . . . . . . . . . . . . . . . . . 4-4, 4-16
VGA, Definition . . . . . . . . . . . . . . . . . . . . . . E-1
WWall-Mount
Installation. . . . . . . . . . . . . . . . . . . . . . . . . .2-6Specifications . . . . . . . . . . . . . . . . . . . . . . A-2Wiring Input Power. . . . . . . . . . . . . . . . . . .2-8Wiring Outputs . . . . . . . . . . . . . . . . . . . . . .2-8
Water-Soluble Contaminants . . . . . . . . . . . .3-12Wiring
Additional Voltage Outputs. . . . . . . . . . . .2-10Alarm Outputs. . . . . . . . . . . . . . . . . . . . . .2-10Analog Outputs . . . . . . . . . . . . . . . . . . . . . .2-9Model 1311XR Sensor . . . . . . . . . . . . . . .2-18Outputs . . . . . . . . . . . . . . . . . . . . . . . . . . . .2-8Serial Output . . . . . . . . . . . . . . . . . . . . . . .2-12Wall-Mount . . . . . . . . . . . . . . . . . . . . . . . . .2-7
Index 5

USA
1100 Technology Park DriveBillerica, MA 01821-4111Web: www.gesensing.com
Ireland
Shannon Industrial EstateShannon, County ClareIreland