ge healthcare · pdf fileleader in imaging –1mm+ installed base ... •global...
TRANSCRIPT
CAUTION CONCERNING FORWARD-LOOKING STATEMENTS:
This document contains "forward-looking statements" – that is, statements related to future events that by their nature address matters that are, to different degrees, uncertain. For details on the uncertainties that
may cause our actual future results to be materially different than those expressed in our forward-looking statements, see http://www.ge.com/investor-relations/disclaimer-caution-concerning-forward-looking-
statements as well as our annual reports on Form 10-K and quarterly reports on Form 10-Q. We do not undertake to update our forward-looking statements. This document also includes certain forward-looking
projected financial information that is based on current estimates and forecasts. Actual results could differ materially.
GE Healthcare
John L. Flannery, CEO June 1st , 2017

This is GE Healthcare
IMPACT AT SCALE ‘16A ‘17E
Revenue $18B +
Op Profit $3.2B +
OP% 17.3% +
FCF Conv. 117% 100%+
Leader in Imaging – 1MM+ Installed Base• 16K+ Scans every minute
Leader in Life Sciences• Presence in biologics
Leader in Data & Analytics• 230MM exams; 124K assets under management
Leader in China & Emerging Markets
2

A leading healthcare solutions provider
3
$8B $4B$2B$4B
Diagnostic imaging & service
Mobile diagnostics & monitoring
IT & digital solutions Life Sciences
Magnetic Resonance Ultrasound Enterprise Imaging Bio process
Computed Tomography Clinical Solutions Financial Management Protein & Cell Sciences
Molecular Imaging Monitoring Care Area WorkflowsContrast Media & Nuclear
Tracers
Service & Solutions Mobile Health GE Health CloudTM Cellular Therapy

Solid global market growth expected across businesses…
4
$17 B $11 B $37 B $18 B
2-3% 3% 9%5% Overall
9% Bio-Process
• Developed countries … replacement cycles
• Developing countries … penetration fueling continued growth
• Advances in technologies & therapies still rewarded
• Some softness in U.S.
• Continued rapid growth … digitization & cloud
• Strong global demand
• Growth driven by bio therapeutics
• Patient demand (aging, disease incidence) driving contrast growth
Diagnostic imaging & service
Mobile diagnostics & monitoring
IT & digital solutions Life Sciences
Market
($B ’16)
Growth
‘16-’18CAGR
Trends

…with some short-term headwinds in U.S.
May 31, 2017 5
Market
($B ’16)$6 B $4 B $20 B $7 B
1-2% 1-2% 9%5-6% Overall
9% Bio Process
• Positive macro’s. Aging IB driving growth
• Delays due to policy uncertainty (e.g., ACA)
• policy uncertaintyimpact … closer order-to-cash
• Shifting to Stages 2 & 3 of Meaningful Use
• Growth, driven by cloud,analytics & Pop. Health
• Continued growth in biologics spurs demand
• Proposed NIH funding cut likely dampener for research
Growth
‘16-’18CAGR
Trends
Diagnostic imaging & service
Mobile diagnostics & monitoring
IT & digital solutions Life Sciences
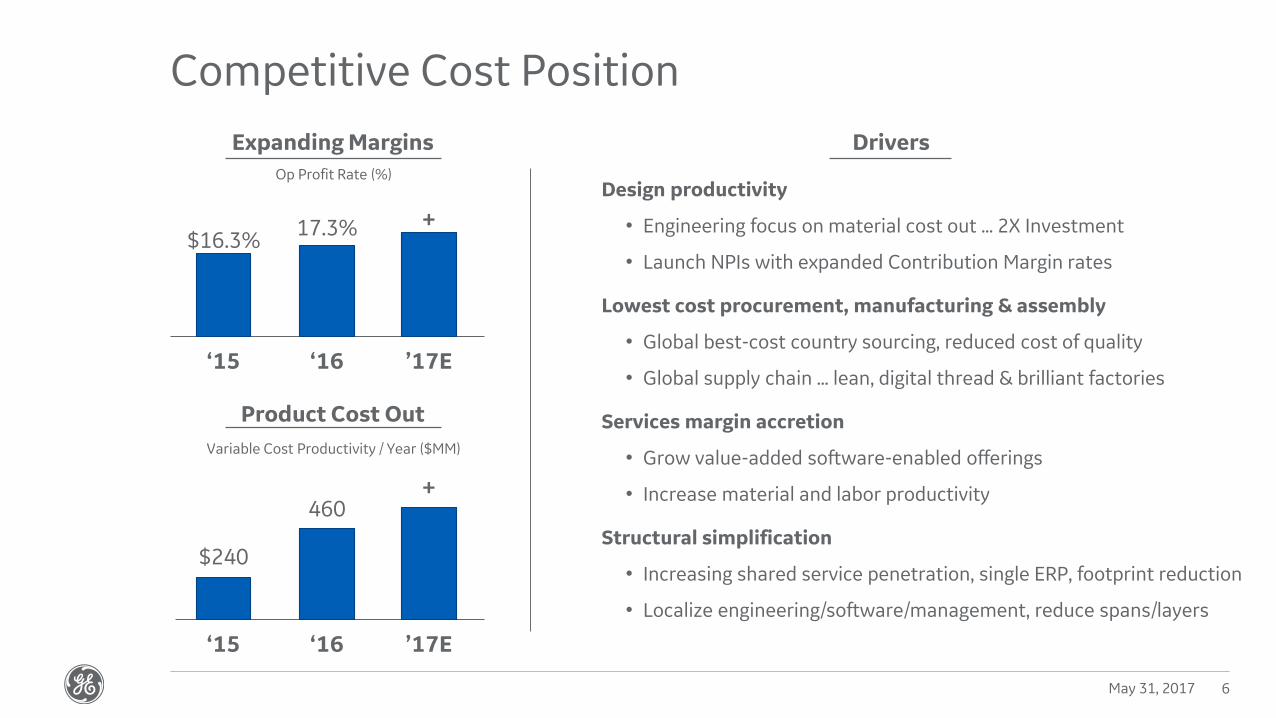
Competitive Cost Position
May 31, 2017 6
Product Cost Out
‘15 ‘16
$240
460
Variable Cost Productivity / Year ($MM)
’17E
+
Expanding Margins
‘15 ‘16
$16.3%17.3%
’17E
+
Op Profit Rate (%)
Drivers
Design productivity
• Engineering focus on material cost out … 2X Investment
• Launch NPIs with expanded Contribution Margin rates
Lowest cost procurement, manufacturing & assembly
• Global best-cost country sourcing, reduced cost of quality
• Global supply chain … lean, digital thread & brilliant factories
Services margin accretion
• Grow value-added software-enabled offerings
• Increase material and labor productivity
Structural simplification
• Increasing shared service penetration, single ERP, footprint reduction
• Localize engineering/software/management, reduce spans/layers

Investing in the Core
May 31, 2017 7
New products
MR
Cell therapy Contrast imaging
3.0T ArchitectCutting-edge 3.0 T wide-
bore platform driven by Total Digital Imaging
Ultrasound
Mammo
Senographe Pristina Improved design for
patient & tech Superior Dx accuracy
Affordable care
Revolution ACT Improved image
quality with reduced dose
Expanding into new cell & therapy types
Increased range of MRI contrast media
Venue POC Intuitive user
experience in simple, fast tablet
Design
Technology
AffordableCare
Digital
Simplified design & platforms … margins to GE
300+ dedicated cost out engineers … NPI cost
Market-backed technologies … drives share
Increasing speed to address customer needs
Portfolio built for Value/Super Value mkt segment
LCC engineering COEs … driving productivity
Improving customer experience + productivity
Connected infrastructure: service, upgrades, etc.
R&D Programs
‘16 ’17E
++++
‒ Product cost out
‒ Digital + solutions
‒ NPI launches 2X
Program Expense
Next generation Universal Viewer
Digital

Analytics & Cloud expected to drive positive Digital growth through ‘18
May 31, 2017 8
=$2 B
Revenue
Analytics &Cloud
Core HCIT
• Clinical and operational digital solutions
• GE Health Cloud … live, powered by Predix
• Accelerating via AI partnerships (UCSF, BCH, Partners Healthcare, more)
• Radiology and Care Area IT … re-platforming to product quality, running costs
• Revenue Cycle Management … move to SaaS
• Ambulatory EMR & Workforce Mgt
++
-/=
Analytics & Cloud
Core HCIT
=/+
Strong momentum on Analytics & Cloud
Imaging Analytics
Intelligent Machines APM
AW57 Apps>$350M revenue10% V
Wall-of-Analytics
Analytics-as-a-Service
ECG algorithm-as-a-Service510(k) filedPay-per-use LOI
Operations Optimization
35% faster exam timesCapacity 3k exams/year
X-Ray reject/repeat(Launched)
3k active iCenterusers40% V
Command Center’17 contractLTV >$60MLive apps 13 30
‘16 ’17E ’17F

Life Sciences
May 31, 2017 9
Critical solutions for biopharmaceutical companies
• Creates flexible, productive capacity … Highly regulated
• Equipment + consumables business model
Strong organic growth opportunities
• Bioprocess solutions … FlexFactory / KUBio™ and Biopark
• Leading partner in Cell Therapy … built on Bioprocess strength + healthcare depth
Leverages GE’s strengths
• GRC … product pipeline; Growth markets … China
• Services model; M&A leverages GE footprint / brand
20%+ Margins$1B+ FCF++
$4 B
Revenue A Leading Franchise
Bioprocess
CellTherapy
Biopharmaceutical manufacturing
Equipment, consumables, solutions
Leading partner in emerging field
Organic + Inorganic investments
DiagnosticsContrast media
SPECT/PET imaging agents
Leading Dx franchise linked to Imaging equipment
• #1 market share in contrast media & nuclear imaging
• Lowest cost provider … global manufacturing & distribution‘16 ’17E

Driving Cash Flow
May 31, 2017 10
Free Cash Flow Conversion
‘15 ‘16
120% 117%
’17E
100%+
Net Income / FCF
Capex: average investment ~2.5 year payback
Inventory: Targeting 0.5X factory improvements
A/P: +4 days … harmonizing terms across GE
A/R: reducing PDs 2 pts+ annually ‘16 & ‘17
Monthly Cash Councils … Supply Chain, Sourcing
Ongoing A/R deep dives by Region
Decisions & actions, with speed & urgency
Dedicated cash projects with top talent to drive
Restructuring ways of working to improve inventory
“Tiger-teams” addressing pain points
Key Actions to drive Cash
Intensity
Resources
AEIP aligned to both cost and cash flow
Specific working capital goals cascaded by team
Added cash metrics to sales incentives
Incentives
Digitized & automated dashboards & visualization
Connected to GE Store / shared services
Optimization tools rolled out in Service, Supply Chain
Tools

Disciplined Capital Allocation
May 31, 2017 11
Return on Invested Capital
‘16 ’17E
+1.1 pts ~1 pts+
Approach
Differentiated R&D .. Organic Growth Board
SG&A down 2 pts as % of sales since ‘14
Investing in restructuring, product cost out, SFE
Disciplined, but actively investing based on ROIC
M&A targets ‘bolt on’ to existing franchise, risk
Exit low ROIC businesses, ex. Clarient
Organic
Inorganic
Strategic PrioritiesReshaping Portfolio for Future
Dispositions
$(0.4)B
Acquisitions
$1.9B
15 transactions 7 transactions
Life Sciences: end-to-end bioprocess solutions, play to win in Cell Therapy, expand in Contrast
Clinical Care Solutions: Build digitally-connected portfolio
Solutions: Drive stronger consultative capability
Op Margins +1.0 pts in ’16 ... targeting 18% by ‘18
Inorganic investments since ‘14
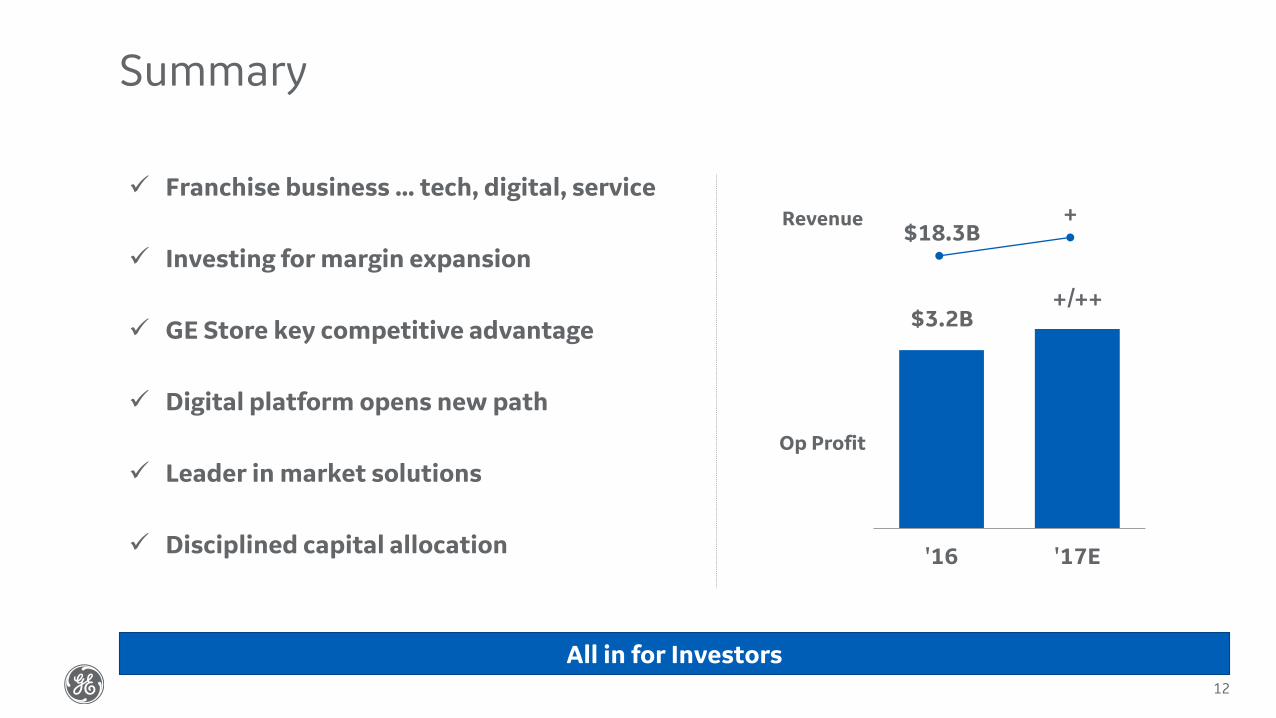
Summary
12
Op Profit
Revenue
'16 '17E
$3.2B+/++
$18.3B+
Franchise business … tech, digital, service
Investing for margin expansion
GE Store key competitive advantage
Digital platform opens new path
Leader in market solutions
Disciplined capital allocation
All in for Investors
