ge capital strategy capital strategy forward-looking statements: ... eni ~$41 eni ~$14 eni ~$3 #1...
TRANSCRIPT

Imagination at work.
GE Capital Strategy
Forward-Looking Statements: This document contains “forward-looking statements” – that is, statements related to future, not past, events. In this context, forward-looking statements often address our expected future business and financial performance and financial condition, and often contain words such as “expect,” “anticipate,” “intend,” “plan,” “believe,” “seek,” “see,” “will,” “would,” or “target.” Forward-looking statements by their nature address matters that are, to different degrees, uncertain, such as statements about our announced plan to reduce the size of our financial services businesses, including expected cash and non-cash charges associated with this plan; expected income; earnings per share; revenues; organic growth; margins; cost structure; restructuring charges; cash flows; return on capital; capital expenditures, capital allocation or capital structure; dividends; and the split between Industrial and GE Capital earnings. For us, particular uncertainties that could cause our actual results to be materially different than those expressed in our forward-looking statements include: obtaining (or the timing of obtaining) any required regulatory reviews or approvals or any other consents or approvals associated with our announced plan to reduce the size of our financial services businesses; our ability to complete incremental asset sales as part of this plan in a timely manner (or at all) and at the prices we have assumed; changes in law, economic and financial conditions, including interest and exchange rate volatility, commodity and equity prices and the value of financial assets, including the impact of these conditions on our ability to sell or the value of incremental assets to be sold as part of this plan as well as other aspects of this plan; the impact of conditions in the financial and credit markets on the availability and cost of GECC’s funding, and GECC’s exposure to counterparties; the impact of conditions in the housing market and unemployment rates on the level of commercial and consumer credit defaults; pending and future mortgage loan repurchase claims and other litigation claims in connection with WMC, which may affect our estimates of liability, including possible loss estimates; our ability to maintain our current credit rating and the impact on our funding costs and competitive position if we do not do so; the adequacy of our cash flows and earnings and other conditions which may affect our ability to pay our quarterly dividend at the planned level or to repurchase shares at planned levels; GECC’s ability to pay dividends to GE at the planned level, which may be affected by GECC’s cash flows and earnings, financial services regulation and oversight, and other factors; our ability to convert pre-order commitments/wins into orders; the price we realize on orders since commitments/wins are stated at list prices; customer actions or developments such as early aircraft retirements or reduced energy demand and other factors that may affect the level of demand and financial performance of the major industries and customers we serve; the effectiveness of our risk management framework; the impact of regulation and regulatory, investigative and legal proceedings and legal compliance risks, including the impact of financial services regulation and litigation; adverse market conditions, timing of and ability to obtain required bank regulatory approvals, or other factors relating to us or Synchrony Financial that could prevent us from completing the Synchrony Financial split-off as planned; our capital allocation plans, as such plans may change including with respect to the timing and size of share repurchases, acquisitions, joint ventures, dispositions and other strategic actions; our success in completing, including obtaining regulatory approvals for, announced transactions, such as the proposed transactions and alliances with Alstom, Appliances and Real Estate, and our ability to realize anticipated earnings and savings; our success in integrating acquired businesses and operating joint ventures; the impact of potential information technology or data security breaches; and the other factors that are described in “Risk Factors” in our Annual Report on Form 10-K for the year ended December 31, 2014. These or other uncertainties may cause our actual future results to be materially different than those expressed in our forward-looking statements. We do not undertake to update our forward-looking statements. This document includes certain forward-looking projected financial information that is based on current estimates and forecasts. Actual results could differ materially. This document also contains non-GAAP financial information. Management uses this information in its internal analysis of results and believes that this information may be informative to investors in gauging the quality of our financial performance, identifying trends in our results and providing meaningful period-to-period comparisons. For a reconciliation of non-GAAP measures presented in this document, see the accompanying supplemental information posted to the investor relations section of our website at www.ge.com.” In this document, “GE” refers to the Industrial businesses of the Company including GECC on an equity basis. GE Capital or GECC refers to the financial services businesses of the company. “GE (ex-GECC)” and/or “Industrial” refer to GE excluding Financial Services.” GE’s Investor Relations website at www.ge.com/investor and our corporate blog at www.gereports.com, as well as GE’s Facebook page and Twitter accounts, contain a significant amount of information about GE, including financial and other information for investors. GE encourages investors to visit these websites from time to time, as information is updated and new information is posted.
April 10, 2015
2
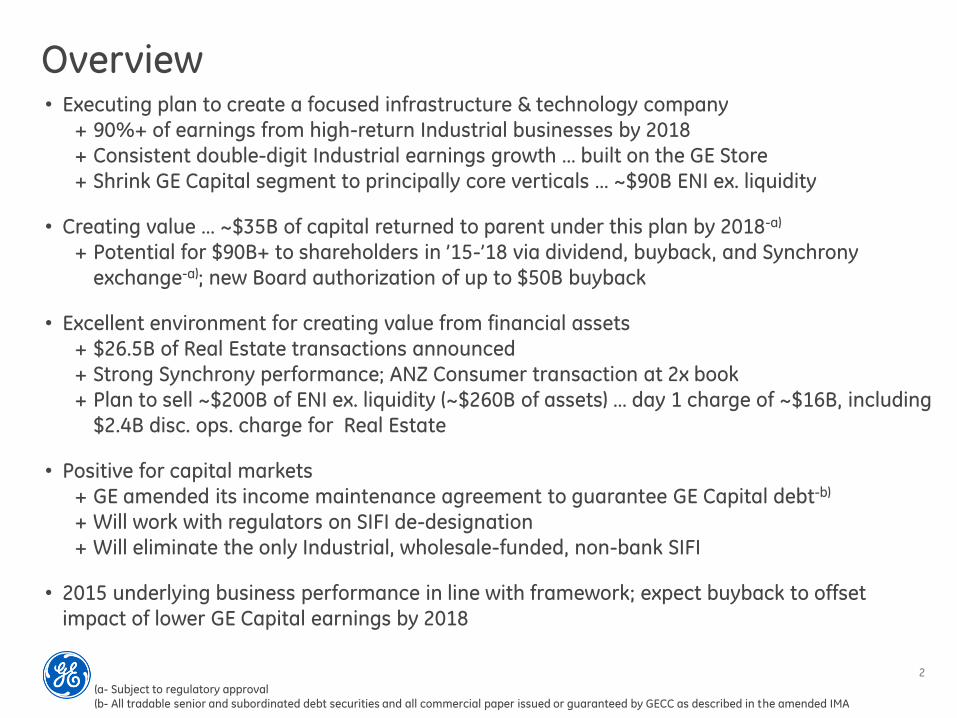
Overview • Executing plan to create a focused infrastructure & technology company
+ 90%+ of earnings from high-return Industrial businesses by 2018
+ Consistent double-digit Industrial earnings growth … built on the GE Store
+ Shrink GE Capital segment to principally core verticals … ~$90B ENI ex. liquidity
• Creating value … ~$35B of capital returned to parent under this plan by 2018-a)
+ Potential for $90B+ to shareholders in ’15-’18 via dividend, buyback, and Synchrony
exchange-a); new Board authorization of up to $50B buyback
• Excellent environment for creating value from financial assets
+ $26.5B of Real Estate transactions announced
+ Strong Synchrony performance; ANZ Consumer transaction at 2x book
+ Plan to sell ~$200B of ENI ex. liquidity (~$260B of assets) … day 1 charge of ~$16B, including
$2.4B disc. ops. charge for Real Estate
• Positive for capital markets
+ GE amended its income maintenance agreement to guarantee GE Capital debt-b)
+ Will work with regulators on SIFI de-designation + Will eliminate the only Industrial, wholesale-funded, non-bank SIFI
• 2015 underlying business performance in line with framework; expect buyback to offset
impact of lower GE Capital earnings by 2018
(a- Subject to regulatory approval (b- All tradable senior and subordinated debt securities and all commercial paper issued or guaranteed by GECC as described in the amended IMA

3
Executing the “pivot” (% of operating earnings)
This plan Prior plan
~25%
~75% 90%+
<10%
2014
58% 42%
Source of advantage
Built on the GE Store
Technology
Global scale
Services
Lean structure
Financing insight
Invest in innovation, common technology
Data & analytics; material & repair
Local capability, risk management
Low-cost structure, shared services, culture
Verticals aligned to drive growth
2007
57%
Capital
43%
Industrial

4
Portfolio actions generated ~$4B gains
RE Equity & Mortgage exposure 60%+
Non-strategic ENI $93B
Increased financial strength
Building risk & regulatory capabilities
Wholesale funding disadvantage
4Q’08 4Q’14
Commercial paper $72 $25
Liquidity $37 $76
Tier 1 common (B1) 5% 13%
Adj. Leverage 9:1 3:1
Changing environment … impacts ability to generate returns > WACC
GE Capital … actions since the crisis ($ in billions)
4Q’08-a)
ENI (ex. liquidity)
4Q’14
(a- As originally reported including discontinued operations
$538
$363
$175B reduction
ROE 13.1% 8.6%

5
Why now …
4. Business model for large, wholesale-funded Finco has changed dramatically; more difficult to generate acceptable returns
1
2. More clarity on SIFI de-designation process 4
5. Strong seller’s market for financial assets, with good GE track record of execution and value realization
3
5. Efficient approach for exiting non-vertical assets that works for GE and GE Capital debtholders and GE shareholders, including guaranteeing GE Capital debt-a)
5
(a- All tradable senior and subordinated debt securities and all commercial paper issued or guaranteed by GECC as described in the amended IMA
2. Synchrony and other dispositions are proof points that GE Capital platforms are more valuable elsewhere
2

6
GE Capital portfolio strategy
Other Consumer
$37
CLL/HQ
~$130
~$275
Real Estate $35
Prior plans ~$75 Synchrony, ANZ, others
Exit
Execution
Stabilizing capital markets
GE guarantees GE Capital debt securities-a)
GE-GECC merger; new intermediate
holding company for financial businesses
No incremental LT debt issuance expected for at least 5 years; CP ~$5B by YE’15
Working with regulators
Maintain safe & sound operations …
surplus capital & liquidity
SIFI de-designation over time
Consolidated EU regulator for non-U.S. operations
Accelerating asset sales under this plan
Synchrony on track … others underway
Speed & certainty
Targeting execution of majority of dispositions by end of 2016
($ in billions)
GECAS
EFS Healthcare
Other
Retain
~$85
4Q14 ENI (ex. liquidity)
1
2
3
underway
announced
(a- All tradable senior and subordinated debt securities and all commercial paper issued or guaranteed by GECC as described in the amended IMA

7
Dispositions: track record
~$200B in dispositions for net gains (including Synchrony)
$100+
~$4
ENI Net gain
Strong execution … 40+ deals
Optimized value by
structuring exits through IPO,
business and asset sales
Executed on some of the
toughest assets
$2-3-a)
Gain
Successful IPO in July ’14 …
stock price +30% since IPO
Separation on track …
targeting YE’15-b)
~700-800MM share buyback
at current price
Synchrony 2009-2014
(a- Synchrony gain will be in discontinued operations (b- Synchrony separation subject to regulatory approval (c- Excludes goodwill, CTA, tax, transaction costs and $3B remaining debt assets
~$65
ENI
($ in billions)
Real Estate
~$26 ~$26
ENI-c) Sale price
$22.5B agreement with
Blackstone/Wells Fargo; seller
financing, syndicate by mid '16
~$4B LOIs completed
$3B remaining debt assets
sold by year end
$2.4B day 1 charge in disc. ops.
Capital generated
~$5B

8
Asset disposition plan
High-quality platforms
37
31
74
16
9
35
Int’l Consumer
Real Estate
Global Fleet
Sponsor
US CLL
Int’l CLL
~$200B
CLL
+ Financing & integrated management services
+ Long-term relationships with 300+ PE sponsors + Lead & syndicate $30MM-500MM+ loan facilities
+ Specialty finance company with deep domain from origination … equipment finance, inventory finance, franchise
finance, corporate lending + Over 1,450 direct originators, spread of risk through 260K+
customers and dealers
+ Strong mid-market expertise, leading factoring platform
+ 1,000+ direct originators
+ Banks well-positioned in markets
Multiple asset sales to maximize value … ~$165B to go
(4Q14 ENI ex. liquidity)
+ $26.5B of transactions announced, working to exit remaining $3B debt assets by YE, 1Q reductions/other $6B

9
ENI Net Income ROTE%
GE Capital segment going forward
Execution plan in place … strong market for assets GE Capital businesses directly aligned to GE Industrial growth
2014 2015E 2016F 2017F 2018F
$363
~$275
~$140
~$90
(a- Net Income and ROTE excluding excess debt costs
ENI (ex. liquidity)
~$90
~$90
Future GE Capital segment -a)
Liquidity ~$20
Tangible equity ~$14
~$1.5 ~11%
Key metrics
• Assumes Synchrony exit 1/1/16
ex. liquidity
~13% ex. insurance
($ in billions)

10
GE Capital segment going forward – core verticals
Unique capabilities that support Industrial businesses
Aviation Services
Energy Financial Services
Healthcare Equipment Finance
ENI ~$41 ENI ~$14 ENI ~$3
#1 global aircraft lessor
~1,600 AC owned & serviced … financing for +225 customers
+85% of fleet powered by GE or CFM engines; average fleet age ~7 years
Deep expertise … 40+ years in industry
Provide financing solutions to energy industry … ~250 power and water projects
Similar Power & Water footprint … strong project expertise in renewables and thermal generation
Domain expertise… 30+ years across all sectors
Provide financing for over 3,000 GE Healthcare customers
45%+ of equipment financing is for GE Healthcare customers
25 years partnering with GE Healthcare
Net income ~$1 Net income ~$0.4 Net income ~$0.1
(2018F, $ in billions)

11
Safe & secure funding profile
Significantly smaller funding footprint
($ in billions)
• GE provides guarantee on
~$210B of GE Capital debt
securities-a); amended IMA
• Safe and secure; maintain 24-
month liquidity coverage
• No incremental LT debt issuance
expected for at least 5 years
• CP down to ~$5B by YE’15
• Securitization and deposits exit
with dispositions
• Limited ratings impact … S&P no
change; Moody’s GE 1 notch, no change to GE Capital issuer
rating – still one of the highest
rated Industrial companies
'14 '15E '16F '17F '18F '19F
$300
$180
$90
$350
Liquidity-b) ~$100 ~$80 ~$20
Dynamics
$120
~$60 ~$30
$100
$76
GE Capital debt funding profile
Net debt ~$200 ~$100 ~$70 ~$60 ~$70 $274
24-month coverage
~145% ~145% ~110% ~210% ~160% 103%
(a- All tradable senior and subordinated debt securities and all commercial paper issued or guaranteed by GECC as described in the amended IMA (b- Liquidity excluding bank lines
SYF $62
SYF ~$65

12
Exit costs
Day 1 charge 1Q
~$(14) 1Q continuing impact
~$(23) Total exit impact
~$(16) 1Q total impact
($ in billions, after tax)
Tax ~(6) Repatriating ~$36 cash
Businesses moved to HFS ~$(3) $2 GOS offset by $(5) GW allocation
Impairments (shortened hold periods) ~(5) EU mortgages, Asia JVs, CLL loans & leases
Discontinued ops (CRE) ~(2) Assets @ BV excluding goodwill, CTA, tax, transaction costs
Total cash cost ~$6B versus ~$23B total exit impact
Impact excludes Synchrony gain of $2-3B (discontinued ops)
Principally business disposals including goodwill & restructuring
Future exit costs ~(7)

13
GE Capital pro forma
~$(16)
Day 1 charge
~$(2)
“Sold” earnings
Verticals
Exits/HQ
Excess debt
Continuing income
Discontinued Ops.
Total income
~$6B
’15 framework
’15F
~$1.6
~(10)
~(0)
~$(8)
~(6)
~$(14)
’16F
~$1.4
~(1)
~(1)
~$(1)
~1
~$0
’18F
~$1.5
-
~(1)
<$1
-
<$1
Core income from retained verticals
Non-operating carry cost for excess debt
2015: CRE, CLL; 2016: Consumer offset by Synchrony gain
2Q-4Q HFS-a)
~$(2)
This plan
~$(14) (~$.60 EPS)
Exit charges in ‘15; HQ run-off ‘15-’17
($ in billions, after tax)
(a- Additional held-for-sale costs associated with 2Q-4Q business dispositions
14
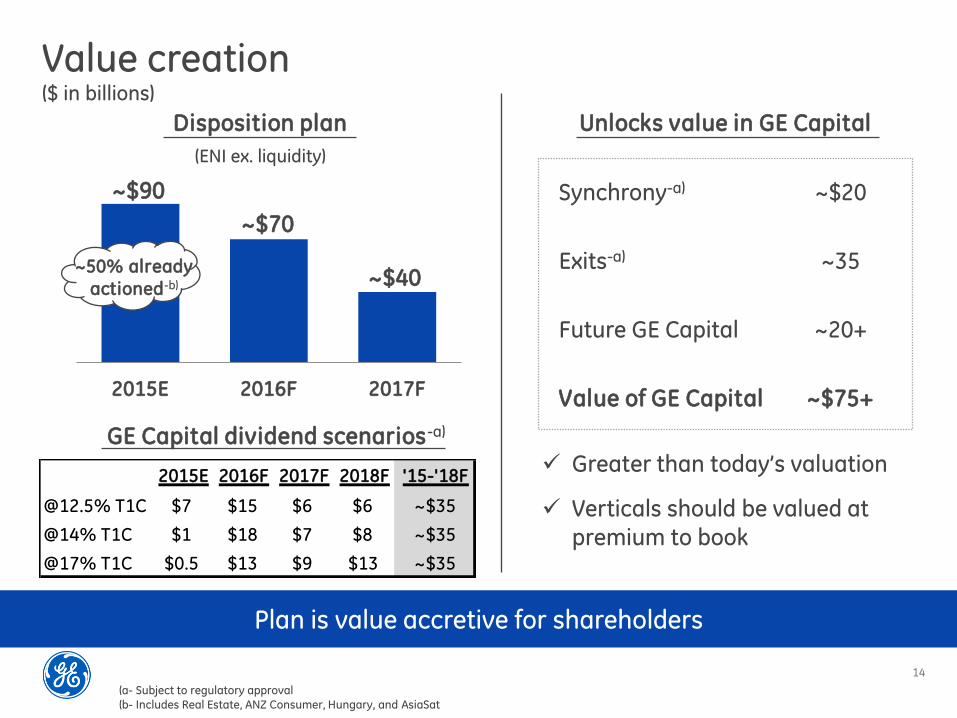
2015E 2016F 2017F
Unlocks value in GE Capital
Value creation
Plan is value accretive for shareholders
Disposition plan
($ in billions)
GE Capital dividend scenarios-a)
(a- Subject to regulatory approval (b- Includes Real Estate, ANZ Consumer, Hungary, and AsiaSat
~$90
~$70
~$40
(ENI ex. liquidity)
Greater than today’s valuation
Verticals should be valued at premium to book
Synchrony-a)
Exits-a)
Future GE Capital
Value of GE Capital
~$20
~35
~20+
~$75+
2015E 2016F 2017F 2018F '15-'18F
@12.5% T1C $7 $15 $6 $6 ~$35
@14% T1C $1 $18 $7 $8 ~$35
@17% T1C $0.5 $13 $9 $13 ~$35
~50% already actioned-b)

15
Potential cash to investors
2015E-2018F
$90B+
Dividends ~$35
GE Capital exits
~$35-a)
Synchrony-a) ~$20
Dividend remains a priority … base plan to
maintain current GE dividend in 2016 … grow thereafter
1
Buyback of up to $35B+ … new Board authorization for up to $50B buyback-b)
3
Opportunistic on Industrial M&A … room for bolt-on acquisitions … focus on returns
5
Creating value for shareholders
Benefit plan dilution
Buyback &
share
exchange
(a- Subject to regulatory approval (b- Excludes Synchrony exchange
Synchrony exchange ~$20B 2
Share count ~8-8.5B (including Synchrony exchange)
4

16
Industrial operating EPS outlook
• Underlying growth
• Gross margins/productivity
• Alstom
• Buyback
• Improved returns
2015E Framework
2018F
$1.10-1.20
++
2015 in line with our framework

17
2015EFramework
Synchrony netof exchange
Smaller GECapital
Buybackimpact
CoreIndustrial
2018FOutlook
Pro forma GE financials GE Operating EPS
Industrial $1.10-1.20
$1.70-1.80
+ +/++
~$(.25) ~$.25 ~$(.07)
Strong Industrial double-digit growth through 2018
Lower GE Capital earnings offset by impact from buyback (primarily Industrial)
2018 ending outstanding share count ~8-8.5B
Earnings under this plan meet our original expectations by 2018 but at 90%+ Industrial … more valuable GE
Earnings ~$(.17)
Exchange ~$.10
~65%
90%+
GECC ~$.18
GECC $.60
Industrial

18
Summary
• Creating a more valuable GE … 90%+ of earnings from high-return Industrial businesses
Double-digit Industrial EPS growth
Every business uses the GE Store
• Potential to return $90B+ to shareholders from 2015-2018
Strong track record of executing business sales
Expect buyback to offset impact of lower GE Capital earnings by ’18
• Lower risk for shareholders and financial system
Will work with regulators on SIFI de-designation
Maintain safe & sound operations … surplus capital & liquidity
• Substantial value for investors going forward
