gdo analytical report -...
TRANSCRIPT

GDO Analytical Report
Global Drought Observatory: http://edo.jrc.ec.europa.eu/gdo 1
Drought in India – December 2018 JRC Global Drought Observatory (GDO) and ERCC Analytical Team
12/12/2018
Table of Contents Executive summary ......................................................................................................................... 1
Risk of drought impact for agriculture (RDrI-Agri).......................................................................... 1
Precipitation .................................................................................................................................... 3
Standardized Precipitation Index (SPI) ........................................................................................... 5
SPI Outlook ................................................................................................................................ 11
fAPAR anomaly .............................................................................................................................. 11
Soil moisture anomaly .................................................................................................................. 12
Reported impacts .......................................................................................................................... 13
Information sources ...................................................................................................................... 15
Executive summary • Due to the underperforming last monsoon season, peninsular and North-east India are
facing a mild to severe drought, depending on the location.
• Cumulated precipitation deficits are severe and expose already strained Indian water resources. Several Indian states declared drought, with both agriculture and water supply being affected. Rural communities are in turmoil and ask for more support from authorities.
• The precipitation outlook is within average, but given the high rainfall seasonality in the centre and south of the country, little rainfall is expected for the next few months in most of the drought-affected areas, which are now entering the dry season.
Risk of drought impact for agriculture (RDrI-Agri) The indicator RDrI-Agri shows the risk of having impacts from a drought, by taking into account the exposure and socio-economic vulnerability of the area, with particular focus on the agricultural impacts. Formerly known as Likelihood of Drought Impact (LDI), it differs from the latter in that soil moisture anomaly is included and updated every ten days (dekad).
Figure 1 shows the current situation, where the states of Maharashtra, Andhra Pradesh, Chhattisgarh and Karnataka are wholly or for the most under dry conditions and exposed to potential impacts. Beyond peninsular India, the northeastern regions are affected. The risk increased rapidly from October onwards (Figure 2), when the fading monsoon season left widespread rainfall deficits and little chance of further precipitation. Note that the pattern shown in the two charts of Figure 2 is similar for the other states affected.

GDO Analytical Report
Global Drought Observatory: http://edo.jrc.ec.europa.eu/gdo 2
Drought in India – December 2018 JRC Global Drought Observatory (GDO) and ERCC Analytical Team
12/12/2018
Figure 1: Risk of drought impact for agriculture (RDrI-Agri) over India, from 21st until 30th November 2018.
Figure 2: Risk of drought impact (RDrI-Agri) since January 2018 in the Indian states of Maharashtra (upper chart) and Andhra Pradesh (lower chart).

GDO Analytical Report
Global Drought Observatory: http://edo.jrc.ec.europa.eu/gdo 3
Drought in India – December 2018 JRC Global Drought Observatory (GDO) and ERCC Analytical Team
12/12/2018
In terms of population exposed, the drought affects an area with over 100 million people, out of which six million in the highest risk class (Table 1).
Table 1: Population potentially exposed to risk of drought impact for agriculture (RDrI-Agri), by selected states and class of risk, for the period of 21st until 30th November 2018.
Risk Class Karnataka (% of state)
Chhattisgarh (% of state)
Andhra Pradesh (% of state)
Maharashtra (% of state)
Totals (% of India)
Low, 1 12,953,675 (23.7%) -
260,761 (4.4%)
12,966,968 (24.2%)
26,181,404 (2.0%)
Medium, 2 26,016,664 (47.6%)
19,297,700 (86.0%)
4,812,217 (81.2%)
36,489,691 (68.1%)
86,616,272 (6.5%)
High, 3 2,350,245
(4.3%) -
717,091 (12.1%)
3,054,203 (5.7%)
6,121,539 (0.45%)
In affected areas: 41,320,584 (75.6%)
19,297,700 (86.0%)
5,790,069 (97.7%)
52,510,862 (98.0%)
118,919,215 (8.9%)
Whole state: 54,656,857 22,439,186 5,926,376 53,582,512 136,604,931 (10.3%)
Precipitation Precipitation includes total monthly values of both rainfall and snow (Figure 3). Underperforming monsoon precipitation is at the roots of the ongoing drought, standing well below average, despite slightly different seasonal patterns in different regions (Figure 3). This situation led to a cumulated deficit that is going to burden the incoming crop season. According to long-term average conditions, it will probably last at least until March or April.
Figure 4 shows the cumulated deficit over a time span of two years in Karnataka. Precipitation in 2017 was not everywhere as poor as in the case of Karnataka, sometimes even very abundant. However, elsewhere very dry conditions in 2018 led to comparable absolute deficits of over 300 mm. Relative to the yearly averages, this translates into 55% to 80% of expected precipitation for central and southern India. In the northeast (e.g. Bihar), the annual total dropped even below 50% of the long-term average.

GDO Analytical Report
Global Drought Observatory: http://edo.jrc.ec.europa.eu/gdo 4
Drought in India – December 2018 JRC Global Drought Observatory (GDO) and ERCC Analytical Team
12/12/2018
Maharashtra (Kopargaon, 19.9 N, 74.6 E)
Andhra Pradesh (Madanapalle, 13.6 N, 78.4 E)
Bihar (Ara, 25.6 N, 84.7 E)
Figure 3: Monthly total precipitation near three selected locations with slightly different annual precipitation patterns, compared against the long-term monthly averages (1981-2010).

GDO Analytical Report
Global Drought Observatory: http://edo.jrc.ec.europa.eu/gdo 5
Drought in India – December 2018 JRC Global Drought Observatory (GDO) and ERCC Analytical Team
12/12/2018
Figure 4: Cumulative precipitation over a period of 24 months near Ron (Karnataka, India, coordinates: 15.6 N, 75.8 E). The bar colors indicate the cumulative deficit (red gradient) or surplus (blue gradient), compared to the cumulated monthly long-term average (solid line), for the same time span and location. The stacked boxes over the columns are the monthly totals.
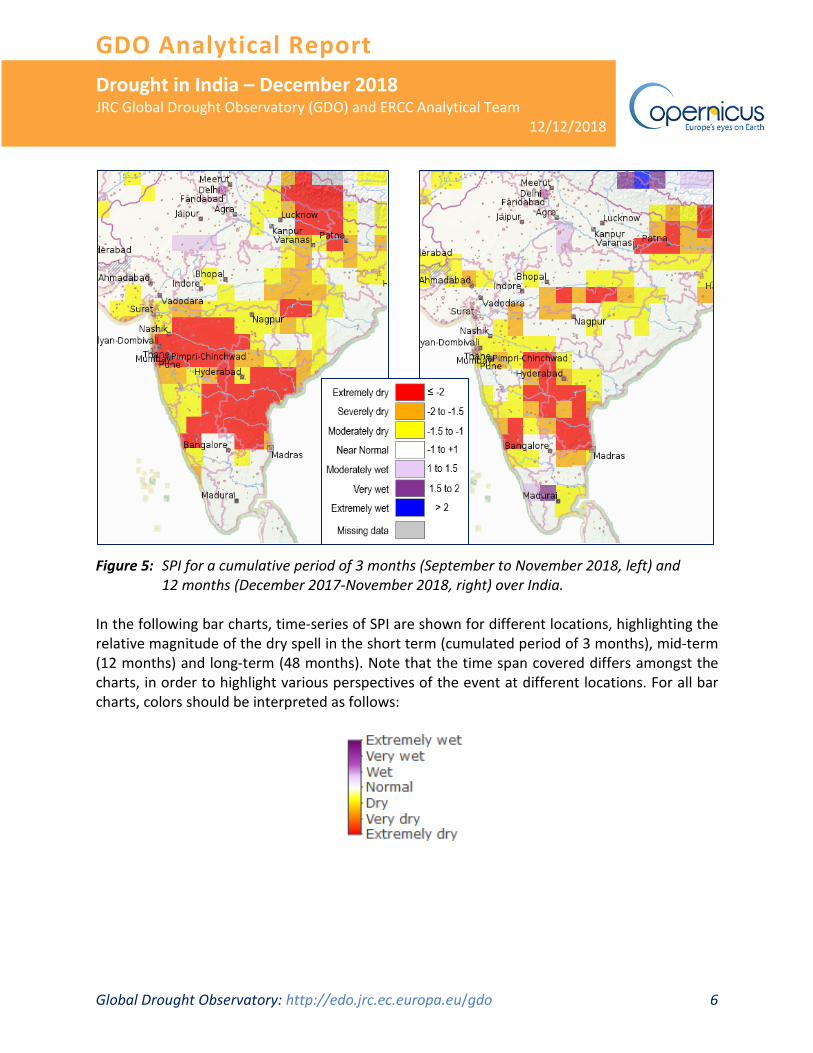
Standardized Precipitation Index (SPI) The SPI indicator is used to monitor the occurrence of meteorological drought. The lower (i.e. more negative) the SPI, the more intense is the drought. Note which accumulation period is shown (3 and 12 months, Figure 5). As suggested in the previous sections, the poor precipitation during the last rainy season led to widespread precipitation deficits, highlighted in particular by the SPI-3, covering the period September to November 2018.
GDO Analytical Report
Global Drought Observatory: http://edo.jrc.ec.europa.eu/gdo 6
Drought in India – December 2018 JRC Global Drought Observatory (GDO) and ERCC Analytical Team
12/12/2018
Figure 5: SPI for a cumulative period of 3 months (September to November 2018, left) and 12 months (December 2017-November 2018, right) over India.
In the following bar charts, time-series of SPI are shown for different locations, highlighting the relative magnitude of the dry spell in the short term (cumulated period of 3 months), mid-term (12 months) and long-term (48 months). Note that the time span covered differs amongst the charts, in order to highlight various perspectives of the event at different locations. For all bar charts, colors should be interpreted as follows:

GDO Analytical Report
Global Drought Observatory: http://edo.jrc.ec.europa.eu/gdo 7
Drought in India – December 2018 JRC Global Drought Observatory (GDO) and ERCC Analytical Team
12/12/2018
In Maharashtra (Figure 6), during November 2018 both SPI-3 and SPI-12 reach the lowest values of the past 15 years. This is without doubt to attribute to the strong dry spell of the last quarter, as discussed previously. Indeed, the SPI-48 does not reveal any cumulated deficit over the long-term.
Figure 6: SPI for a cumulative period of 3, 12 and 48 months near Kopargaon (Maharashtra). Note the different time scales on the horizontal axis.

GDO Analytical Report
Global Drought Observatory: http://edo.jrc.ec.europa.eu/gdo 8
Drought in India – December 2018 JRC Global Drought Observatory (GDO) and ERCC Analytical Team
12/12/2018
In Andhra Pradesh, the situation is quite similar on a multi-annual comparison (Figure 7), although there are variations between different locations inside the state. However, the long-term SPI shows the strongest drop and lowest value of the last 30 years (Figure 7, SPI-48). A growing multi-annual deficit indicates an enduring period of either frequent droughts or more severe events, or both. Regardless the specific precipitation time-series, under such conditions viable water resources become highly exposed to long-term depletion, especially in the case of India where they are already strained by sustained abstraction.
Figure 7: SPI for a cumulative period of 3, 12 and 48 months near Nagarkurnool (Andhra Pradesh). Note the different time scales on the horizontal axis.

GDO Analytical Report
Global Drought Observatory: http://edo.jrc.ec.europa.eu/gdo 9
Drought in India – December 2018 JRC Global Drought Observatory (GDO) and ERCC Analytical Team
12/12/2018
In Chhattisgarh state, the SPI-12 values are not as low as they were between 2009 and 2011 (Figure 8). However, the indicator is the lowest since then, and, given the already low soil moisture levels (see section below), the short term SPI-3 is low enough to cause concern to the agricultural sector. Looking at the long-term, the SPI-48 does not signal a strong rainfall deficit, although it went from positive to negative in the course of 2018.
Figure 8: SPI for a cumulative period of 3 and 12 months near Surajpur (Chhattisgarh). Note the different time scales on the horizontal axis.

GDO Analytical Report
Global Drought Observatory: http://edo.jrc.ec.europa.eu/gdo 10
Drought in India – December 2018 JRC Global Drought Observatory (GDO) and ERCC Analytical Team
12/12/2018
Looking at the situation in Bihar, the long-term SPI is extremely low (Figure 9, SPI-48), suggesting a persistent multi-annual cycle of much lower than normal precipitation, the worst on record since 1970, according to GPCC data sources. In fact, most months in 2017 and 2018 show negative values for the 3-months anomalies (Figure 9, SPI-3). Similarly to SPI-48, SPI-12 slipped progressively to the lowest values on record since 1970, below the previous minimum of 2009-2010.
Figure 9: SPI for a cumulative period of 3, 12 and 48 months near Ara (Bihar). Note the different time scales on the horizontal axis.

GDO Analytical Report
Global Drought Observatory: http://edo.jrc.ec.europa.eu/gdo 11
Drought in India – December 2018 JRC Global Drought Observatory (GDO) and ERCC Analytical Team
12/12/2018
SPI outlook The SPI outlook at 3 months projects normal precipitation for most of India, and above normal in small areas in the northeast, with similar outlooks for the SPI-6 projections. Both the one month and 6-months outlooks present a similar picture across the centre and south of India, suggesting that rainfall should follow the monthly averages all along the time window considered. However, it is important to note that December to March is usually the driest period of the year in peninsular India, therefore a neutral or even positive SPI is not particularly meaningful for drought recovery. Therefore, the cumulated rainfall deficits will not see any improvement before the next monsoon.
fAPAR anomaly
Figure 10: fAPAR anomaly in India, for three selected ten-day intervals (all 2018). Upper left: 1st to 10th October; upper right: 21st to 31st October; bottom left: 21st to 30th November.
GDO Analytical Report
Global Drought Observatory: http://edo.jrc.ec.europa.eu/gdo 12
Drought in India – December 2018 JRC Global Drought Observatory (GDO) and ERCC Analytical Team
12/12/2018
The fraction of Absorbed Photosynthetically Active Radiation (fAPAR) represents the fraction of the solar energy absorbed by leaves. fAPAR anomalies, specifically the negative deviations from the long term average over the same period, are a good indicator of drought impacts on vegetation.
While fAPAR anomalies started from vastly positive conditions in September, the anomaly indicator highlights a clear deterioration, with values falling from consistent positive to a patchy pattern of negative anomalies (Figure 10). This signals a rapid and unmitigated increase of vegetation stress, including crops.
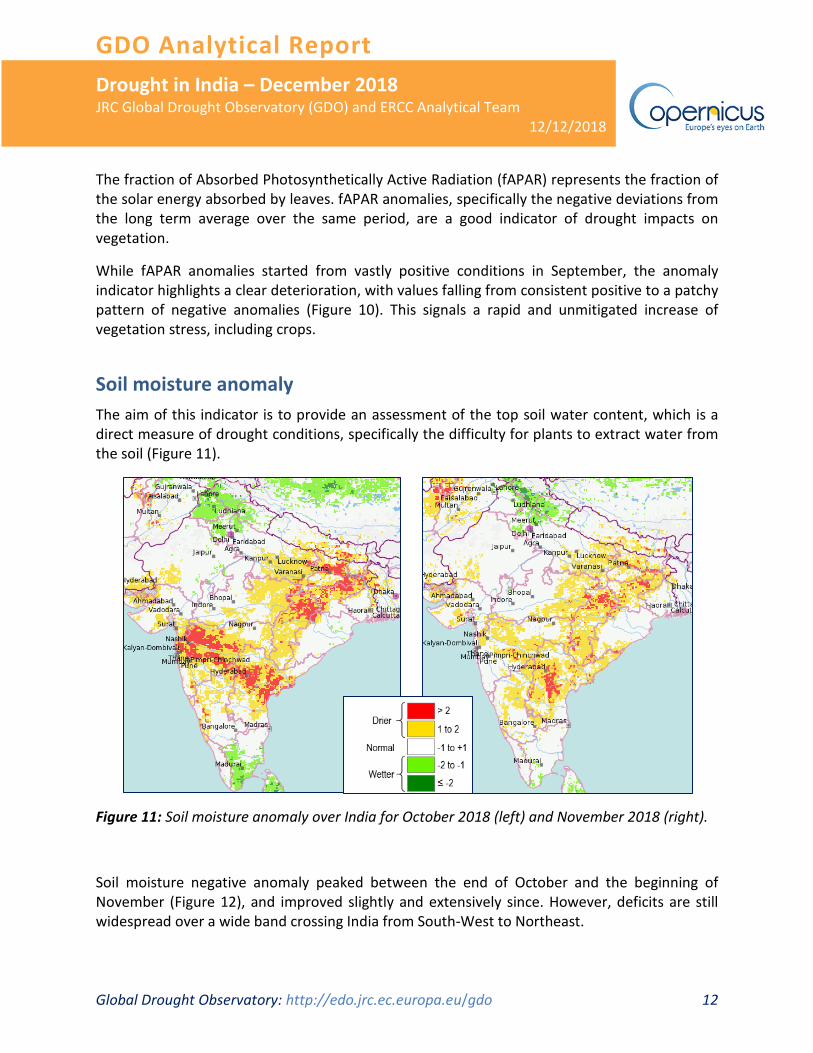
Soil moisture anomaly The aim of this indicator is to provide an assessment of the top soil water content, which is a direct measure of drought conditions, specifically the difficulty for plants to extract water from the soil (Figure 11).
Figure 11: Soil moisture anomaly over India for October 2018 (left) and November 2018 (right).
Soil moisture negative anomaly peaked between the end of October and the beginning of November (Figure 12), and improved slightly and extensively since. However, deficits are still widespread over a wide band crossing India from South-West to Northeast.

GDO Analytical Report
Global Drought Observatory: http://edo.jrc.ec.europa.eu/gdo 13
Drought in India – December 2018 JRC Global Drought Observatory (GDO) and ERCC Analytical Team
12/12/2018
Andhra Pradesh
Maharashtra
Chhattisgarh
Figure 12: Soil moisture anomaly, evolution over time in three administrative units in Central and Southern India.
Reported impacts1 The patchy monsoon has led to reduced crop yields and higher prices for staple crops2.
In Karnataka, especially in the North, migrations, mass sales of livestock and serious drinking water issues were reported3. After a survey, the State government has predicted a drop in food production by one third, in addition to real concerns for drinking water resources4.
All links accessed on 12/12/2018 2 https://punemirror.indiatimes.com/pune/civic/bhakri-and-daal-to-soon-cost-more-due-to-
drought/articleshow/67031426.cms 3 https://timesofindia.indiatimes.com/city/bengaluru/migration-sale-of-cattle-start-in-drought-hit-north-
karnataka/articleshow/67019210.cms 4 https://timesofindia.indiatimes.com/city/bengaluru/monsoons-fail-33-dip-in-food-production-
likely/articleshow/67019147.cms

GDO Analytical Report
Global Drought Observatory: http://edo.jrc.ec.europa.eu/gdo 14
Drought in India – December 2018 JRC Global Drought Observatory (GDO) and ERCC Analytical Team
12/12/2018
In Maharashtra, the majority of farmers were affected5 and displacement of people was ascribed to the drought6, as well as suicides7. In addition, cotton yield is forecasted to drop to a three year low8. Rising tensions over water among rural communities were reported9.
The Bihar Government declared drought in several districts and assessed relevant losses in paddy production, granting emergency subsidies to farmers10 11. So did other state authorities elsewhere, with ongoing surveys and side initiatives12 13 14. However, there are claims of drought not addressed by the government due to the strict guidelines on official drought declaration15.
In general, drought is a primary cause of suicides amongst farmers in India, as loans taken out for farming push them deeper into debt in case of low yields16. Droughts are worsened by widespread water scarcity issues and effective action is demanded by rural communities to support households and farmers, whose issues trigger recurrent protests17 18 19.
5 https://www.hindustantimes.com/mumbai-news/over-60-maharashtra-farmers-hit-by-drought-state-asks-centre-for-assistance/story-xNgr4cSaZVNg2mhaXExhcJ.html
6 https://indianexpress.com/article/india/parched-villages-begin-to-empty-out-in-drought-hit-maharashtra-5456398/
7 https://www.latestly.com/india/news/maharashtra-farmer-suicides-235-farmers-ended-lives-in-september-relief-rehab-minister-asks-for-food-and-health-security-504019.html
8 https://www.business-standard.com/article/economy-policy/cotton-yield-in-india-to-hit-three-year-low-on-massive-crop-damage-118120100489_1.html
9 https://indianexpress.com/article/india/east-and-west-maharashtra-districts-fight-water-wars-drought-5458259/ 10 https://www.outlookhindi.com/agriculture/rural-economy/bihar-drought-affected-farmers-can-apply-till-
november-25-for-assistance-32559 11 https://www.hindustantimes.com/patna/206-blocks-in-23-bihar-districts-declared-drought-affected/story-
F43mMtOgkLS3BngsbIA2SN.html 12 https://www.downtoearth.org.in/news/agriculture/farmers-suffer-as-states-yet-to-declare-drought-62079 13 https://www.business-standard.com/article/current-affairs/centre-assessing-drought-in-andhra-maharashtra-4-
other-states-agrimin-118121000411_1.html 14 https://indianexpress.com/article/india/maharashtra-82-lakh-farmers-hit-by-drought-says-cm-devendra-
fadnavis-5471720/ 15 https://www.newsclick.in/severe-droughts-go-unreported 16 Parida, Y., Dash, D. P., Bhardwaj, P., & Chowdhury, J. R. (2018). Effects of Drought and Flood on Farmer Suicides
in Indian States: An Empirical Analysis. Economics of Disasters and Climate Change, 1-22. 17 https://www.aljazeera.com/indepth/features/backdrop-suicides-debt-farmers-demand-action-
181129001928502.html 18 https://www.firstpost.com/long-reads/after-the-march-farmers-on-their-way-home-from-delhi-speak-of-anger-
hope-and-bleak-futures-5657561.html 19 https://www.theweek.in/news/india/2018/12/10/karnataka-farmers-protests-mark-first-day-of-winter-
session.html
GDO Analytical Report
Global Drought Observatory: http://edo.jrc.ec.europa.eu/gdo 15
Drought in India – December 2018 JRC Global Drought Observatory (GDO) and ERCC Analytical Team
12/12/2018
Information sources Global Drought Observatory (GDO) - Joint Research Centre of European Commission
Additional information extracted from National Authority Sources and Media News
Distribution: for ERCC and related partners use. Authors: D. Masantei, J. Vogtii, P. Barbosaii, D. Magniii, C. Arias Muñoziii
Disclaimer and Legal Notice: this report by the Joint Research Centre (JRC) is a product under constant development and may change at any time without notice. It was generated using Copernicus Emergency Management Service information (2018). The views expressed may not be regarded as an official position of the European Commission (EC) in any circumstances. National borders are purely a graphical representation, only intended to be indicative, and do not reflect the official position of the EC. Neither the EC nor any person acting on behalf of the Commission are responsible for the use that might be made of this report.
i External consultant for the European Commission (Arcadia SIT, 27029 Vigevano, Italy) ii European Commission, Joint Research Centre, Ispra (VA), Italy iii External consultant for the European Commission (Arhs Developments, 20121 Milano, Italy)