gcse mathematics route map – higher tier assessment order unit 2 – march year 10 unit 1 – june...
TRANSCRIPT

GCSE Mathematics Route Map – Higher Tier
Assessment Order Unit 2 – March Year 10Unit 1 – June Year 10Unit 3 – June Year 11 Notes – A lot of Unit 2 time has been given to the core number topics that will also be required for Unit 1. These should be covered in depth at this early stage, with both calculator and non-calculator approaches taught The Unit 1 number requirements need to be understood and covered, in the main, within the main handling data topics. There is only a short re-cap week allocated to the core number skills within the unit 1 teachingTeaching of Unit 1 topics has to start before the Unit 2 exam in March. It is important to be clear on what will feature in the March exam and what will notThe two week block on the Handling Data cycle is an opportunity to pull together the elements of collecting, representing and analysing data by doing some ‘real’ statisticsUnits 1 and 2 are quite pressured with a lot to do, though much will be familiar from Key Stage 3. Unit 3 has more time and flexibility built in, so it should be possible to make revision time available for any re-sits of Units 1 or 2 in November of year 11. It may also be possible to complete Unit 3 in time for early entry in March from 2013.The topic titles are those used by the AQA All About Maths site and each unit tile is linked to a topic page so it is possible to see quickly the scope of assessment for the topic and any resources available. The title of the topic also acts as a link to the relevant page of All About Maths. Note that the topic tile for the core number skills in Unit 1 has four separate links.
TopicTopicTopicTopic TopicTopic
Unit 1 Unit 2 Unit 3

June Examinations
November Examinations
Algebraic Algebraic Manipulation and Manipulation and FormulaeFormulae
NumberNumber SequencesSequences Fractions, Decimals & Fractions, Decimals & PercentagesPercentages
Indices & Indices & Standard FormStandard Form
Coordinates and GraphsCoordinates and Graphs Ratio & Ratio & ProportionProportion
Year 10
AQA GCSE Mathematics (4360) Route Map – Higher Tier (Start September 2010)
Linear Equations & Linear Equations & Simultaneous EquationsSimultaneous Equations
Quadratic Quadratic EquationsEquations
SurdsSurds Collecting Collecting DataData
Statistical MeasuresStatistical Measures Inequalities Inequalities in 1 & 2 in 1 & 2 VariablesVariables
Algebraic ProofAlgebraic Proof REVISION Representing DataRepresenting DataScatter Scatter DiagramsDiagrams
Handling Data Cycle
ProbabilityProbability Revision
Properties of Angles Properties of Angles and Shapesand Shapes
Algebraic Algebraic Manipulation and Manipulation and FormulaeFormulae
Holiday Holiday
Holiday
Holiday
Holiday
Holiday
Holiday
3. Ratio & 3. Ratio & ProportionProportion
2. Percentages2. Percentages
1. Fractions 1. Fractions & Decimals& Decimals
Year 11
March Examinations
June Examinations
Handling Data Cycle
Revision

Equations and their Equations and their ApplicationsApplications
Year 11
AQA GCSE Mathematics (4360) Route Map – Higher Tier (Start September 2011)
Reflections, Rotations, Reflections, Rotations, Translations & Translations & Enlargements; Enlargements; Congruence & Congruence & SimilaritySimilarity
MeasuresMeasures
Coordinates & GraphsCoordinates & Graphs
Number, Number, Fractions, Fractions, Decimals, Decimals, Percentage, Percentage, Ratio & Ratio & ProportionProportion
Perimeter, Perimeter, Area and Area and VolumeVolume
Circle Theorems; Circle Theorems; Geometrical ProofGeometrical Proof
2D Representations 2D Representations of 3D Shapes; of 3D Shapes; Drawing & Drawing & Constructing Shapes; Constructing Shapes; LociLoci
Quadratic Graphs & other Quadratic Graphs & other Graphs Modelling Real Graphs Modelling Real Situations; Transformation of Situations; Transformation of FunctionsFunctions
VectorsVectorsTrigonometryTrigonometryPythagoras’ Pythagoras’ TheoremTheorem
Holiday
Holiday
Holiday
Holiday
Holiday
Holiday
Holiday
Year 10
Year 10
March Examinations
November Examinations
June Examinations
June Examinations
Trial & Trial & ImprovementImprovement
Perimeter, Perimeter, Area and Area and VolumeVolume
TrigonometryTrigonometry
REVISION REVISION
REVISION

Return to RoutemapReturn to Routemap
Candidates should be able to:Candidates should be able to: Teachers own notesTeachers own notes
recognise integers as positive or negative whole numbers,
including zero
work out the answer to a calculation given the answer to a related
calculation
2-digit SquareConsecutive Sums
Guesswork
multiply and divide integers, limited to 3-digit by 2-digit
calculations
multiply and divide decimals, limited to multiplying or dividing by
a single digit integer or a decimal number to 1 significant figure
interpret a remainder from a division problem
Largest Product
add, subtract, multiply and divide using commutative, associative
and distributive laws
understand and use inverse operations
use brackets and the hierarchy of operations
solve problems set in words; for example, formulae given in
words
understand reciprocal as multiplicative inverse
understand that any non-zero number multiplied by its reciprocal
is 1
know that zero has no reciprocal because division by zero is
undefined
ArithmagonsHow many miles to go?
Unit 2 – Number (Slide 1 of 3)

Return to RoutemapReturn to Routemap
Candidates should be able to:Candidates should be able to: Teachers own notesTeachers own notes
perform money calculations, writing answers using the correct
notation
round numbers to the nearest whole number, 10, 100, 1000 or
million
round to one, two or three decimal places
round to one significant figure
Cinema problem
round to a given number of significant figures or decimal places
round to a suitable degree of accuracy
write in ascending order positive or negative numbers given as
fractions, including improper fractions, decimals or integers
identify multiples, factors and prime numbers from lists of
numbers
write out lists of multiples and factors to identify common
multiples or common factors of two or more integers
write a number as the product of its prime factors and use formal
and informal methods for identifying highest common factors (HCF)
and lowest common multiples (LCM)
Fac-finding
Unit 2 – Number (Slide 2 of 3)

Return to RoutemapReturn to Routemap
Candidates should be able to:Candidates should be able to: Teachers own notesTeachers own notes
quote squares of numbers up to 15 x 15 and the cubes of 1, 2, 3,
4, 5 and 10, also knowing the corresponding roots
recognise the notation and know that when a square root is
asked for only the positive value will be required; candidates are
expected to know that a square root can be negative
solve equations such as , giving both the positive and
negative roots
Unit 2 – Number (Slide 3 of 3)

Return to RoutemapReturn to Routemap
Candidates should be able to:Candidates should be able to: Teachers own notesTeachers own notes
use notations and symbols correctly
understand that letter symbols represent definite unknown
numbers in equations, defined quantities or variables in formulae,
and in functions they define new expressions or quantities by
referring to known quantities
More Magic Potting Sheds
understand phrases such as ‘form an equation’, ‘use a formula’
and ‘write an expression’ when answering a question
Higher tier candidates should understand the identity symbol (see
examples in 5.5h).
understand that the transformation of algebraic expressions
obeys and generalises the rules of generalised arithmetic
manipulate an expression by collecting like terms
multiply a single term over a bracket
write expressions using squares and cubes
factorise algebraic expressions by taking out common factors
multiply two linear expressions such as and
at Higher tier
Unit 2 – Algebraic Manipulation and Formulae(Slide 1 of 2)

Return to RoutemapReturn to Routemap
Candidates should be able to:Candidates should be able to: Teachers own notesTeachers own notes
factorise quadratic expressions using the sum and product
method or by inspection (FOIL)
factorise quadratics of the form ax2 + bx + c
factorise expressions written as the difference of two squares,
cancel rational expressions by looking for common factors
apply the four rules to algebraic fractions, which may include
quadratics and the difference of two squares
use formulae from mathematics and other subjects expressed
initially in words and then using letters and symbols
substitute numbers into a formula
change the subject of a formula
Unit 2 – Algebraic Manipulation and Formulae (Slide 2 of 2)

Return to RoutemapReturn to Routemap
Candidates should be able to:Candidates should be able to: Teachers own notesTeachers own notes
generate common integer sequences, including sequences of odd
or even integers, squared integers, powers of 2, powers of 10 and
triangular numbers
generate simple sequences derived from diagrams and complete
a table of results describing the pattern shown by the diagrams
FibsSeven Squares
Squares in RectanglesTriangle Numbers
work out an expression in terms of n for the nth term of a linear
sequence by knowing that the common difference can be used to
generate a formula for the nth term
Interactive Number Patterns
Unit 2 – Sequences

Return to RoutemapReturn to Routemap
Candidates should be able to:Candidates should be able to: Teachers own notesTeachers own notes
identify equivalent fractions
write a fraction in its simplest form
convert between mixed numbers and improper fractions
compare fractions
add and subtract fractions by writing them with a common
denominator
be able to convert mixed numbers to improper fractions and add
and subtract mixed numbers
Harmonic Triangle
convert between fractions and decimals using place value
identify common recurring decimals
know how to write decimals using recurring decimal notation
interpret percentage as the operator ‘so many hundredths of’
use percentages in real-life situations
Unit 2 – Fractions, Decimals and Percentages (Slide 1 of 2)

Return to RoutemapReturn to Routemap
Candidates should be able to:Candidates should be able to: Teachers own notesTeachers own notes
know that fractions, decimals and percentages can be
interchanged
interpret a fraction, decimal or percentage as a multiplier when
solving problems
use fractions, decimals or percentages to compare proportions
convert between fractions, decimals and percentages to find the
most appropriate method of calculation in any given question
calculate a fraction of a quantity
calculate a percentage of a quantity
use decimals to find quantities
solve percentage increase and decrease problems
use, for example, 1.12 × Q to calculate a 12% increase in the value
of Q and 0.88 × Q to calculate a 12% decrease in the value of Q
work out one quantity as a fraction, decimal or percentage of
another quantity
use fractions, decimals or percentages to calculate proportions
use reverse percentages to calculate the original amount
The Legacy
Unit 2 – Fractions, Decimals and Percentages (Slide 2 of 2)

Return to RoutemapReturn to Routemap
Candidates should be able to:Candidates should be able to: Teachers own notesTeachers own notes
Unit 2 – Indices and Standard Form
Candidates should be able to:Candidates should be able to: Teachers own notesTeachers own notes
quote squares of numbers up to 15 x 15 and the cubes of 1, 2, 3,
4, 5 and 10, also knowing the corresponding roots
recognise the notation and know that when a square root is
asked for only the positive value will be required; candidates are
expected to know that a square root can be negative
solve equations such as , giving both the positive and
negative roots
understand the notation and be able to work out the value of
squares, cubes and powers of 10
use the index laws for multiplication and division of integer
powers
write an ordinary number in standard form
write a number written in standard form as an ordinary number
order numbers that may be written in standard form
simplify expressions written in standard form
solve simple equations where the numbers may be written in
standard form

Return to RoutemapReturn to Routemap
Candidates should be able to:Candidates should be able to: Teachers own notesTeachers own notes
Unit 2 – Coordinates & Graphs (Slide 1 of 3)
Candidates should be able to:Candidates should be able to: Teachers own notesTeachers own notes
plot points in all four quadrants
find coordinates of points identified by geometrical information,
for example the fourth vertex of a rectangle given the other three
vertices
find the coordinates of a midpoint, for example the midpoint of
the diagonal of a parallelogram, given the coordinates of the end
points of the diagonal
recognise that equations of the form y = mx + c correspond to
straight line graphs in the coordinate plane
plot graphs of functions in which y is given explicitly in terms of x
or implicitly
complete partially completed tables of values for straight line
graphs
calculate the gradient of a given straight line using the y-step
method

Return to RoutemapReturn to Routemap
Candidates should be able to:Candidates should be able to: Teachers own notesTeachers own notes
Unit 2 – Coordinates & Graphs (Slide 2 of 3)
Candidates should be able to:Candidates should be able to: Teachers own notesTeachers own notes
recognise that equations of the form y = 3x - 1 correspond to
straight line graphs in the coordinate plane
plot graphs of functions in which y is given explicitly in terms of x
or implicitly
complete partially completed tables of values for straight line
graphs
calculate the gradient of a given straight line using the y-step
method
manipulate the equations of straight lines so that it is possible to
tell whether lines are parallel or not
plot a graph representing a real-life problem from information
given in words or in a table or as a formula
identify the correct equation of a real-life graph from a drawing of
the graph
read from graphs representing real-life situations; for example,
the cost of a bill for so many units of gas or working out the number
of units for a given cost, and also understand that the intercept of
such a graph represents the fixed charge

Return to RoutemapReturn to Routemap
Candidates should be able to:Candidates should be able to: Teachers own notesTeachers own notes
Unit 2 – Coordinates & Graphs (Slide 3 of 3)
Candidates should be able to:Candidates should be able to: Teachers own notesTeachers own notes
draw linear graphs with or without a table of values
interpret linear graphs representing real-life situations; for
example, graphs representing financial situations (e.g. gas,
electricity, water, mobile phone bills, council tax) with or without
fixed charges, and also understand that the intercept represents the
fixed charge or deposit
plot and interpret distance-time graphs
Steady Free FallUp and Across

Return to RoutemapReturn to Routemap
Unit 2 – Ratio and Proportion
Candidates should be able to:Candidates should be able to: Teachers own notesTeachers own notes
understand the meaning of ratio notation
interpret a ratio as a fraction
simplify a ratio to its simplest form, a : b, where a and b are
integers
write a ratio in the form 1 : n or n : 1
interpret a ratio in a way that enables the correct proportion of an
amount to be calculated
use ratio and proportion to solve word problems
use direct proportion to solve problems
Cereal Mix

Return to RoutemapReturn to Routemap
Unit 2 – Linear Equations and Simultaneous Equations
Candidates should be able to:Candidates should be able to: Teachers own notesTeachers own notes
solve simple linear equations by using inverse operations or by
transforming both sides in the same way
solve simple linear equations with integer coefficients where the
unknown appears on one or both sides of the equation or where the
equation involves brackets
set up simple linear equations to solve problems
solve simultaneous linear equations by elimination or
substitution or any other valid method
solve simultaneous equations when one is linear and the other
quadratic, of the form
where a, b and c are integers

Return to RoutemapReturn to Routemap
Unit 2 – Quadratic Equations
Candidates should be able to:Candidates should be able to: Teachers own notesTeachers own notes
solve quadratic equations by factorising, completing the square
or using the quadratic formula
Return to RoutemapReturn to Routemap
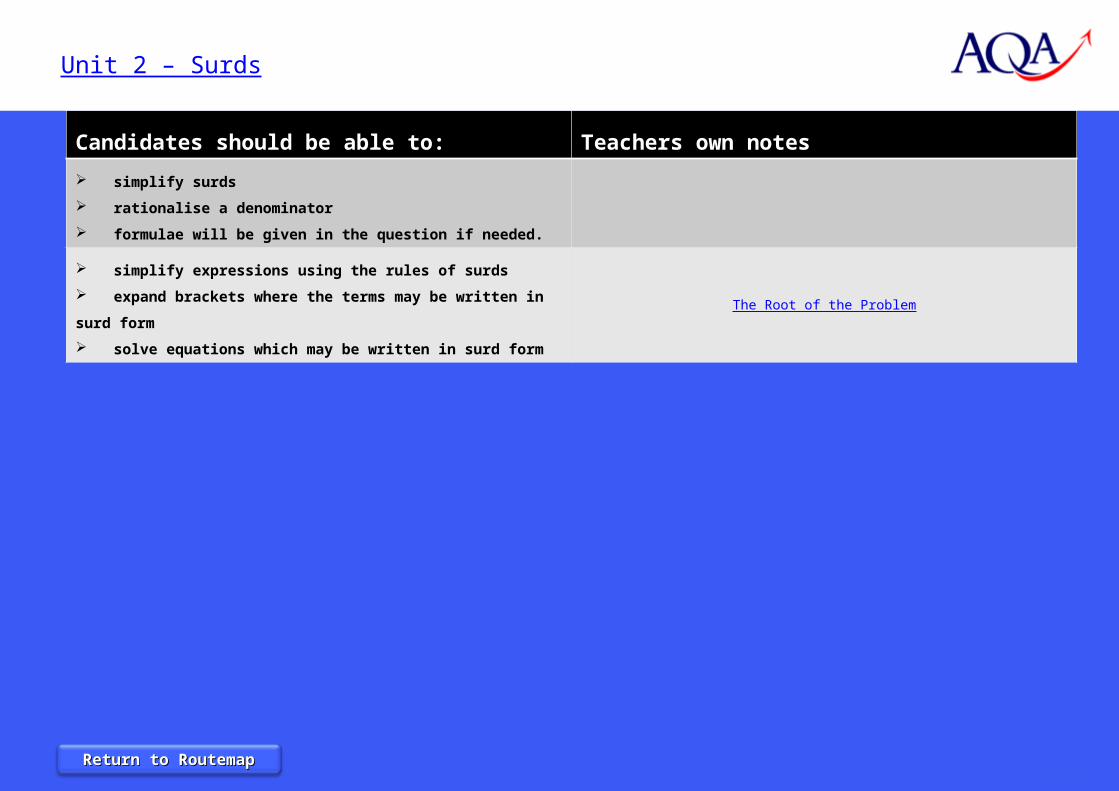
Unit 2 – Surds
Candidates should be able to:Candidates should be able to: Teachers own notesTeachers own notes
simplify surds
rationalise a denominator
formulae will be given in the question if needed.
simplify expressions using the rules of surds
expand brackets where the terms may be written in surd form
solve equations which may be written in surd form
The Root of the Problem

Return to RoutemapReturn to Routemap
Candidates should be able to:Candidates should be able to: Teachers own notesTeachers own notes
answer questions related to any of the bullet points above
know the meaning of the term ‘hypothesis’
write a hypothesis to investigate a given situation
discuss all aspects of the data handling cycle within one situation
include sampling as part of their understanding of the DHC
discuss their findings in depth with awareness of their
significance
decide whether data is qualitative, discrete or continuous and use
this decision to make sound judgements in choosing suitable
diagrams for the data
understand the difference between grouped and ungrouped data
understand the advantages of grouping data and the drawbacks
distinguish between data that is primary and secondary
understand how and why bias may arise in the collection of data
offer ways of minimising bias for a data collection method
write or criticise questions and response sections for a
questionnaire
suggest how a simple experiment may be carried out
have a basic understanding of how to collect survey data
Unit 1 – Collecting Data (Slide 1 of 3)

Return to RoutemapReturn to Routemap
Candidates should be able to:Candidates should be able to: Teachers own notesTeachers own notes
understand the data collection methods observation, controlled
experiment, questionnaire, survey and data logging
know where the different methods might be used and why a given
method may or may not be suitable in a given situation
design and use data collection sheets for different types of data
tabulate ungrouped data into a grouped data distribution
interrogate tables or lists of data, using some or all of it as
appropriate
design and use two-way tables
complete a two-way table from given information
draw any of the above charts or diagrams
understand which of the diagrams are appropriate for different
types of data
complete an ordered stem-and-leaf diagram
interpret any of the statistical graphs described in full in the topic
‘Data Presentation and Analysis’ specification reference S3.2h
Top Coach
Unit 1 – Collecting Data (Slide 2 of 3)

Return to RoutemapReturn to Routemap
Candidates should be able to:Candidates should be able to: Teachers own notesTeachers own notes
understand that the greater the number of trials in an experiment
the more reliable the results are likely to be
understand how a relative frequency diagram may show a settling
down as sample size increases, enabling an estimate of a probability
to be reliably made; and that if an estimate of a probability is
required, the relative frequency of the largest number of trials
available should be used
Unit 1 – Collecting Data (Slide 3 of 3)

Return to RoutemapReturn to Routemap
Candidates should be able to:Candidates should be able to: Teachers own notesTeachers own notes
draw any of the above charts or diagrams
understand which of the diagrams are appropriate for different
types of data
complete an ordered stem-and-leaf diagram
interpret any of the statistical graphs described in full in the topic
‘Data Presentation and Analysis’ specification reference S3.2h
compare two diagrams in order to make decisions about an
hypothesis
compare two distributions in order to make decisions about an
hypothesis by comparing the range, or the inter-quartile range if
available, and a suitable measure of average such as the mean or
median
find patterns in data that may lead to a conclusion being drawn
look for unusual data values such as a value that does not fit an
otherwise good correlation
Unit 1 – Statistical Measures (Slide 1 of 2)

Return to RoutemapReturn to Routemap
Candidates should be able to:Candidates should be able to: Teachers own notesTeachers own notes
use lists, tables or diagrams to find values for the above
measures
find the mean for a discrete frequency distribution
find the median for a discrete frequency distribution or stem-and-
leaf diagram
find the mode or modal class for frequency distributions
calculate an estimate of the mean for a grouped frequency
distribution, knowing why it is an estimate
find the interval containing the median for a grouped frequency
distribution
calculate quartiles and inter-quartile range from a small data set
using the positions of the lower quartile and upper quartile
respectively and calculate inter-quartile range
read off lower quartile, median and upper quartile from a
cumulative frequency diagram or a box plot
find an estimate of the median or other information from a
histogram
choose an appropriate measure according to the nature of the
data to be the ‘average’
Unit 1 – Statistical Measures (Slide 2 of 2)

Return to RoutemapReturn to Routemap
Unit 2 – Inequalities in 1 and 2 Variables
Candidates should be able to:Candidates should be able to: Teachers own notesTeachers own notes
know the difference between < < > >
solve simple linear inequalities in one variable
represent the solution set of an inequality on a number line,
knowing the correct conventions of an open circle for a strict
inequality and a closed circle for an included boundary
draw or identify regions on a 2-D coordinate grid, using the
conventions of a dashed line for a strict inequality and a solid line for
an included inequality

Return to RoutemapReturn to Routemap
Unit 2 – Algebraic Proof
Candidates should be able to:Candidates should be able to: Teachers own notesTeachers own notes
use algebraic expressions to support an argument or verify a
statement
construct rigorous proofs to validate a given result
Perfectly Square

Return to RoutemapReturn to Routemap
Candidates should be able to:Candidates should be able to: Teachers own notesTeachers own notes
draw any of the above charts or diagrams
understand which of the diagrams are appropriate for different
types of data
complete an ordered stem-and-leaf diagram
interpret any of the statistical graphs described in full in the topic
‘Data Presentation and Analysis’ specification reference S3.2h
interpret any of the types of diagram listed in S3.2h
obtain information from any of the types of diagram listed in
S3.2h
compare two diagrams in order to make decisions about an
hypothesis
compare two distributions in order to make decisions about an
hypothesis by comparing the range, or the inter-quartile range if
available, and a suitable measure of average such as the mean or
median
Unit 1 – Scatter Diagrams (Slide 1 of 2)

Return to RoutemapReturn to Routemap
Candidates should be able to:Candidates should be able to: Teachers own notesTeachers own notes
recognise and name positive, negative or no correlation as types
of correlation
recognise and name strong, moderate or weak correlation as
strengths of correlation
understand that just because a correlation exists, it does not
necessarily mean that causality is present
draw a line of best fit by eye for data with strong enough
correlation, or know that a line of best fit is not justified due to the
lack of correlation
use a line of best fit to estimate unknown values when appropriate
Unit 1 – Scatter Diagrams (Slide 2 of 2)

Return to RoutemapReturn to Routemap
Candidates should be able to:Candidates should be able to: Teachers own notesTeachers own notes
draw any of the above charts or diagrams
understand which of the diagrams are appropriate for different
types of data
complete an ordered stem-and-leaf diagram
interpret any of the statistical graphs described in full in the topic
‘Data Presentation and Analysis’ specification reference S3.2h
interpret any of the types of diagram listed in S3.2h
obtain information from any of the types of diagram listed in
S3.2h
compare two diagrams in order to make decisions about an
hypothesis
compare two distributions in order to make decisions about an
hypothesis by comparing the range, or the inter-quartile range if
available, and a suitable measure of average such as the mean or
median
Unit 1 – Representing Data

Return to RoutemapReturn to Routemap
Candidates should be able to:Candidates should be able to: Teachers own notesTeachers own notes
use words to indicate the chances of an outcome for an event
use fractions, decimals or percentages to put values to
probabilities
place probabilities or outcomes to events on a probability scale
work out probabilities by counting or listing equally likely
outcomes
estimate probabilities by considering relative frequency
place probabilities or outcomes to events on a probability scale
list all the outcomes for a single event in a systematic way
list all the outcomes for two events in a systematic way
use two-way tables to list outcomes
use lists or tables to find probabilities
understand when outcomes can or cannot happen at the same
time
use this understanding to calculate probabilities
appreciate that the sum of the probabilities of all possible
mutually exclusive outcomes has to be 1
find the probability of a single outcome from knowing the
probability of all other outcomes
Unit 1 – Probability (Slide 1 of 3)
Return to RoutemapReturn to Routemap
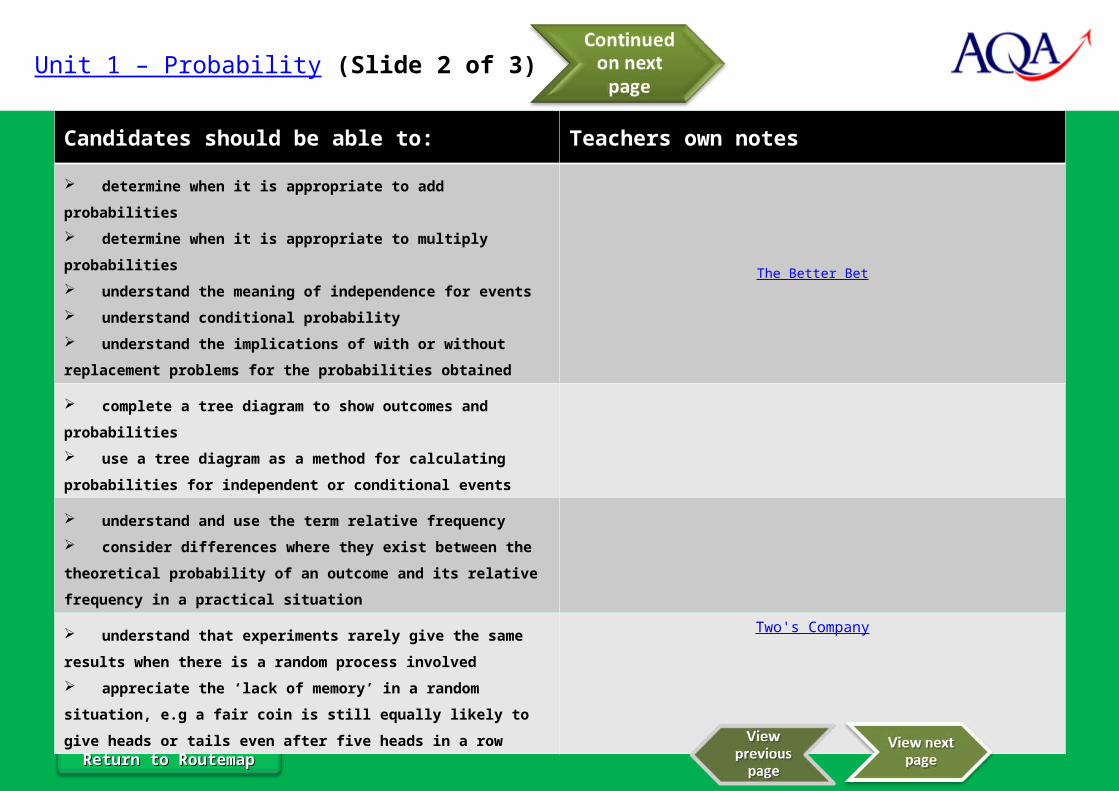
Candidates should be able to:Candidates should be able to: Teachers own notesTeachers own notes
determine when it is appropriate to add probabilities
determine when it is appropriate to multiply probabilities
understand the meaning of independence for events
understand conditional probability
understand the implications of with or without replacement
problems for the probabilities obtained
The Better Bet
complete a tree diagram to show outcomes and probabilities
use a tree diagram as a method for calculating probabilities for
independent or conditional events
understand and use the term relative frequency
consider differences where they exist between the theoretical
probability of an outcome and its relative frequency in a practical
situation
understand that experiments rarely give the same results when
there is a random process involved
appreciate the ‘lack of memory’ in a random situation, e.g a fair
coin is still equally likely to give heads or tails even after five heads
in a row
Two's Company
Unit 1 – Probability (Slide 2 of 3)

Return to RoutemapReturn to Routemap
Candidates should be able to:Candidates should be able to: Teachers own notesTeachers own notes
understand that the greater the number of trials in an experiment
the more reliable the results are likely to be
understand how a relative frequency diagram may show a settling
down as sample size increases enabling an estimate of a probability
to be reliably made; and that if an estimate of a probability is
required, the relative frequency of the largest number of trials
available should be used
Unit 1 – Probability (Slide 3 of 3)

Return to RoutemapReturn to Routemap
Candidates should be able to:Candidates should be able to: Teachers own notesTeachers own notes
add, subtract, multiply and divide using commutative, associative
and distributive laws
understand and use inverse operations
use brackets and the hierarchy of operations
round numbers to the nearest 10, 100, 1000 or million
round to the nearest whole number
round to one, two or three decimal places
round to one significant figure
round numbers to the nearest 10, 100, 1000 or million
round numbers to the nearest whole number
round to a given number of decimal places
round to a given number of significant figures
choose an appropriate degree of accuracy to round to based on
the figures in the question
write down the maximum or minimum figure for a value rounded
to a given accuracy
combine upper or lower bounds appropriately to achieve an
overall maximum or minimum for a situation
work with practical problems involving bounds including in
statistics, e.g. finding the midpoint of a class interval such as
10 < t < 20 in order to estimate a mean.
Unit 1 – Fractions and Decimals (Slide 1 of 3)

Return to RoutemapReturn to Routemap
Candidates should be able to:Candidates should be able to: Teachers own notesTeachers own notes
use a calculator for calculations involving four rules
use a calculator for checking answers
enter complex calculations, for example, to estimate the mean of
a grouped frequency distribution
enter a range of calculations including those involving money and
statistical measures
understand and use functions including:
, memory, brackets and
trigonometrical functions
understand the calculator display, knowing how to interpret the
display, when the display has been rounded by the calculator and not
to round during the intermediate steps of calculation
interpret the display, for example for money interpret 3.6 as £3.60
identify equivalent fractions
simplify a fraction by cancelling all common factors using a
calculator where appropriate. For example, simplifying fractions that
represent probabilities.
understand whether a value is a percentage, a fraction or a
decimal
convert values between percentages, fractions and decimals in
order to compare them; for example, with probabilities
Unit 1 – Fractions and Decimals (Slide 2 of 3)

Return to RoutemapReturn to Routemap
Candidates should be able to:Candidates should be able to: Teachers own notesTeachers own notes
use fractions to interpret or compare statistical diagrams or data
sets
interpret a fraction or decimal as a multiplier when solving
problems
convert between fractions, decimals and percentages to find the
most appropriate method of calculation in a question; for example,
finding 62% of £80
calculate a fraction of a quantity
apply the four rules to fractions using a calculator
calculate with fractions in a variety of contexts including
statistics and probability
calculate a fraction of a quantity
calculate with decimals
apply the four rules to fractions using a calculator
calculate with fractions and decimals in a variety of contexts
including statistics and probability
calculate with compound interest in problems
Unit 1 – Fractions and Decimals (Slide 3 of 3)
Return to RoutemapReturn to Routemap
Candidates should be able to:Candidates should be able to: Teachers own notesTeachers own notes
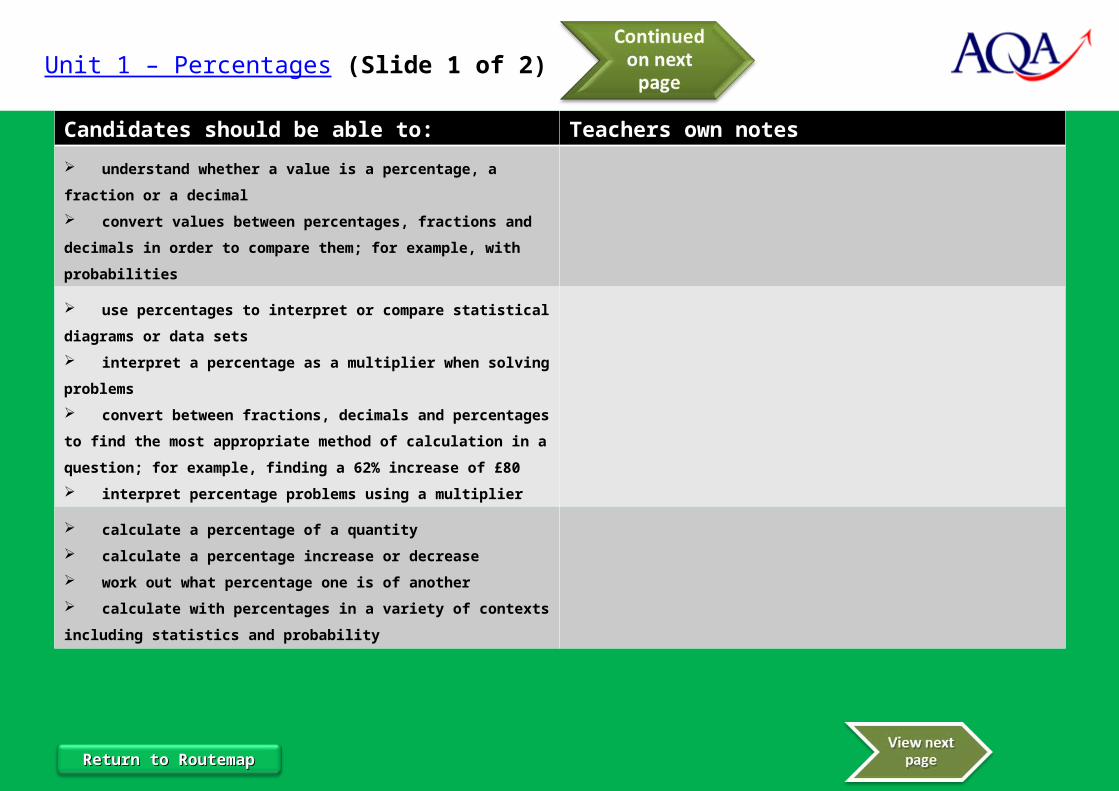
understand whether a value is a percentage, a fraction or a
decimal
convert values between percentages, fractions and decimals in
order to compare them; for example, with probabilities
use percentages to interpret or compare statistical diagrams or
data sets
interpret a percentage as a multiplier when solving problems
convert between fractions, decimals and percentages to find the
most appropriate method of calculation in a question; for example,
finding a 62% increase of £80
interpret percentage problems using a multiplier
calculate a percentage of a quantity
calculate a percentage increase or decrease
work out what percentage one is of another
calculate with percentages in a variety of contexts including
statistics and probability
Unit 1 – Percentages (Slide 1 of 2)

Return to RoutemapReturn to Routemap
Candidates should be able to:Candidates should be able to: Teachers own notesTeachers own notes
calculate a percentage of a quantity
calculate a percentage increase or decrease
work out what percentage one is of another
apply the four rules to fractions using a calculator
calculate with percentages in a variety of contexts including
statistics and probability
calculate reverse percentages
calculate with compound interest in problems
Unit 1 – Percentages (Slide 2 of 2)
Return to RoutemapReturn to Routemap
Candidates should be able to:Candidates should be able to: Teachers own notesTeachers own notes
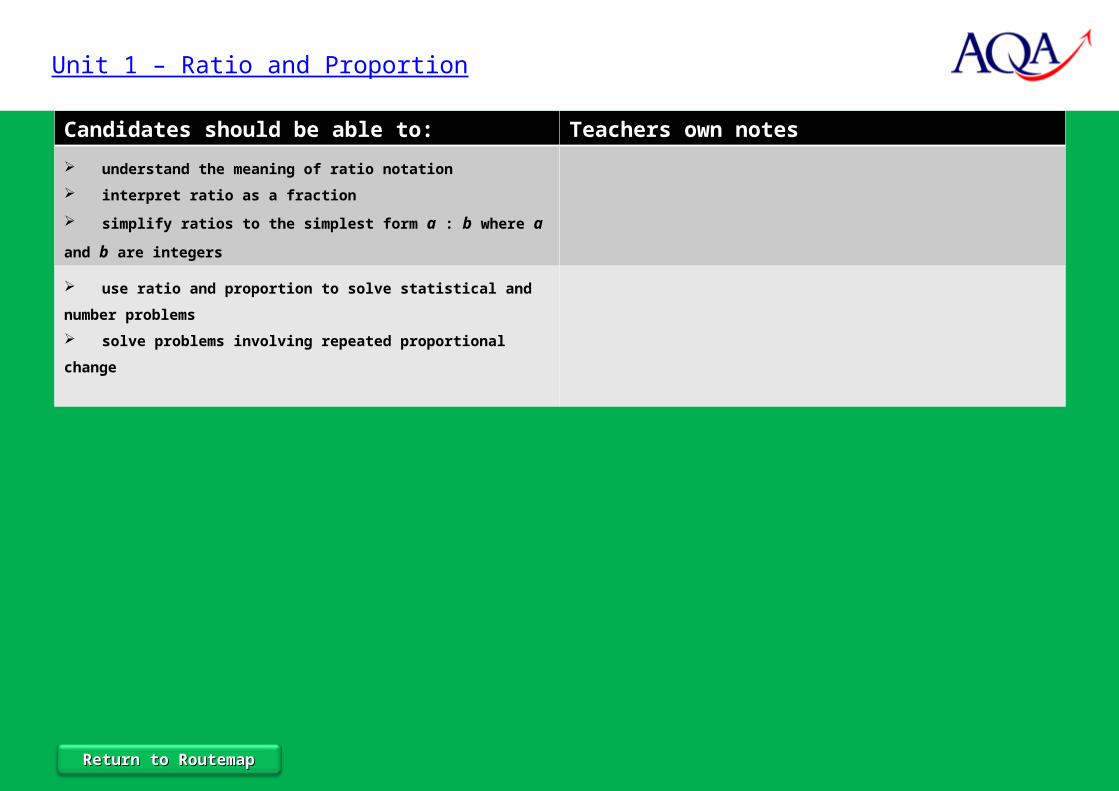
understand the meaning of ratio notation
interpret ratio as a fraction
simplify ratios to the simplest form a : b where a and b are
integers
use ratio and proportion to solve statistical and number problems
solve problems involving repeated proportional change
Unit 1 – Ratio and Proportion
Return to RoutemapReturn to Routemap
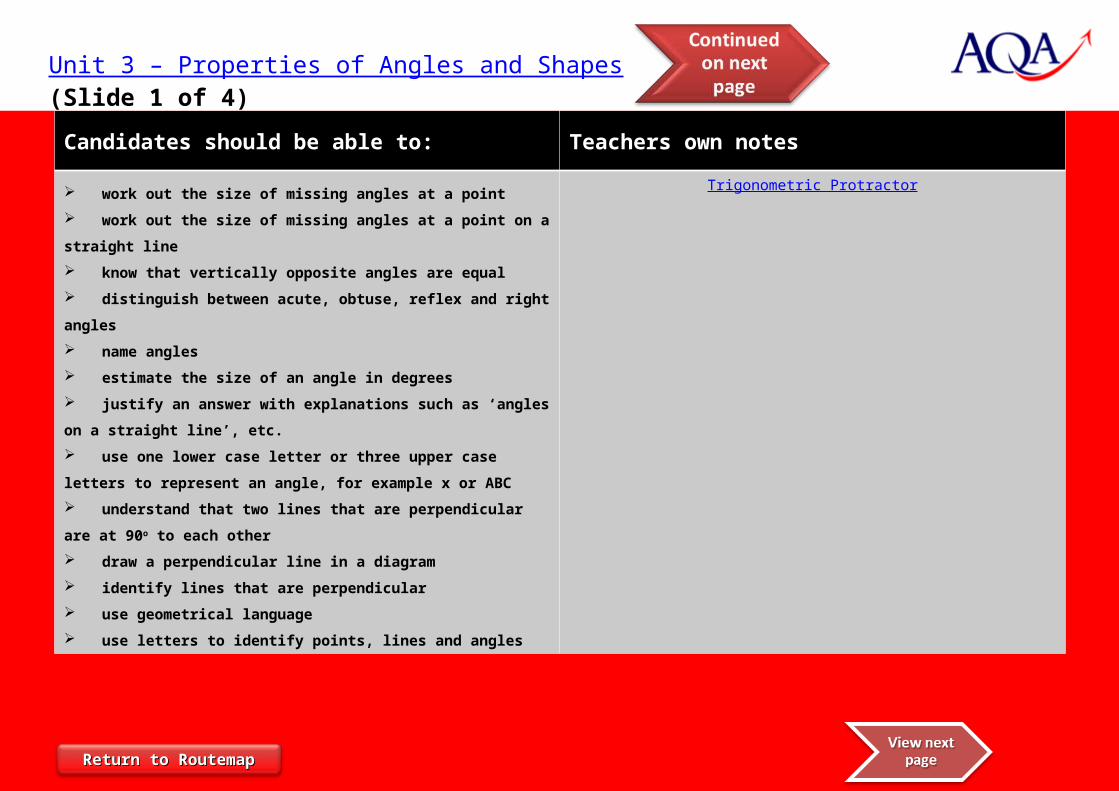
Candidates should be able to:Candidates should be able to: Teachers own notesTeachers own notes
work out the size of missing angles at a point
work out the size of missing angles at a point on a straight line
know that vertically opposite angles are equal
distinguish between acute, obtuse, reflex and right angles
name angles
estimate the size of an angle in degrees
justify an answer with explanations such as ‘angles on a straight
line’, etc.
use one lower case letter or three upper case letters to represent
an angle, for example x or ABC
understand that two lines that are perpendicular are at 90o to each
other
draw a perpendicular line in a diagram
identify lines that are perpendicular
use geometrical language
use letters to identify points, lines and angles
Trigonometric Protractor
Unit 3 – Properties of Angles and Shapes (Slide 1 of 4)

Return to RoutemapReturn to Routemap
Candidates should be able to:Candidates should be able to: Teachers own notesTeachers own notes
understand and use the angle properties of parallel lines
recall and use the terms, alternate angles, and corresponding
angles
work out missing angles using properties of alternate angles and
corresponding angles
understand the consequent properties of parallelograms
understand the proof that the angle sum of a triangle is 180o
understand the proof that the exterior angle of a triangle is equal
to the sum of the interior angles at the other two vertices
use angle properties of equilateral, isosceles and right-angled
triangles
use the angle sum of a quadrilateral is 360o
Three by One
Unit 3 – Properties of Angles and Shapes (Slide 2 of 4)

Return to RoutemapReturn to Routemap
Candidates should be able to:Candidates should be able to: Teachers own notesTeachers own notes
calculate and use the sums of interior angles of polygons
recognise and name regular polygons; pentagons, hexagons,
octagons and decagons
use the angle sum of irregular polygons
calculate and use the angles of regular polygons
use the sum of the interior angles of an n-sided polygon
use the sum of the exterior angles of any polygon is 360o
use interior angle + exterior angle = 180o
use tessellations of regular and irregular shapes
explain why some shapes tessellate and why other shapes do not
tessellate
Terminology
Unit 3 – Properties of Angles and Shapes (Slide 3 of 4)

Return to RoutemapReturn to Routemap
Candidates should be able to:Candidates should be able to: Teachers own notesTeachers own notes
recall the properties and definitions of special types of
quadrilateral
name a given shape
identify a shape given its properties
list the properties of a given shape
draw a sketch of a named shape
identify quadrilaterals that have common properties
classify quadrilaterals using common geometric properties
Trapezium Four
recall the definition of a circle
identify and name these parts of a circle
draw these parts of a circle
understand related terms of a circle
draw a circle given the radius or diameter
Unit 3 – Properties of Angles and Shapes (Slide 4 of 4)

Return to RoutemapReturn to Routemap
Candidates should be able to:Candidates should be able to: Teachers own notesTeachers own notes
use notations and symbols correctly
understand that letter symbols represent definite unknown
numbers in equations, defined quantities or variables in formulae,
and in functions they define new expressions or quantities by
referring to known quantities
recognise that, for example, 5x + 1 = 16 is an equation
recognise that, for example V = IR is a formula
recognise that x + 3 is an expression
understand the identity symbol
recognise that (x + 1)2 = x2+ 2x + 1 is an identity that is true for
all x
understand the meaning of the word 'term', for example know that
x2 = 2x = 1 has three terms
write an expression
Unit 3 – Algebraic Manipulation and Formulae (Slide 1 of 2)

Return to RoutemapReturn to Routemap
Candidates should be able to:Candidates should be able to: Teachers own notesTeachers own notes
understand that the transformation of algebraic expressions
obeys and generalises the rules of generalised arithmetic
manipulate an expression by collecting like terms
multiply a single term over a bracket, e.g. a(b + c) = ab + ac
write expressions to solve problems
write expressions using squares and cubes
factorise algebraic expressions by taking out common factors
know the meaning of 'simplify', e.g. Simplify 3x - 2 + 4(x + 5)
know the meaning of and be able to factorise, e.g.
Factorise 3x2y - 9y
Factorise 4x2 + 6xy
expand the product of two linear expressions, e.g. (2x + 3)(3x – 4)
Perfectly Square
use formulae from mathematics and other subjects expressed
initially in words and then using letters and symbols; for example
formula for area of a triangle, area of a parallelogram, area of a circle,
wage earned = hours worked x hourly rate plus bonus, volume of a
prism, conversions between measures
substitute numbers into a formula
Minus One Two ThreeTemperature
Unit 3 – Algebraic Manipulation and Formulae (Slide 2 of 2)

Return to RoutemapReturn to Routemap
Candidates should be able to:Candidates should be able to: Teachers own notesTeachers own notes
use a calculator to identify integer values immediately above and
below the solution, progressing to identifying values to 1 d.p. above
and immediately above and below the solution
Unit 3 – Trial and Improvement
Return to RoutemapReturn to Routemap
Candidates should be able to:Candidates should be able to: Teachers own notesTeachers own notes
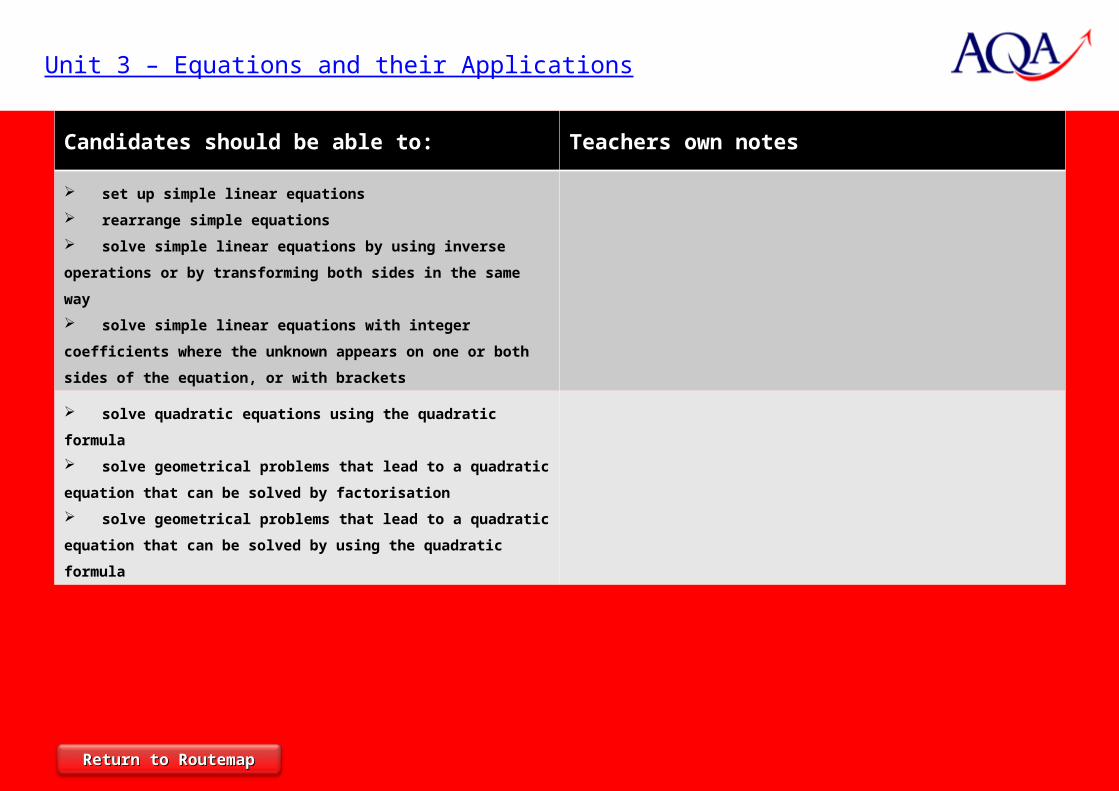
set up simple linear equations
rearrange simple equations
solve simple linear equations by using inverse operations or by
transforming both sides in the same way
solve simple linear equations with integer coefficients where the
unknown appears on one or both sides of the equation, or with
brackets
solve quadratic equations using the quadratic formula
solve geometrical problems that lead to a quadratic equation that
can be solved by factorisation
solve geometrical problems that lead to a quadratic equation that
can be solved by using the quadratic formula
Unit 3 – Equations and their Applications

Return to RoutemapReturn to Routemap
Candidates should be able to:Candidates should be able to: Teachers own notesTeachers own notes
plot points in all four quadrants
find coordinates of points identified by geometrical information,
for example the fourth vertex of a rectangle given the other three
vertices
find coordinates of a midpoint, for example on the diagonal of a
rhombus
calculate the length of a line segment
Square Coordinates
use axes and coordinates to specify points in 3D
find the coordinates of points identified by geometrical
information in 3D
Draw the graph of a linear function of the form y = mx + c on a
grid to intersect the given graph of a quadratic function
Read off the solutions to the common roots of the two functions
to the appropriate degree of accuracy
Appreciate that the points of intersection of the graphs of
y = x2 + 3x – 10 and y = 2x + 1 are the solutions to the equation
x2 + 3x – 10 = 2x + 1
Unit 3 – Coordinates and Graphs (Slide 1 of 2)

Return to RoutemapReturn to Routemap
Candidates should be able to:Candidates should be able to: Teachers own notesTeachers own notes
draw, sketch and recognise graphs of the form where k is
a positive integer
draw, sketch and recognise graphs of the form y = kx for integer
values of x and simple positive values of x
draw, sketch and recognise graphs of the form y = x3 + k where
k is an integer
know the shapes of the graphs of functions
y = sin x and y = cos x
Unit 3 – Coordinates and Graphs (Slide 2 of 2)
Return to RoutemapReturn to Routemap
Candidates should be able to:Candidates should be able to: Teachers own notesTeachers own notes
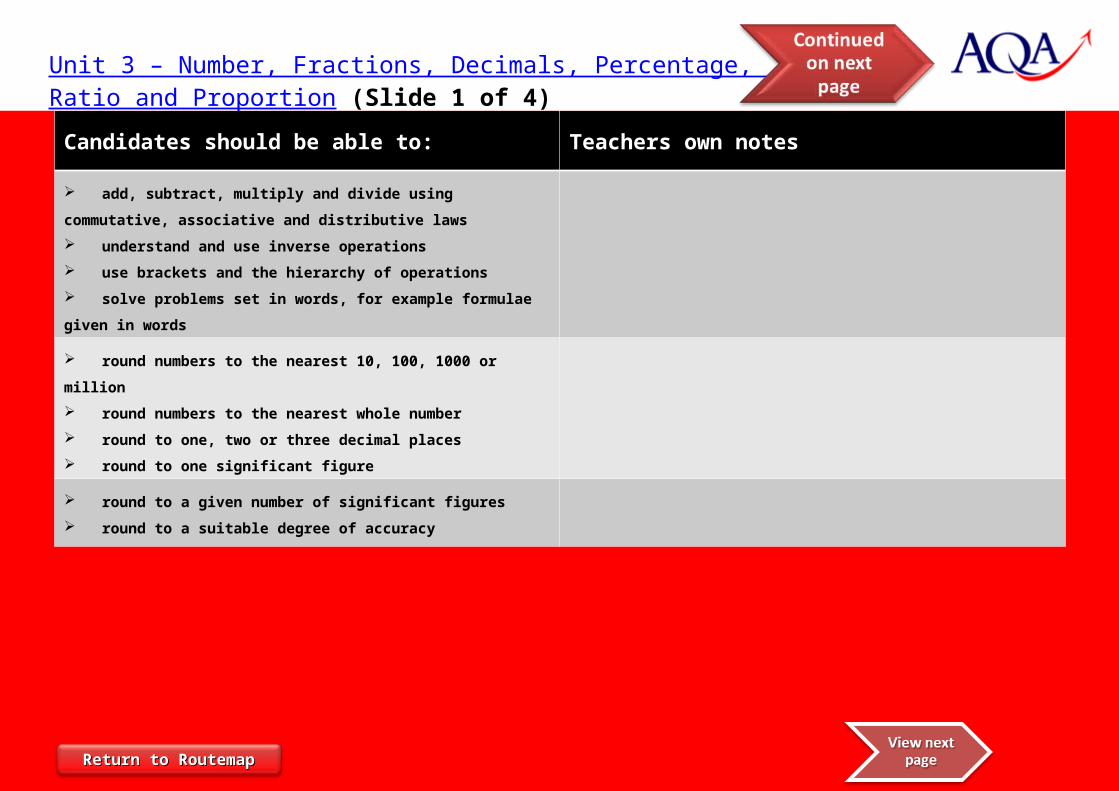
add, subtract, multiply and divide using commutative, associative
and distributive laws
understand and use inverse operations
use brackets and the hierarchy of operations
solve problems set in words, for example formulae given in words
round numbers to the nearest 10, 100, 1000 or million
round numbers to the nearest whole number
round to one, two or three decimal places
round to one significant figure
round to a given number of significant figures
round to a suitable degree of accuracy
Unit 3 – Number, Fractions, Decimals, Percentage, Ratio and Proportion (Slide 1 of 4)

Return to RoutemapReturn to Routemap
Candidates should be able to:Candidates should be able to: Teachers own notesTeachers own notes
use a calculator for calculations involving four rules
use a calculator for checking answers
enter complex calculations and use function keys for reciprocals,
squares, cubes and other powers
enter a range of calculations including those involving money,
time and other measures
understand and use functions including:
, memory, brackets and
trigonometrical functions
use a calculator to input numbers in standard form
use a calculator to explore exponential growth and decay using a
multiplier and the power key
understand the calculator display, knowing how to interpret the
display, when the display has been rounded by the calculator and not
to round during the intermediate steps of calculation
interpret the display, for example for money interpret 3.6 as £3.60
or for time interpret 2.5 as 2 hours 30 minutes
understand how to use a calculator to simplify fractions and to
convert between decimals and fractions and vice versa
Unit 3 – Number, Fractions, Decimals, Percentage, Ratio and Proportion (Slide 2 of 4)

Return to RoutemapReturn to Routemap
Candidates should be able to:Candidates should be able to: Teachers own notesTeachers own notes
identify equivalent fractions
write a fraction in its simplest form
convert between mixed numbers and improper fractions
compare fractions in geometry questions
interpret percentage as the operator 'so many hundredths of'
use percentages in real-life situations
work out percentage of shape that is shaded
shade a given percentage of a shape
interpret a fraction, decimal or percentage as a multiplier when
solving problems
use fractions, decimals or percentages to compare proportions of
shapes that are shaded
use fractions, decimals or percentages to compare lengths, areas
or volumes
calculate a fraction of a quantity
calculate a percentage of a quantity
use decimals to find quantities
use fractions, decimals or percentages to calculate proportions of
shapes that are shaded
use fractions, decimals or percentages to calculate lengths, areas
or volumes
Unit 3 – Number, Fractions, Decimals, Percentage, Ratio and Proportion (Slide 3 of 4)
Return to RoutemapReturn to Routemap
Candidates should be able to:Candidates should be able to: Teachers own notesTeachers own notes
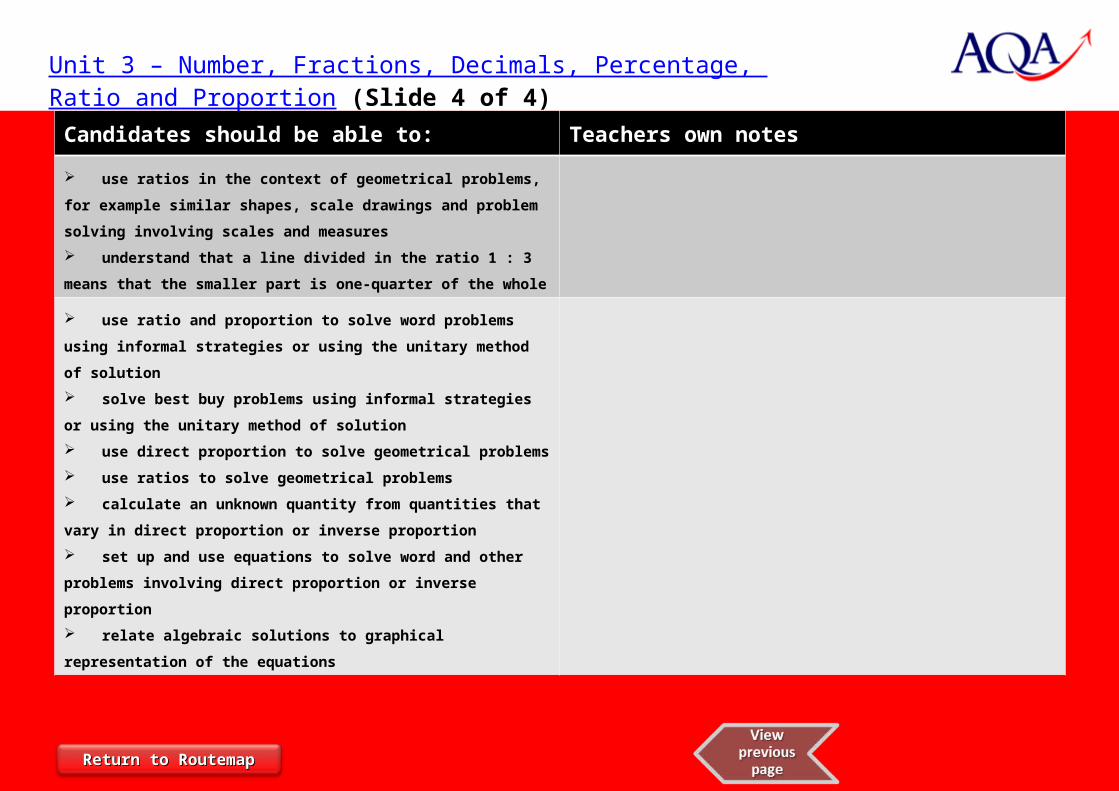
use ratios in the context of geometrical problems, for example
similar shapes, scale drawings and problem solving involving scales
and measures
understand that a line divided in the ratio 1 : 3 means that the
smaller part is one-quarter of the whole
use ratio and proportion to solve word problems using informal
strategies or using the unitary method of solution
solve best buy problems using informal strategies or using the
unitary method of solution
use direct proportion to solve geometrical problems
use ratios to solve geometrical problems
calculate an unknown quantity from quantities that vary in direct
proportion or inverse proportion
set up and use equations to solve word and other problems
involving direct proportion or inverse proportion
relate algebraic solutions to graphical representation of the
equations
Unit 3 – Number, Fractions, Decimals, Percentage, Ratio and Proportion (Slide 4 of 4)
Return to RoutemapReturn to Routemap
Candidates should be able to:Candidates should be able to: Teachers own notesTeachers own notes
work out the perimeter of a rectangle
work out the perimeter of a triangle
calculate the perimeter of shapes made from triangles and
rectangles
calculate the perimeter of shapes made from compound shapes
made from two or more rectangles
calculate the perimeter of shapes drawn on a grid
calculate the perimeter of simple shapes
recall and use the formulae for area of a rectangle, triangle and
parallelogram
work out the area of a rectangle
work out the area of a parallelogram
calculate the area of shapes made from triangles and rectangles
calculate the area of shapes made from compound shapes made
from two or more rectangles, for example an L shape or T shape
calculate the area of shapes drawn on a grid
calculate the area of simple shapes
work out the surface area of nets made up of rectangles and
triangles
calculate the area of a trapezium
Isosceles Triangles
Unit 3 – Perimeter, Area and Volume (Slide 1 of 3)
Return to RoutemapReturn to Routemap
Candidates should be able to:Candidates should be able to: Teachers own notesTeachers own notes
extend to other compound shapes, for example made from circles
or part circles with other known shapes
calculate the length of arcs of circles
calculate the area of sectors of circles
calculate the area of segments of circles
calculate the area of a triangle given the length of two sides and the
included angle
recall and use the formula for the circumference of a circle
work out the circumference of a circle, given the radius or
diameter
work out the radius or diameter given the circumference of a
circle
use π = 3.14 or the button on a calculator
work out the perimeter of semi-circles, quarter circles or other
simple fractions of a circle
recall and use the formula for the area of a circle
work out the area of a circle, given the radius or diameter
work out the radius or diameter given the area of a circle
work out the area of semi-circles, quarter circles or other simple
fractions of a circle
Unit 3 – Perimeter, Area and Volume (Slide 2 of 3)

Return to RoutemapReturn to Routemap
Candidates should be able to:Candidates should be able to: Teachers own notesTeachers own notes
calculate the length of arcs of circles
calculate the area of sectors of circles
calculate the area of segments of circles
recall and use the formula for the volume of a cuboid
recall and use the formula for the volume of a cylinder
use the formula for the volume of a prism
work out the volume of a cube or cuboid
work out the volume of a prism using the given formula, for
example a triangular prism
work out volume of a cylinder
work out perimeters of complex shapes
work out the area of complex shapes made from a combination of
known shapes
work out the area of segments of circles
work out volumes of frustums of cones
work out volumes of frustums of pyramids
calculate the surface area of compound solids constructed from
cubes, cuboids, cones, pyramids, cylinders, spheres and
hemispheres
solve real life problems using known solid shapes
Unit 3 – Perimeter, Area and Volume (Slide 3 of 3)

Return to RoutemapReturn to Routemap
Candidates should be able to:Candidates should be able to: Teachers own notesTeachers own notes
recognise reflection symmetry of 2D shapes
identify lines of symmetry on a shape or diagram
draw lines of symmetry on a shape or diagram
understand line symmetry
draw or complete a diagram with a given number of lines of
symmetry
recognise rotational symmetry of 2D shapes
identify the order of rotation symmetry on a shape or diagram
draw or complete a diagram with rotational symmetry
understand line symmetry
identify and draw lines of symmetry on a Cartesian grid
identify the order of rotational symmetry of shapes on a Cartesian
grid
draw or complete a diagram with rotational symmetry on a
Cartesian grid
Turning Triangles
describe and transform 2D shapes using single rotations
understand that rotations are specified by a centre and an
(anticlockwise) angle
find a centre of rotation
rotate a shape about the origin or any other point
measure the angle of rotation using right angles
Unit 3 – Reflections, Rotations, Translations and Enlargements; Congruence and Similarity (Slide 1 of 5)

Return to RoutemapReturn to Routemap
Candidates should be able to:Candidates should be able to: Teachers own notesTeachers own notes
measure the angle of rotation using simple fractions of a turn or
degrees
describe and transform 2D shapes using single reflections
understand that reflections are specified by a mirror line
identify the equation of a line of reflection
describe and transform 2D shapes using single transformations
understand that translations are specified by a distance and
direction (using a vector)
translate a given shape by a vector
describe and transform 2D shapes using enlargements by a
positive scale factor
understand that an enlargement is specified by a centre and a
scale factor
enlarge a shape on a grid (centre not specified)
draw an enlargement
enlarge a shape using (0, 0) as the centre of enlargement
enlarge shapes with a centre other than (0, 0)
find the centre of enlargement
describe and transform 2D shapes using combined rotations,
reflections, translations, or enlargements
distinguish properties that are preserved under particular
transformations
Unit 3 – Reflections, Rotations, Translations and Enlargements; Congruence and Similarity (Slide 2 of 5)

Return to RoutemapReturn to Routemap
Candidates should be able to:Candidates should be able to: Teachers own notesTeachers own notes
identify the scale factor of an enlargement of a shape as the ratio
of the lengths of two corresponding sides
understand that distances and angles are preserved under
rotations, reflections and translations, so that any figure is congruent
under any of these transformations
recognise that enlargements preserve angle but not length
identify the scale factor of an enlargement as the ratio of the
length of any two corresponding line segments
describe a translation
use congruence to show that translations, rotations and
reflections preserve length and angle, so that any figure is congruent
to its image under any of these transformations
Who Is the Fairest of Them All?
Unit 3 – Reflections, Rotations, Translations and Enlargements; Congruence and Similarity (Slide 3 of 5)

Return to RoutemapReturn to Routemap
Candidates should be able to:Candidates should be able to: Teachers own notesTeachers own notes
understand congruence
identify shapes that are congruent
understand and use conditions for congruent triangles
recognise congruent shapes when rotated, reflected or in
different orientations
understand and use SSS, SAS, ASA and RHS conditions to prove
the congruence of triangles using formal arguments, and to verify
standard ruler and compass constructions
understand similarity
understand similarity of triangles and of other plane figures, and
use this to make geometric inferences
use similarity
identify shapes that are similar, including all squares, all circles
or all regular polygons with equal number of sides
recognise similar shapes when rotated, reflected or in different
orientations
understand the effect of enlargement on perimeter
understand the effect of enlargement on areas of shapes
understand the effect of enlargement on volumes of shapes
and solids
compare the areas or volumes of similar shapes
Unit 3 – Reflections, Rotations, Translations and Enlargements; Congruence and Similarity (Slide 4 of 5)

Return to RoutemapReturn to Routemap
Candidates should be able to:Candidates should be able to: Teachers own notesTeachers own notes
understand and use vector notation for translationsSpotting the Loophole
Unit 3 – Reflections, Rotations, Translations and Enlargements; Congruence and Similarity (Slide 5 of 5)

Return to RoutemapReturn to Routemap
Candidates should be able to:Candidates should be able to: Teachers own notesTeachers own notes
use and interpret maps and scale drawings
use a scale on a map to work out an actual length
use a scale with an actual length to work out a length on a map
construct scale drawings
use scale to estimate a length, for example use the height of a
man to estimate the height of a building where both are shown in a
scale drawing
work out a scale from a scale drawing given additional
information
understand the effect of enlargement on perimeter
understand the effect of enlargement on areas of shapes
understand the effect of enlargement on volumes of shapes
and solids
compare the areas or volumes of similar shapes
interpret scales on a range of measuring instruments including
those for time, temperature and mass, reading from the scale or
marking a point on a scale to show a stated value
know that measurements using real numbers depend on the
choice of unit
recognise that measurements given to the nearest whole unit may
be inaccurate by up to one half in either direction
Unit 3 – Measures (Slide 1 of 3)

Return to RoutemapReturn to Routemap
Candidates should be able to:Candidates should be able to: Teachers own notesTeachers own notes
convert between metric measures
recall and use conversions for metric measures for length, area,
volume and capacity
recall and use conversions between imperial units and metric
units and vice versa using common approximation
For example 5 miles 8 kilometres, 4.5 litres 1 gallon, 2.2
pounds 1 kilogram, 1 inch 2.5 centimetres.
convert between imperial units and metric units and vice versa
using common approximations.
make sensible estimates of a range of measures in everyday
settings
make sensible estimates of a range of measures in real-life
situations, for example estimate the height of a man
choose appropriate units for estimating measurements, for
example a television mast would be measured in metres
Unit 3 – Measures (Slide 2 of 3)

Return to RoutemapReturn to Routemap
Candidates should be able to:Candidates should be able to: Teachers own notesTeachers own notes
use bearings to specify direction
recall and use the eight points of the compass (N, NE, E, SE, S,
SW, W, NW) and their equivalent three-figure bearings
use three-figure bearings to specify direction
mark points on a diagram given the bearing from another point
draw a bearing between points on a map or scale drawing
measure a bearing of a point from another given point
work out a bearing of a point from another given point
work out the bearing to return to a point, given the bearing to
leave that point
understand and use compound measures including area, volume
and speed
An Unhappy EndMotion CaptureWhere to land
Unit 3 – Measures (Slide 3 of 3)

Return to RoutemapReturn to Routemap
Candidates should be able to:Candidates should be able to: Teachers own notesTeachers own notes
use 2D representations of 3D shapes
draw nets and show how they fold to make a 3D solid
know the terms face, edge and vertex (vertices)
identify and name common solids, for example cube, cuboid,
prism, cylinder, pyramid, sphere and cone
analyse 3D shapes through 2D projections and cross-sections,
including plan and elevation
understand and draw front and side elevations and plans of
shapes made from simple solids, for example a solid made from
small cubes
understand and use isometric drawings
Triangles to TetrahedraEfficientCutting
measure and draw lines to the nearest mm
measure and draw angles to the nearest degree
make accurate drawings of triangles and other 2D shapes using a
ruler and protractor
make an accurate scale drawing from a sketch, a diagram or a
description
Unit 3 – 2D Representations of 3D Shapes; Drawing and Constructing Shapes; Loci (Slide 1 of 3)
Return to RoutemapReturn to Routemap
Candidates should be able to:Candidates should be able to: Teachers own notesTeachers own notes
use straight edge and a pair of compasses to do standard
constructions
construct a triangle
construct an equilateral triangle with a given side
construct a perpendicular bisector of a given line
construct the perpendicular from a point to a line
construct the perpendicular from a point on a line
construct an angle bisector
construct angles of 60o, 90o, 30o and 45o
draw parallel lines
draw circles or part circles given the radius or diameter
construct a regular hexagon inside a circle
construct diagrams of 2D shapes from given information
Triangle Mid PtsTriangles in Circles
Unit 3 – 2D Representations of 3D Shapes; Drawing and Constructing Shapes; Loci (Slide 2 of 3)

Return to RoutemapReturn to Routemap
Candidates should be able to:Candidates should be able to: Teachers own notesTeachers own notes
find loci, both by reasoning and by using ICT to produce shapes
and paths
construct a region, for example, bounded by a circle and an
intersecting line
construct loci, for example, given a fixed distance from a point
and a fixed distance from a given line
construct loci, for example, given equal distances from two
points
construct loci, for example, given equal distances from two line
segments
construct a region that is defined as, for example, less than a
given distance or greater than a given distance from a point or line
segment
describe regions satisfying several conditions
How Far Does it Move?
recognise, sketch and draw the graphs of functions defined by
spatial conditions
understand and use terms such as locus, parallel and equidistant
in this context
Unit 3 – 2D Representations of 3D Shapes; Drawing and Constructing Shapes; Loci (Slide 3 of 3)
Return to RoutemapReturn to Routemap
Candidates should be able to:Candidates should be able to: Teachers own notesTeachers own notes
understand that the tangent at any point on a circle is
perpendicular to the radius at that point
understand and use the fact that tangents from an external point
are equal in length
explain why the perpendicular from the centre to a chord bisects
the chord
understand that inscribed regular polygons can be constructed
by equal division of a circle
prove and use the fact that the angle subtended by an arc at the
centre of a circle is twice the angle subtended at any point on the
circumference
prove and use the fact that the angle subtended at the
circumference by a semicircle is a right angle
prove and use the fact that angles in the same segment are equal
prove and use the fact that opposite angles of a cyclic
quadrilateral sum to 180 degrees
prove and use the alternate segment theorem
Subtended Angles
Unit 3 – Circle Theorems; Geometrical Proof (Slide 1 of 5)

Return to RoutemapReturn to Routemap
Candidates should be able to:Candidates should be able to: Teachers own notesTeachers own notes
work out the size of missing angles at a point
work out the size of missing angles at a point on a straight line
know that vertically opposite angles are equal
distinguish between acute, obtuse, reflex and right angles
name angles
estimate the size of an angle in degrees
justify an answer with explanations such as ‘angles on a straight
line’, etc.
use one lower case letter or three upper case letters to represent
an angle, for example x or ABC
understand that two lines that are perpendicular are at 90o to each
other
draw a perpendicular line in a diagram
identify lines that are perpendicular
use geometrical language
use letters to identify points, lines and angles
Unit 3 – Circle Theorems; Geometrical Proof (Slide 2 of 5)

Return to RoutemapReturn to Routemap
Candidates should be able to:Candidates should be able to: Teachers own notesTeachers own notes
understand and use the angle properties of parallel lines
recall and use the terms, alternate angles, and corresponding
angles
work out missing angles using properties of alternate angles and
corresponding angles
understand the consequent properties of parallelograms
understand the proof that the angle sum of a triangle is 180o
understand the proof that the exterior angle of a triangle is equal
to the sum of the interior angles at the other two vertices
use angle properties of equilateral, isosceles and right-angled
triangles
use the angle sum of a quadrilateral is 360o
Unit 3 – Circle Theorems; Geometrical Proof (Slide 3 of 5)

Return to RoutemapReturn to Routemap
Candidates should be able to:Candidates should be able to: Teachers own notesTeachers own notes
calculate and use the sums of interior angles of polygons
recognise and name regular polygons; pentagons, hexagons,
octagons and decagons
use the angle sum of irregular polygons
calculate and use the angles of regular polygons
use the sum of the interior angles of an n-sided polygon
use the sum of the exterior angles of any polygon is 360o
use interior angle + exterior angle = 180o
use tessellations of regular and irregular shapes
explain why some shapes tessellate and why other shapes do not
tessellate
Unit 3 – Circle Theorems; Geometrical Proof (Slide 4 of 5)

Return to RoutemapReturn to Routemap
Candidates should be able to:Candidates should be able to: Teachers own notesTeachers own notes
understand congruence
identify shapes that are congruent
understand and use conditions for congruent triangles
recognise congruent shapes when rotated, reflected or in
different orientations
understand and use SSS, SAS, ASA and RHS conditions to prove
the congruence of triangles using formal arguments, and to verify
standard ruler and compass constructions
understand similarity
understand similarity of triangles and of other plane figures, and
use this to make geometric inferences
use similarity
identify shapes that are similar, including all squares, all circles
or all regular polygons with equal number of sides
recognise similar shapes when rotated, reflected or in different
orientations
apply mathematical reasoning, explaining and justifying
inferences and deductions
show step-by-step deduction in solving a geometrical problem
state constraints and give starting points when making
deductions
Unit 3 – Circle Theorems; Geometrical Proof (Slide 5 of 5)

Return to RoutemapReturn to Routemap
Candidates should be able to:Candidates should be able to: Teachers own notesTeachers own notes
understand, recall and use Pythagoras' theorem in 2D, then 3D
problems
investigate the geometry of cuboids including cubes, and shapes
made from cuboids, including the use of Pythagoras' theorem to
calculate lengths in three dimensions
The Spider and the Fly
Unit 3 – Pythagoras’ Theorem

Return to RoutemapReturn to Routemap
Candidates should be able to:Candidates should be able to: Teachers own notesTeachers own notes
understand, recall and use Pythagoras' theorem in 2D, then 3D
problems
investigate the geometry of cuboids including cubes, and shapes
made from cuboids, including the use of Pythagoras' theorem to
calculate lengths in three dimensions
understand, recall and use trigonometry relationships in right-
angled triangles
use the trigonometry relationships in right-angled triangles to
solve problems, including those involving bearings
use these relationships in 3D contexts, including finding the
angles between a line and a plane (but not the angle between two
planes or between two skew lines); calculate the area of a triangle
using
use the sine and cosine rules to solve 2D and 3D problems
Sine and Cosine
Unit 3 – Trigonometry
Return to RoutemapReturn to Routemap
Candidates should be able to:Candidates should be able to: Teachers own notesTeachers own notes
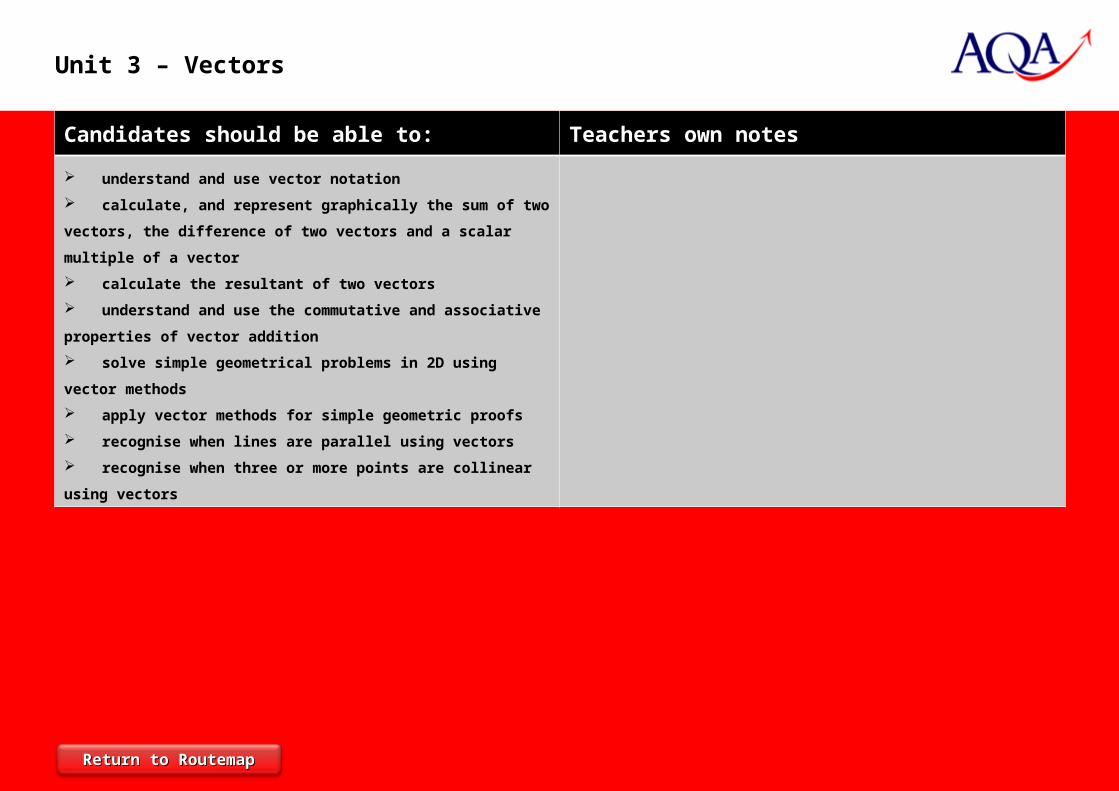
understand and use vector notation
calculate, and represent graphically the sum of two vectors, the
difference of two vectors and a scalar multiple of a vector
calculate the resultant of two vectors
understand and use the commutative and associative properties
of vector addition
solve simple geometrical problems in 2D using vector methods
apply vector methods for simple geometric proofs
recognise when lines are parallel using vectors
recognise when three or more points are collinear using vectors
Unit 3 – Vectors
Return to RoutemapReturn to Routemap
Candidates should be able to:Candidates should be able to: Teachers own notesTeachers own notes
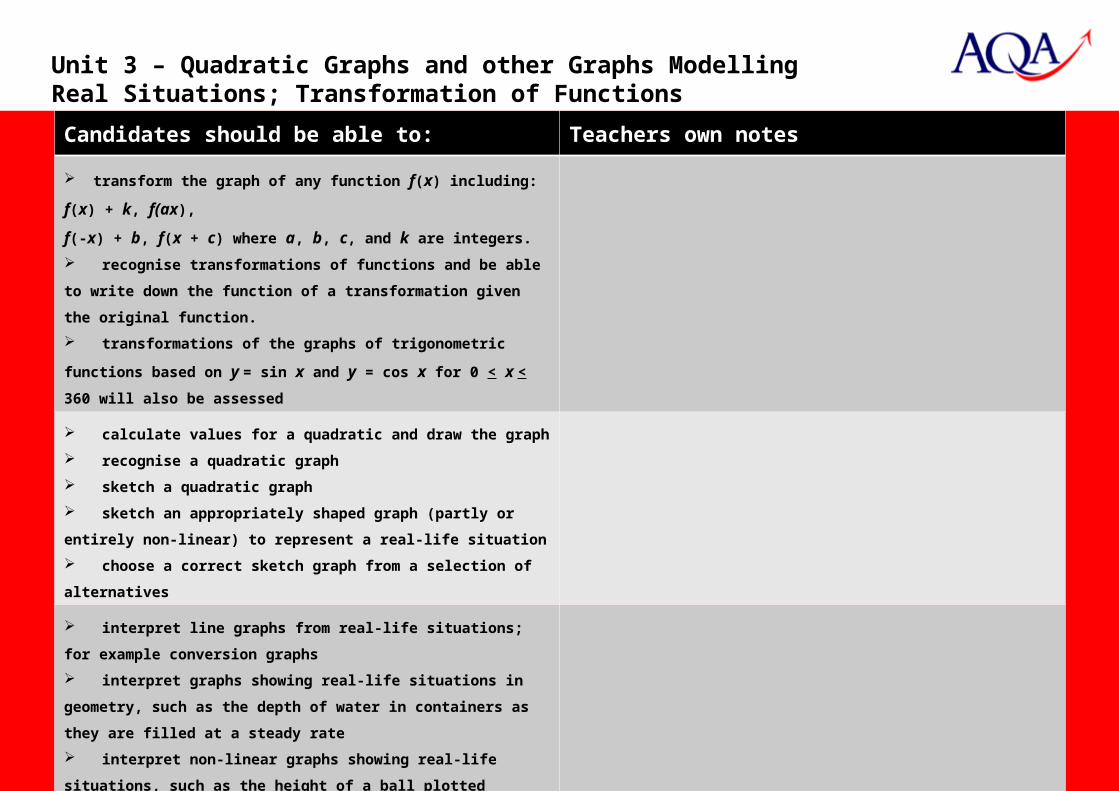
transform the graph of any function f(x) including: f(x) + k, f(ax),
f(-x) + b, f(x + c) where a, b, c, and k are integers.
recognise transformations of functions and be able to write down
the function of a transformation given the original function.
transformations of the graphs of trigonometric functions based
on y = sin x and y = cos x for 0 < x < 360 will also be assessed
calculate values for a quadratic and draw the graph
recognise a quadratic graph
sketch a quadratic graph
sketch an appropriately shaped graph (partly or entirely non-
linear) to represent a real-life situation
choose a correct sketch graph from a selection of alternatives
interpret line graphs from real-life situations; for example
conversion graphs
interpret graphs showing real-life situations in geometry, such as
the depth of water in containers as they are filled at a steady rate
interpret non-linear graphs showing real-life situations, such as
the height of a ball plotted against time
find an approximate value of y for a given value of x or the
approximate values of x for a given value of y
Unit 3 – Quadratic Graphs and other Graphs Modelling Real Situations; Transformation of Functions