gcc oil & gas report
TRANSCRIPT
GCC OIL & GAS REPORT MORRA CAPITAL LIMITED
1. INTRODUCTION - GCC OIL & GAS INDUSTRY OVERVIEW
2. OIL AND GAS INDUSTRY PER GCC STATE UNITED ARAB EMIRATES
Introduction
Economic & Social Indicators
Sector Organizations
Upstream Sector
Downstream Sector
KINGDOM OF SAUDI ARABIA
Introduction
Economic & Social Indicators
Sector Organizations
Upstream Sector
Downstream Sector
STATE OF QATAR
Introduction
Economic & Social Indicators
Sector Organizations
Upstream Sector
Downstream Sector
3. ANALYSIS ON THE VARIATION OF GLOBAL OIL DEMAND & GLOBAL OIL PRICES
4. INDUSTRY GROWTH VERSUS ECONOMIC GROWTH
5. GCC HYDROCARBON SECTOR OUTLOOK AND FUTURE
TABLE OF CONTENTS
KUWAIT
Introduction
Economic & Social Indicators
Sector Organizations
Upstream Sector
Downstream Sector
SULTANATE OF OMAN
Introduction
Economic & Social Indicators
Sector Organizations
Upstream Sector
Downstream Sector
KINGDOM OF BAHRAIN
Introduction
Economic & Social Indicators
Sector Organizations
Upstream Sector
Downstream Sector
| MORRA CAPITAL
GCC OIL & GAS INDUSTRY OVERVIEW | INTRODUCTION
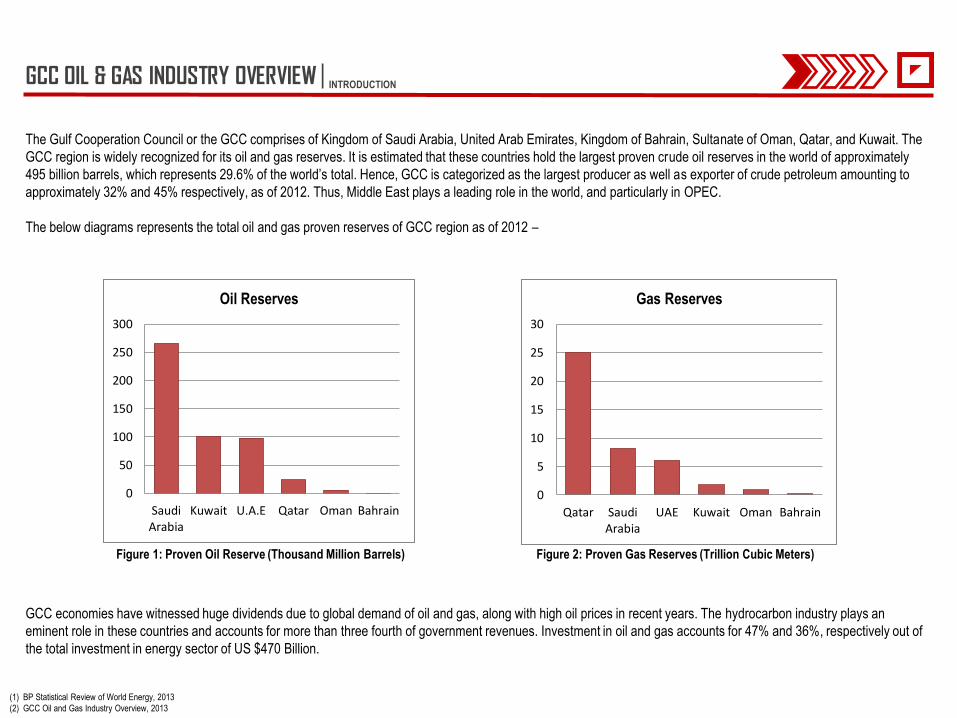
The Gulf Cooperation Council or the GCC comprises of Kingdom of Saudi Arabia, United Arab Emirates, Kingdom of Bahrain, Sultanate of Oman, Qatar, and Kuwait. The
GCC region is widely recognized for its oil and gas reserves. It is estimated that these countries hold the largest proven crude oil reserves in the world of approximately
495 billion barrels, which represents 29.6% of the world’s total. Hence, GCC is categorized as the largest producer as well as exporter of crude petroleum amounting to
approximately 32% and 45% respectively, as of 2012. Thus, Middle East plays a leading role in the world, and particularly in OPEC.
The below diagrams represents the total oil and gas proven reserves of GCC region as of 2012 –
GCC economies have witnessed huge dividends due to global demand of oil and gas, along with high oil prices in recent years. The hydrocarbon industry plays an
eminent role in these countries and accounts for more than three fourth of government revenues. Investment in oil and gas accounts for 47% and 36%, respectively out of
the total investment in energy sector of US $470 Billion.
(1) BP Statistical Review of World Energy, 2013
(2) GCC Oil and Gas Industry Overview, 2013
0
50
100
150
200
250
300
SaudiArabia
Kuwait U.A.E Qatar Oman Bahrain
Oil Reserves
0
5
10
15
20
25
30
Qatar SaudiArabia
UAE Kuwait Oman Bahrain
Gas Reserves
Figure 1: Proven Oil Reserve (Thousand Million Barrels) Figure 2: Proven Gas Reserves (Trillion Cubic Meters)
UNITED ARAB EMIRATES | OIL & GAS SECTOR PER GCC STATE
The United Arab Emirates, UAE, is located in the southeast end of the Arabian
Peninsula on the Persian Gulf, bordering Oman to the east and Saudi Arabia to the
south. The official language of UAE is Arabic; however, English is widely spoken as
well. UAE holds a position of being one of the largest oil and natural gas producers
in the world. It is also a member of OPEC and the Gas Exporting Countries Forum.
UAE has relied on its oil and gas resources to support the economy. UAE has a
population of 10.41 million people as of January, 2014.
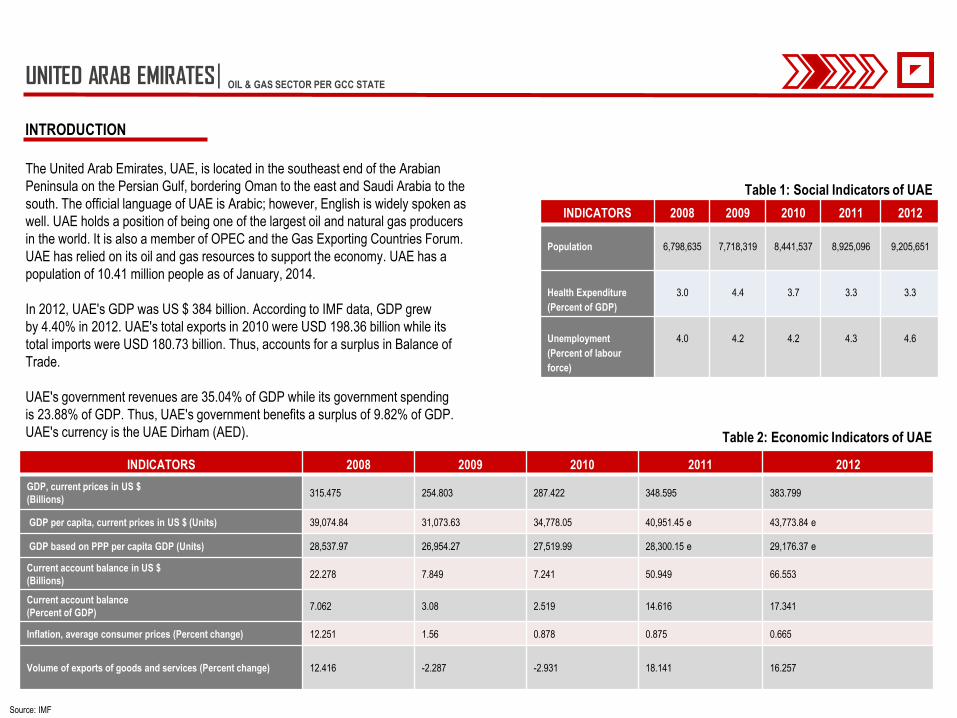
In 2012, UAE's GDP was US $ 384 billion. According to IMF data, GDP grew
by 4.40% in 2012. UAE's total exports in 2010 were USD 198.36 billion while its
total imports were USD 180.73 billion. Thus, accounts for a surplus in Balance of
Trade.
UAE's government revenues are 35.04% of GDP while its government spending
is 23.88% of GDP. Thus, UAE's government benefits a surplus of 9.82% of GDP.
UAE's currency is the UAE Dirham (AED).
Source: IMF
INTRODUCTION
Table 2: Economic Indicators of UAE
INDICATORS 2008 2009 2010 2011 2012
GDP, current prices in US $
(Billions) 315.475 254.803 287.422 348.595 383.799
GDP per capita, current prices in US $ (Units) 39,074.84 31,073.63 34,778.05 40,951.45 e 43,773.84 e
GDP based on PPP per capita GDP (Units) 28,537.97 26,954.27 27,519.99 28,300.15 e 29,176.37 e
Current account balance in US $
(Billions) 22.278 7.849 7.241 50.949 66.553
Current account balance
(Percent of GDP) 7.062 3.08 2.519 14.616 17.341
Inflation, average consumer prices (Percent change) 12.251 1.56 0.878 0.875 0.665
Volume of exports of goods and services (Percent change) 12.416 -2.287 -2.931 18.141 16.257
INDICATORS 2008 2009 2010 2011 2012
Population
6,798,635
7,718,319
8,441,537
8,925,096
9,205,651
Health Expenditure
(Percent of GDP)
3.0
4.4
3.7
3.3
3.3
Unemployment
(Percent of labour
force)
4.0
4.2
4.2
4.3
4.6
Table 1: Social Indicators of UAE

UNITED ARAB EMIRATES | SECTOR ORGANISATIONS
Each of the seven Emirates in the UAE play a key role in the regulation of the oil industry. In Abu Dhabi, the Supreme Petroleum Council (SPC) sets Abu Dhabi's
petroleum-related objectives and policies. As Abu Dhabi enjoys the status of the central player in the UAE's oil industry, the SPC is the most important entity in the
country when it comes to establishing oil policy.
The Abu Dhabi National Oil Company (ADNOC) leads the daily operations and implementation of SPC instructions. It is the key shareholder in nearly all upstream activity
in Abu Dhabi, and also operates subsidiaries in the oil and gas sector. Some of the subsidiaries are the Abu Dhabi Company for Onshore Oil Operations (ADCO), the Abu
Dhabi Marine Operating Company (ADMA-OPCO), the Zakum Development Company (ZADCO), and the Abu Dhabi National Tanker Company (ADNATCO). These
subsidiaries function under the same management team as the National Gas Shipping Company (NGSCO).
The joint venture between ADNOC, Shell, Total, and Partex – Abu Dhabi Gas Industries Limited Company (GASCO) – oversees processing of Abu Dhabi's onshore
natural gas.
Abu Dhabi Gas Liquefaction Limited (ADGAS), controls the production and export of Abu Dhabi's LNG and LPG.
The Dubai Supreme Council of Energy (DSCE) looks into Dubai's energy policy development. The DSCE also ensures that Dubai's economy has adequate and
sustainable access to energy resources, and is also identified as the central body in Dubai's natural gas sector. The Dubai Natural Gas Company Limited (DUGAS)
manages engineering, construction, management, and operation of Dubai's natural gas infrastructure.
It was pointed out that the UAE leads the MENA region in value of contracts awarded in the oil and gas sector with ZADCO awarding a $3.7 billion contract on the
development of the offshore Upper Zakum field.
1 The seven emirates being Abu Dhabi, Dubai, Sharjah, Al Fujairah, Ajman, Ras Al Khaimah & Umm Al Quwain
2 Article-UAE and KSA lead regional oil and gas spending, July 2013, Arabian Oil & Gas.
UNITED ARAB EMIRATES | UPSTREAM SECTOR
Upstream Sector comprises exploration and production of both oil and gas. UAE ranks eighth for crude oil production in 2012 with 2.8 million barrels per day. The change
in oil production in 2012 as against 2011 was accounted for 1.6%.
In July 2012, ZADCO granted an $800-million engineering, procurement, and construction contract to Abu Dhabi's National Petroleum Construction Company with the
aim to expand production to 750,000 billion barrels per day by 2016.
Enhanced oil recovery (EOR) is the process of obtaining stranded oil not recovered from an oil reservoir through certain extraction processes. EOR uses methods
including thermal recovery, gas injection, chemical injection and low-salinity water flooding.
Source: US Energy Information Administration, HIS Global Insight, HIS EDIN, Trade Press
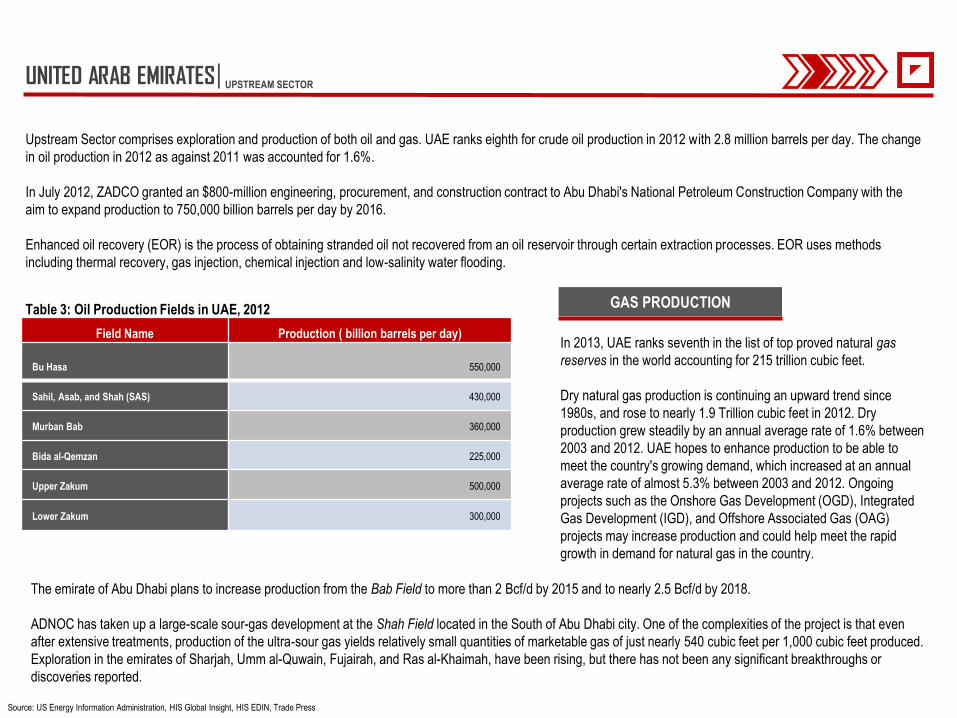
Table 3: Oil Production Fields in UAE, 2012
Field Name Production ( billion barrels per day)
Bu Hasa 550,000
Sahil, Asab, and Shah (SAS) 430,000
Murban Bab 360,000
Bida al-Qemzan 225,000
Upper Zakum 500,000
Lower Zakum 300,000
In 2013, UAE ranks seventh in the list of top proved natural gas
reserves in the world accounting for 215 trillion cubic feet.
Dry natural gas production is continuing an upward trend since
1980s, and rose to nearly 1.9 Trillion cubic feet in 2012. Dry
production grew steadily by an annual average rate of 1.6% between
2003 and 2012. UAE hopes to enhance production to be able to
meet the country's growing demand, which increased at an annual
average rate of almost 5.3% between 2003 and 2012. Ongoing
projects such as the Onshore Gas Development (OGD), Integrated
Gas Development (IGD), and Offshore Associated Gas (OAG)
projects may increase production and could help meet the rapid
growth in demand for natural gas in the country.
The emirate of Abu Dhabi plans to increase production from the Bab Field to more than 2 Bcf/d by 2015 and to nearly 2.5 Bcf/d by 2018.
ADNOC has taken up a large-scale sour-gas development at the Shah Field located in the South of Abu Dhabi city. One of the complexities of the project is that even
after extensive treatments, production of the ultra-sour gas yields relatively small quantities of marketable gas of just nearly 540 cubic feet per 1,000 cubic feet produced.
Exploration in the emirates of Sharjah, Umm al-Quwain, Fujairah, and Ras al-Khaimah, have been rising, but there has not been any significant breakthroughs or
discoveries reported.
GAS PRODUCTION
UNITED ARAB EMIRATES | DOWNSTREAM SECTOR
The UAE has an oil refinery capacity of 710,000 bbl/d. The UAE has five refining facilities.
The largest of which are the Ruwais (400,000 bbl/d) and Jebel Ali (120,000 bbl/d) refineries. According to the Oil & Gas Journal, total refining capacity in the UAE
increased by approximately 150,000 bbl/d and has accounted to reach more than 770,000 bbl/d by the end of 2012.
International Petroleum Investment Company plans to invest $3.5 billion on a new Fujairah refining complex, and will have a processing capacity of 200,000 bbl/d. The
project is currently in its pre-front-end engineering and design phase, and is scheduled to be completed by the end of 2016.
Once completed, the new refinery will be the second largest in the Emirates, and shall reap social and economic benefits to Fujairah as well as other Northern Emirates.
ADNOC's refining subsidiary, Takreer, plans for an expansion of refinery at Ruwais by 400,000 bbl/d by mid 2014. The UAE and neighboring country Oman plan to build
a refinery that would be jointly operated and shall have a capacity exceeding 200,000 bbl/d.
The natural gas discovered in UAE contains a relatively high sulphur content making it highly corrosive and complex in process. The country has been resorting to flaring
the gas from its oil fields for separating sulphur from gas, rather than undertaking extensive and costly processes. The technical difficulties of producing the country's
sulphur rich gas did create a great restriction to the development of the UAE's reserves. However, due to advancements in technology and the growth in domestic
demand for natural gas, this has led to further development of natural gas reserves, and an alternative to imports.
PROCESSING & REFINERY
UNITED ARAB EMIRATES | DOWNSTREAM SECTOR
The UAE has a well developed pipeline network that links oil fields with processing plants and export terminals. The Abu Dhabi Crude Oil Pipeline is an export pipeline
that runs 230 miles from Habshan in Abu Dhabi to Fujairah. This pipeline gives a direct link for distribution from the fields of western desert of UAE to the Gulf of Oman;
and from there to international markets.
With a capacity of 1.5 million bbl/d this pipeline will provide the UAE with the ability to export a significant portion of its daily production.
The export terminal in Fujairah will expand its capabilities over the years. The terminal expansion plan will include three new subsea loading lines, an intermediate
pumping station, and three offshore buoys designed for deepwater tanker loading. Fujairah is becoming a critical element in a well-developed export network due to
growth in storage capacities as a result of recent and ongoing expansion projects.
Apart from Fujairah and Jebel Ali, export terminals include Jebel Dhana, Zirku Island, Das Island, Ruwais, and Umm al–Nar. According to EIA estimates, UAE exported
more than 2.5 million bbl/d of crude oil in 2012. Other exports include petrochemicals, refined products, jet oil, gas oil, and LPG.
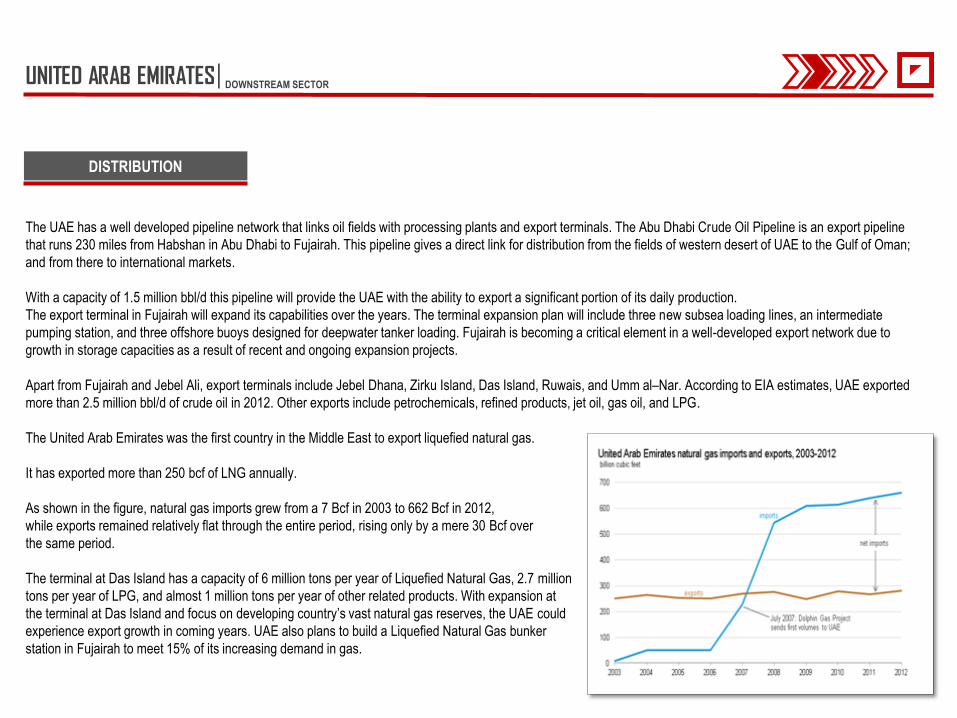
The United Arab Emirates was the first country in the Middle East to export liquefied natural gas.
It has exported more than 250 bcf of LNG annually.
As shown in the figure, natural gas imports grew from a 7 Bcf in 2003 to 662 Bcf in 2012,
while exports remained relatively flat through the entire period, rising only by a mere 30 Bcf over
the same period.
The terminal at Das Island has a capacity of 6 million tons per year of Liquefied Natural Gas, 2.7 million
tons per year of LPG, and almost 1 million tons per year of other related products. With expansion at
the terminal at Das Island and focus on developing country’s vast natural gas reserves, the UAE could
experience export growth in coming years. UAE also plans to build a Liquefied Natural Gas bunker
station in Fujairah to meet 15% of its increasing demand in gas.
DISTRIBUTION
KINGDOM OF SAUDI ARABIA | OIL & GAS SECTOR PER GCC STATE
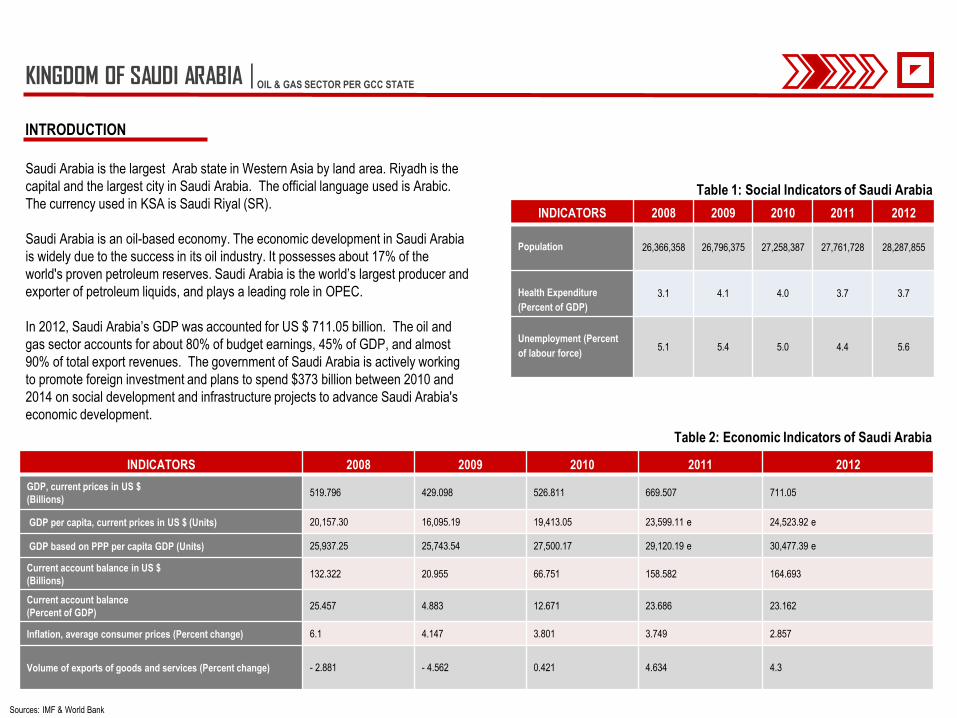
Saudi Arabia is the largest Arab state in Western Asia by land area. Riyadh is the
capital and the largest city in Saudi Arabia. The official language used is Arabic.
The currency used in KSA is Saudi Riyal (SR).
Saudi Arabia is an oil-based economy. The economic development in Saudi Arabia
is widely due to the success in its oil industry. It possesses about 17% of the
world's proven petroleum reserves. Saudi Arabia is the world’s largest producer and
exporter of petroleum liquids, and plays a leading role in OPEC.
In 2012, Saudi Arabia’s GDP was accounted for US $ 711.05 billion. The oil and
gas sector accounts for about 80% of budget earnings, 45% of GDP, and almost
90% of total export revenues. The government of Saudi Arabia is actively working
to promote foreign investment and plans to spend $373 billion between 2010 and
2014 on social development and infrastructure projects to advance Saudi Arabia's
economic development.
Sources: IMF & World Bank
INTRODUCTION
Table 2: Economic Indicators of Saudi Arabia
INDICATORS 2008 2009 2010 2011 2012
GDP, current prices in US $
(Billions) 519.796 429.098 526.811 669.507 711.05
GDP per capita, current prices in US $ (Units) 20,157.30 16,095.19 19,413.05 23,599.11 e 24,523.92 e
GDP based on PPP per capita GDP (Units) 25,937.25 25,743.54 27,500.17 29,120.19 e 30,477.39 e
Current account balance in US $
(Billions) 132.322 20.955 66.751 158.582 164.693
Current account balance
(Percent of GDP) 25.457 4.883 12.671 23.686 23.162
Inflation, average consumer prices (Percent change) 6.1 4.147 3.801 3.749 2.857
Volume of exports of goods and services (Percent change) - 2.881 - 4.562 0.421 4.634 4.3
INDICATORS 2008 2009 2010 2011 2012
Population 26,366,358 26,796,375 27,258,387 27,761,728 28,287,855
Health Expenditure
(Percent of GDP)
3.1 4.1 4.0 3.7 3.7
Unemployment (Percent
of labour force) 5.1 5.4 5.0 4.4 5.6
Table 1: Social Indicators of Saudi Arabia
KINGDOM OF SAUDI ARABIA
The Ministry of Petroleum and Mineral Resources and the Supreme Council for Petroleum and Mineral Affairs, both being government organizations, set policies and
govern the Saudi oil industry. This includes crude production, refining, and marketing undertaken by Saudi Aramco.
Saudi Aramco is the world's largest oil company in terms of proven oil reserves and production. It controls the majority of oil and natural gas operations in Saudi Arabia.
Their operations include exploration of oil and gas, production, refining, and distribution activities.
They serve the three major world markets – Asia, North America, and Europe.
| SECTOR ORGANISATIONS
KINGDOM OF SAUDI ARABIA | UPSTREAM SECTOR
According to BP Statistics, Saudi Arabia contains roughly 266 thousand million barrels as on 1st January, 2013. Although Saudi Arabia has about 100 major oil and gas
fields, most of its oil reserves are contained in only eight fields. The Ghawar Field is the world's largest oil field with estimated remaining oil reserves of 70 billion barrels,
having a capacity of producing 5 million bbl/d of Arab light crude.
Saudi Arabia maintains the world's largest crude oil production capacity of 11.53 million bbl/d of total oil in 2012. Saudi Arabia is also a leading world producer of Natural
Gas Liquids, and has experienced a rise in demand for NGL from developing countries.
Saudi Arabia produces a variety of crude oils ranging from heavy to extra light crude. Lighter grade crude is generally produced on onshore fields such as Ghawar,
Khurais, Qatif, etc., while medium and heavy grades are mainly located on offshore fields such as Safaniya, Manifa, and Zuluf.
Most Saudi oil production is considered to contain relatively high levels of sulphur. Saudi Aramco stated that the Saudi oil fields do not require the use of EOR techniques;
however, fields in the Neutral Zone could require steam flooding to obtain stranded oil.
The Ministry of Petroleum and Mineral Resources states the decline rates for existing in Saudi Arabia are closer to 2 to 3 percent per year. Saudi Aramco affirmed that it
shall conduct additional drilling operations at existing fields in order to help compensate for the natural declines from mature fields.
Saudi Arabia has the world's fifth largest proven natural gas reserves and stands second largest in GCC, but the production of natural gas remains limited in the country
due to the huge costs involved in exploration, production, processing, and distribution of gas. However, Saudi Arabia does not import or export natural gas. To meet the
consumption needs, Saudi Arabia resorts solely to domestic production. The Petroleum Ministry and Saudi Aramco announced a $9-billion strategy to add 50 Tcf of non-
associated reserves by 2016.
Saudi Aramco also launched its Upstream Unconventional Gas program in 2011 to gain access to Saudi Arabia’s unconventional gas resources.
The Arabiyah and Hasbah fields, located approximately 150 kilometres northeast of Jubail industrial city, are reported to contain high sulphur natural gas that will be
processed at the Khursaniyah gas plant. The high sulphur content makes them relatively costly to develop. The Wasit Gas Plant scheduled to be completed in mid 2014
is expected to contain a capacity of 2.5 Bcf/d and shall receive gas from the Arabiyah and Hasbah fields. Once constructed, it will be one of the largest gas plants built by
Saudi Aramco.
Saudi Aramco has four upstream joint ventures in the Empty Quarter or Rub al-Khali.
It is to be noted that, however, these ventures have not made significant commercial discoveries as the development costs involved would be significantly higher.

KINGDOM OF SAUDI ARABIA | DOWNSTREAM SECTOR
Processing – Saudi Aramco functions as the world's largest oil processing facility in the world at Abqaiq, located in eastern Saudi Arabia. It has a processing capacity of
more than 7 million bbl/d of crude. The plant processes the most of the Arab Extra Light and Arab Light crude oils, along with NGL. Almost two-thirds of Saudi crude is
processed at Abqaiq before delivery to refineries or to terminals for distribution or export.
Refining – According to the Oil and Gas Journal, Saudi Arabia has seven domestic refineries, with a combined crude capacity of around 2.1 million bbl/d. Saudi Arabia
along with large petrochemical complexes, such as Total, Chinese Petrochemical Corporation, continue to undertake its domestic refinery projects.
Saudi Arabia also has a refining capacity overseas of approximately 2 million bbl/d through its joint ventures in the United States, China, Japan, and the Philippines.
Saudi Refining, a subsidiary of Saudi Aramco, along with Royal Dutch/Shell own three Motiva joint-venture refineries in Louisiana and Texas. These three entities
currently have a total capacity of about 740,000 bbl/d.
Distribution: Saudi Arabia exported an estimated 7.5 million barrels per day of crude oil in 2012. Figure 4 depicts the export distribution of Saudi Arabia in 2012.
Saudi Arabia’s maximum crude oil export was accounted to be received by Far East Asia of an estimated amount of 54 percent of crude oil exports. Saudi Arabia is
ranked second to export petroleum to US, exporting 15% of total export. Saudi Arabia also exports to Europe and the Mediterranean region.
54% 15%
16%
15%
Crude Oil Export destinations Far East Europe Mediterranean US
Saudi Arabia has a number of other smaller terminals throughout the country.
Saudi Arabia has three major oil export terminals:
* The Ras Tanura export terminal is the world's largest offshore oil loading facility. More than 75
percent of Saudi Arabia's oil exports are loaded at the Ras Tanura Facility.
* The Ras al-Ju'aymah terminal.
* The Yanbu terminal on the Red Sea has a loading capacity of approximately 4.5 million bbl/d
crude and 2 million bbl/d for NGL.
Saudi Aramco operates more than 9,000 miles of petroleum pipelines throughout the country.
Two major domestic petroleum pipelines are –
* The East-West Pipeline which runs across Saudi Arabia from its Abqaiq facility to the Red Sea is
a 745 mile long petroline. The system consists of two pipelines: the 56-inch pipeline and the 48-
inch pipeline with a combined nameplate capacity of about 4.8 million bbl/d.
* The Abqaiq – Yanbu natural gas liquids pipeline has a capacity of 290,000 bbl/d, that serves
Yanbu's petrochemical plants.
The only functional international crude pipeline system has an average capacity of 228,000 bbl/d and
carries Arabian Light crude from the Abu Safah and Dammam fields to Bahrain.
STATE OF QATAR | OIL & GAS SECTOR PER GCC STATE
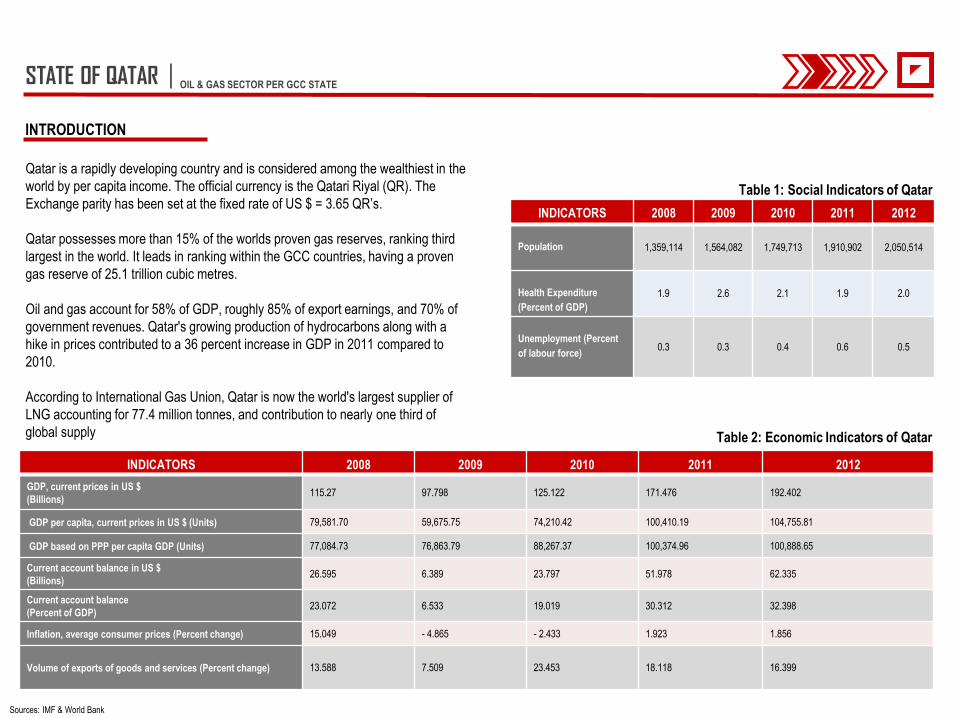
Qatar is a rapidly developing country and is considered among the wealthiest in the
world by per capita income. The official currency is the Qatari Riyal (QR). The
Exchange parity has been set at the fixed rate of US $ = 3.65 QR’s.
Qatar possesses more than 15% of the worlds proven gas reserves, ranking third
largest in the world. It leads in ranking within the GCC countries, having a proven
gas reserve of 25.1 trillion cubic metres.
Oil and gas account for 58% of GDP, roughly 85% of export earnings, and 70% of
government revenues. Qatar's growing production of hydrocarbons along with a
hike in prices contributed to a 36 percent increase in GDP in 2011 compared to
2010.
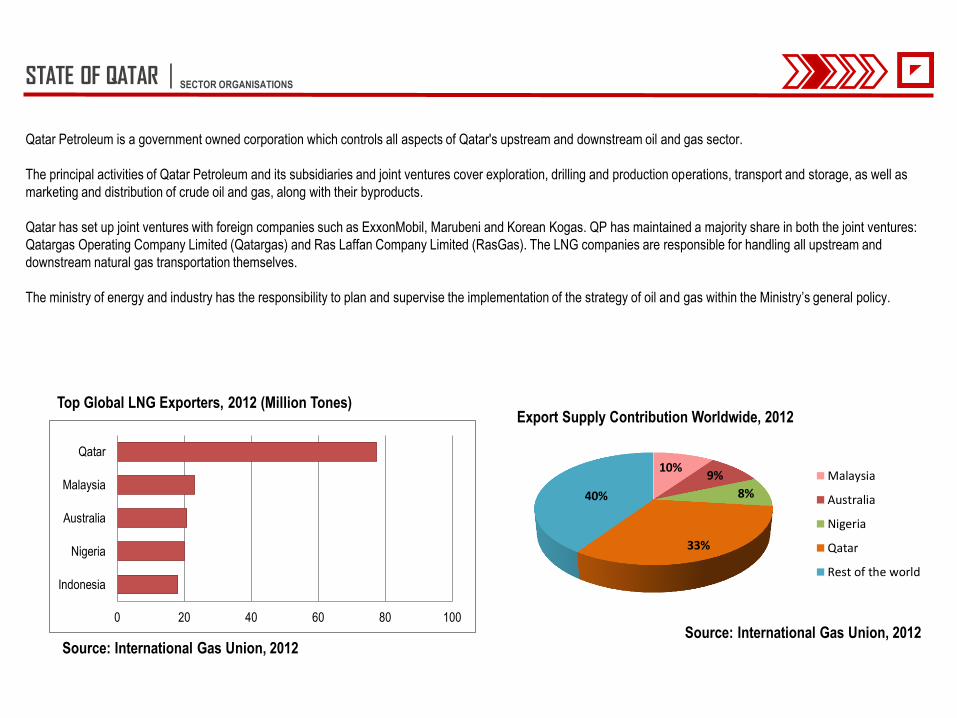
According to International Gas Union, Qatar is now the world's largest supplier of
LNG accounting for 77.4 million tonnes, and contribution to nearly one third of
global supply
Sources: IMF & World Bank
INTRODUCTION
Table 2: Economic Indicators of Qatar
INDICATORS 2008 2009 2010 2011 2012
GDP, current prices in US $
(Billions) 115.27 97.798 125.122 171.476 192.402
GDP per capita, current prices in US $ (Units) 79,581.70 59,675.75 74,210.42 100,410.19 104,755.81
GDP based on PPP per capita GDP (Units) 77,084.73 76,863.79 88,267.37 100,374.96 100,888.65
Current account balance in US $
(Billions) 26.595 6.389 23.797 51.978 62.335
Current account balance
(Percent of GDP) 23.072 6.533 19.019 30.312 32.398
Inflation, average consumer prices (Percent change) 15.049 - 4.865 - 2.433 1.923 1.856
Volume of exports of goods and services (Percent change) 13.588 7.509 23.453 18.118 16.399
INDICATORS 2008 2009 2010 2011 2012
Population 1,359,114 1,564,082 1,749,713 1,910,902 2,050,514
Health Expenditure
(Percent of GDP)
1.9 2.6 2.1 1.9 2.0
Unemployment (Percent
of labour force) 0.3 0.3 0.4 0.6 0.5
Table 1: Social Indicators of Qatar
Qatar Petroleum is a government owned corporation which controls all aspects of Qatar's upstream and downstream oil and gas sector.
The principal activities of Qatar Petroleum and its subsidiaries and joint ventures cover exploration, drilling and production operations, transport and storage, as well as
marketing and distribution of crude oil and gas, along with their byproducts.
Qatar has set up joint ventures with foreign companies such as ExxonMobil, Marubeni and Korean Kogas. QP has maintained a majority share in both the joint ventures:
Qatargas Operating Company Limited (Qatargas) and Ras Laffan Company Limited (RasGas). The LNG companies are responsible for handling all upstream and
downstream natural gas transportation themselves.
The ministry of energy and industry has the responsibility to plan and supervise the implementation of the strategy of oil and gas within the Ministry’s general policy.
0 20 40 60 80 100
Indonesia
Nigeria
Australia
Malaysia
Qatar10%
9%
8%
33%
40%
Malaysia
Australia
Nigeria
Qatar
Rest of the world
Source: International Gas Union, 2012
Source: International Gas Union, 2012
Top Global LNG Exporters, 2012 (Million Tones) Export Supply Contribution Worldwide, 2012
STATE OF QATAR | SECTOR ORGANISATIONS

STATE OF QATAR | UPSTREAM SECTOR
Production: The state plans to increase oil reserve and production capacity through Qatar Petroleum by developing the onshore and offshore fields. Qatar produced
850,000 bbl/d of crude oil, of which half of the crude oil production comes from Dukhan and Al-Shaheen fields, with production of 270,000 bbl/d and 300,000 bbl/d,
respectively.
However, the outputs at Dukhan have been on a decline. EOR techniques have been utilized for both these fields as well as for Bul Hanine, and Maydan Marjam.
Maersk, a Danish company, completed an expansion project in
2010 that increased Al Shaheen’s production capacity to
525,000 bbl/d. The state is presently developing its existing field
to increase its total production capacity to 1.2 million bbl/d from
current capacity of 950,000 bbl/d.
Qatar continues to expand production of natural gas for export
purposes. It accounted to produce 157 billion cubic meters of
gas in 2012, and leads within the GCC countries as illustrated
in the figure.
0
20
40
60
80
100
120
140
160
180
Qatar Saudi Arabia U.A.E Oman Kuwait Bahrain
Gas Production (Billion Cubic Meters)
According to Evaluate Energy Data, it is estimated Qatar Petroleum will be the world’s largest producer of LNG with nearly above 50 million
tonnes production by 2020.
Qatar Petroleum’s oil and gas fields fall into three categories:
• The North Gas Field – The North Gas Field is considered to be the largest single non-associated gas reservoir in the world with total
recoverable gas of more than 900 trillion standard cubic feet. Commercial exploration of North Field gas resources started in late 1991 with
initial gas production.
• Onshore oil – Dukhan oil field has production facilities to produce up to 335,000 barrels per day (b/d).
• Offshore oil – High quality crudes and associated gas are produced from the offshore Maydan Mahzam and Bul Hanine fields. QP operates
two offshore production stations on these fields. These two stations, PS-2 and PS-3, oil production was accounted to be 31.1 million barrels
(84,995 b/d) in 2008.
STATE OF QATAR | DOWNSTREAM SECTOR
Refining: Qatar currently has two refineries with a capacity of has 338,700 bbl/d, located in the major port cities of Umm Said and Ras Laffan. The Laffan refinery is
controlled by a consortium of investors: QP with a maximum share of 51 percent, followed by ExxonMobil and Total, and a few Japanese companies.
The refinery has a processing capacity of 146,000 barrels per stream day, and produces about 60,000 bbl/d of naphtha, 50,000 bbl/d of jet fuel, 25,000 bbl/d of premium
gas oil, and 10,000 bbl/d of LPG. Ras Laffan plans to expand its capacity by 2016 for refining purpose of growing condensate production.
Qatar is one of only three countries to have operational Gas to Liquids facilities to turn natural gas into liquid fuels such as low-sulfur diesel and naphtha, among other
products.
Pipelines and Terminals: National Oil Distribution Company operates Qatar's oil pipeline network, which delivers supplies from oil fields to Qatar's export terminals and
refineries. Qatar has three major export terminals. QP's offshore pipeline network brings crude oil from offshore oil fields to Halul Island where oil is processed for export.
The Onshore pipeline brings most oil to the Mesaieed export terminal for refining processes or cross border distribution. Ras Laffan is used primarily for the export of
liquefied natural gas.
Qatar is the supplier for the Dolphin Project, which connects natural gas networks from Qatar north field to the UAE and Oman. The pipeline has a capacity of 3.2 Bcf/d
although currently it exports only about 2 Bcf/d from Qatar.

KUWAIT | OIL & GAS SECTOR PER GCC STATE
Kuwait is a geographically small, but is the second wealthiest economy in the GCC
with per capita GDP of around US $47,600 in 2012.
The economy has a crude oil reserve of about 102 billion barrels accounting to
about 7% of world reserves. Petroleum accounts for nearly half of GDP, 95% of
both export revenues, and government income.
Kuwait is the world's sixth largest oil reserves and is one of the top ten global
producers and exporters of total petroleum liquids.
Through Project Kuwait, their goals are to increase oil production to 4 million barrels
per day by 2020 and also targets to achieve 4 billion cubic feet of gas output per
day by 2030. The currency of the country is the Kuwaiti Dinar. The native and
official language is Arabic.
Sources: IMF & World Bank
INTRODUCTION
Table 2: Economic Indicators of Kuwait
INDICATORS 2008 2009 2010 2011 2012
GDP, current prices in US $
(Billions) 147.391 105.974 119.932 160.671 184.54 e
GDP per capita, current prices in US $ (Units) 42,823.70 30,409.57 33,481.36 43,637.84 48,761.24 e
GDP based on PPP per capita GDP (Units) 40,463.68 37,421.35 35,973.64 37,934.70 39,873.76 e
Current account balance in US $
(Billions) 60.244 28.288 36.954 67.175 79.768
Current account balance
(Percent of GDP) 40.874 26.693 30.812 41.809 43.225 e
Inflation, average consumer prices (Percent change) 6.3 4.61 4.496 4.905 3.199
Volume of exports of goods and services (Percent change) 2.21 -6.344 -0.497 13.479 12.185 e
INDICATORS 2008 2009 2010 2011 2012
Population 2,702,221.
0
2,850,102.
0
2,991,580.
0
3,124,705.
0 3,250,496.0
Health Expenditure
(Percent of GDP)
1.9 3.8 2.6 2.7 --
Unemployment (Percent
of labour force) 1.8 1.6 1.8 3.6 --
Table 1: Social Indicators of Kuwait
KUWAIT | SECTOR ORGANISATIONS
Kuwait Petroleum Corporation, Kuwait's national oil company, and its subsidiaries are in charge to control and for the development of the entire oil sector. Kuwait's gas
sector is also managed by the Kuwait Petroleum Corporation also looks into the natural gas sector The Ministry of Petroleum looks into all aspects of policy
implementation in the upstream and downstream portions of both the oil and natural gas sectors.
The Kuwait Petroleum Corporation supervises domestic and foreign oil investments, whereas, Kuwait Oil Company (KOC) manages all upstream development in the oil
and gas sectors. The Kuwait National Petroleum Company (KNPC) controls the downstream sector, while the Petrochemical Industries Company (PIC) is in charge of the
petrochemical sector.
Export operations are overseen by both KNPC and the Kuwait Oil Tanker Company (KOTC). International upstream development and downstream operations are
directed by Kuwait Petroleum International (KPI).
KUWAIT | UPSTREAM SECTOR
Exploration and Production – Kuwait has put into practice the EOR measures to enhance stagnant production rates. New discoveries have been made; however, due to
fiscal and political climate and resultanttight regulations in oil sector, exploration and production have faced hindrances. Not much progress has been made in exploring
the offshore fields, thereby; Kuwait’s major focus is on non associated natural gas discoveries in the north. KOC initially negotiated with ExxonMobil, Shell, and Total for
the development of Al – Ratqa field, but it subsequently dropped plans for the development programme.
In 2011, over half of Kuwaiti crude production came from the Burgan field. Kuwait's second largest source of crude production is from the northern Raudhatain field, with
a capacity of 350,000 to 400,000 bbl/d. In 2012, Kuwait's total oil production was approximately 2.8 million barrels per day (bbl/d), out of which 2.6 million bbl/d was
crude oil and the rest being non-crude liquids. Production centers in the south include Umm Gudair, Minagish, and Abduliyah.
KPC announced a $100-billion capital spending plan covering both the upstream as well as the downstream sectors. The plans include expenditure to upgrade Kuwait's
production, expand exploration, and build downstream facilities and export infrastructure, both domestically and abroad. This effort is expected to boost total oil
production capacity to 4 million bbl/d by 2020.
In 2009, light crude and associated natural gas were discovered at the Mutriba oil field to. It is estimated that 80,000 bbl/d are expected from this field by 2014.
Project Kuwait aims to increase the country's oil production capacity from Raudhatain, Sabriya, al-Ratqa, and Abdali. It targets a 1 million bbl/d of output from the fields
by 2015. Another component of this project is a focus on heavy oil, providing a predictable 60,000 bbl/d by 2016 and 270,000 bbl/d by 2020.
Kuwait is focusing on the discovery of natural gas resources to reduce imports of liquefied natural gas (LNG). KOC has announced gas production target of 4 Bcf/d by
2030, which is about four times the present production level.
Majority of Kuwait's gas production consists of associated natural gas. In 2010, approximately 1 billion cubic feet per day was produced from associated gas, while non-
associated gas production amounted to only 150-200 million cubic feet per day. However, it is to be noted, that KPC intends to increase the production of non-associated
natural gas from the north to about 400 million cubic feet per day by 2020.
KUWAIT | DOWNSTREAM SECTOR
Processing and Refining : Kuwait has derived its production capacity from three refinery complexes: Al – Ahmadi, Abdullah, and Al – Shuaiba. All of the refineries are
owned and controlled by Kuwait National Petroleum Company. The largest refinery, Mina al-Ahmadi, has a capacity of 466,000 bbl/d, followed by Mina Abdullah and al –
Shuaiba having capacities of 270,000 bbl/d and 200,000 bbl/d, respectively. Oil & Gas Journal reports Kuwait’s refining capacity at 936,000 bbl/d; the third – largest
capacity in the Middle East.
Kuwait is expanding its gas processing facility to meet domestic demand. Daelim, a South Korean company is currently engineering and constructing Kuwait's largest gas
processing plant with a capcity of 800 MMcf/d.
Kuwait has its refinery expansion interests in Asia due to potential growth in demand, particularly in China, Vietnam, and Indonesia. In 2011, KPC received the final
approval from Chinese government for a refinery and petrochemical joint venture in China.
Kuwait Petroleum International manages KPC's refining operations internationally. Its operations include approximately 4,000 retail stations across Belgium, Spain,
Sweden, Luxembourg, and Italy. KPI has shares in two refining units. It owns a 80,000 bbl/d refinery in Netherlands, and a 50% joint venture in Italy with ENI having a
refinery capacity of 240,000 bbl/d. Kuwait aims to increase its exports from 200,000 bbl/d to 500,000 bbl/d with the completion of the refinery.
In June 2011, Kuwait's Supreme Petroleum Council approved two projects: the Clean Fuels Project and the Al – Zour refining facility. These two projects have an
estimated combined cost of $30.5 billion.
The Al Zour project is expected to process an output of 615,000 barrels of oil per day, once its fully functional in 2018. If achieved, it shall be exceeding the capacity of
Saudi Arabia’s Ras Tanura plant having a capacity of 550,000 barrels of oil per day, which is at present the largest refinery in the Middle East
The Clean Fuels Project will revamp and upgrade Kuwait's existing refineries. The purpose of the CFP project is to increase refining capacities by 64,000 barrels per day
jointly on Mina Al-Ahmadi and Mina Abdullah, improve the operations and efficiency of the refineries, optimize production of hydrocarbon products, produce fuels with low
sulfur content, and reduce the carbon dioxide emissions. The plans also include building a new al – Zour refinery, shutting down of old units including al-Shuaiba refinery,
and installing new components at the remaining refineries. The Al – Zour refinery is estimated to add additional 615,000 bbl/d of capacity by 2018.
Pipelines and Terminals: Most Kuwaiti crude oil is sold on term contracts. Mina al-Ahmadi is the main port for the export of crude oil. Kuwait also has oil export terminals
at Mina Abdullah, Shuaiba, and at Mina al – Zour. Construction of a new terminal on Bubiyan Island has been in planning stages due to increase in production in the
northern fields.
Kuwait’s consumption of natural gas has been more than its production. Kuwait takes delivery of the LNG at the regasification terminal, Mina al-Ahmadi Gas Port. The
regasification capacity of al-Ahmadi is approximately 500 MMcf/d of LNG.
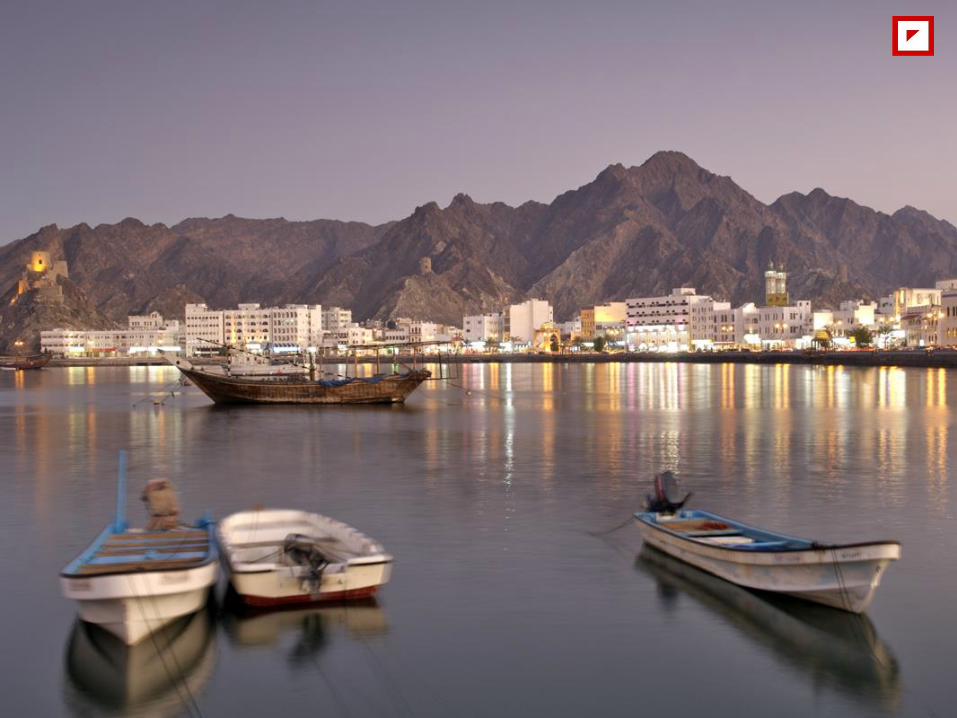
SULTANATE OF OMAN | OIL & GAS SECTOR PER GCC STATE
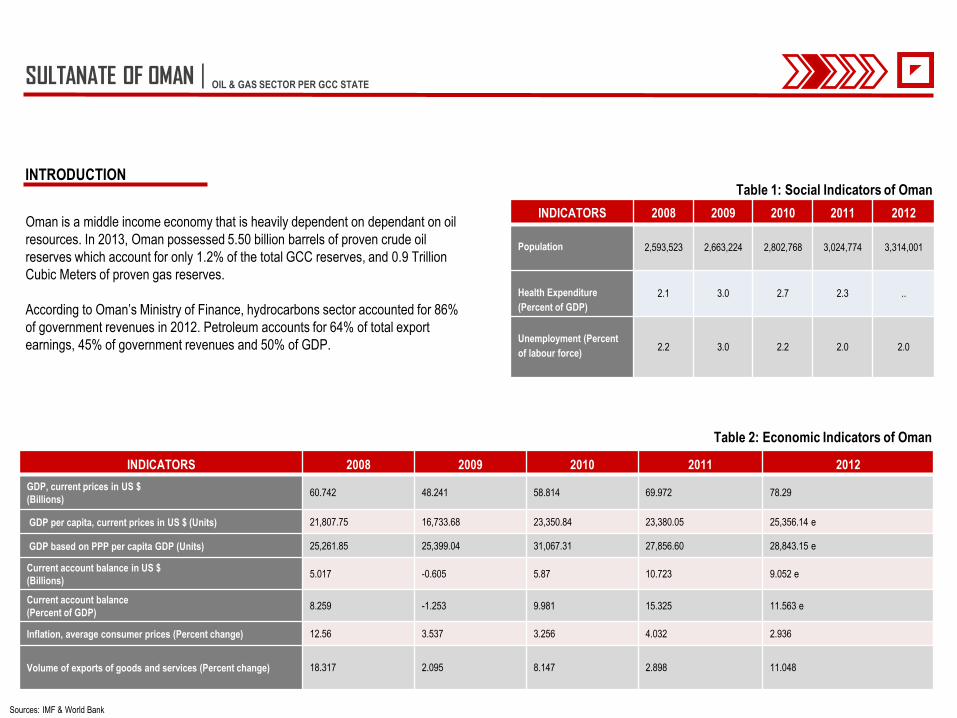
Oman is a middle income economy that is heavily dependent on dependant on oil
resources. In 2013, Oman possessed 5.50 billion barrels of proven crude oil
reserves which account for only 1.2% of the total GCC reserves, and 0.9 Trillion
Cubic Meters of proven gas reserves.
According to Oman’s Ministry of Finance, hydrocarbons sector accounted for 86%
of government revenues in 2012. Petroleum accounts for 64% of total export
earnings, 45% of government revenues and 50% of GDP.
Sources: IMF & World Bank
INTRODUCTION
Table 2: Economic Indicators of Oman
INDICATORS 2008 2009 2010 2011 2012
GDP, current prices in US $
(Billions) 60.742 48.241 58.814 69.972 78.29
GDP per capita, current prices in US $ (Units) 21,807.75 16,733.68 23,350.84 23,380.05 25,356.14 e
GDP based on PPP per capita GDP (Units) 25,261.85 25,399.04 31,067.31 27,856.60 28,843.15 e
Current account balance in US $
(Billions) 5.017 -0.605 5.87 10.723 9.052 e
Current account balance
(Percent of GDP) 8.259 -1.253 9.981 15.325 11.563 e
Inflation, average consumer prices (Percent change) 12.56 3.537 3.256 4.032 2.936
Volume of exports of goods and services (Percent change) 18.317 2.095 8.147 2.898 11.048
INDICATORS 2008 2009 2010 2011 2012
Population 2,593,523 2,663,224 2,802,768 3,024,774 3,314,001
Health Expenditure
(Percent of GDP)
2.1 3.0 2.7 2.3 ..
Unemployment (Percent
of labour force) 2.2 3.0 2.2 2.0 2.0
Table 1: Social Indicators of Oman

SULTANATE OF OMAN | SECTOR ORGANISATIONS
The Ministry of Oil and Gas of Oman coordinates the country's hydrocarbon sectors. Petroleum Development Oman (PDO) holds the vast majority of Oman's oil reserves
and is responsible for 70% of its production. The Oman Oil Company (OOC) is a commercial company fully owned by the government, which is responsible for
investments in energy sector both within and outside of Oman. The Oman Oil Refineries and Petroleum Industries Company (ORPIC), owned by OOC and Government
of Oman, control the country's refining sector and own both of Oman's operating refineries.
PDO has a much greater involvement in the natural gas sector, accounting for virtually all of Oman's natural gas supply. The Oman Gas Company (OGC) directs the
country's natural gas transmission and supply systems. Oman Liquefied Natural Gas (OLNG) operates all liquefied natural gas activities in Oman.
Due to the technical difficulties in the process of oil production in Oman, the government has offered foreign companies with exploration and production projects, and the
development of fields as they require efficient technology and expertise. Occidental Petroleum is the second largest oil producer in Oman.
SULTANATE OF OMAN
| UPSTREAM SECTOR
Exploration and Production – Oman's average annual crude oil production peaked in 2000 at 970,000 barrels per day (bbl/d), but dropped to 713,000 bbl/d in 2007 due to
declining production at the country's fields. After continuous decline in oil production from early 2000s, as shown in Figure 9, Oman adopted EOR techniques such as
stream injection 2007 onwards which resulted in enhancing oil production to 922 thousand barrels per day in 2012.
In November 2012, the first offshore production in the country occurred in Block 8 off the coast of the Musandam Peninsula. According to the Ministry of Oil and Minerals,
in 2013, there were 28 exploration and production blocks in Oman. Most of Oman's oil production comes from the Oman Basin. There are also a few small fields in the
northern exclave; all of them are located offshore.
Oman's government aimed to produce an average of 940,000 bbl/d in 2013, and to continue the same level of production for the next five years.
EOR techniques are vital to Oman's future production and development plan.
Miscible gas injection involves pumping gas that dissolves in the oil facilitating higher flow rates. The use of this technique at Harweel oil field cluster in their operations
could produce an additional 40,000 bbl/d.
The use of thermal EOR methods facilitates the flow of heavier oil to the well. They are being installed at Mukhaizna, Marmul, Amal East and West and Qarn Alam fields.
Thermal EOR Thermal EOR could increase production at both Amal-East and Amal-West to 23,000 bbl/d by 2018.
The steam injection at Qarn Alam is estimated to increase production by 40,000 bbl/d by 2015.
Injecting polymer fluid is more effective at Marmul Project due to its heavy grade of crude characteristic.
The discovery of Al – Ghubar South in 2009 has been an immense sign of success for Oman over the years. According to the Ministry of Oil and Gas, Al – Ghubar
South is expected to add 1 billion barrels to reserves.
Since 2000, the opening of the Oman LNG facility has helped stimulate Oman's dry natural gas production, which grew tremendously between 2000 and 2011,
accounting to about 65%.
It is expected that Khazzan – Makarem field has a high growth potential for natural gas production. The development plan estimates that the field shall begin
production in 2017.

SULTANATE OF OMAN
| DOWNSTREAM SECTOR
Refining – The consumption of transportation fuel has almost doubled between 2006 and 2012. Oman is currently no longer able to meet the country's domestic demand
for transportation fuels due to limited refining capacity.
At present, Oman has two operating refineries, Mina al Fahal and Sohar. It has a combined nameplate capacity of 222,000 bbl/d. There are plans to upgrade the capacity
at Sohar by expanding the facility to nearly 200,000 bbl/d. Oman also plans to build a refinery near Duqm with a capacity of 230,000 bbl/d, as well as a 200 million barrel
crude oil storage facility. Oman aims to take advantage of its attractive location on the Arabian Peninsula by expanding its refining and storage facilities.
Pipelines and Terminals – The only international pipeline of the country is the Dolphin pipeline which runs from Qatar to Oman via the United Arab Emirates. Oman does
not have any international oil pipelines of own. However, In August 2013, Oman signed a memorandum of understanding with Iran on a natural gas import contract. If
executed, it would be a 25 year supply dealing starting in 2015 and will connect the two countries via a pipeline under the Gulf of Oman.
Oman also plans to expand the country's domestic pipeline infrastructure. It is also proposed to build a pipeline that connects the planned storage terminal at Duqm with
the existing export infrastructure of the country. The storage terminal would be one of the world's largest, and its location outside the Strait of Hormuz would make it a
profitable investment.
Oman Tank Terminal Co LLC (OTTCO), a partnership between Oman Oil Co (OOC), and Takamul Investment Company, was established to build and operate the large
oil terminal at Ras Markaz with a storage capacity of 200 million barrels. The terminal in Ras Markaz, once constructed, will be the largest storage facility in the Middle
East and one of the biggest in the world.
It will be considered as an important hub in the Middle East for crude storage and trading, on the lines of Singapore and Rotterdam. The pipeline connecting the Ras
Markaz terminal and the main line at Nahada will be a 440 km long crude oil pipeline, while the pipeline connecting Ras Markaz terminal with Duqm refinery will be 70 km
long

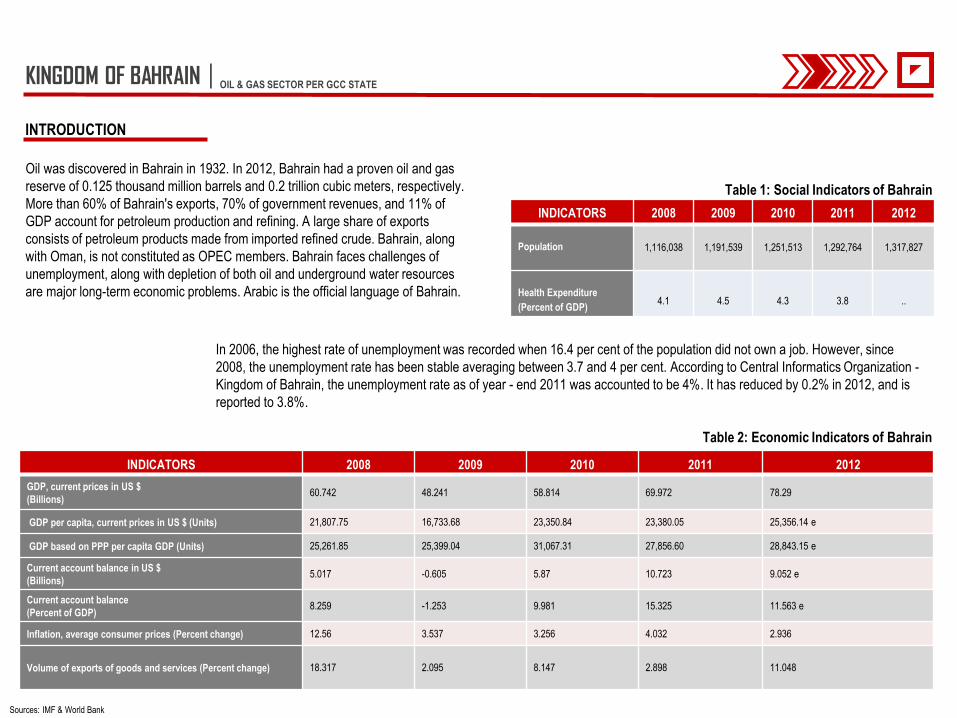
KINGDOM OF BAHRAIN | OIL & GAS SECTOR PER GCC STATE
Oil was discovered in Bahrain in 1932. In 2012, Bahrain had a proven oil and gas
reserve of 0.125 thousand million barrels and 0.2 trillion cubic meters, respectively.
More than 60% of Bahrain's exports, 70% of government revenues, and 11% of
GDP account for petroleum production and refining. A large share of exports
consists of petroleum products made from imported refined crude. Bahrain, along
with Oman, is not constituted as OPEC members. Bahrain faces challenges of
unemployment, along with depletion of both oil and underground water resources
are major long-term economic problems. Arabic is the official language of Bahrain.
Sources: IMF & World Bank
INTRODUCTION
Table 2: Economic Indicators of Bahrain
INDICATORS 2008 2009 2010 2011 2012
GDP, current prices in US $
(Billions) 60.742 48.241 58.814 69.972 78.29
GDP per capita, current prices in US $ (Units) 21,807.75 16,733.68 23,350.84 23,380.05 25,356.14 e
GDP based on PPP per capita GDP (Units) 25,261.85 25,399.04 31,067.31 27,856.60 28,843.15 e
Current account balance in US $
(Billions) 5.017 -0.605 5.87 10.723 9.052 e
Current account balance
(Percent of GDP) 8.259 -1.253 9.981 15.325 11.563 e
Inflation, average consumer prices (Percent change) 12.56 3.537 3.256 4.032 2.936
Volume of exports of goods and services (Percent change) 18.317 2.095 8.147 2.898 11.048
INDICATORS 2008 2009 2010 2011 2012
Population 1,116,038 1,191,539 1,251,513 1,292,764 1,317,827
Health Expenditure
(Percent of GDP)
4.1
4.5
4.3
3.8
..
Table 1: Social Indicators of Bahrain
In 2006, the highest rate of unemployment was recorded when 16.4 per cent of the population did not own a job. However, since
2008, the unemployment rate has been stable averaging between 3.7 and 4 per cent. According to Central Informatics Organization -
Kingdom of Bahrain, the unemployment rate as of year - end 2011 was accounted to be 4%. It has reduced by 0.2% in 2012, and is
reported to 3.8%.
KINGDOM OF BAHRAIN | SECTOR ORGANISATIONS
Established in 2005, The National Oil and Gas Authority (NOGA) plays a crucial role in the functioning of Bahrain’s oil and gas sector and adoption of policies and
practices. NOGA has 9 companies under it fulfilling its responsibilities as per the role assigned
The Companies are:
1. National Oil and Gas Holding Company: Established in 2007, NOGA Holding is the investment and development arm of the NOGA and plays a primary role in the
implementation of the strategic plans of the government’s investment. NOGA holding creates value for existing companies by enlarging their portfolio
2. The Bahrain Petroleum Company: BAPCO, established in 1929, is a wholly owned company by the Government of Bahrain. It is engaged in exploration, drilling,
production, refining of petroleum products and natural gas. It is also engaged in the distribution and export of crude oil and refined petroleum products
3. The Bahrain National Gas Company: BANAGAS is majority owned by the government, accounting for 75%; Chevron, Bahrain and Arab Petroleum Investment
Corporation hold rest of the ownership equally. The Company’s primary objectives are the processing of associated gas into marketable products, and supplying
residue gas for local industrial use
4. Bahrain National Gas Expansion Company: Founded in 2008, Bahrain National Gas Expansion Company is wholly owned by Bahrain government. The company
operates and manages the expansion to increase its production capacity. The project included the establishment of two new plants, a gas extraction facility for LPG
and naphtha, and a cooling unit in the storage area for pasteurization
5. Gulf Petrochemical Industries Company: The Gulf Petrochemical Industries is a joint venture of the petrochemical industries of Kuwait, the Saudi Basic Industries
Corporation, and the Government of Bahrain. The project consisted of the construction of two plants. The plant produces ammonia and methanol for export. Each
plant has a capacity of 1,200 tonnes a day.
6. Bahrain Aviation Fuelling Company: Bahrain Aviation Fuelling company (BAFCO) is a joint partnership between NOGA Holding Company, Chevron, and BPME.
Its main shareholder is NOGA Holding Company with 60 per cent stake. BAFCO is responsible for all re-fuelling operations at the Bahrain International Airport.
7. Bahrain Lubricant Base Oil Company: Bahrain Lube Base Oil Company (BLBOC) is a joint venture company with three shareholders: NOGA Holding and BAPCO
together own 55% equity and Neste Oil Company of Finland with 45% equity. It is designed to produce up to 400,000 metric tons per year. It is considered as one of
the key aspirations of Bahrain. The company engages in export facilities at the BAPCO refinery, referred to as Lube Base Oil Project
8. Tatweer Petroleum Company: The Company’s primary goals are to increase the production of oil and the availability of gas to meet the future energy demands of
the Kingdom of Bahrain. The key area of Tatweer Petroleum is production and field development. It utilizes the latest enhanced oil recovery techniques to boost oil
output and to meet the nation’s economic vision by 2030.
9. Skaugen Gulf Petchem Carriers: Launched in 2010, Skaugen Gulf Petchem Carriers primary objective is to transport petrochemicals and liquefied natural gas.
KINGDOM OF BAHRAIN
| UPSTREAM SECTOR
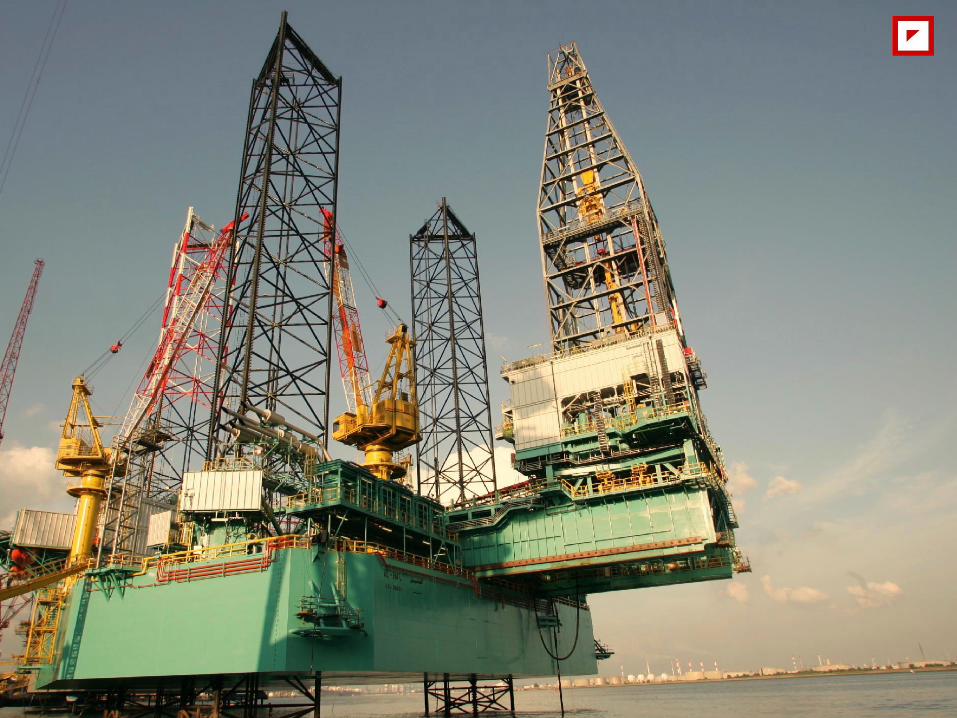
Exploration and Production – BAPCO carries out extensive studies with the use of advanced techniques and methods to explore new oil and gas reserves. The Bahrain
Oil Field measures approximately 15 kms long and 5 kms wide. The shallowest oil reservoirs of the Bahrain Field – Aruma (blue shale) and Mishrif (rubble) – are 1,250
feet below the surface. The deepest oil reservoir – Dhruma (Fadhili) – lies at a depth of 6,500 feet. Gas reservoirs start at 2,000 feet (Wara), continue to 8,800 feet (Khuff)
and then extend to 13,000 feet (Tawil).
The application of EOR recovery techniques and drilling of over 900 new wells to the Bahrain field will double the oil production over the coming years. In 2011, Tatweer
petroleum implemented the first steam injection pilot to extract heavy oil from the Rubble reservoir, along with a waterflood pilot in the Mauddud reservoir.
To maintain oil production at an optimum level, advanced drilling techniques are applied to new as well as existing wells. In 2012, Tatweer Petroleum tremendously
improved the economy’s total oil and condensate production averaging 45,300 bpd, and black oil production averaging 40,700 bpd.
Four Khuff gas wells were also successfully drilled. Due to rising demand by industry, BAPCO has expanded its gas facilities and increased its natural gas production
capacity.
KINGDOM OF BAHRAIN
| DOWNSTREAM SECTOR
Processing and Refining – The Associated Gas Project, a US $100 million project, included the construction of a processing plant to recover Propane, Butane and
Naphtha, and a storage area at Sitra.
The Bahrain Refinery refines over 250,000 barrels of crude every day. About one-sixth of this crude originates from Bahrain Field; the balance is pumped from Saudi
Arabia. Bahrain Refinery also refines 40,000 barrels per day of low sulphur diesel.
BAPCO plans to upgrade the Sitra refinery in 2015 to boost its capacity to 360,000 barrels a day from 267,000 barrels currently. The total estimated investment on the
expansion is expected to be US $6.5 billion. The upgradation process is expected to complete in 2019. BAPCO also plans to construct a 70km pipeline to connect Ras
Tanura refinery in Saudi Arabia to Sitra.
Pipelines and Terminals – BAPCO is engaged in a marketing terminal, and a marine terminal for its petroleum products.
Saudi Arabia and Bahrain share crude production of the 300,000 bbl/d Abu Safah offshore field in Saudi Arabia, which is connected to Bahrain's Sitra refinery via pipeline.
Bahrain intends to replace the previous pipeline system from Saudi Arabia with a planned new 71 mile Arabia pipeline, holding capacity 350,000 bbl/d of Arabian light
crude. The pipeline runs between the Abqaiq complex in Saudi Arabia and Bahrain's refinery at Sitra.
The Kingdom also intends to build and operate its first LNG receiving terminal to supplement domestic production and to ensure demand can be met.
Sitra is an island in the Central Governorate of Bahrain, east of Bahrain Island in Persian Gulf
GLOBAL OIL DEMAND VS GLOBAL OIL PRICES | VARAITION ANALYSIS
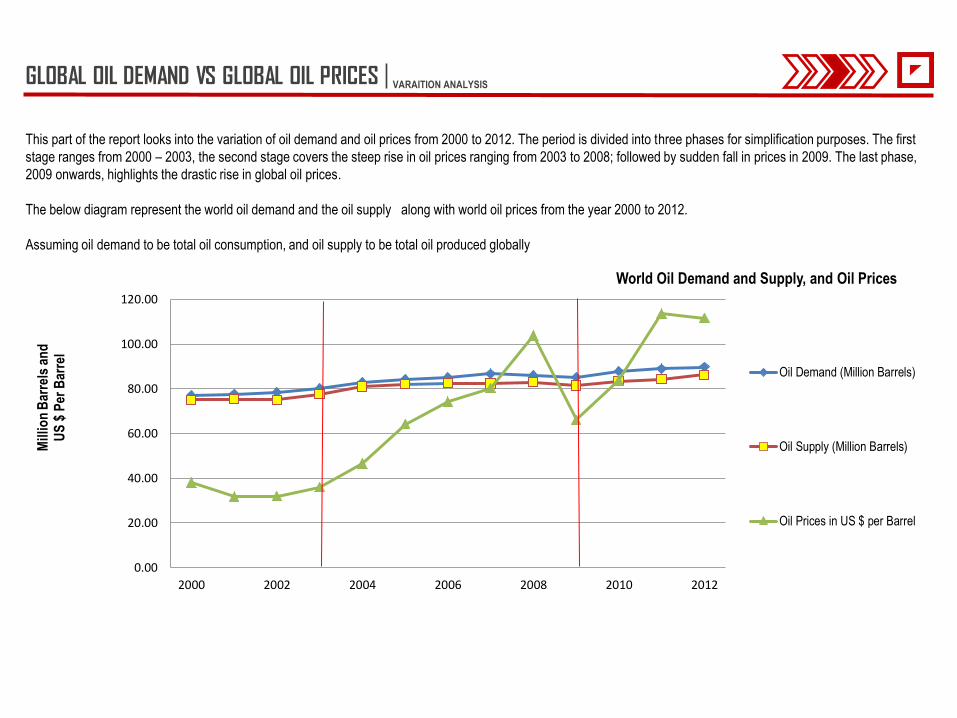
This part of the report looks into the variation of oil demand and oil prices from 2000 to 2012. The period is divided into three phases for simplification purposes. The first
stage ranges from 2000 – 2003, the second stage covers the steep rise in oil prices ranging from 2003 to 2008; followed by sudden fall in prices in 2009. The last phase,
2009 onwards, highlights the drastic rise in global oil prices.
The below diagram represent the world oil demand and the oil supply along with world oil prices from the year 2000 to 2012.
Assuming oil demand to be total oil consumption, and oil supply to be total oil produced globally
0.00
20.00
40.00
60.00
80.00
100.00
120.00
2000 2002 2004 2006 2008 2010 2012
Mil
lio
n B
arre
ls a
nd
U
S $
Per
Bar
rel
Oil Demand (Million Barrels)
Oil Supply (Million Barrels)
Oil Prices in US $ per Barrel
World Oil Demand and Supply, and Oil Prices
GLOBAL OIL DEMAND VS GLOBAL OIL PRICES | VARAITION ANALYSIS
Based on the previous diagram, the price variation has been broken down into 3 stages. Illustrated by the red lines across the graph:
Stage I – 2000 to 2003: The price rose continuously throughout 2000 due to growth in US as well as world economies. In spite of increasing OPEC oil production quotas
to 3.2 million barrels per day between April and October in 2000, increase in oil prices could not be prevented. Prices, however, started falling November onwards when
oil production quota was boosted by 500,000 barrels. In 2001, weak US economy and increases in non – OPEC oil production put downward pressure on prices. During
this period, WTI prices were stable. World oil prices remained in a stable range during this period.
Stage II – 2003 to 2008: Prices began to rise due to improved US economy, as well as increasing demand from China and other emerging economies. The oil prices
began rising in October 2003 and this phenomenon continued in 2004 and 2005. The 2004 price rise was caused due to two factors: unexpected strong demand growth
in China, and oil supply problems.
2007 and 2008 was characterized by extreme price volatility. Major contributing factors included significant growth in financial investment in oil; a falling US dollar;
growing demand from emerging economies; geopolitical instability; and, slow non – OPEC production growth. Oil price reached record high levels in July 2008. The
condition consequently changed considerably, oil price collapsed by more than 75% by the end of the year, and remained so throughout.
Stage III – 2009 to 2012: Oil demand was heavily impacted and oil prices dropped from a high of over US $100 in 2008, to below US $70 per barrel by 2009. From 2009
to 2010, oil prices began to increase due to improve in global economy and reduction in OPEC supply. The combined demand of the China and India jumped by 92%
over the last decade, and their share of global demand rose to almost 14% in 2010. In 2011, oil price increased due to the prevalent geo-political events in the MENA
region reaching US $ 113.56 per barrel. According to OPEC, the price of oil in 2011 generally moved in accordance to macroeconomic sentiments. However, in 2012, oil
prices experienced a slight fall accounting to US $ 111.67 per barrel. The down trend continued in 2013 as well, accounting for US $109.95 per barrel.
West Texas Intermediate (WTI), also known as Texas light sweet, is a grade of crude oil used as a benchmark in oil pricing.

GLOBAL OIL DEMAND VS GLOBAL OIL PRICES | VARAITION ANALYSIS
The above diagram, represents the global oil demand variation between 2000 and 2012.
Until the mid – 2000s, US’s consumption of oil was rising. Only post 2004, there was a stagnation in growth for oil demand. The recession in 2008 led to a steep drop in oil
demand. It was in 2010 were in oil consumption looked to recover; however, in 2011 oil consumption experienced a downfall, and has been continuing in the same mode.
The reason for the same could be due to the steep rise in natural gas proven reserves. Cheap natural gas made natural gas powered vehicles economically viable,
leading to shift in consumer preferences. A similar downtrend was observed in European countries as well.
South American and Asian countries responded differently. The declines were substantially smaller and in some cases noted an increase. Such heterogeneity could be
due to the reason that emerging economies are commodity exporters that benefit from higher terms of trade. While Asian countries are highly correlated to emerging
aspect, three of the South American countries (Argentina, Chile, and Mexico) are slightly more correlated with the developed aspect than with the emerging factor.
-2
0
2
4
6
8
10
12
14
North America South & Cent.America
Europe & Eurasia Middle East Africa Asia Pacific World
Variation in the Oil demand between 2000 and 2012:
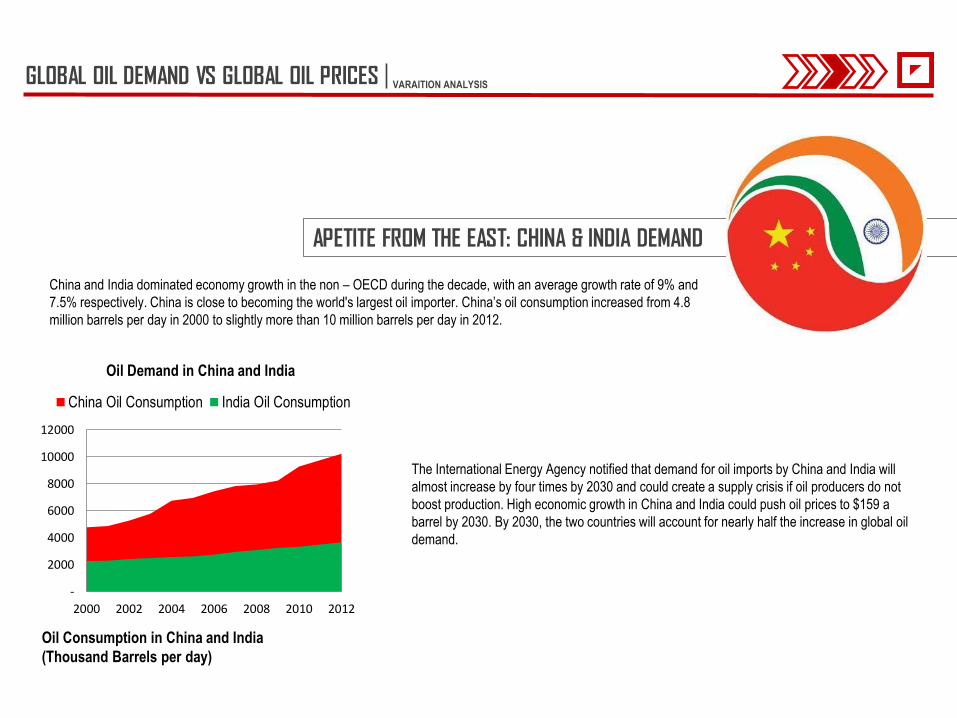
China and India dominated economy growth in the non – OECD during the decade, with an average growth rate of 9% and
7.5% respectively. China is close to becoming the world's largest oil importer. China’s oil consumption increased from 4.8
million barrels per day in 2000 to slightly more than 10 million barrels per day in 2012.
GLOBAL OIL DEMAND VS GLOBAL OIL PRICES | VARAITION ANALYSIS
APETITE FROM THE EAST: CHINA & INDIA DEMAND
Oil Consumption in China and India
(Thousand Barrels per day)
-
2000
4000
6000
8000
10000
12000
2000 2002 2004 2006 2008 2010 2012
Oil Demand in China and India
China Oil Consumption India Oil Consumption
The International Energy Agency notified that demand for oil imports by China and India will
almost increase by four times by 2030 and could create a supply crisis if oil producers do not
boost production. High economic growth in China and India could push oil prices to $159 a
barrel by 2030. By 2030, the two countries will account for nearly half the increase in global oil
demand.

INDUSTRY GROWTH VS ECONOMIC GROWTH | VARAITION ANALYSIS
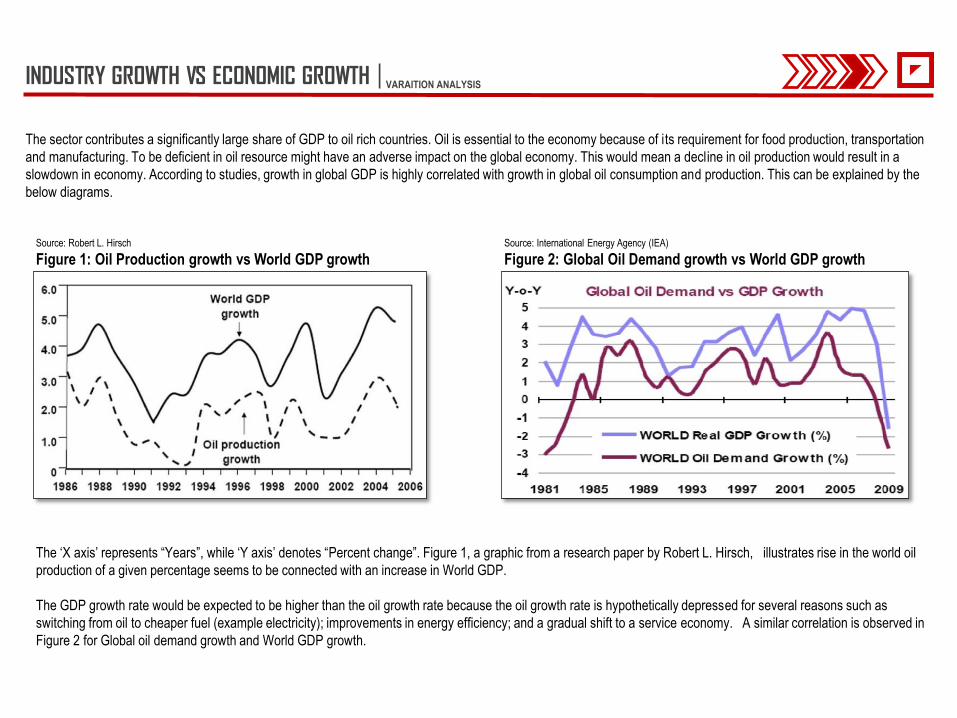
The sector contributes a significantly large share of GDP to oil rich countries. Oil is essential to the economy because of its requirement for food production, transportation
and manufacturing. To be deficient in oil resource might have an adverse impact on the global economy. This would mean a decline in oil production would result in a
slowdown in economy. According to studies, growth in global GDP is highly correlated with growth in global oil consumption and production. This can be explained by the
below diagrams.
The ‘X axis’ represents “Years”, while ‘Y axis’ denotes “Percent change”. Figure 1, a graphic from a research paper by Robert L. Hirsch, illustrates rise in the world oil
production of a given percentage seems to be connected with an increase in World GDP.
The GDP growth rate would be expected to be higher than the oil growth rate because the oil growth rate is hypothetically depressed for several reasons such as
switching from oil to cheaper fuel (example electricity); improvements in energy efficiency; and a gradual shift to a service economy. A similar correlation is observed in
Figure 2 for Global oil demand growth and World GDP growth.
Source: Robert L. Hirsch
Figure 1: Oil Production growth vs World GDP growth Source: International Energy Agency (IEA)
Figure 2: Global Oil Demand growth vs World GDP growth

GCC HYDROCARBON SECTOR OUTLOOK & FUTURE | CONCLUSIVE REMARKS
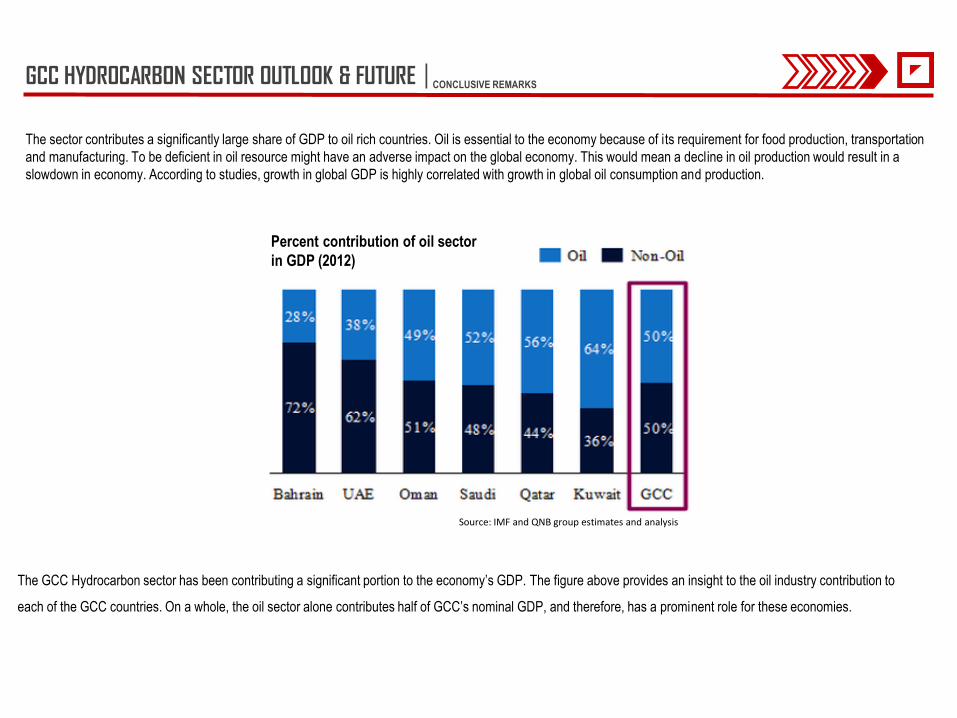
The sector contributes a significantly large share of GDP to oil rich countries. Oil is essential to the economy because of its requirement for food production, transportation
and manufacturing. To be deficient in oil resource might have an adverse impact on the global economy. This would mean a decline in oil production would result in a
slowdown in economy. According to studies, growth in global GDP is highly correlated with growth in global oil consumption and production.
The GCC Hydrocarbon sector has been contributing a significant portion to the economy’s GDP. The figure above provides an insight to the oil industry contribution to
each of the GCC countries. On a whole, the oil sector alone contributes half of GCC’s nominal GDP, and therefore, has a prominent role for these economies.
Percent contribution of oil sector
in GDP (2012)
Source: IMF and QNB group estimates and analysis
GCC HYDROCARBON SECTOR OUTLOOK & FUTURE | CONCLUSIVE REMARKS
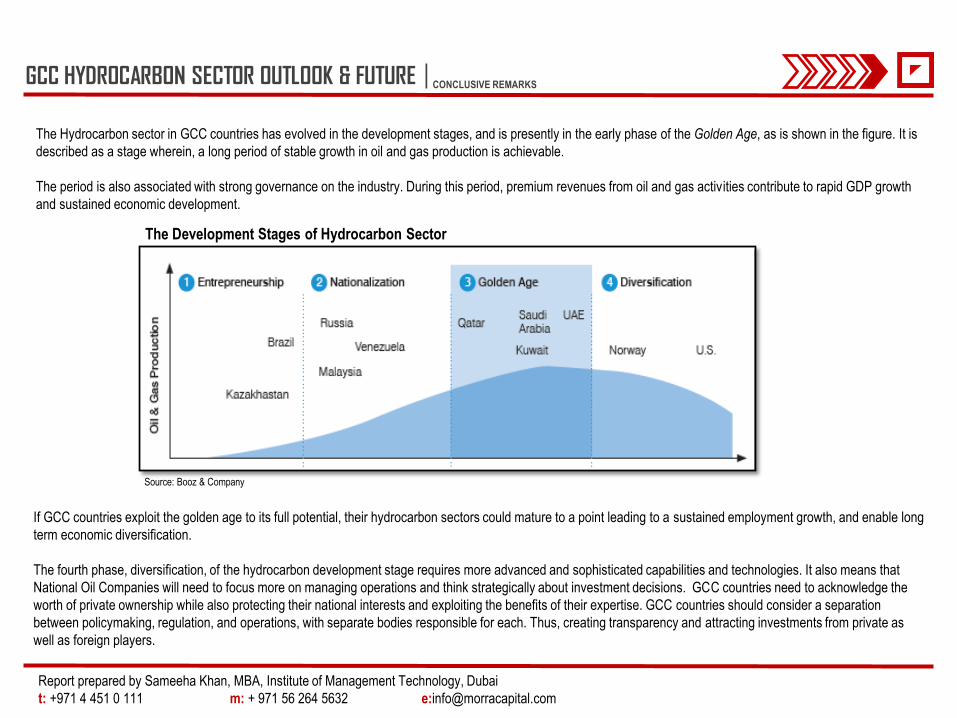
If GCC countries exploit the golden age to its full potential, their hydrocarbon sectors could mature to a point leading to a sustained employment growth, and enable long
term economic diversification.
The fourth phase, diversification, of the hydrocarbon development stage requires more advanced and sophisticated capabilities and technologies. It also means that
National Oil Companies will need to focus more on managing operations and think strategically about investment decisions. GCC countries need to acknowledge the
worth of private ownership while also protecting their national interests and exploiting the benefits of their expertise. GCC countries should consider a separation
between policymaking, regulation, and operations, with separate bodies responsible for each. Thus, creating transparency and attracting investments from private as
well as foreign players.
The Development Stages of Hydrocarbon Sector
Source: Booz & Company
The Hydrocarbon sector in GCC countries has evolved in the development stages, and is presently in the early phase of the Golden Age, as is shown in the figure. It is
described as a stage wherein, a long period of stable growth in oil and gas production is achievable.
The period is also associated with strong governance on the industry. During this period, premium revenues from oil and gas activities contribute to rapid GDP growth
and sustained economic development.
Report prepared by Sameeha Khan, MBA, Institute of Management Technology, Dubai
t: +971 4 451 0 111 m: + 971 56 264 5632 e:[email protected]
Disclaimer This Document has been assembled by Morra Capital Limited (“Morra”) for the sole purpose of giving investors a sector synopsis and overview of the oil and gas industry in the GCC. This Document has been prepared for information purposes relating to this sector. This Document does not purport to be all-inclusive nor to contain all the information that a prospective investor may require in deciding whether or not to invest in this sector. No representation or warranty, express or implied, is or will be made in relation to the accuracy or completeness of this Document or any other written or oral information made available to any prospective investor or its advisors in connection with any further investigation of the sector and no responsibility or liability is or will be accepted by Morra or by any of their recipient or respective officers, employees or agents in relation to it. Morra and their respective subsidiaries and associated companies and their respective officers, employees and agents expressly disclaims any and all liability which may be based on this Document or such information, and any errors therein or omissions there from. The information contained herein was prepared based on publicly available information sources at the time that this Document was prepared. In particular, no representation or warranty is given as to the achievement or reasonableness of future projections, targets and estimates, if any. Morra has not verified any of the information in this Document. Recipients of this Document are not to construe the contents of this Document as legal, business, tax or other advice. Any recipient or prospective investor should not rely upon this Document in making any decision, investment or otherwise and is recommended to perform their own due diligence and seek their own independent advice. This Document does not constitute an offer or invitation for the sale or purchase of securities or any of the businesses or assets described herein or to invest in the respective sector and does not constitute any form of commitment or recommendation on the part of Morra or any of their respective subsidiaries or associated companies. Morra does not accept any liability in relation to the distribution or possession of this Document in and from any jurisdiction and Morra shall not be liable for any violation by the recipient of any such registration requirements or other legal restrictions. Under no circumstances should this Document itself or any modified version be published or reproduced or sold by any third party in return for a fee or membership.
Morra Capital Limited t: +971 4 451 0 111 Churchill Towers 605, Business Bay f: +971 4 457 2 700 Dubai, United Arab Emirates PO Box 73121 e: [email protected] www.morracapital.com