gcc equity funds - theiafm.org€¦ · gcc equity funds strong results drive ... islamic funds...
TRANSCRIPT

Kuwait Financial Centre “Markaz” R E S E A R C H
GCC Equity Funds Strong Results Drive Fund Performance
April 2008 has been a rocking month for the GCC (9.2%) especially Qatar (23.4%) and Saudi Arabia (12.3%). Among our universe of 121 equity funds tracked by Markaz, the top 5 funds all belong to Qatar. This is an exceptional turnaround for a market that declined by 10% during the previous month. Confidence is returning to the market after international markets seem to settle down. Also, GCC companies have been posting strong earnings keeping the market in balance. GCC equity fund managers increased their allocation to Saudi Arabia (28%) as Saudi Arabia also recorded strong gains during the month. Overall, funds increased their exposure to the Saudi and Kuwait markets and lowered their focus on UAE and other MENA markets. During the month, fund managers marginally cut their exposure to equities as they held more cash. Table 1: GCC Asset Management Industry – Equity funds (April 2008)
Conventional Funds
Islamic Funds Total
Country No. of Funds
AUM ($Bn)
No. of Funds
AUM ($Bn)
No. of Funds
AUM ($Bn)
Share of
Total
Market Cap
($Bn)
Share of Total
AUM/M.cap
Saudi Arabia 14 3.61 17 6.06 31 9.66 44.3% 475.3 42.8% 2.0% Kuwait 16 5.43 11 0.94 27 6.37 29.2% 209.8 18.9% 3.0% UAE 11 1.65 3 0.09 14 1.74 8.0% 233.3 21.0% 0.7% Qatar 6 0.12 1 0.04 7 0.16 0.7% 134.4 12.1% 0.1% Bahrain 2 0.04 0 NA 2 0.04 0.2% 29.7 2.7% 0.1% Oman 3 0.15 0 NA 3 0.15 0.7% 29.2 2.6% 0.5% GCC/MENA 25 2.74 12 0.97 37 3.71 17.0% Total 77 13.74 44 8.10 121 21.84 1,111.7 2.0% Source: Markaz Research Table 2: Top Five Asset Managers – Equity Funds (April 2008)
Manager AUM ($ Mn) Manager Focus Market Share
HSBC Saudi Arabia 3,152 Saudi Arabia 14.4% Riyad Capital 2,470 Saudi Arabia 11.3% Samba Financial Group 1,838 Saudi Arabia 8.4% Kuwait Financial Centre 1,664 Kuwait 7.6% National Investments Co. 1,361 Kuwait 6.2%
Source: Markaz Research
Table 3: Top Five Equity Funds (April 2008)
Fund Name Geographical Focus
Fund Manager
Monthly Return YTD 2007
Return Al-Beit Al-Mali Shariah Compliant Fund Qatar
Qatar National Bank
21.64%
18.05%
21.41%
Makaseb Qatar Equity Fund Qatar Mashreq
19.70% 22.84%
50.38%
Qatar Gate Fund (N) Qatar
Amwal 19.65%
22.78%
36.09%
Qatar Gate Fund (Q) Qatar Amwal 19.34%
22.46%
38.81%
Al Watani Fund Qatar Qatar National Bank
19.19%
18.46%
51.72%
Source: Markaz Research
May 2008 Markaz Research is available on Bloomberg Type “MRKZ” <Go> Thomson Financial Reuters Knowledge Zawya Investor Noozz M.R. Raghu CFA, FRM Head of Research +965 224 8280 [email protected] Layla Jasem Al-Ammar Research Analyst +965 224 8000 ext. 1205 [email protected] Kuwait Financial Centre “Markaz” P.O. Box 23444, Safat 13095, Kuwait Tel: +965 224 8000 Fax: +965 242 5828 markaz.com
R E S E A R C H May 2008
Kuwait Financial Centre “Markaz” 2
GCC Equity Funds Qatar and Saudi Help Bounce Back
Key Highlights
• Markets, after declining in March, posted healthy growth in April 2008,
led by strong Q1 results and sustained macro-economic performance. • While, fund managers increased their exposure to equities by 19 basis
points to 93%, the exposure to bonds decreased by 32 basis points. Free cash held by GCC Funds increased to 7% in April.
• On a weighted average basis, GCC Equity Funds mirrored the gains of the GCC markets and registered returns of 7.7% during the month.
• Managers increased their exposure to the Saudi and Kuwaiti markets by approximately 268 bps and 195 bps, respectively, whereas they decreased their exposure to the UAE market by around 182 bps.
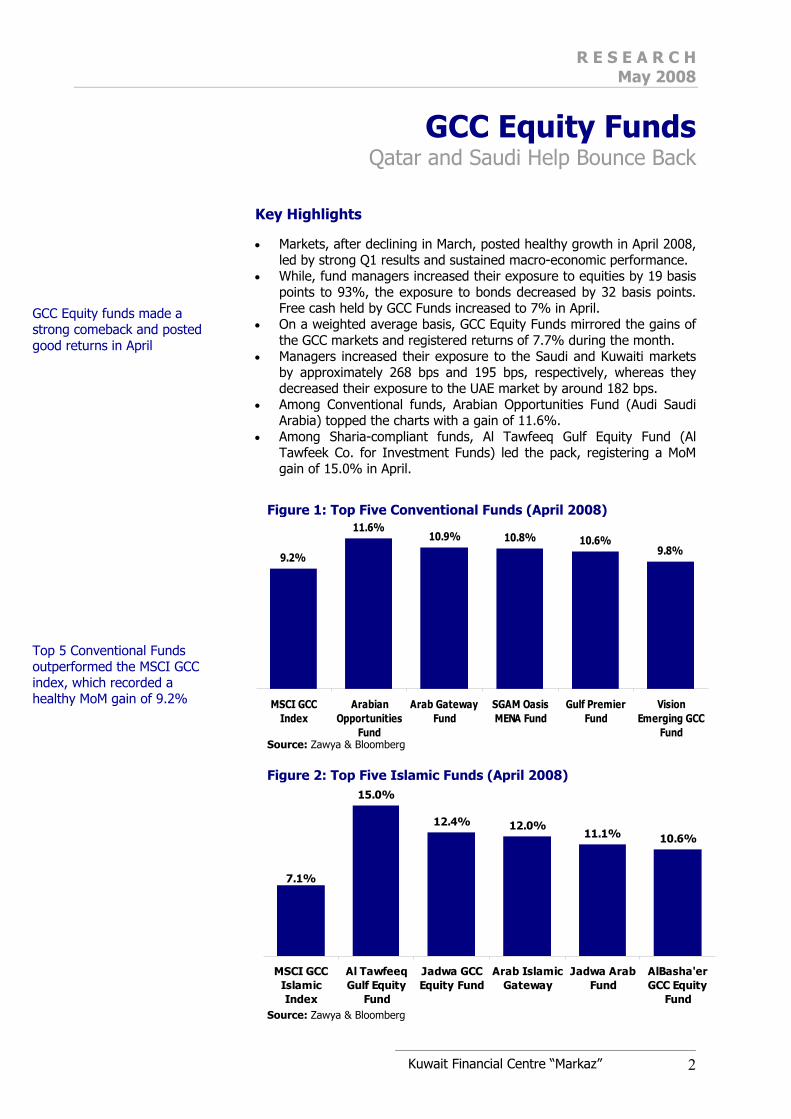
• Among Conventional funds, Arabian Opportunities Fund (Audi Saudi Arabia) topped the charts with a gain of 11.6%.
• Among Sharia-compliant funds, Al Tawfeeq Gulf Equity Fund (Al Tawfeek Co. for Investment Funds) led the pack, registering a MoM gain of 15.0% in April.
Figure 1: Top Five Conventional Funds (April 2008)
9.2%
11.6%10.9% 10.8% 10.6%
9.8%
MSCI GCCIndex
ArabianOpportunities
Fund
Arab GatewayFund
SGAM OasisMENA Fund
Gulf PremierFund
VisionEmerging GCC
Fund Source: Zawya & Bloomberg Figure 2: Top Five Islamic Funds (April 2008)
15.0%
12.4% 12.0%11.1% 10.6%
7.1%
MSCI GCCIslamicIndex
Al TawfeeqGulf Equity
Fund
Jadwa GCCEquity Fund
Arab IslamicGateway
Jadwa ArabFund
AlBasha'erGCC Equity
Fund Source: Zawya & Bloomberg
GCC Equity funds made a strong comeback and posted good returns in April Top 5 Conventional Funds outperformed the MSCI GCC index, which recorded a healthy MoM gain of 9.2%
R E S E A R C H May 2008
Kuwait Financial Centre “Markaz” 3
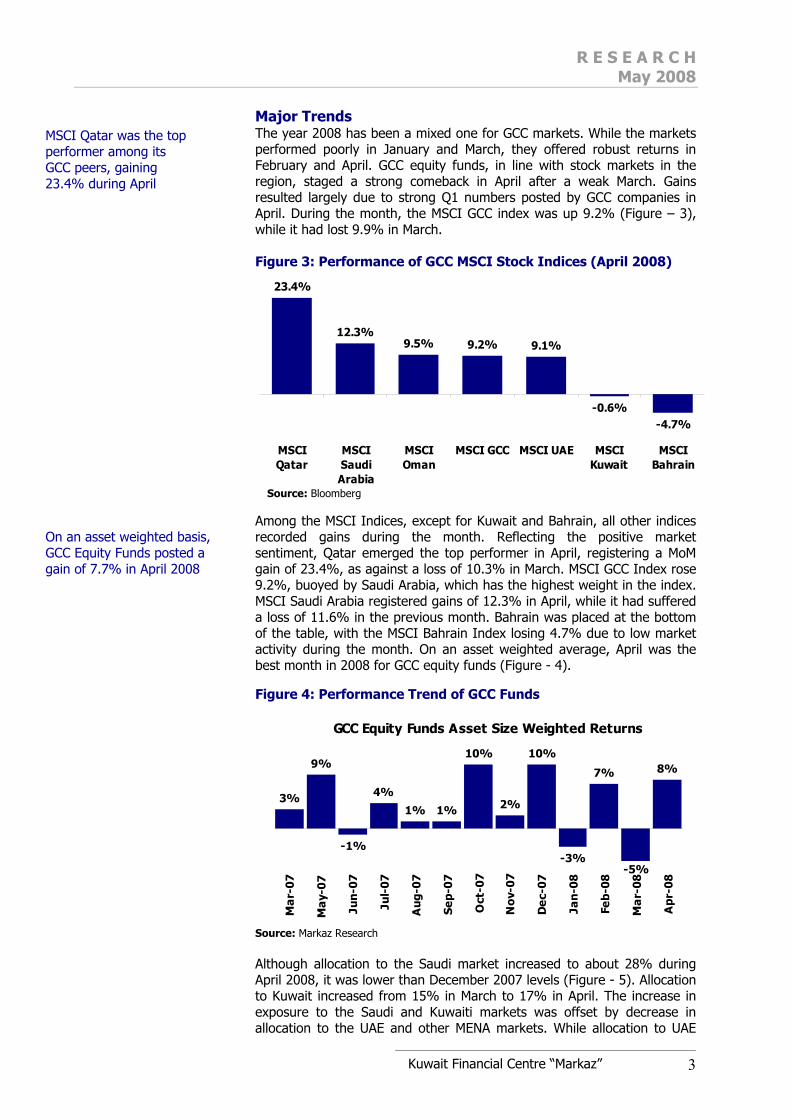
Major Trends The year 2008 has been a mixed one for GCC markets. While the markets performed poorly in January and March, they offered robust returns in February and April. GCC equity funds, in line with stock markets in the region, staged a strong comeback in April after a weak March. Gains resulted largely due to strong Q1 numbers posted by GCC companies in April. During the month, the MSCI GCC index was up 9.2% (Figure – 3), while it had lost 9.9% in March.
Figure 3: Performance of GCC MSCI Stock Indices (April 2008)
23.4%
12.3%9.5% 9.2% 9.1%
-0.6%-4.7%
MSCIQatar
MSCISaudiArabia
MSCIOman
MSCI GCC MSCI UAE MSCIKuwait
MSCIBahrain
Source: Bloomberg
Among the MSCI Indices, except for Kuwait and Bahrain, all other indices recorded gains during the month. Reflecting the positive market sentiment, Qatar emerged the top performer in April, registering a MoM gain of 23.4%, as against a loss of 10.3% in March. MSCI GCC Index rose 9.2%, buoyed by Saudi Arabia, which has the highest weight in the index. MSCI Saudi Arabia registered gains of 12.3% in April, while it had suffered a loss of 11.6% in the previous month. Bahrain was placed at the bottom of the table, with the MSCI Bahrain Index losing 4.7% due to low market activity during the month. On an asset weighted average, April was the best month in 2008 for GCC equity funds (Figure - 4). Figure 4: Performance Trend of GCC Funds
GCC Equity Funds Asset Size Weighted Returns
3%
9%
-1%
4%
1% 1%
10%
2%
10%
-3%
7% 8%
-5%
Mar
-07
May
-07
Jun
-07
Jul-
07
Aug
-07
Sep-
07
Oct
-07
Nov
-07
Dec
-07
Jan-
08
Feb-
08
Mar
-08
Apr
-08
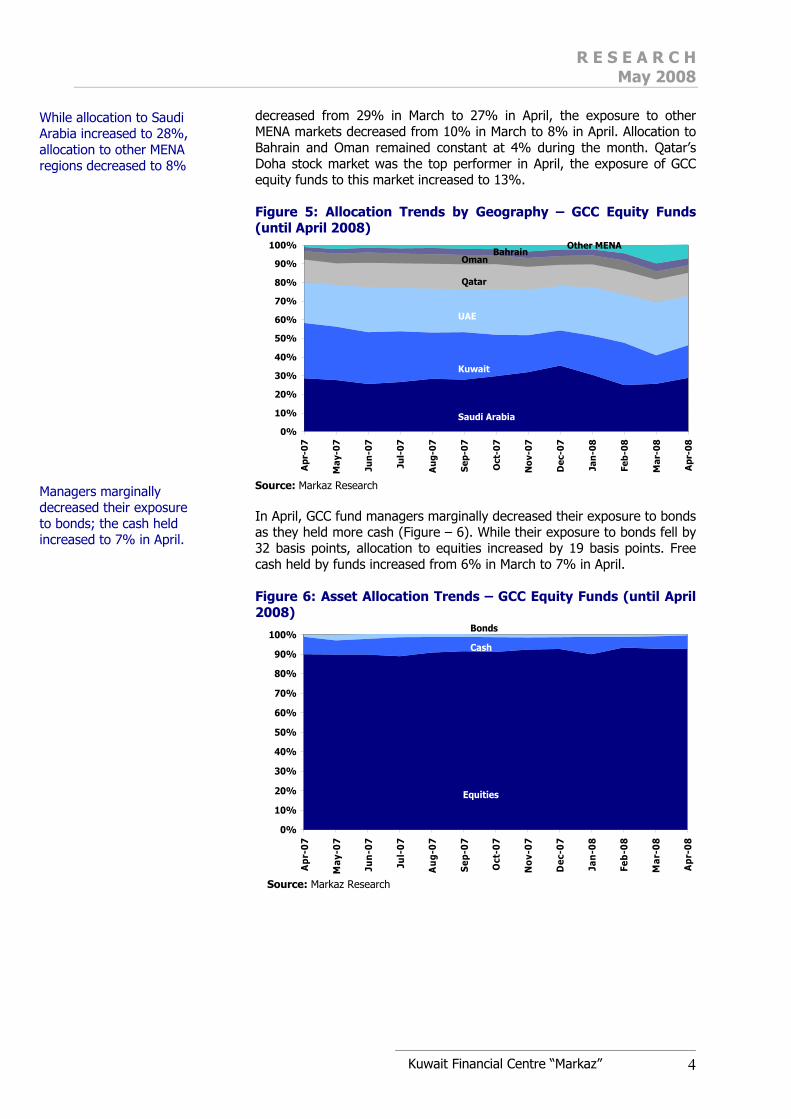
Source: Markaz Research Although allocation to the Saudi market increased to about 28% during April 2008, it was lower than December 2007 levels (Figure - 5). Allocation to Kuwait increased from 15% in March to 17% in April. The increase in exposure to the Saudi and Kuwaiti markets was offset by decrease in allocation to the UAE and other MENA markets. While allocation to UAE
MSCI Qatar was the top performer among its GCC peers, gaining 23.4% during April On an asset weighted basis, GCC Equity Funds posted a gain of 7.7% in April 2008
R E S E A R C H May 2008
Kuwait Financial Centre “Markaz” 4
decreased from 29% in March to 27% in April, the exposure to other MENA markets decreased from 10% in March to 8% in April. Allocation to Bahrain and Oman remained constant at 4% during the month. Qatar’s Doha stock market was the top performer in April, the exposure of GCC equity funds to this market increased to 13%. Figure 5: Allocation Trends by Geography – GCC Equity Funds (until April 2008)
0%
10%
20%
30%
40%
50%
60%
70%
80%
90%
100%
Apr
-07
May
-07
Jun
-07
Jul-
07
Au
g-0
7
Sep
-07
Oct
-07
Nov
-07
Dec
-07
Jan
-08
Feb
-08
Mar
-08
Apr
-08
Saudi Arabia
Kuwait
UAE
Qatar
OmanBahrain
Other MENA
Source: Markaz Research In April, GCC fund managers marginally decreased their exposure to bonds as they held more cash (Figure – 6). While their exposure to bonds fell by 32 basis points, allocation to equities increased by 19 basis points. Free cash held by funds increased from 6% in March to 7% in April. Figure 6: Asset Allocation Trends – GCC Equity Funds (until April 2008)
0%
10%
20%
30%
40%
50%
60%
70%
80%
90%
100%
Apr
-07
May
-07
Jun
-07
Jul-
07
Au
g-0
7
Sep
-07
Oct
-07
Nov
-07
Dec
-07
Jan
-08
Feb
-08
Mar
-08
Apr
-08
Equities
Bonds
Cash
Source: Markaz Research
While allocation to Saudi Arabia increased to 28%, allocation to other MENA regions decreased to 8% Managers marginally decreased their exposure to bonds; the cash held increased to 7% in April.

R E S E A R C H May 2008
Kuwait Financial Centre “Markaz” 5
Conventional GCC Funds
The top five Conventional Funds outperformed the MSCI GCC index, which posted gains of 9.2% in April. Arabian Opportunities Fund (Audi Saudi Arabia) with returns of 11.6% was the best performing fund in April (Table - 4). This outperformance is due to the Fund’s significant exposure to the Saudi market, which accounts for 56% of funds invested. During April, the fund increased its allocation in Saudi Arabian Fertilizer Company and Arab National Bank, citing the strong fundamentals of these two companies. The fund currently holds 6.8% and 5.4% in Saudi Arabian Fertilizer Company and Arab National Bank, respectively. Arab Gateway fund (Shuaa Capital) registered MoM returns of 10.9% and YTD returns of 8.1% in April. The top three holdings of the fund include Arabtec Holding (7.9%), Emaar Properties (6.9%), and SABIC (6.0%). The fund increased its allocation in UAE from 32.3% in March to 38.0% in April. Oasis MENA Fund (Societe Generale Asset Management) and Gulf Premier Fund (Gulf Investment Corporation) recorded monthly gains of 10.8% and 10.6%, respectively. The top three holdings of Oasis MENA Fund (Societe Generale Asset Management) include Doha Bank (7.4%), Emaar Properties (7.1%) and Qatar Navigation (4.4%). In April, Kuwait Finance House was the top holding for the Gulf Premier Fund (Gulf Investment Corporation). The stock was up 4.9% during the month as it posted an increase of 43% in its net profit of KD73.4 Mn. Table 4: Top Five Conventional Funds (April 2008)
Apr-08 Performance (%)
Fund Name Fund
Manager Inception AUM
($ Mn) Apr-08 YTD 2007
Arabian Opportunities Fund
Audi Saudi Arabia Sep-07 31 11.57% 6.53% 24.77%
Arab Gateway Fund
Shuaa Capital Dec-99 611 10.91% 8.09% 49.28%
SGAM Oasis MENA Fund
Societe Generale Asset Mgmt
Nov-07
74
10.84%
12.00%
7.26%
Gulf Premier Fund
Gulf Investment Corporation Apr-03 211 10.61% 12.11% 43.24%
Vision Emerging GCC Fund
Vision Investment Services Co May-05 52 9.82% 11.11% 56.49%
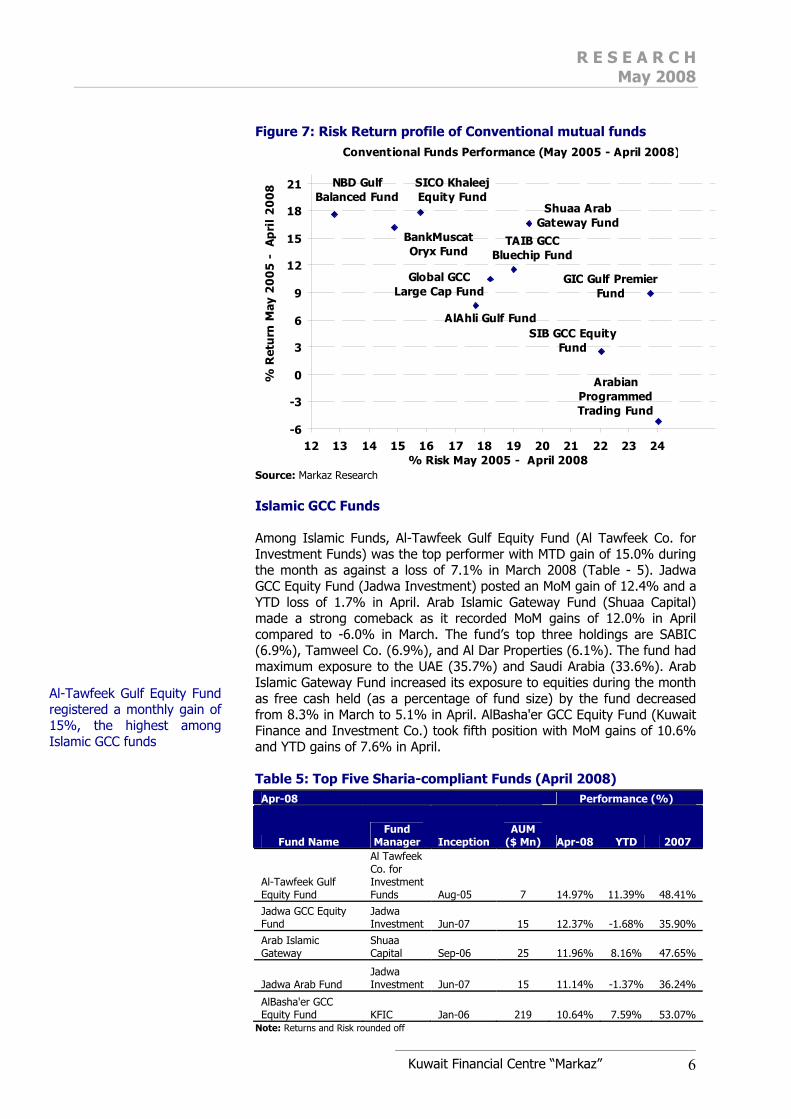
Source: Markaz Research Over the three-year period, SICO Khaleej Equity Fund (Securities and Investment Company) recorded highest annualized returns of 17.8% with an annualized risk of 15.8%. Gulf Balanced Fund (National Bank of Dubai) registered annualized returns of 17.6% and an annualized risk of 12.8% (Figure – 7).
Arabian Opportunities Fund topped the charts for April, posting a MoM gain of 11.6% SICO Khaleej Equity Fund recorded highest annualized returns of 17.8% over past 3 years
R E S E A R C H May 2008
Kuwait Financial Centre “Markaz” 6
Figure 7: Risk Return profile of Conventional mutual funds
SICO Khaleej Equity Fund
TAIB GCC Bluechip Fund
GIC Gulf Premier Fund
Global GCC Large Cap Fund
SIB GCC Equity Fund
NBD Gulf Balanced Fund
Shuaa Arab Gateway Fund
BankMuscat Oryx Fund
AlAhli Gulf Fund
Arabian Programmed Trading Fund
-6
-3
0
3
6
9
12
15
18
21
12 13 14 15 16 17 18 19 20 21 22 23 24
Conventional Funds Performance (May 2005 - April 2008)
% R
etu
rn M
ay 2
00
5 -
A
pri
l 2
00
8
% Risk May 2005 - April 2008 Source: Markaz Research Islamic GCC Funds Among Islamic Funds, Al-Tawfeek Gulf Equity Fund (Al Tawfeek Co. for Investment Funds) was the top performer with MTD gain of 15.0% during the month as against a loss of 7.1% in March 2008 (Table - 5). Jadwa GCC Equity Fund (Jadwa Investment) posted an MoM gain of 12.4% and a YTD loss of 1.7% in April. Arab Islamic Gateway Fund (Shuaa Capital) made a strong comeback as it recorded MoM gains of 12.0% in April compared to -6.0% in March. The fund’s top three holdings are SABIC (6.9%), Tamweel Co. (6.9%), and Al Dar Properties (6.1%). The fund had maximum exposure to the UAE (35.7%) and Saudi Arabia (33.6%). Arab Islamic Gateway Fund increased its exposure to equities during the month as free cash held (as a percentage of fund size) by the fund decreased from 8.3% in March to 5.1% in April. AlBasha'er GCC Equity Fund (Kuwait Finance and Investment Co.) took fifth position with MoM gains of 10.6% and YTD gains of 7.6% in April. Table 5: Top Five Sharia-compliant Funds (April 2008)
Apr-08 Performance (%)
Fund Name Fund
Manager Inception AUM
($ Mn) Apr-08 YTD 2007
Al-Tawfeek Gulf Equity Fund
Al Tawfeek Co. for Investment Funds Aug-05 7 14.97% 11.39% 48.41%
Jadwa GCC Equity Fund
Jadwa Investment Jun-07 15 12.37% -1.68% 35.90%
Arab Islamic Gateway
Shuaa Capital Sep-06 25 11.96% 8.16% 47.65%
Jadwa Arab Fund Jadwa Investment Jun-07 15 11.14% -1.37% 36.24%
AlBasha'er GCC Equity Fund KFIC Jan-06 219 10.64% 7.59% 53.07%
Note: Returns and Risk rounded off
Al-Tawfeek Gulf Equity Fund registered a monthly gain of 15%, the highest among Islamic GCC funds

R E S E A R C H May 2008
Kuwait Financial Centre “Markaz” 7
Source: Markaz Research Over the last one year, Al Raed GCC Fund (Samba Financial Group) enjoys the best risk-adjusted performance (Figure – 8). Figure 8: Risk Return profile of Islamic mutual funds
Al Raed GCC fund
AlBasha'er GCC Equity Fund
AlAhli GCC Trading Equity
Fund Riyad Bank Gulf Fund
SABB Amanah GCC Equity Fund
BSF AlDana GCC Equity Fund
AlRajhi GCC Equity Fund
Gulf Industrial Companies Fund
Al-Tawfeek Gulf Equity Fund
Arab Islamic Gateway
10
15
20
25
30
35
40
45
50
55
60
65
16 18 20 22 24 26 28 30 32
Islamic Funds Performance (May 2007 - April 2008)
% Risk May 2007 - April 2008
% R
etur
n M
ay 2
007
- A
pril
2008
Source: Markaz Research
Al Raed GCC Equity Fund topped the charts with highest annualized returns of 63.5%
R E S E A R C H May 2008
Kuwait Financial Centre “Markaz” 8
Saudi Arabia Equity Funds Strong Turnaround in April
Key Highlights
• The Saudi stock market ended the month at 10,066. During the month, Saudi market regulator restructured the index to 15 sectors from eight sectors earlier. Furthermore, these new sectors were assigned weight in the index based on free float methodology, which is in line with global trend.
• The MSCI Saudi Index ended at 609 points in April, up 12.3% over the previous month, backed by strong Q1 2008 results posted by Saudi blue chip companies.
• Saudi funds on average gained 6.3% in April 2008, underperforming the Saudi Tadawul Index return of 11.9%.
• Saudi equity funds had 96.6% exposure to equities and cash held accounted for 3.4% of total assets.
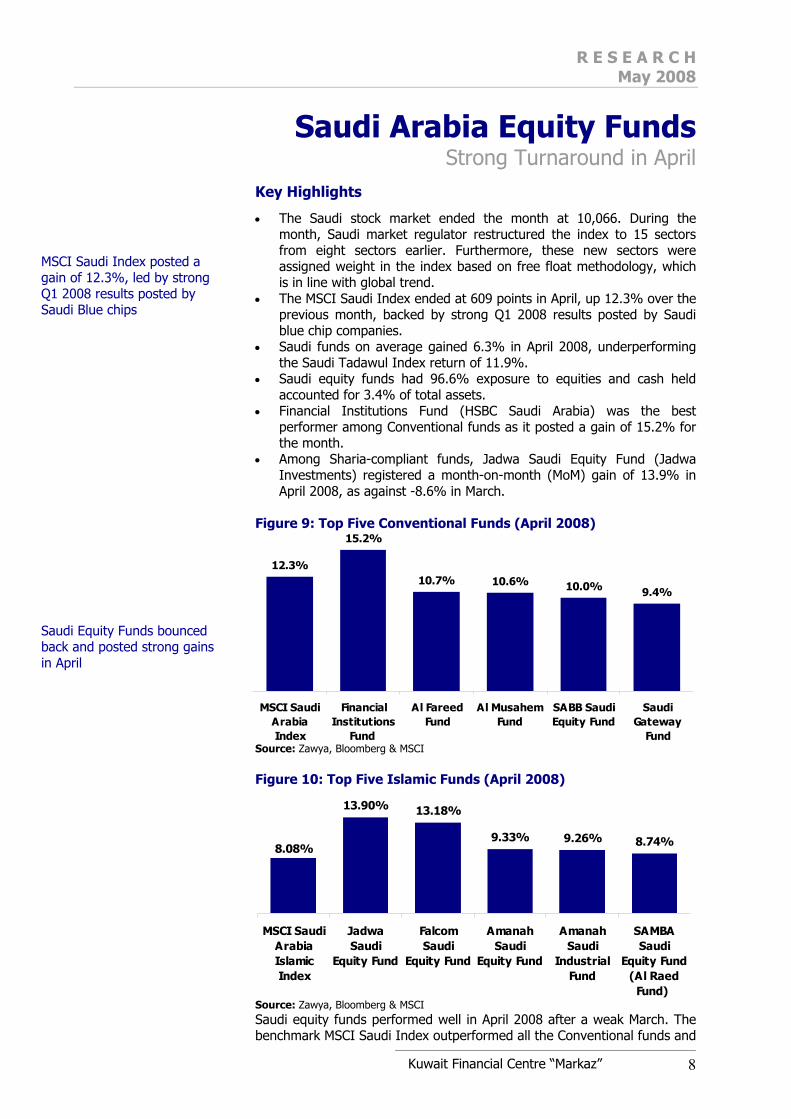
• Financial Institutions Fund (HSBC Saudi Arabia) was the best performer among Conventional funds as it posted a gain of 15.2% for the month.
• Among Sharia-compliant funds, Jadwa Saudi Equity Fund (Jadwa Investments) registered a month-on-month (MoM) gain of 13.9% in April 2008, as against -8.6% in March.
Figure 9: Top Five Conventional Funds (April 2008)
12.3%
15.2%
10.7% 10.6% 10.0% 9.4%
MSCI SaudiArabiaIndex
FinancialInstitutions
Fund
Al FareedFund
Al MusahemFund
SABB SaudiEquity Fund
SaudiGateway
Fund Source: Zawya, Bloomberg & MSCI
Figure 10: Top Five Islamic Funds (April 2008)
13.90% 13.18%
9.33% 9.26% 8.74%8.08%
MSCI SaudiArabiaIslamicIndex
JadwaSaudi
Equity Fund
FalcomSaudi
Equity Fund
AmanahSaudi
Equity Fund
AmanahSaudi
IndustrialFund
SAMBASaudi
Equity Fund(Al Raed
Fund) Source: Zawya, Bloomberg & MSCI Saudi equity funds performed well in April 2008 after a weak March. The benchmark MSCI Saudi Index outperformed all the Conventional funds and
MSCI Saudi Index posted a gain of 12.3%, led by strong Q1 2008 results posted by Saudi Blue chips Saudi Equity Funds bounced back and posted strong gains in April

R E S E A R C H May 2008
Kuwait Financial Centre “Markaz” 9
posted a gain of 12.3%. MSCI Saudi Islamic Index, the benchmark for Islamic funds reported MoM gain of 8.1%. Table 6: Top Five Fund Managers (in terms of AUM in April 2008)
Fund Manager AUM ($Mn) Fund Manager Focus
Market Share
HSBC Saudi Arabia 3,108 Saudi Arabia 32.2% Riyad Capital 2,338 Saudi Arabia 24.5% Samba Financial Group 1,691 Saudi Arabia 17.7% NCB Capital 798 Saudi Arabia 8.4% Bank Al Bilad 298 Saudi Arabia 3.1%
Source: Markaz Research Conventional Saudi Funds Among Conventional Funds, Financial Institutional Fund (HSBC Saudi Arabia) registered a gain of 15.2% in April and was the top performer for the month (Table – 7). The fund's top holdings are Al Rajhi Bank (31.2%), Samba Financial Group (18.9%), and Riyad Bank (11.5%). Samba Financial Group’s Al Fareed Fund and Al Musahem Fund posted strong MoM returns of 10.7% and 10.6%, respectively. Saudi Equity Fund (HSBC Saudi Arabia) registered a gain of 10.0% in April. The fund’s top holdings were SABIC (18.3%), Saudi Fertilizers Company (8.3%) and Saudi Cable Company (7.9%). The Saudi Gateway Fund (Shuaa Capital) posted a monthly gain of 9.4% as against a loss of 4.9% in March. The fund increased its allocation to the Materials sector from 41.5% in March to 46.4% in April. Saudi Basic Industries Co. (SABIC), Saudi Fertilizers, and Yanbu National Petrochemical Company, the top three holdings of Saudi Gateway Fund, account for 10.0%, 9.6%, and 8.2%, respectively, of its total assets. SABIC recorded a gain of 7.0% in April as its net profit for Q1 2008 grew 10% to SAR6.2 Bn. Furthermore, the free cash held by the fund increased from 0.6% in March to 0.9% in April.
Table 7: Top Five Conventional Funds (April 2008)
April-08 Performance (%)
Fund Name Fund
Manager Inception AUM
($ Mn) Apr-08 YTD 2007 Financial Institutional Fund
HSBC Saudi Arabia Aug-04 190 15.22% -17.11% 35.91%
Al Fareed Fund
Samba Financial Group Dec-03 52 10.66% -4.43% 71.66%
Al Musahem Fund
Samba Financial Group May-92 466 10.57% -1.67% 47.92%
SABB Saudi Equity Fund
HSBC Saudi Arabia Oct-92 616 10.03% -1.77% 62.21%
Saudi Gateway Fund
Shuaa Capital Jul-07 192 9.39% -0.78% 35.76%
Source: Markaz Research
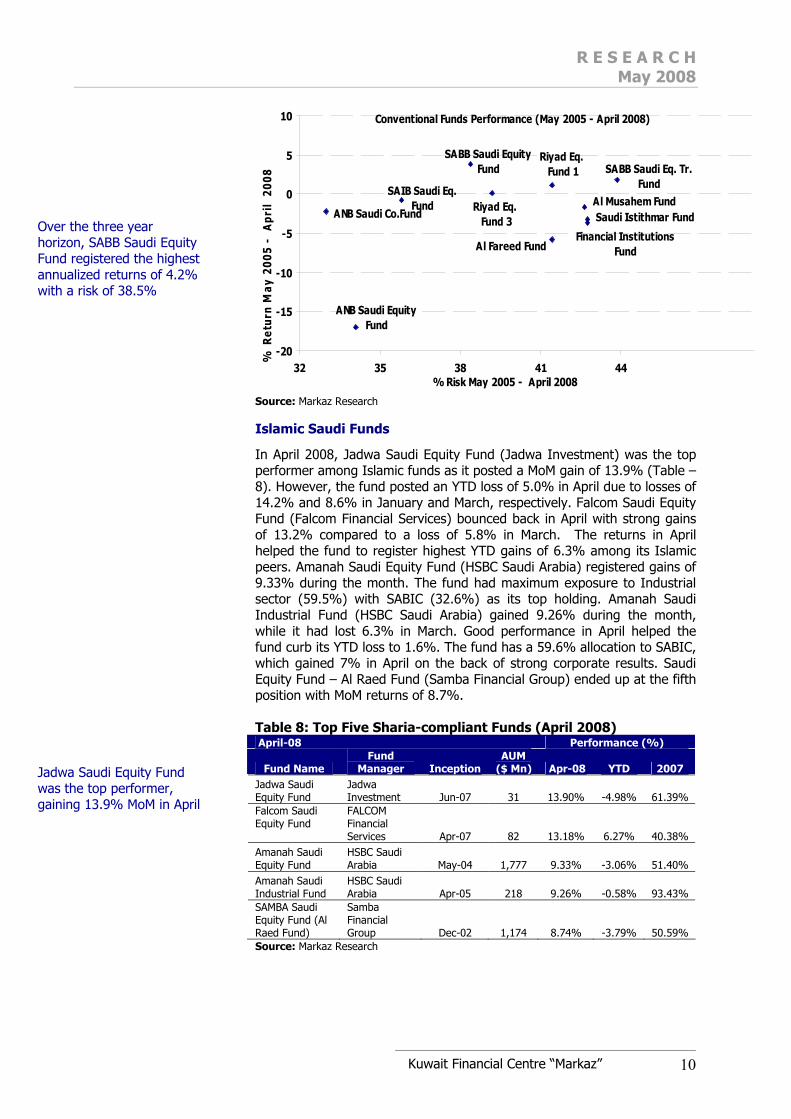
Among all Saudi Arabian Conventional funds, SABB Saudi Equity Fund (HSBC Saudi Arabia) recorded the highest annualized returns of 4.2% with a risk of 38.5% during the last three years (Figure – 11). Saudi Companies Fund (Arab National Bank) was the least risky with risk of 33.0% and an annualized loss of 2.2%.
Figure 11: Risk Return profile of Conventional mutual funds
Financial Institutional Fund topped the charts in April, posting a gain of 15.2%
R E S E A R C H May 2008
Kuwait Financial Centre “Markaz” 10
ANB Saudi Co.Fund
ANB Saudi Equity Fund
Saudi Istithmar Fund
Riyad Eq. Fund 1
Riyad Eq. Fund 3
SABB Saudi Equity Fund SABB Saudi Eq. Tr.
FundSAIB Saudi Eq. Fund
Al Fareed Fund
Al Musahem Fund
Financial Institutions Fund
-20
-15
-10
-5
0
5
10
32 35 38 41 44
Conventional Funds Performance (May 2005 - April 2008)
% R
etur
n M
ay 2
005
- A
pril
200
8
% Risk May 2005 - April 2008 Source: Markaz Research Islamic Saudi Funds
In April 2008, Jadwa Saudi Equity Fund (Jadwa Investment) was the top performer among Islamic funds as it posted a MoM gain of 13.9% (Table – 8). However, the fund posted an YTD loss of 5.0% in April due to losses of 14.2% and 8.6% in January and March, respectively. Falcom Saudi Equity Fund (Falcom Financial Services) bounced back in April with strong gains of 13.2% compared to a loss of 5.8% in March. The returns in April helped the fund to register highest YTD gains of 6.3% among its Islamic peers. Amanah Saudi Equity Fund (HSBC Saudi Arabia) registered gains of 9.33% during the month. The fund had maximum exposure to Industrial sector (59.5%) with SABIC (32.6%) as its top holding. Amanah Saudi Industrial Fund (HSBC Saudi Arabia) gained 9.26% during the month, while it had lost 6.3% in March. Good performance in April helped the fund curb its YTD loss to 1.6%. The fund has a 59.6% allocation to SABIC, which gained 7% in April on the back of strong corporate results. Saudi Equity Fund – Al Raed Fund (Samba Financial Group) ended up at the fifth position with MoM returns of 8.7%. Table 8: Top Five Sharia-compliant Funds (April 2008) April-08 Performance (%)
Fund Name Fund
Manager Inception AUM
($ Mn) Apr-08 YTD 2007 Jadwa Saudi Equity Fund
Jadwa Investment Jun-07 31 13.90% -4.98% 61.39%
Falcom Saudi Equity Fund
FALCOM Financial Services Apr-07 82 13.18% 6.27% 40.38%
Amanah Saudi Equity Fund
HSBC Saudi Arabia May-04 1,777 9.33% -3.06% 51.40%
Amanah Saudi Industrial Fund
HSBC Saudi Arabia Apr-05 218 9.26% -0.58% 93.43%
SAMBA Saudi Equity Fund (Al Raed Fund)
Samba Financial Group Dec-02 1,174 8.74% -3.79% 50.59%
Source: Markaz Research
Over the three year horizon, SABB Saudi Equity Fund registered the highest annualized returns of 4.2% with a risk of 38.5% Jadwa Saudi Equity Fund was the top performer, gaining 13.9% MoM in April
R E S E A R C H May 2008
Kuwait Financial Centre “Markaz” 11
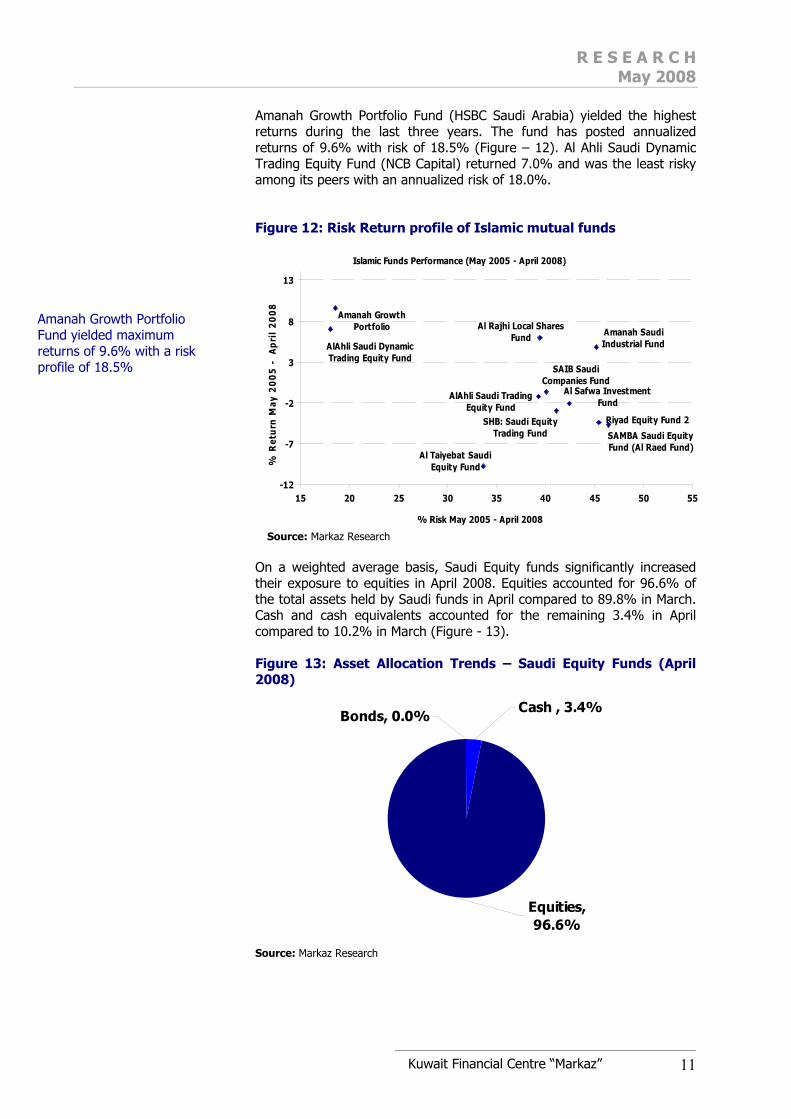
Amanah Growth Portfolio Fund (HSBC Saudi Arabia) yielded the highest returns during the last three years. The fund has posted annualized returns of 9.6% with risk of 18.5% (Figure – 12). Al Ahli Saudi Dynamic Trading Equity Fund (NCB Capital) returned 7.0% and was the least risky among its peers with an annualized risk of 18.0%.
Figure 12: Risk Return profile of Islamic mutual funds
Al Rajhi Local Shares Fund
Al Taiyebat Saudi Equity Fund
Amanah Growth Portfolio
Al Safwa Investment Fund
Riyad Equity Fund 2
SAMBA Saudi Equity Fund (Al Raed Fund)
SHB: Saudi Equity Trading Fund
AlAhli Saudi Trading Equity Fund
Amanah Saudi Industrial FundAlAhli Saudi Dynamic
Trading Equity FundSAIB Saudi
Companies Fund
-12
-7
-2
3
8
13
15 20 25 30 35 40 45 50 55
Islamic Funds Performance (May 2005 - April 2008) %
Ret
urn
May
20
05
-
Ap
ril
20
08
% Risk May 2005 - April 2008 Source: Markaz Research
On a weighted average basis, Saudi Equity funds significantly increased their exposure to equities in April 2008. Equities accounted for 96.6% of the total assets held by Saudi funds in April compared to 89.8% in March. Cash and cash equivalents accounted for the remaining 3.4% in April compared to 10.2% in March (Figure - 13). Figure 13: Asset Allocation Trends – Saudi Equity Funds (April 2008)
Equities, 96.6%
Cash , 3.4%Bonds, 0.0%
Source: Markaz Research
Amanah Growth Portfolio Fund yielded maximum returns of 9.6% with a risk profile of 18.5%

R E S E A R C H May 2008
Kuwait Financial Centre “Markaz” 12
Kuwait Equity Funds Political unrest restricted market
Key Highlights
• The Kuwaiti parliamentary elections (held in May 2008) due to
unexpected resignation of the ruling government continued to dampen the investor’s sentiments and restricted the market growth in April. The Kuwaiti index ended the month with a moderate gain of 2.8%.
• MSCI Kuwait Index lost 0.6% in April; few Kuwait-focused funds outperformed the index and yielded positive returns. Markets were volatile mainly due to the trickle down effect of changes in the banking regulations made in March. Net profits of a few heavyweight companies, such as Mobile Telecommunications (Zain), failed to meet investor expectations, dragging the Index down.
• On weighted average, funds lost 0.3% in April 2008, but outperformed the MSCI Kuwait Index.
• Tharwa Investment Fund (Tharwa Investment Company) topped the Conventional funds’ performance list with a MoM gain of 3.5%.
• In April 2008, Al Safwa Fund (National Investments Company) was the best performing Sharia fund with a gain of 2.6%. The fund outperformed the benchmark MSCI Kuwait Islamic Index, which declined 1.0%.
Figure 14: Top Five Conventional Funds (April 2008)
-0.6%
3.5%
1.8%1.4% 1.3% 1.0%
MSCI KuwaitIndex
TharwaInvestment
Fund
Al-RaedFund
KuwaitGateway
Fund
Al-ShorooqInvestment
Fund
MarkazForsa
Source: Zawya, Bloomberg & MSCI
Figure 15: Top Five Islamic Funds (April 2008)
2.6%
1.7%1.4% 1.2%
0.6%
-1.0%
MSCI KuwaitIslamicIndex
Al SafwaInvestment
Fund
Al DarSecurities
Fund
Al DarijInvestment
Fund
Al NokhbaFund
TijariIslamic Fund
Source: Zawya, Bloomberg & MSCI
In April, though MSCI Kuwait Index lost 0.6% as few funds registered positive returns In April 2008, top Five Conventional and Sharia Funds outperformed their respective benchmark indices.

R E S E A R C H May 2008
Kuwait Financial Centre “Markaz” 13
During the month, volatility in the market affected Kuwait’s Sharia and Conventional funds. Only few funds reported gains due to corporate results which were flat or below expectations. Table 9: Top Five Fund Managers (in terms of AUM in April 2008)
Fund Manager AUM ($ Mn)
Fund Manager
Focus
Market Share
Kuwait Financial Centre 1,617 Kuwait 25.4% National Investments Company 1,361 Kuwait 21.4% Kuwait Investment Company 906 Kuwait 14.2% Commercial Bank of Kuwait 443 Kuwait 7.0% Burgan Bank 400 Kuwait 6.3% Source: Markaz Research
Conventional Kuwait Funds Among the top five Conventional funds, Tharwa Investment Fund (Tharwa Investment Company) was the best performer with month-on-month returns of 3.5% followed by Al-Raed Fund (Kuwait Investment Company) with 1.8% (Table - 10). In terms of YTD, Tharwa Investment Fund with returns of 13.7% overtook last month’s YTD topper Burgan Equity Fund (Burgan Bank). The fund had invested 38.0% of its assets under management in the Industrial sector followed by Banking and Services at 29.0% and 22.0%, respectively. The Industrial sector returned the highest returns for the month (13.7%), whereas Banking and Services returned -0.7% and -0.4%, respectively. The Industrial sector benefited from the strong performance of Mena Holding Group whose stock price surged 196.0% for the month. Cash exposure was limited to 4.0%. Kuwait Gateway Fund (Shuaa Capital) had top holdings in National Bank of Kuwait (12.0%), Kuwait Projects Company (10.0%) and Kuwait Finance House (9.8%). Kuwait Finance House’s net profit surged almost 43.0% due to which the stock price rose 4.9% in April. Kuwait Gateway Fund’s major investments are in the Banking and Finance sector (37.7%). Markaz Forsa’s top holdings include Kuwait Finance House, Mobile Telecommunications Company (ZAIN), and National Bank of Kuwait. Cash exposure is limited to 6.0%. Allocation to the Banking and Services sectors stood at 26.0% and 21.0%, respectively. Table 10: Top Five Conventional Funds (April 2008)
Apr-08 Performance (%)
Fund Name
Fund Manager Inception
AUM ($ Mn) Apr-08 YTD 2007
Tharwa Investment Fund
Tharwa Investment Company May-07 53 3.46% 13.66% 7.62%
Al-Raed Fund
Kuwait Investment Company Oct-01 906 1.81% 8.18% 21.42%
Kuwait Gateway Fund
Shuaa Capital Nov-05 35 1.35% 12.20% 40.27%
Al-Shorooq Investment Fund
Gulfinvest International Jul-01 225 1.25% -9.64% 18.83%
Markaz Forsa
Kuwait Financial Centre Jun-04 346 1.00% 7.09% 20.37%
Source: Markaz Research
Tharwa Investment Fund posted 3.5% returns, the best among conventional funds

R E S E A R C H May 2008
Kuwait Financial Centre “Markaz” 14
On a three-year annualized horizon, Al Wataniya Investment Fund (National Investments Company) outperformed other conventional equity funds. The fund yielded maximum annualized returns of 22.5% with risk of 19.8% during the same period (Figure - 16).
Figure 16: Risk Return profile of Conventional mutual funds
Al Ahli Kuwaiti Fund
Tijari Investment
Fund
Burgan Equity Fund
Coast Investment
Fund
Global Local Fund
Al-Shorooq Investment
Fund
Al Rou'yah Fund
Al-Raed Fund
Al Wataniya Investment
Fund
Markaz Forsa
Markaz Investment and
Development Fund
Markaz Mumtaz Investment
FundKAMCO Investment
Fund
6
8
10
12
14
16
18
20
22
24
26
14 15 16 17 18 19 20 21 22 23 24 25
Conventional Funds Performance (May 2005 - April 2008)
% R
etu
rn M
ay 2
00
5 -
Apr
il 2
00
8
% Risk May 2005 - April 2008 Source: Markaz Research Islamic Kuwait Funds
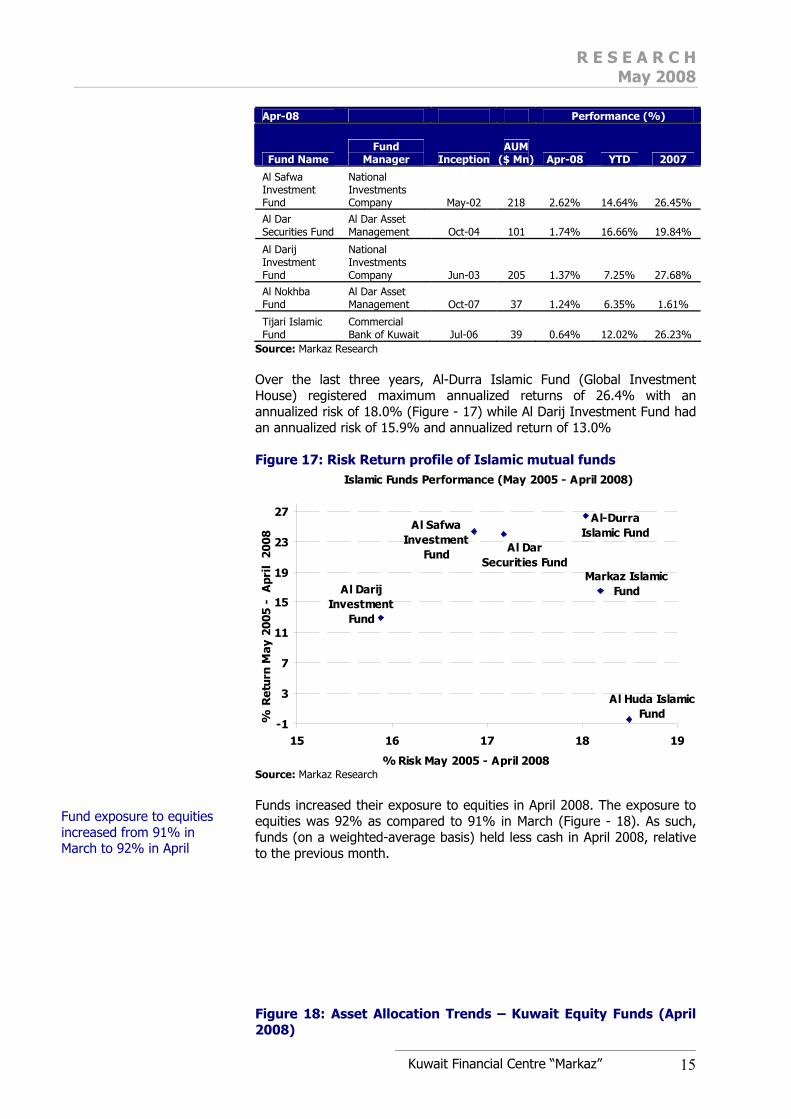
In April 2008, Al Safwa Investment Fund (National Investment Company) posted positive returns, outperforming the benchmark MSCI Kuwait Islamic Index. The fund reported a monthly gain of 2.6%, and registered YTD returns of 14.6%. The fund had full exposure to equity. Top holdings include Kuwait Finance House, First Investment Company, and Ekttitab Holding Company. The fund has not provided holdings by percentage in the fact sheet. Al Dar Securities Fund (Al Dar Asset Management) was second with a gain of 1.7% followed by Al Darij Investment Fund (National Investment Company) with a gain of 1.4% (Table - 11). The top holdings for Darij Investment Fund include First Investment Company, National Industries Company, and Boubyan Petrochemicals Company. The percentage holding of the funds is not provided in the fact sheet. The fund also had full exposure to equity. Al Nokhba Fund (Al Dar Asset Management) stood fourth with returns of 1.2%. Cash exposure of the fund is 11.0%. Tijari Islamic Fund (Commercial Bank of Kuwait) came fifth with returns of 0.6%. Cash exposure was 4.3%. Tijari Islamic Fund’s exposure to the Banking sector is 27.5% and to Investments sector is 20.6%. The unavailability of the fund’s top holdings in the fact sheet restricted further analysis. Table 11: Top Five Sharia compliant Funds (April 2008)
Al Safwa Investment Fund posted MoM returns of 2.6% and YTD returns of 14.6% in April 2008
R E S E A R C H May 2008
Kuwait Financial Centre “Markaz” 15
Apr-08 Performance (%)
Fund Name Fund
Manager Inception AUM
($ Mn) Apr-08 YTD 2007
Al Safwa Investment Fund
National Investments Company May-02 218 2.62% 14.64% 26.45%
Al Dar Securities Fund
Al Dar Asset Management Oct-04 101 1.74% 16.66% 19.84%
Al Darij Investment Fund
National Investments Company Jun-03 205 1.37% 7.25% 27.68%
Al Nokhba Fund
Al Dar Asset Management Oct-07 37 1.24% 6.35% 1.61%
Tijari Islamic Fund
Commercial Bank of Kuwait Jul-06 39 0.64% 12.02% 26.23%
Source: Markaz Research Over the last three years, Al-Durra Islamic Fund (Global Investment House) registered maximum annualized returns of 26.4% with an annualized risk of 18.0% (Figure - 17) while Al Darij Investment Fund had an annualized risk of 15.9% and annualized return of 13.0% Figure 17: Risk Return profile of Islamic mutual funds
Al-Durra Islamic Fund
Al Huda Islamic Fund
Al Darij Investment
Fund
Al Safwa Investment
Fund
Markaz Islamic Fund
Al Dar Securities Fund
-1
3
7
11
15
19
23
27
15 16 17 18 19
Islamic Funds Performance (May 2005 - April 2008)
% R
etur
n M
ay 2
005
- A
pril
200
8
% Risk May 2005 - April 2008 Source: Markaz Research Funds increased their exposure to equities in April 2008. The exposure to equities was 92% as compared to 91% in March (Figure - 18). As such, funds (on a weighted-average basis) held less cash in April 2008, relative to the previous month. Figure 18: Asset Allocation Trends – Kuwait Equity Funds (April 2008)
Fund exposure to equities increased from 91% in March to 92% in April

R E S E A R C H May 2008
Kuwait Financial Centre “Markaz” 16
0% 4%
96%
0%9%
91%
0%8%
92%
Bonds Cash Equities
Feb-08 Mar-08 Apr-08
Source: Markaz Research

R E S E A R C H May 2008
Kuwait Financial Centre “Markaz” 17
Qatar Equity Funds April - strongest month in 2008
Key Highlights
• The Qatari market outperformed other GCC markets in April 2008. • The MSCI Qatar Index and MSCI Qatar Islamic Index gained 23.4%
and 31.0%, respectively, in April 2008, backed by strong performances by heavyweights, such as Industries Qatar (37.6%) and Qatar Islamic Bank (29.0%), reflecting positive earnings growth.
• To capitalize on the stock market momentum, fund managers increased their exposure to equities during the month.
• In Conventional funds, Makaseb Qatar Equity Fund topped the charts, returning 19.7% in April 2008.
• Al-Beit Al-Mali Sharia Compliant Fund, the only Qatari Sharia-compliant fund, posted a gain of 21.6% during the month.
Figure 19: Top Five Conventional Funds (April 2008)
23.4%
19.7% 19.7% 19.3% 19.2% 18.3%
MSCI QatarIndex
MakasebQatar
Equity Fund
Qatar GateFund (N)
Qatar GateFund (Q)
Al WataniFund
Al WataniFund 2
Source: Zawya, Bloomberg & MSCI
Figure 20: Islamic Fund (April 2008)
21.6%
31.0%
MSCI Qatar Islamic Index Al-Beit Al-Mali Shariah Compliant Fund Source: Zawya, Bloomberg & MSCI
The Qatar market was the best performer in April, led by the Industrial and Banking sectors MSCI Qatar Index, with MoM gains of 23.4% in April, was the best performing MSCI index in the GCC region

R E S E A R C H May 2008
Kuwait Financial Centre “Markaz” 18
As Qatar was the best GCC performing market it had a positive effect on all funds in the country, resulting in both Sharia-compliant and Conventional funds posting gains in April 2008. Conventional Qatar Funds Among Conventional Funds, Makaseb Qatar Equity Fund (Mashreq Bank) was the best performer in April 2008, recording 19.7% MoM and 22.9% YTD returns (Table - 12). The top holdings for the funds are Industries Qatar (41.4%), Commercial Bank of Qatar (14.7%), and Qatar National Bank (11.7%). The Fund topped the returns chart largely due to the 37% spike in Industries Qatar stock price, propelled by the 115% growth in the company’s Q1 2008 net profit. Qatar Gate Fund (N) (Amwal) came second with returns of 19.65% MoM and 22.78% YTD. The fund had preferred equity (99.7%) exposure over cash. Top holdings are comprised of Commercial Bank of Qatar (17.8%), Qatar National Bank (16.8%), and Industries Qatar (15.0%). Commercial Bank’s net income surged 64%, which led to the stock rising 10.8% in April. Qatar Gateway Fund (Q) (Amwal) came third with 19.34% returns. Al Watani Fund (Qatar National Bank) and Al Watani Fund 2 (Qatar National Bank) stood fourth and fifth with returns of 19.19% and 18.34%, respectively. The funds gained mainly due to exposure to equity (99% and 100% respectively) than cash. The fact sheet did not disclose data on top holdings of the funds. Table 12: Top Five Conventional Funds (April 2008) Apr-08 Performance (%)
Fund Name Fund
Manager Inception
AUM ($
Mn) Apr-08 YTD 2007 Makaseb Qatar Equity Fund Mashreq May-05 47 19.70% 22.35% 50.45% Qatar Gate Fund (N) Amwal Sep-05 NA 19.65% 22.78% 36.09% Qatar Gate Fund (Q) Amwal Sep-05 NA 19.34% 22.47% 38.81% Al Watani Fund
Qatar Nat. Bank Oct-05 39 19.19% 18.46% 51.72%
Al Watani Fund 2
Qatar Nat. Bank Oct-05 39 18.34% 13.70% 32.51%
Source: Markaz Research Islamic Qatar Funds Al-Beit Al-Mali Sharia Compliant Fund (Qatar National Bank), the only Sharia-compliant fund in Qatar, reported a gain of 21.6% in April 2008 (Table - 13). The YTD returns of the fund stand at 18.1%, lower than April returns due to negative returns of 10.7% in March. However, the overall performance of the fund cannot be analyzed as the fact sheet is unavailable. Table 13: Sharia-compliant Fund (April 2008) Apr-08 Performance (%)
Fund Name Fund
Manager Inception
AUM ($
Mn) Apr-08 YTD 2007 Al-Beit Al-Mali Shariah Compliant Fund
Qatar National
Bank Sep-06 38 21.64% 18.05% 21.41% Source: Markaz Research
Makaseb Qatar Equity Fund topped the charts in April 2008, with a gain of 19.70% Al-Beit Al-Mali Sharia Compliant Fund reported a MoM gain of 21.6% and YTD gain of 18.05% in April

R E S E A R C H May 2008
Kuwait Financial Centre “Markaz” 19
UAE Equity Funds Markets help funds to post gains in April
Key Highlights • Fund managers in UAE had a great month in that the top 5 funds
managed to outperform the benchmark index • Fund managers increased their exposure to equities rather than being
conservative and sitting on cash. • Among Conventional funds, Makaseb Emirates Opportunities Fund
(Mashreq Bank) topped the list, gaining 14.3% in April. • The Sharia-compliant Dubai Growth Fund (3i Capital Group) reported
returns of 6.9% in April 2008—the highest among Sharia funds. Figure 21: Top Five Conventional Funds (April 2008)
9.13%
14.30%
10.99% 10.97%9.83% 9.70%
MSC
I U
AE
Ind
ex
Ma
kase
bEm
ira
tes
Opp
ort
uni
ties
Fund
Al N
okhi
tha
Fund
Em
irat
esG
atew
ay F
und
TN
I U
AE
Blu
eCh
ip F
und
Ma
kase
bEm
ira
tes
Equ
ity
Fun
d
Source: Zawya, Bloomberg & MSCI
Figure 22: Islamic Funds (April 2008)
6.9%
5.4%
2.5%
8.4%
MSCI UAE IslamicIndex
Dubai Growth FundLtd
NBAD UAE IslamicFund
Daman IslamicFund
Source: Zawya, Bloomberg & MSCI
Fund managers retained their focus on equity holdings Dubai Growth Fund posted return of 6.9%, the highest among Islamic funds

R E S E A R C H May 2008
Kuwait Financial Centre “Markaz” 20
The good performance was reflected in the positive returns posted by all conventional and Sharia funds in April. Both MSCI UAE and MSCI UAE Islamic Indices gained 9.1% and 8.4%, respectively, during the month, buoyed by upbeat performances by blue chip and banking companies. Table 14: Top Five Fund Managers (in terms of AUM in April 2008)
Fund Manager AUM ($ Mn) Fund
Manager Focus
Market Share
National Bank of Abu Dhabi 1,183 UAE 67.9% Abu Dhabi Commercial Bank 296 UAE 17.0% Shuaa Capital 104 UAE 6.0% Al Mal Capital 67 UAE 3.9% The National Investors 53 UAE 3.0%
Source: Markaz Research Conventional UAE Funds Among Conventional funds, Makaseb Emirates Opportunities Fund (Mashreq Bank) was the best performing fund for the month (Table - 15). After declining 8.4% in March, the fund returned 14.3% in April. The top holdings for the fund are Arabtec Holding (23.3%), Aldar Properties (21.4%), and Emirates Telecommunications (20.1%). The price of Arabtec appreciated 29.2% to AED15.5 due to good corporate results. Al Nokhitha Fund (Abu Dhabi Commercial Bank), which gained 10.99% MoM, was the second best performer. The fund’s fact sheet attributed the strong performance to stock picks in the energy sector, namely Aabar Petroleum, which outperformed the sector average. Emirates Gateway Fund (Shuaa Capital) stood third with monthly returns of 10.97%. The top holdings for the fund are Arabtec Holding (10.9%), Emirates Telecommunications (10.9%), and Aldar Properties (10.7%). TNI UAE Blue Chip Fund (The National Investor) occupied fourth position, by registering monthly returns of 9.8% and YTD returns of 6.6%. Makaseb Emirates Equity Fund was fifth with a gain of 9.7%. Top holdings include Emaar Properties (20.9%) and Emirates Telecommunications (20.5%). The fund gained as the stock price of Emirates Telecommunications appreciated by 10.0% due to 15.5% growth in net profit.
Table 15: Top Five Conventional Funds (April 2008) Apr-08 Performance (%)
Fund Name Fund
Manager Inception AUM
($ Mn) Apr-08 YTD 2007 Makaseb Emirates Opportunities Fund
Mashreq Bank May-05 9 14.30% 10.63% 57.15%
Al Nokhitha Fund
Abu Dhabi Commercial Bank Mar-05 296 10.99% -0.13% 57.90%
Emirates Gateway Fund
Shuaa Capital Mar-02 104 10.97% 4.02% 54.14%
TNI UAE Blue Chip Fund
The National Investors Apr-05 48 9.83% 6.47% 54.85%
Makaseb Emirates Equity Fund
Mashreq Bank Feb-05 31 9.70% -0.29% 52.19%
Source: Markaz Research TNI UAE Blue Chip Fund (The National Investor) topped the chart with maximum three-year annualized returns of 6.6% with the lowest risk of 22.9% (Figure - 23).
MSCI UAE and MSCI UAE Islamic Indices gained 9.1% and 8.4%, respectively, during the month Makaseb Emirates Opportunities Fund was the best performer, returning 14.3%

R E S E A R C H May 2008
Kuwait Financial Centre “Markaz” 21
Figure 23: Risk Return profile of Conventional mutual funds
Al Nokhitha Fund
Makaseb Emirates Equity
Fund
NBAD UAE Growth Fund
NBAD UAE Trading Fund
Emirates Gateway Fund
TNI UAE Bluechip Fund
-5
-4
-3
-2
-1
0
1
2
3
4
5
6
7
21 23 25 27 29 31 33 35 37 39 41 43 45
Conventional Funds Performance (May 2005 - April 2008)
% R
etu
rn M
ay 2
005
- A
pril
200
8
% Risk May 2005 - April 2008 Source: Markaz Research
Islamic UAE Funds
Dubai Growth Fund (3i Capital Group) posted returns of 6.9% in April. The fund returned 8.9% YTD (Table - 16). The fund fact sheet is unavailable for a more detailed analysis. NBAD UAE Islamic Fund (National Bank of Abu Dhabi) returned 5.4% MoM after posting a loss of 6.8% in March. The fund reported -1.7% YTD returns in April due to losses of 5.1% in January and 6.8% in March. The fund managed to stem the decline mainly due to its large exposure to heavyweight stocks, such as Etisalat (37.4%) and Emaar Properties (16.0%), which gained 10% and 5%, respectively, in April 2008. Daman Islamic Fund (Daman Investments) reported a MoM gain of 2.5% in April. However, negative returns of 4.8% in March and 2.2% in January restricted the fund’s YTD returns to -1.3% in April. The fund was unable to capitalize on the boom due to higher exposure to cash (48%). However, its top holdings, Etisalat (16.7%) and Emaar Properties (10.0%), helped the fund gain 2.5%.
Table 16: Sharia compliant Funds (April 2008)
Apr-08 Performance (%)
Fund Name Fund
Manager Inception AUM
($ Mn) Apr-08 YTD 2007 Dubai Growth Fund Ltd
3i Capital Group Mar-07 NA 6.88% 8.92% 5.00%
NBAD UAE Islamic Fund
National Bank of Abu Dhabi Jan-05 92 5.40% -1.77% 40.43%
Daman Islamic Fund
Daman Investments May-07 NA 2.50% -1.38% 14.33%
Source: Markaz Research
TNI UAE Bluechip Fund led with annualized returns of 6.6% over the last 3 years Dubai Growth Fund posted a positive MoM return of 6.9% and YTD return of 8.9% in April
R E S E A R C H May 2008
Kuwait Financial Centre “Markaz” 22
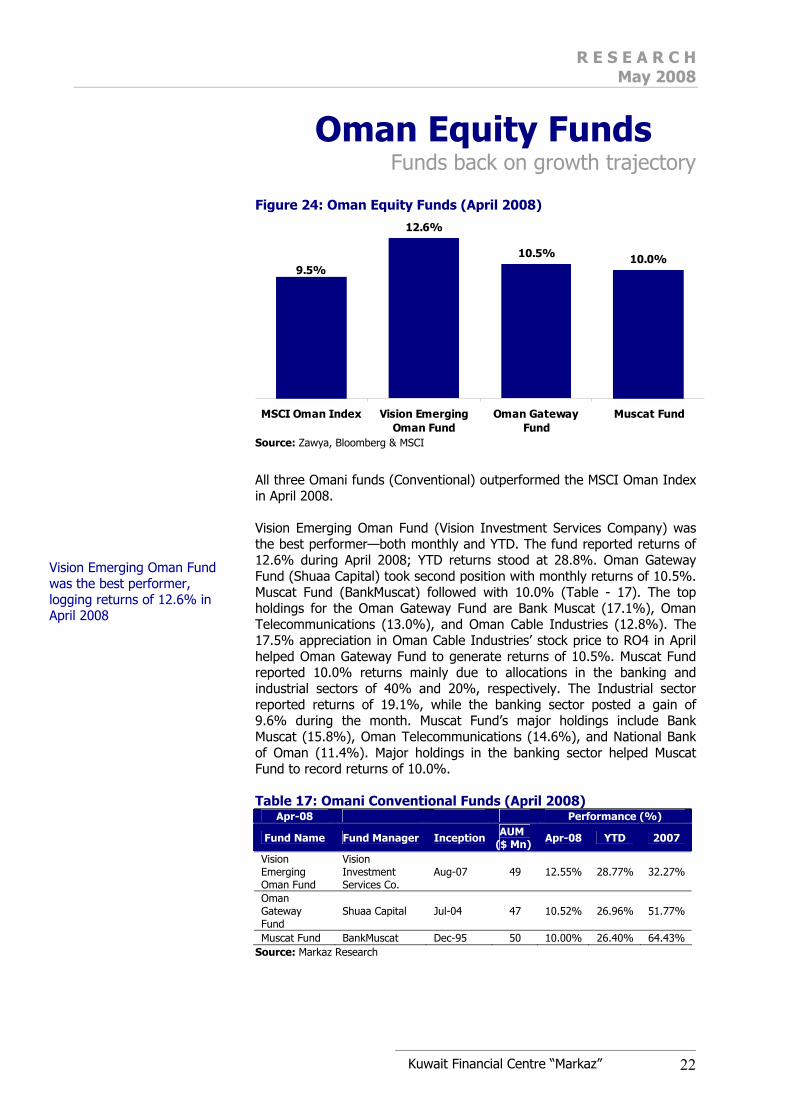
Oman Equity Funds Funds back on growth trajectory
Figure 24: Oman Equity Funds (April 2008)
12.6%
10.5% 10.0%9.5%
MSCI Oman Index Vision EmergingOman Fund
Oman GatewayFund
Muscat Fund
Source: Zawya, Bloomberg & MSCI
All three Omani funds (Conventional) outperformed the MSCI Oman Index in April 2008. Vision Emerging Oman Fund (Vision Investment Services Company) was the best performer—both monthly and YTD. The fund reported returns of 12.6% during April 2008; YTD returns stood at 28.8%. Oman Gateway Fund (Shuaa Capital) took second position with monthly returns of 10.5%. Muscat Fund (BankMuscat) followed with 10.0% (Table - 17). The top holdings for the Oman Gateway Fund are Bank Muscat (17.1%), Oman Telecommunications (13.0%), and Oman Cable Industries (12.8%). The 17.5% appreciation in Oman Cable Industries’ stock price to RO4 in April helped Oman Gateway Fund to generate returns of 10.5%. Muscat Fund reported 10.0% returns mainly due to allocations in the banking and industrial sectors of 40% and 20%, respectively. The Industrial sector reported returns of 19.1%, while the banking sector posted a gain of 9.6% during the month. Muscat Fund’s major holdings include Bank Muscat (15.8%), Oman Telecommunications (14.6%), and National Bank of Oman (11.4%). Major holdings in the banking sector helped Muscat Fund to record returns of 10.0%. Table 17: Omani Conventional Funds (April 2008)
Apr-08 Performance (%)
Fund Name Fund Manager Inception AUM ($ Mn) Apr-08 YTD 2007
Vision Emerging Oman Fund
Vision Investment Services Co.
Aug-07 49 12.55% 28.77% 32.27%
Oman Gateway Fund
Shuaa Capital Jul-04 47 10.52% 26.96% 51.77%
Muscat Fund BankMuscat Dec-95 50 10.00% 26.40% 64.43% Source: Markaz Research
Vision Emerging Oman Fund was the best performer, logging returns of 12.6% in April 2008
R E S E A R C H May 2008
Kuwait Financial Centre “Markaz” 23
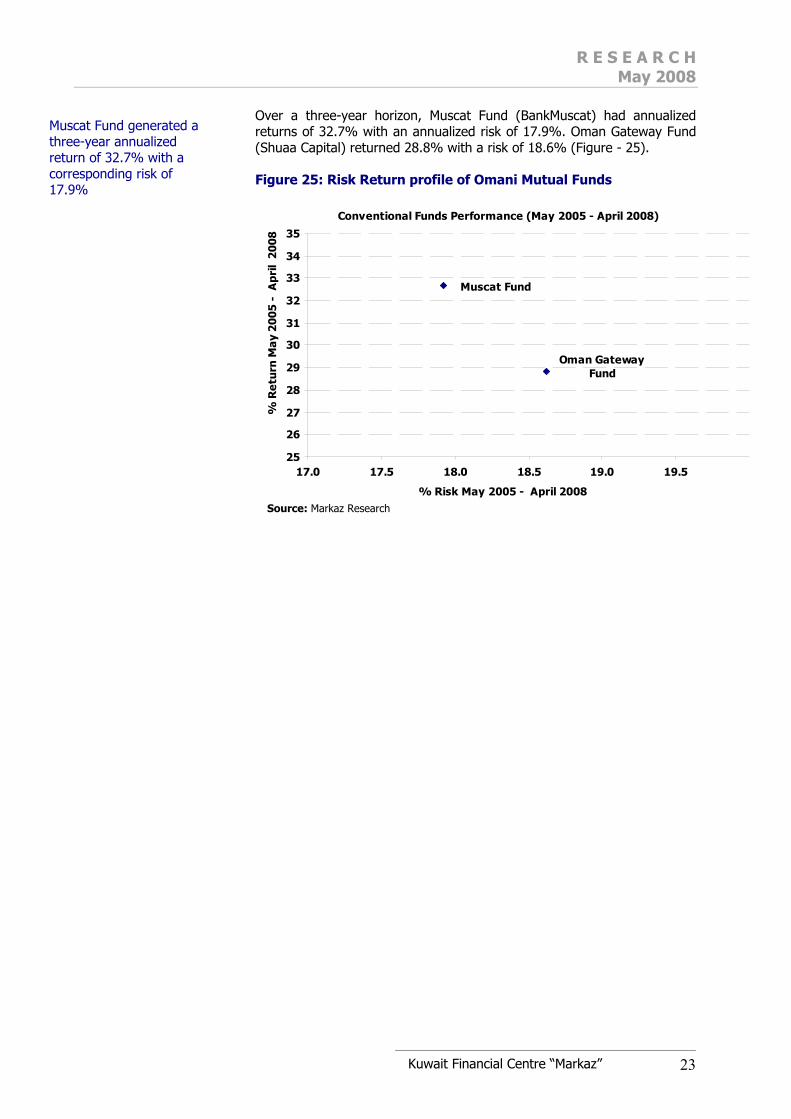
Over a three-year horizon, Muscat Fund (BankMuscat) had annualized returns of 32.7% with an annualized risk of 17.9%. Oman Gateway Fund (Shuaa Capital) returned 28.8% with a risk of 18.6% (Figure - 25). Figure 25: Risk Return profile of Omani Mutual Funds
Oman Gateway Fund
Muscat Fund
25
26
27
28
29
30
31
32
33
34
35
17.0 17.5 18.0 18.5 19.0 19.5
Conventional Funds Performance (May 2005 - April 2008)
% R
etu
rn M
ay 2
005
- A
pri
l 2
008
% Risk May 2005 - April 2008 Source: Markaz Research
Muscat Fund generated a three-year annualized return of 32.7% with a corresponding risk of 17.9%
R E S E A R C H May 2008
Kuwait Financial Centre “Markaz” 24
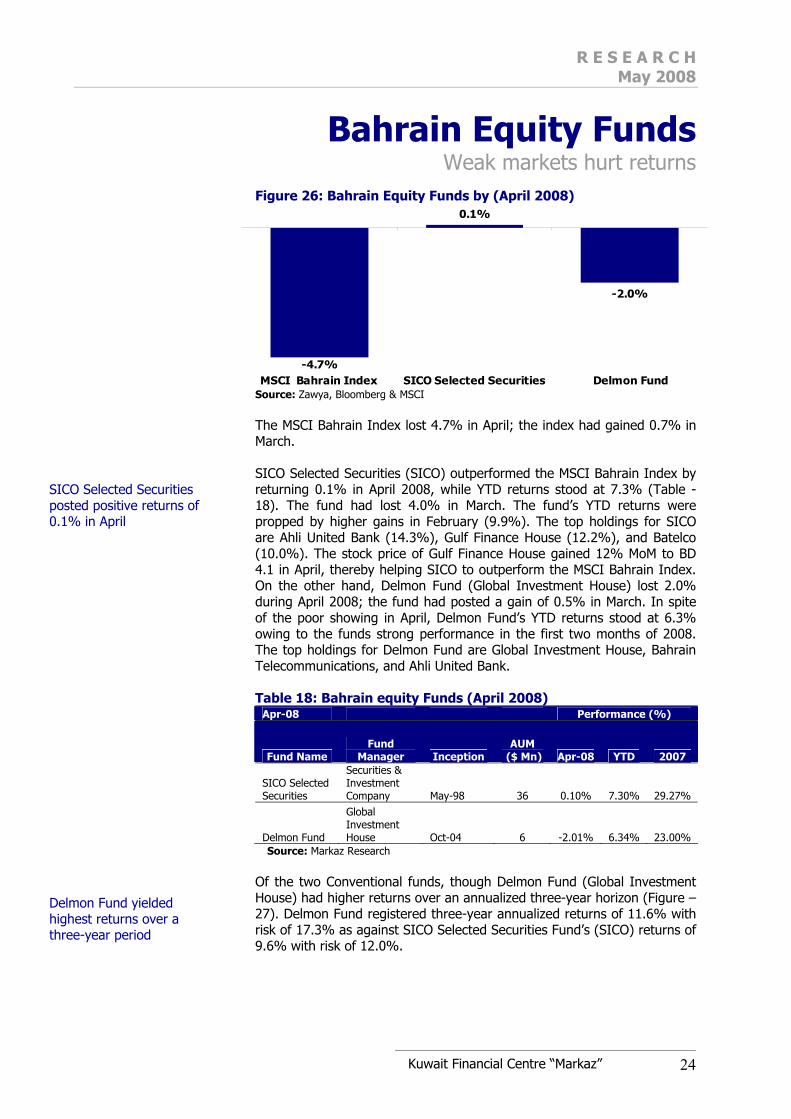
Bahrain Equity Funds Weak markets hurt returns
Figure 26: Bahrain Equity Funds by (April 2008)
0.1%
-2.0%
-4.7%MSCI Bahrain Index SICO Selected Securities Delmon Fund
Source: Zawya, Bloomberg & MSCI The MSCI Bahrain Index lost 4.7% in April; the index had gained 0.7% in March. SICO Selected Securities (SICO) outperformed the MSCI Bahrain Index by returning 0.1% in April 2008, while YTD returns stood at 7.3% (Table - 18). The fund had lost 4.0% in March. The fund’s YTD returns were propped by higher gains in February (9.9%). The top holdings for SICO are Ahli United Bank (14.3%), Gulf Finance House (12.2%), and Batelco (10.0%). The stock price of Gulf Finance House gained 12% MoM to BD 4.1 in April, thereby helping SICO to outperform the MSCI Bahrain Index. On the other hand, Delmon Fund (Global Investment House) lost 2.0% during April 2008; the fund had posted a gain of 0.5% in March. In spite of the poor showing in April, Delmon Fund’s YTD returns stood at 6.3% owing to the funds strong performance in the first two months of 2008. The top holdings for Delmon Fund are Global Investment House, Bahrain Telecommunications, and Ahli United Bank. Table 18: Bahrain equity Funds (April 2008)
Apr-08 Performance (%)
Fund Name Fund
Manager Inception AUM
($ Mn) Apr-08 YTD 2007
SICO Selected Securities
Securities & Investment Company May-98 36 0.10% 7.30% 29.27%
Delmon Fund
Global Investment House Oct-04 6 -2.01% 6.34% 23.00%
Source: Markaz Research
Of the two Conventional funds, though Delmon Fund (Global Investment House) had higher returns over an annualized three-year horizon (Figure – 27). Delmon Fund registered three-year annualized returns of 11.6% with risk of 17.3% as against SICO Selected Securities Fund’s (SICO) returns of 9.6% with risk of 12.0%.
SICO Selected Securities posted positive returns of 0.1% in April
Delmon Fund yielded highest returns over a three-year period

R E S E A R C H May 2008
Kuwait Financial Centre “Markaz” 25
Figure 27: Risk Return profile of Bahrain Equity Funds.
Delmon Fund
SICO Selected Securities
8.0
8.5
9.0
9.5
10.0
10.5
11.0
11.5
12.0
10 11 12 13 14 15 16 17 18
Conventional Funds Performance (May 2005 - April 2008)
% R
etu
rn M
ay
2005
- A
pri
l 2
008
% Risk May 2005 - April 2008 Source: Markaz Research

R E S E A R C H May 2008
Appendix 1: GCC Equity Funds Statistics Sharia compliant Funds
Conventional Funds
Source: Markaz Analysis, Zawya, Lipperweb, Stock Exchange websites
R E S E A R C H May 2008
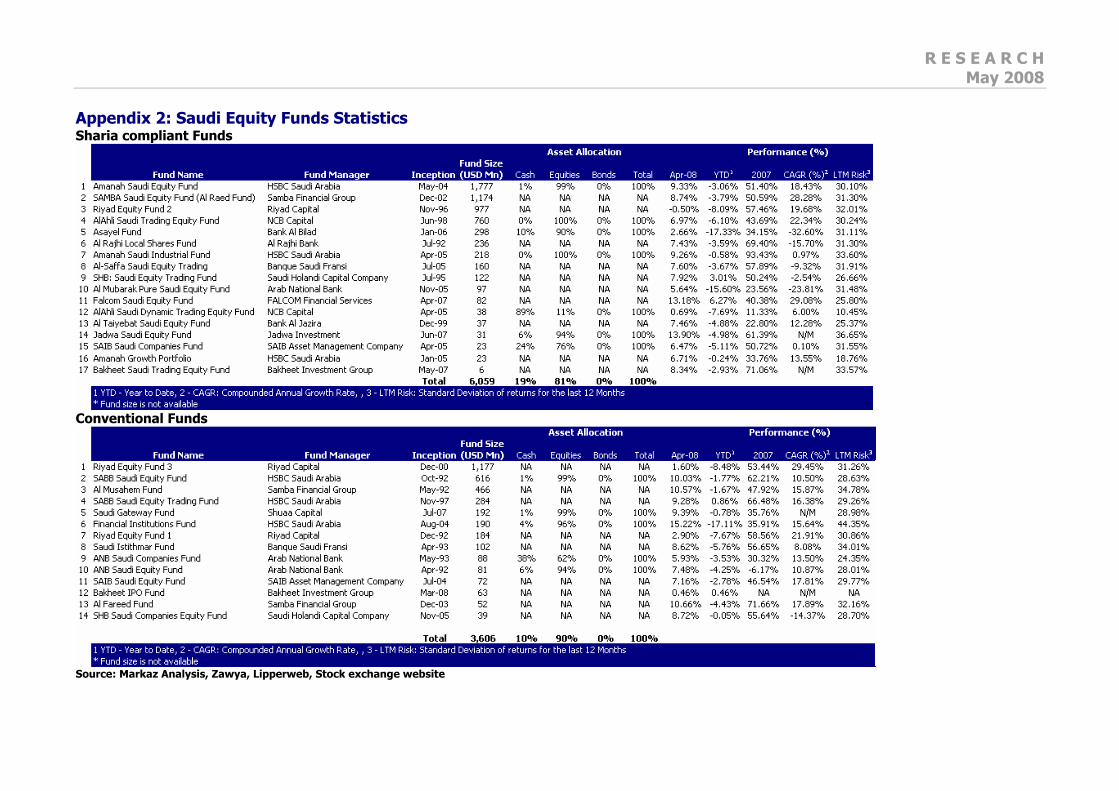
Appendix 2: Saudi Equity Funds Statistics Sharia compliant Funds
Conventional Funds
Source: Markaz Analysis, Zawya, Lipperweb, Stock exchange website
R E S E A R C H May 2008
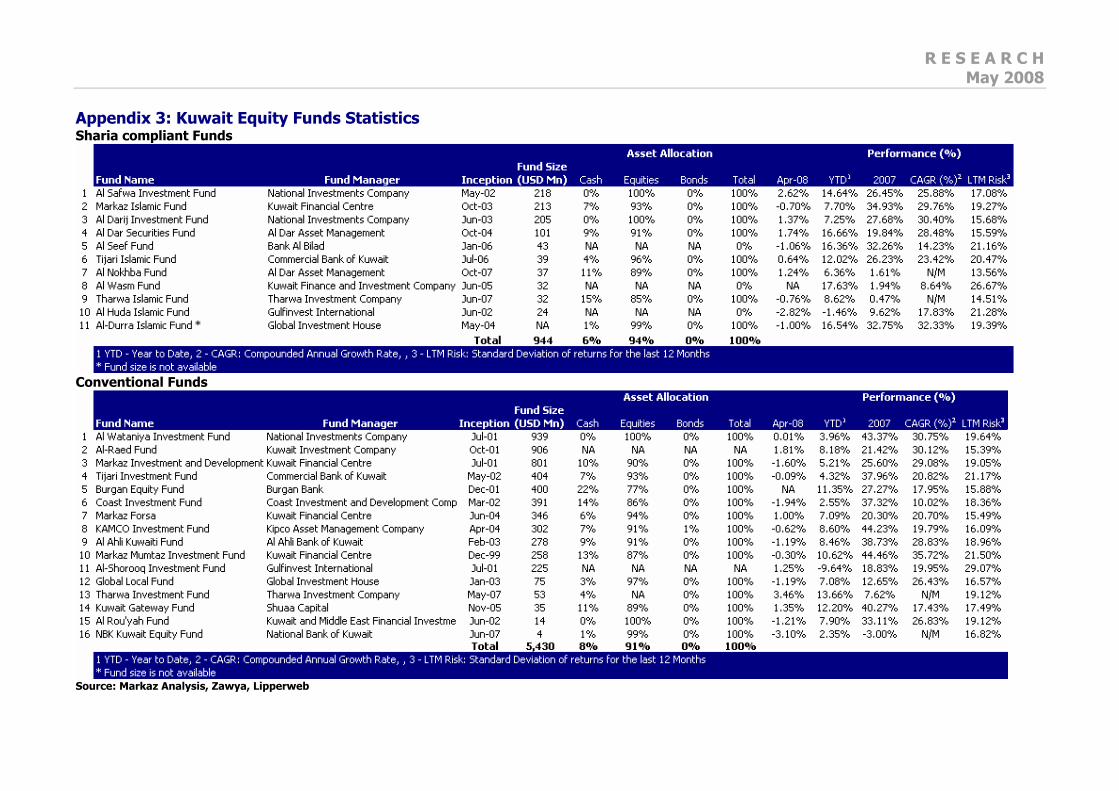
Appendix 3: Kuwait Equity Funds Statistics Sharia compliant Funds
Conventional Funds
Source: Markaz Analysis, Zawya, Lipperweb

R E S E A R C H May 2008
Appendix 4: Qatar Equity Funds Statistics Sharia compliant Funds
Conventional Funds
Source: Markaz Analysis, Zawya, Lipperweb

R E S E A R C H May 2008
Appendix 5: UAE Equity Funds Statistics Sharia compliant Funds
Conventional Funds
Source: Markaz Analysis, Zawya, Lipperweb
R E S E A R C H May 2008
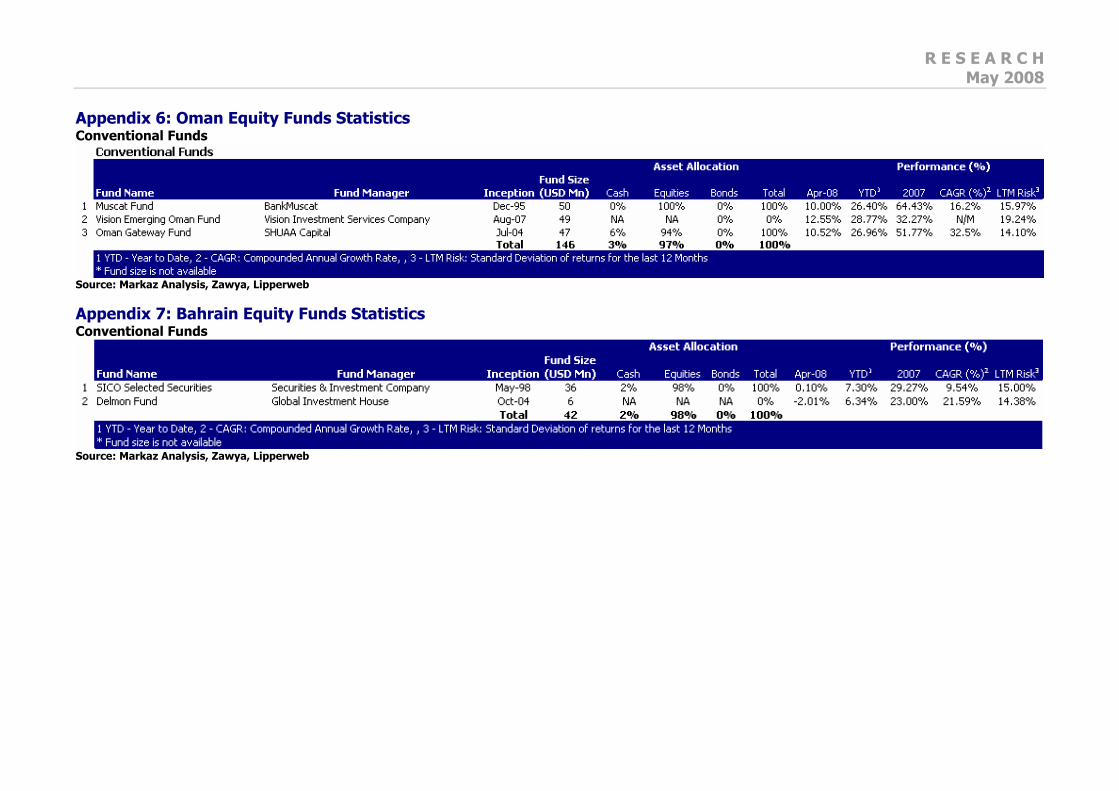
Appendix 6: Oman Equity Funds Statistics Conventional Funds
Source: Markaz Analysis, Zawya, Lipperweb
Appendix 7: Bahrain Equity Funds Statistics Conventional Funds
Source: Markaz Analysis, Zawya, Lipperweb
R E S E A R C H May 2008
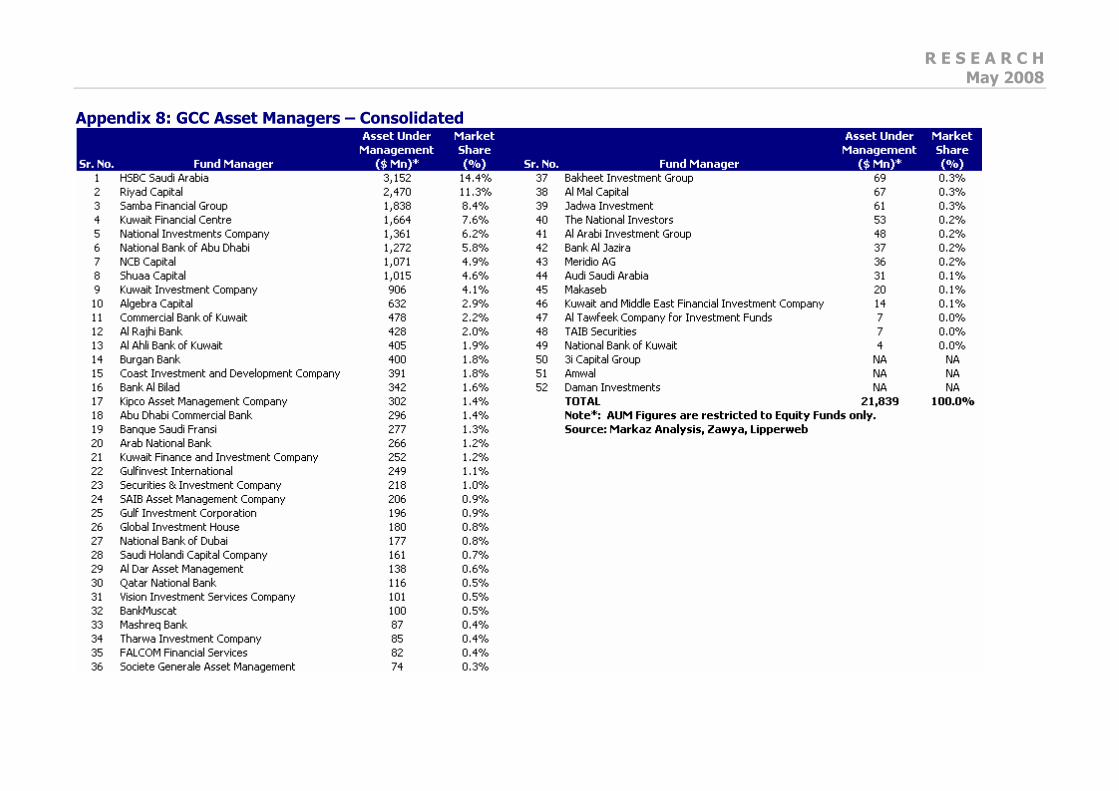
Appendix 8: GCC Asset Managers – Consolidated

R E S E A R C H May 2008
Disclaimer This report has been prepared and issued by Kuwait Financial Centre S.A.K (Markaz), which is regulated by the Central Bank of Kuwait. The report is intended to be circulated for general information only and should not to be construed as an offer to buy or sell or a solicitation of an offer to buy or sell any financial instruments or to participate in any particular trading strategy in any jurisdiction. The information and statistical data herein have been obtained from sources we believe to be reliable but no representation or warranty, expressed or implied, is made that such information and data is accurate or complete, and therefore should not be relied upon as such. Opinions, estimates and projections in this report constitute the current judgment of the author as of the date of this report. They do not necessarily reflect the opinion of Markaz and are subject to change without notice. Markaz has no obligation to update, modify or amend this report or to otherwise notify a reader thereof in the event that any matter stated herein, or any opinion, projection, forecast or estimate set forth herein, changes or subsequently becomes inaccurate, or if research on the subject company is withdrawn. This report does not have regard to the specific investment objectives, financial situation and the particular needs of any specific person who may receive this report. Investors are urged to seek financial advice regarding the appropriateness of investing in any securities or investment strategies discussed or recommended in this report and to understand that statements regarding future prospects may not be realized. Investors should note that income from such securities, if any, may fluctuate and that each security’s price or value may rise or fall. Investors should be able and willing to accept a total or partial loss of their investment. Accordingly, investors may receive back less than originally invested. Past performance is historical and is not necessarily indicative of future performance. Kuwait Financial Centre S.A.K (Markaz) does and seeks to do business, including investment banking deals, with companies covered in its research reports. As a result, investors should be aware that the firm may have a conflict of interest that could affect the objectivity of this report.

Kuwait Financial Centre “Markaz” ا
Strategic Research To Yield or Not to Yield (May 08) The Golden Portfolio (Apr-08) Banking Sweet spots (Apr-08) The “Vicious Square” Monetary Policy options for Kuwait (Feb-08) Outlook 2008: GCC (Jan-08) China and India: Too Much Too Fast (Oct-07) A Potential USD 140b Industry: Review of Asset Management industry in Kuwait (Sep-07) A Gulf Emerging Portfolio: And Why Not? (Jun-07) To Leap or To Lag: Choices before GCC Regulators (Apr-07) Derivatives Market in GCC: Cutting a (very) long market short (Mar-07)
Periodic ResearchGCC Asset Allocation & Volatility (Monthly Since Jul-07) GCC Equity Funds (Monthly since May-07) Markaz Daily Morning Brief KSE Weekly Snapshot KSE Technical Analysis (Weekly) Private Equity Update International Market Update
Company ResearchSABIC (May-08) Samba (May -08) Industries Qatar (May-08)
Sector ResearchReal Estate
Algeria (Mar-08) Jordan (Mar-08) Kuwait (Feb-08) Lebanon (Dec-07) Qatar (Sep-07) Saudi Arabia (Jul-07)
U.S.A. (May-07) Syria (Apr-07)
Markaz Research Offerings
Markaz Research is available on: Bloomberg Type “MRKZ” <GO>, Thomson Financial, Reuters Knowledge, Zawya Investor & Noozz. To obtain a print copy, kindly contact: Kuwait Financial Centre “Markaz” Client Relations & Marketing Department Tel: +965 224 8000 Ext. 1804 Fax: +965 2414499 Postal Address: P.O. Box 23444, Safat, 13095, State of Kuwait Email: [email protected] markaz.com