gbe - goodismanlab.biology.gatech.edu · gbe the author(s) 2015. published by ... assessed between...
TRANSCRIPT

DNA Methylation and Chromatin Organization in Insects
Insights from the Ant Camponotus floridanus
Karl M Glastad1 Brendan G Hunt2 and Michael A D Goodisman11School of Biology Georgia Institute of Technology Atlanta Georgia2Department of Entomology University of GeorgiaCorresponding author E-mail huntbgugaedu michaelgoodismanbiologygatechedu
Accepted February 24 2015
Abstract
Epigenetic information regulates gene function and has important effects on development in eukaryotic organisms DNA methyl-
ation one such form of epigenetic information has been implicated in the regulation of gene function in diverse metazoan taxa In
insects DNA methylation has been shown to play a role in the regulation of gene expression and splicing However the functional
basis for this role remains relatively poorly understood and other epigenetic systems likely interact with DNA methylation to affect
gene expression We investigated associations between DNA methylation and histone modifications in the genome of the ant
Camponotus floridanus in order to provide insight into how different epigenetic systems interact to affect gene function We
found that many histone modifications are strongly predictive of DNA methylation levels in genes and that these epigenetic signals
aremorepredictive ofgene expressionwhenconsidered together thanwhen considered independentlyWealso found thatpeaks of
DNA methylation are associated with the spatial organization of chromatin within active genes Finally we compared patterns of
differential histone modification enrichment to patterns of differential DNA methylation to reveal that several histone modifications
significantlycovarywithDNAmethylationbetweenCfloridanusphenotypesAs thefirstgenomiccomparisonofDNAmethylation to
histone modifications within a single insect taxon our investigation provides new insight into the regulatory significance of DNA
methylation
Key words DNA methylation epigenetics gene expression gene regulation histone modification Camponotus floridanus
Introduction
Most organisms are capable of developing different pheno-
types in response to distinct environmental conditions The
molecular information regulating such developmental plastic-
ity is often heritable through cell divisions yet is not directly
encoded by the genome Transmission of such information is
known as epigenetic inheritance (Berger et al 2009)
One of the most important forms of epigenetic information
is the methylation of DNA DNA methylation is present in all
three domains of life (Klose and Bird 2006 Suzuki and Bird
2008 Glastad et al 2011) and has been linked to variation in
gene regulation in mammals (Maunakea et al 2010 Shukla
et al 2011) plants (Ecker and Davis 1986 Zilberman et al
2008 Zemach et al 2010) and insects (Kucharski et al 2008
Lyko et al 2010 Li-Byarlay et al 2013) In mammals DNA
methylation has traditionally been associated with gene re-
pression particularly when localized to promoter regions
(Bird and Wolffe 1999 Weber et al 2007 Suzuki and Bird
2008) However in mammals plants and even insects
methylation of DNA within gene bodies (exons + introns) is
associated with actively expressed genes (Lyko et al 2010
Maunakea et al 2010 Zemach et al 2010 Glastad et al
2011 Shukla et al 2011) Notably DNA methylation in insects
is present at considerably lower levels than in plants or mam-
mals and is confined almost exclusively to gene bodies in
holometabolous insects (Glastad et al 2011 Hunt et al
2013a) Despite this DNA methylation has been linked to
the regulation of alternative developmental outcomes in
social insects (Kucharski et al 2008) potentially through its
association with alternative splicing (Lyko et al 2010 Shukla
et al 2011 Flores et al 2012 Herb et al 2012 Li-Byarlay et al
2013)
DNA methylation acts in concert with other types of epi-
genetic information For example histone protein posttrans-
lational modifications (hPTMs) also affect gene regulation and
organismal development Like DNA methylation hPTMs have
been found to mediate the binding affinities of protein
GBE
The Author(s) 2015 Published by Oxford University Press on behalf of the Society for Molecular Biology and Evolution
This is an Open Access article distributed under the terms of the Creative Commons Attribution Non-Commercial License (httpcreativecommonsorglicensesby-nc40) which permits
non-commercial re-use distribution and reproduction in any medium provided the original work is properly cited For commercial re-use please contact journalspermissionsoupcom
Genome Biol Evol 7(4)931ndash942 doi101093gbeevv039 Advance Access publication February 26 2015 931
at Georgia Institute of T
echnology on July 9 2015httpgbeoxfordjournalsorg
Dow
nloaded from
complexes such as those related to transcriptional and splicing
machinery (Kolasinska-Zwierz et al 2009 Luco et al 2010
2011 Negre et al 2011) as well as to control the local acces-
sibility of chromatin (Henikoff 2008 Venkatesh et al 2012
Zentner and Henikoff 2013)
Until recently genomic profiles of DNA methylation and
hPTMs were not both available for a single insect species
making it difficult to gain insight into the integration of
DNA methylation in the greater chromatin landscape
Nevertheless comparative epigenomic studies revealed that
patterns of DNA methylation grossly mirror patterns of several
hPTMs across insect orders (Nanty et al 2011 Hunt et al
2013b) These investigations suggest that DNA methylation
acts in concert with hPTMs to affect gene regulation in insects
but the precise relationship between DNA methylation and
hPTMs has yet to be explored With the advent of genome-
wide profiles of DNA methylation (Bonasio et al 2012) and
hPTMs (Simola et al 2013) for distinct castes of the Florida
carpenter ant Camponotus floridanus it is now possible to
investigate how these two important classes of epigenetic
modifications relate to one another at a fine spatial scale
Here we interrogate the relationship between hPTMs and
DNA methylation genome-wide in C floridanus in order to
better understand DNA methylation and its epigenomic
context
We find that hPTMs are highly predictive of DNA methyl-
ation in C floridanus In particular a strong spatial relationship
exists between highly methylated regions (HMRs) and patterns
of hPTM enrichment within actively expressed genes This re-
lationship is further supported by an observed association as
assessed between social insect phenotypes between differen-
tial DNA methylation and differential hPTM enrichment
Overall these findings expand our understanding of the func-
tion of gene body methylation and how it interacts with other
epigenetic information such as that encoded by modifications
to histone proteins
Materials and Methods
Analysis of DNA Methylation
DNA Methylation Level of Genomic Features
Genome-wide processed DNA methylation data for C flori-
danus were obtained from the Gene Expression Omnibus
(GEO series GSE31576 Bonasio et al 2012) for males
minor works and major workers (castes with associated
ChIP-sequencing [ChIP-seq] data) DNA methylation in animals
is predominantly targeted to CpG dinucleotides (Yi and
Goodisman 2009) Thus fractional methylation levels were
calculated as mCGCG for each CpG defined as the number
of reads with methylated cytosines divided by the total number
of reads mapped to the given CpG False discovery rate
(FDR)-corrected binomial P-values provided along with the
CpG read data (Bonasio et al 2012 supplementary files
deposited in GEO series GSE31576) were used to assign a
status of ldquomethylatedrdquo or ldquounmethylatedrdquo to each CpG
(FDRlt 001) Only CpG sites with 4 reads were considered
in analyses Fractional methylation was calculated for specific
genomic features (eg exons introns) as the mean fractional
methylation value of all CpGs within that feature A feature
was called as methylated if at least three CpGs within the
feature were called as methylated according to the binomial
test
Determination of Highly Methylated Regions (HMRs)of the Genome
We sought to detect HMRs of the genome which we define
as areas of high DNA methylation relative to much more lowly
methylated regions directly up- and downstream of the HMR
HMRs were detected by identifying sharp transitions in DNA
methylation levels using a sliding window method
(length = 250 step = 50 bp) wherein focal window DNA
methylation level was compared with all windows within
500 bp upstream (background) We determined that a focal
window belonged to an HMR boundary if the focal window
was greater than the background mean by a fractional DNA
methylation level of at least 03 and if the difference between
the focal window and the background mean exceeded 65
of the DNA methylation value of the focal window Once
established an HMR boundary was extended to include all
adjacent windows that exhibited a fractional methylation
level greater than 50 of the level of the initial boundary
window This analysis was performed in both directions
(50 to 30 and 30 to 50) and resulting HMR boundaries were
connected to form contiguous regions of high methylation
provided all windows either 1) met the criteria for inclusion
in both directional HMR boundaries or 2) possessed a frac-
tional methylation level 50 of the mean of both bound-
aries Unpaired HMR boundaries were themselves called as
HMRs provided they did not fall within 500 bp of another
HMR and possessed at least four methylated CpGs (accord-
ing to the binomial test) Orientation was established by
finding the closest gene (up to 2 kb) to a given HMR and
assigning that HMR its strandedness (Glastad et al 2011)mdash
HMRs not falling within 2 kb of a gene were not assigned a
strand
HMRs in the genome were then compared with gene an-
notations (Cflo_OGSv33) and assigned a status of ldquoexonrdquo
ldquointronrdquo ldquo50-upstreamrdquo or ldquoNArdquo (not overlapping a genic
future) as well as being called as ldquo50-proximalrdquo (1500 bp
from start codon) or ldquonon-50-proximalrdquo (any other genomic
region)
Determination of Differentially Methylated Regions of theGenome between Castes
We identified differentially methylated regions (DMRs) of the
genome between the male and worker castes by examining
Glastad et al GBE
932 Genome Biol Evol 7(4)931ndash942 doi101093gbeevv039 Advance Access publication February 26 2015
at Georgia Institute of T
echnology on July 9 2015httpgbeoxfordjournalsorg
Dow
nloaded from
200 bp windows (step = 100 bp due to the very low number
of DMRs [12] identified between minor and major worker
castes we only considered comparisons between males and
workers) We modeled methylation levels for each genic fea-
ture as a function of two categorical variables ldquocasterdquo and
ldquoCpG positionrdquo using generalized linear models (GLMs) of the
binomial family implemented in the R statistical computing
environment (R Development Core Team 2011) If caste con-
tributed significantly (2 test of GLM terms P-valuelt001) to
the methylation status of a window (after adjustment for mul-
tiple testing using the method of Benjamini and Hochberg
[1995]) the window was considered differentially methylated
between castes (Lyko et al 2010) Only CpG sites that were
significantly methylated (after multiple test correction) in one
or both castes and covered by 4 reads in both libraries were
used in these comparisons Moreover only features with 3
CpG sites were considered in these analyses Once regions
were assigned as DMRs each DMR was then called as ldquoele-
vatedrdquo in the caste with higher fractional methylation level
Overlapping windows of the same differential methylation
status (Caste1 gt Caste2 Caste2 gt Caste1 or not differen-
tially methylated) were then combined
Analysis of Histone Modifications
ChIP-Seq Read Alignment and Signal Estimation
ChIP-seq data are the product of preferential enrichment of
gDNA bound to a specific chromatin protein For each hPTM
raw sequencing reads are processed followed by alignment to
the reference genome of the organism in question Once
aligned reads reflect quantitative levels of ChIP signal that
can then be further normalized to a no antibody (input) con-
trol to produce a base-wise measure of the enrichment of
ChIP signal reads over the control librarymdashreflective of protein
binding or prevalence (Park 2009)
We analyzed the prevalence of hPTMs H3K4me1
H3K4me3 H3K9ac H3K9me3 H3K27ac H3K27me3
H3K36me3 as well as the protein RNA polymerase (pol) II
in males minor workers and major workers (Simola et al
2013) After quality and adaptor trimming (trimmomatic
[Bolger et al 2014]) raw sequencing reads (accession
SRX144014-SRX144044) were mapped to the C floridanus
genome (v30) with bowtie2 (Langmead et al 2009) using
the options ldquomdashsensitive -k 1 -N 0rdquo MACS2 (Zhang et al
2008) was then used to estimate the read enrichment rel-
ative to an input control (as well as bulk histone H3 profiles
for histone modifications to histone H3) for each ChIP li-
brary after removal of any duplicate reads using samtools
(Li et al 2009) Unless otherwise noted all general com-
parisons between DNA methylation and hPTMs employed
DNA methylation and hPTM enrichment averaged across
all three castes
Determination of Peaks of ChIP-Enrichment
Regions of significant ChIP signal enrichment (ChIP enrich-
ment ldquopeaksrdquo) in the genome were established using
MACS2 (FDRlt001) which identifies regions significantly en-
riched with a given ChIP signal relative to control libraries
Such peaks indicate regions that are likely to be strongly
bound by a given chromatin protein We considered a feature
(eg exon intron) to be significantly bound with a given pro-
tein if greater than 10 of its length was overlapped by a
region of significant enrichment for that mark
Determination of Regions of Differential ChIP Enrichmentbetween Castes
Differentially bound regions (DBRs) were established using the
program MAnorm (Shao et al 2012) which uses common
peaks between two libraries (as called by MACS2) to rescale
and normalize ChIP data between two treatments then esti-
mate significance direction and magnitude of differential
ChIP enrichment for all confident ChIP enrichment peaks
Candidate DBRs with an FDR corrected P-value of lt 001
were called as differentially enriched between castes and
the direction of differential binding enrichment was deter-
mined from the MAnorm-produced normalized between-
comparison ChIP enrichment M-value (log2 ratio)
Analysis of Gene Expression
We determined levels of expression for given genes by ana-
lyzing RNA-seq data from the three castes which also have
DNA methylation and ChIP-seq data (male minor worker
major worker Bonasio et al 2010) Raw RNA-seq reads
(GSM563074 GSM921123 and GSM921122) were filtered
and aligned to the C floridanus genome (v33 Bonasio et al
2010) using Tophat (Trapnell et al 2009) with the options
ldquo-r 50 ndashmate-std-dev 11(20) -i 60 ndashno-discordant ndashread-
realign-edit-dist 0 ndashcoverage-search ndashb2-sensitiverdquo specified
Cufflinks (Roberts et al 2011) was run with multiread and
fragment bias correction (ldquo-urdquo and ldquo-brdquo respectively) and
upper quartile normalization was used Assemblies across
castes were merged using cuffmerge (ldquo-srdquo) FPKM (fragments
per kilobase of exon per million fragments mapped) produced
by Cuffdiff was used to quantify expression levels at the level
of the gene
Combined Analysis of DNA Methylation ChIP Analysisand Gene Expression
We investigated if the patterns of DNA methylation were cor-
related with the presence of chromatin proteins in C florida-
nus In order to do so we used measures of mean fractional
DNA methylation level and average normalized ChIP enrich-
ment for each coding sequence (CDS) to perform linear re-
gressions and Spearmanrsquos rank correlations between
epigenetic marks with the JMP statistical software package
DNA Methylation and Chromatin in Insects GBE
Genome Biol Evol 7(4)931ndash942 doi101093gbeevv039 Advance Access publication February 26 2015 933
at Georgia Institute of T
echnology on July 9 2015httpgbeoxfordjournalsorg
Dow
nloaded from
(SAS Institute Inc) For each hPTM we determined the corre-
lation coefficients derived from its correlation with DNA meth-
ylation among all CpGs (allCpG) as well as among only those
CpGs determined to have at least some significant DNA meth-
ylation (mCGs)
We next determined patterns of ChIP-seq enrichment rel-
ative to HMRs ChIP-seq enrichment was calculated for each
HMR as well as for 05 kb regions up- and downstream of
each HMR in order to identify relationships between levels of
DNA methylation and the presence of hPTMs For analyses
of ChIP enrichment profiles relative to HMR boundaries
continuous ChIP enrichment signal was averaged at each
base up to 1 kb up- and down-stream of HMR boundaries
Within HMRs length-proportional bins were used to average
between HMRsmdashallowing for differing HMR lengths
We next investigated if there were relationships between
DMRs and DBRs between C floridanus castes We first com-
pared DMRs to DBRs genome-wide in order to test whether
DMRs are preferentially associated with DBRs We tested for
enrichment of DBRs among DMRs relative to non-DMRs
using a Fisherrsquos exact test We then tested if the directionality
of a DMR showed any significant association with the direc-
tion of differential ChIP enrichment at that locus For each
caste pair we assigned each DMR and DBR the caste which
showed the highest pairwise DNA methylation or ChIP enrich-
ment levels respectively and then determined if hypermethy-
lation in a specific caste was associated with consistent
increases or decreases in that castersquos ChIP enrichment at the
same locus
Finally we were interested in understanding if epigenetic
factors including hPTMs and DNA methylation were jointly
predictive of patterns of gene expression In order to evaluate
the contributions of DNA methylation to gene expression
level we performed multiple regression analyses between
the epigenetic marks (methylation + hPTMs) and gene expres-
sion We first performed regressions between gene expression
and each mark independently We then performed regression
using all epigenetic marks in a multiple regression model For
single-term tests each factor was regressed against gene ex-
pression (log2(FPKM+001)) and bias independently then for
the full test as a component of an additive model including all
factors This enabled a comparison of DNA methylationrsquos
contribution to gene expression when controlling for hPTM
enrichment and vice versa All variables were standardized
(0-centered after normalization) before model fitting
Results and Discussion
DNA Methylation Is Strongly Associated with ActiveHistone Modifications
Recent studies in plants (Zilberman et al 2008 Zemach et al
2010 Coleman-Derr and Zilberman 2012) and animals (Ooi
et al 2007 Cedar and Bergman 2009 Shukla et al 2011)
have demonstrated that epigenetic information encoded by
DNA methylation and hPTMs may interact to affect gene func-
tion We thus sought to evaluate the relationships between
DNA methylation and hPTM enrichment in the C floridanus
genome and thereby improve our understanding of insect
gene regulation
Each hPTM we investigated was significantly over- or un-
derrepresented among methylated genes (fig 1 and supple-
mentary table S1 Supplementary Material online) Consistent
with previous comparative results (Nanty et al 2011 Hunt
et al 2013b) the hPTMs that are generally most strongly as-
sociated with actively expressed genes (H3K4me3 H3K27ac
and H3K36me3 Kharchenko et al 2011) were highly overrep-
resented among methylated genes H3K4me3 H3K27ac and
H3K36me3 were present among over 79 of methylated
genes with 95 of methylated genes featuring at least one
of these hPTMs (supplementary table S1 Supplementary
Material online) Conversely repressive hPTMs (H3K27me3
and H3K9me3 Kharchenko et al 2011) which are generally
associated with much less broadly expressed genes were sig-
nificantly and strongly underrepresented among methylated
genes with less than 2 of methylated genes significantly
enriched for either modification (fig 1 and supplementary
table S1 Supplementary Material online)
Similarly when examining correlations between CDS DNA
methylation levels and hPTM enrichment we found that the
level of gene methylation was strongly positively associated
with the quantitative level of ChIP enrichment for the active
hPTMs H3K4me3 H3K27ac H3K36me3 and H3K4me1 as
well as for RNA polymerase II (RNA pol II) (mean r 053 fig 1
and supplementary table S2 Supplementary Material online)
Conversely the repressive hPTM H3K9me3 was strongly
negatively correlated with CDS DNA methylation levels
(r=062 fig 1 and supplementary table S2
Supplementary Material online) Thus within insect genomes
DNA methylation shows strong preferential targeting relative
to most well-studied hPTMs and is strongly biased to genes
exhibiting active hPTMs Consistent with this finding hPTM
levels explained 65 of the variance in CDS DNA methylation
as inferred by the R2 value generated by multiple regression
(supplementary fig S1 Supplementary Material online)
We observed that many of the correlations between overall
CDS methylation level and hPTM enrichment largely result
from the fact that genes featuring any DNA methylation
were also those most likely to exhibit significant regions of
enrichment or depletion of hPTMs (ie binary associations
fig 1) Consequently when limiting our analysis to only
genes displaying significant levels of DNA methylation we
found that many correlations between DNA methylation
and hPTM enrichment were substantially weakened (fig 1)
hPTMs associated with actively expressed gene TSSs (namely
H3K4me3 and H3K27ac) and RNA pol II however maintained
relatively strong relationships with DNA methylation level
among significantly methylated genes (fig 1) Interestingly
Glastad et al GBE
934 Genome Biol Evol 7(4)931ndash942 doi101093gbeevv039 Advance Access publication February 26 2015
at Georgia Institute of T
echnology on July 9 2015httpgbeoxfordjournalsorg
Dow
nloaded from
despite being considered an ldquoactivatingrdquo mark and being sig-
nificantly colocalized to methylated genes the hPTM H3K9ac
exhibited a considerable negative correlation with DNA meth-
ylation in this methylation-limited analysis This may be due to
DNA methylationrsquos tendency to be most highly targeted to
genes of intermediate expression while H3K9ac is known
to target very highly expressed genes Moreover a previous
analysis found H3K9ac to be strongly preferentially targeted to
high-CpG regions within promoters (supplementary fig S9 of
Simola et al 2013) which are also the most consistently de-
pleted of methylation
Finally though we observed strong relationships between
DNA methylation and hPTMs at the gene level we sought to
evaluate the presence of direct spatial overlap between epi-
genetic marks within genes We found that the observed re-
lationships between DNA methylation and specific hPTMs
remained largely intact when considering DNA methylation
enrichment within regions of significant hPTM enrichment
(supplementary fig S2 Supplementary Material online) or
within spatially restricted windows downstream of the TSS
(supplementary fig S3 Supplementary Material online)
Overall active hPTMs seem to be highly predictive of genic
DNA methylation levels That is active hPTMs are 1) targeted
to the same loci as DNA methylation 2) positively correlated
with DNA methylation levels at these loci and 3) spatially
enriched for DNA methylation within hPTM-marked regions
The hPTM most consistently and strongly associated with DNA
methylation in our analyses was H3K4me3 (fig 1 and supple-
mentary tables S1 and S2 Supplementary Material online)
DNA Methylation and Histone Modifications Bear Similarbut Nonredundant Associations with Gene Expression
We next sought to evaluate how DNA methylation and hPTMs
were related to patterns of gene expression in the broader
context of the other epigenetic information studied here We
compared gene expression levels between genes possessing
at least one region significantly enriched for a given histone
modification andor DNA methylation in order to evaluate the
redundancy of DNA methylation to individual hPTMs in ex-
plaining gene expression levels We found that among genes
possessing at least one region significantly enriched for a given
histone modification those with DNA methylation exhibited
consistently higher expression levels and consistently lower
expression bias than those with the same modifications but
no DNA methylation (fig 2 and supplementary fig S4
Supplementary Material online)
We sought to further evaluate how epigenetic factors and
their interactions related to gene expression in a combined
framework using multiple regression analysis We investigated
-1
0
1
-2
0
2
-2
-1
0
1
-3 -1
-2
-1
0
1
unmethylatedmethylated
+-
H3
K3
6m
e3H
3K
4m
e3
H3
K4
me 1
H3
K9
me 3
H3
K9
ac
H3
K2
7ac
Po
l II
H3
K2
7m
e3
0
4
8
12
0
4
8
12
0
4
8
120
4
8
12
0
4
8
12
0
4
8
12
0
4
8
12
0
4
8
12
-2
-1
0
1
2
-1
0
1
-1
0
1
-1
0
1
genes (thousands)genes (thousands)
genes (thousands)
genes (thousands)genes (thousands)
genes (thousands)
genes (thousands)genes (thousands)
-2 -3 -1-2
-3 -1-2
Rsup2 013 ρ 041Rsup2 021 ρ 051
Rsup2 031 ρ 058Rsup2 017 ρ 041
Rsup2 034 ρ 0603Rsup2 01 ρ 024
Rsup2 002 ρ -001Rsup2 016 ρ -042
Rsup2 034 ρ 063Rsup2 019 ρ 0463
Rsup2 029ρ -062Rsup2 004 ρ -001
Rsup2 002ρ 002Rsup2 006 ρ 022
Rsup2 008ρ 025Rsup2 017 ρ 045
log (mCGCGtotal)10
log (mCGCGtotal)10
log (mCGCGtotal)10
+-
+-
hPTMstatus
hPTMstatus
hPTMstatus
FIG 1mdashHistone modification enrichment as a function of DNA methylation levels for methylated (red) and unmethylated (blue) genes Linear fits for all
genes (black line) and methylated genes only (red line) are provided along with their relevant R2 values and Spearmanrsquos correlations r Bars represent the
number of genes belonging to each class those with significant histone posttranslational modification (hPTM) enrichment (+) and those without ()
DNA Methylation and Chromatin in Insects GBE
Genome Biol Evol 7(4)931ndash942 doi101093gbeevv039 Advance Access publication February 26 2015 935
at Georgia Institute of T
echnology on July 9 2015httpgbeoxfordjournalsorg
Dow
nloaded from
if hPTMs and DNA methylation were predictive of gene
expression level and gene expression bias among castes
as measured by RNA-seq We first performed regressions
between each epigenetic mark and gene expression sepa-
rately Not surprisingly DNA methylation showed a signif-
icant positive association with gene expression when
regressed singly (table 1) Moreover when incorporated
into a full regression involving all epigenetic marks DNA
methylation still contributed significantly to the modeling of
gene expression This indicates that even after accounting
for the contribution of hPTMs DNA methylation remains
independently associated with gene expression (table 1)
Thus though DNA methylation is highly correlated with
active hPTMs methylated genes were more highly and
broadly expressed than unmethylated genes even when
controlling for hPTM status
Histone Modifications Are Strongly Spatially OrganizedRelative to Regions of DNA Methylation in InsectGenomes
Up to this point we have described associations between
DNA methylation and hPTMs as summarized at the level of
genes These analyses provide important insight into the coas-
sociation of DNA methylation and hPTMs as it relates to pat-
terns and levels of gene expression However such analyses
are unable to provide insight into the precise localization of
DNA methylation and hPTMs let alone their interplay Thus
we sought to evaluate levels and patterns of hPTM enrichment
at a fine spatial scale relative to HMRs This facilitates an
evaluation of hPTM enrichment within the spatial context of
DNA methylation but independent of other genomic anno-
tations (gene features etc) To accomplish this aim we first
developed an algorithm to establish regions of high fractional
DNA methylation bordered by regions of much lower DNA
methylation (see Materials and Methods) This produced a set
of 7382 highly methylated regions which were subsequently
analyzed for hPTM enrichment
HMRs represent loci displaying relatively high levels of
methylation in the otherwise-sparsely methylated C floridanus
genome with an average fractional methylation level of 063
and almost 70 of individual highly methylated CpGs (CpGs
withgt05 fractional DNA methylation) falling within an HMR
Despite this HMRs were only an average of 6503 bp (SD
3356 bp) long and while over 85 of genes with significant
DNA methylation featured at least one HMR (49225785
methylated genes) HMRs only covered about 33 of the
area of these genes Thus even within methylated genes re-
gions of high methylation are often limited to only a portion of
the gene most frequently at the 50-end of these genes
(Bonasio et al 2012 Hunt et al 2013a) As expected out of
7382 HMRs the great majority (6927 938) were located
within or near genes and only 227382 of such peaks did not
fall within 2 kb of a gene annotation or RNA-seq-based cuf-
flinks annotation (supplementary table S3 Supplementary
Material online) Of these 22 only 14 showed no RNA-se-
quencing coverage from the samples analyzed here Thus
the overwhelming majority of HMRs are associated with ex-
pressed genes
mar
ked
not
mar
ked
mar
ked
not
mar
ked
mar
ked
not
mar
ked
mar
ked
not
mar
ked
H3K4me3 H3K27ac RNAPolII H3K36me3
H3K4me1 H3K9ac H3K27me3 H3K9me3
4
2
0
4
2
0
log2
(FPK
M)
log2
(FPK
M)
unmethylatedmethylated
FIG 2mdashMethylated genes are more highly expressed independent of hPTM status Expression levels (log2(FPKM)) of genes associated (marked) or not
associated (not marked) with particular histone modifications Methylated genes exhibit consistently higher expression relative to unmethylated genes
regardless of their associations with particular histone posttranslational modifications
Glastad et al GBE
936 Genome Biol Evol 7(4)931ndash942 doi101093gbeevv039 Advance Access publication February 26 2015
at Georgia Institute of T
echnology on July 9 2015httpgbeoxfordjournalsorg
Dow
nloaded from
Studies of hPTMs in C floridanus and other insects have
revealed that many hPTMs particularly those associated with
actively transcribed genes exhibit a strong spatial organization
relative to the TSS of genes (Kharchenko et al 2011 Simola
et al 2013) TSSs and surrounding proximal regions of active
genes are marked with highly accessible chromatin and en-
riched with the hPTM H3K4me3 In contrast further-30 re-
gions of the same transcribed genes are marked with the
hPTM H3K36me3 indicative of less-accessible regions of chro-
matin characterized by transcriptionally elongating RNA pol II
(Bannister and Kouzarides 2011 Kharchenko et al 2011)
Recent investigations have revealed that DNA methylation in
C floridanus and other holometabolous insects is preferen-
tially targeted to the 50-region of genes immediately down-
stream of the TSS (Bonasio et al 2012 Hunt et al 2013a) The
common spatial organization of active hPTMs and DNA meth-
ylation relative to gene starts suggests a functional interde-
pendence between DNA methylation and hPTMs within
actively expressed insect genes
Consistent with this idea we found that HMRs exhibited
significantly different levels of enrichment for most active
hPTMs relative to regions directly up- and downstream of
HMRs (fig 3 and supplementary fig S5 Supplementary
Material online) More specifically HMRs tend to lie between
distinctive promoter- and gene body-associated hPTMs TSS-
associated active hPTMs including H3K9ac H3K4me3
H3K27ac as well as RNA pol II were enriched upstream of
HMRs while H3K36me3 was depleted upstream and enriched
downstream of HMRs (fig 3b and c and supplementary fig
S5 Supplementary Material online) For these active hPTMs
we also found that the level of HMR methylation correlated
positively with quantitative levels of ChIP enrichment within or
nearby HMRs (fig 4) indicating a strong quantitative link be-
tween hPTM enrichment and DNA methylation at a local level
Notably we found that active TSS-associated hPTMs were
most strongly correlated with HMR methylation level directly
upstream of the HMR and not within the HMR itself (fig 4)
The TSS-proximal boundary between H3K4me3 and
H3K36me3 represents a boundary between two distinct tran-
scriptionally relevant chromatin states across the bodies of
actively transcribed genes These states are established (or
maintained) at least in part due to the fact that the histone
methyltransferase responsible for establishing H3K4me3 binds
preferentially to initiating RNA pol II associated with transcrip-
tional start sites while that responsible for H3K36me3 depo-
sition binds the form of RNA pol II associated with
transcriptional elongation (Bannister and Kouzarides 2011)
We found that RNA pol II exhibited significantly lower levels
of enrichment at HMRs relative to up- and downstream re-
gions independent of the genomic context or length of the
HMR (exonintron 50-30-proximal localization fig 3b and c
and supplementary fig S6 Supplementary Material online)
and was the only ChIP feature examined to exhibit consider-
able negative log-fold enrichment (indicative of depletion) at
HMRs This finding is particularly striking given that RNA pol II
exhibits a signal of enrichment both directly up- and down-
stream of HMRs It is possible this RNA pol II depletion at HMRs
is related to an alteration of RNA pol II kinetics within or sur-
rounding highly methylated DNA a phenomenon observed in
previous studies (Lorincz et al 2004 Zilberman et al 2007
Maunakea et al 2013) Because of the strong tendency for
H3K4me3 to be highly enriched upstream of HMRs and
H3K36me3 to be highly enriched downstream of HMRs it is
tempting to speculate that through the alteration of RNA pol
II dynamics intragenic DNA methylation plays a role in the
formation of a chromatin boundary that differentiates states
of transcriptional initiation and elongation within actively
expressed genes Indeed prior studies suggest that the con-
version of TSS-proximal initiating RNA pol II into the elongat-
ing form plays an important role in the establishment of the
Table 1
Regression Analysis for Estimating Gene Expression Level and Bias from Epigenetic Marks
Gene Expression Level Gene Expression Bias
Effect R2
(single term)
Coefficient
(single term)
Coefficient
(full model)
R2
(single term)
Coefficient
(single term)
Coefficient
(full model)
DNA-methylation 0279 1875 0424 0165 04010170
H3K4me3 0273 18690128 0151 0476 0162
H3K4me1 0222 1684 0238 0086 05040067
H3K27me3 0081 10200537 0002 0021 0161
H3K27ac 0343 2096 0891 0207 05670272
H3K36me3 0344 2097 1382 0205 06180373
H3K9me3 0307 19830610 0279 0723 0233
H3K9ac 0082 10220119 0084 0390
0255
PolII 0124 05580256 122E-05 0010 0164
R2 adj (full model) 05086 04126
NOTEmdashCoefficients for both single-term tests and full model are provided Plt 005 Plt 001 Plt 0001 Plt 00001 N =15165
DNA Methylation and Chromatin in Insects GBE
Genome Biol Evol 7(4)931ndash942 doi101093gbeevv039 Advance Access publication February 26 2015 937
at Georgia Institute of T
echnology on July 9 2015httpgbeoxfordjournalsorg
Dow
nloaded from
distinct chromatin state associated with gene bodies (Brookes
and Pombo 2009 Badeaux and Shi 2013) Thus our finding
that RNA pol II enrichment was lowest at HMRs relative to up-
and downstream regions (fig 3 and supplementary fig S6
Supplementary Material online) suggests the possibility that
the strong associations seen here between DNA methylation
and hPTM enrichment may result from DNA methylationrsquos
alteration of RNA pol II kinetics within and surrounding meth-
ylated DNA (Lorincz et al 2004 Zilberman et al 2007
Maunakea et al 2013)
Of all chromatin marks we investigated only H3K4me1
consistently showed its highest levels of enrichment within
H3K36me3H3K4me1fractional methylation
RNA Pol IIH3K4me3
(b)
0
1
2
025
05
075
-10
-05
00
00
02
04
06
HMR-1kb +1kb
0
1
2
025
05
075
-10
-05
00
00
02
04
06
ChI
P lo
g2(fo
ld e
nric
hmen
t)D
NA
met
hyla
tion
HMR-1kb +1kb
HMR-1kb +1kb
(c)
H3K27ac
ChI
P lo
g2(fo
ld e
nric
hmen
t)D
NA
met
hyla
tion
[0 - 100]
[0 - 10]
[0 - 12]
[0 - 461]
[0 - 262]
110 kb 120 kb 130 kb 140 kb40 kb
C floridanusOGS (v33)
HMRs
H3K4me3
H3K4me1
RNA pol II
H3K36me3
DNA methylation
Scaffold 98(a)
5rsquo-proximalnon-5rsquo-proximal
FIG 3mdashActive histone modification enrichment significantly differs between HMRs and non-HMRs (a) Example genome browser track showing stark
spatial contrast between DNA methylation (HMRs) and promoter-proximal active chromatin (highlighted in red boxes) (b) Spatial relationship between DNA
methylation and select histone posttranslational modifications or polymerases (c) ChIP enrichment at HMRs separated by whether they fall within 1200bp
of a gene start (ldquo50-proximalrdquo) or not (ldquonon-50-proximalrdquo) Significance values represent results of KruskalndashWallis tests comparing HMRs and 500 bp regions
in each direction of HMR boundaries Repressive hPTMs showed little organization relative to HMRs and were thus excluded
Glastad et al GBE
938 Genome Biol Evol 7(4)931ndash942 doi101093gbeevv039 Advance Access publication February 26 2015
at Georgia Institute of T
echnology on July 9 2015httpgbeoxfordjournalsorg
Dow
nloaded from
HMRs relative to up- and downstream regions (where it was
consistently depleted fig 3c and supplementary fig S5
Supplementary Material online) Interestingly while positively
correlated with HMR methylation level within the HMR we
found that H3K4me1 enrichment within 1 kb upstream of
HMRs was negatively correlated with the level of HMR meth-
ylation (r039 vs 037 for 1 kb upstream and within HMRs
respectively fig 4) Thus as the DNA methylation level of
HMRs increases the enrichment of H3K4me1 within those
regions also increases however within the region directly up-
stream of HMRs H3K4me1 is more depleted with increasing
DNA methylation (fig 4 and supplementary fig S7
Supplementary Material online) At least one recent report
has noted that within active gene bodies H3K4me1 is impor-
tant to limiting domains of H3K4me3-marked open chromatin
to promoter-proximal regions (Cheng et al 2014) Indeed
H3K4me1 is often seen flanking TSS-proximal enriched re-
gions of H3K4me3 within active gene bodies (Kharchenko
et al 2011)
It is possible that the patterning of hPTMs around HMRs is
linked to H3K4me3 exclusion either through DNA methyla-
tion informing or being targeted to this boundary However
we are unable to determine whether DNA methylation plays a
causal role in chromatin boundary formation in insects with
the current data Nevertheless the fact that abrupt differences
in RNA pol II H3K4 methylation and H3K36me3 exist within
and around HMRs suggests that the hypothesis that DNA
methylation may alter or maintain local chromatin states war-
rants testing in future investigations Notably both the pat-
terning of hPTMs around active gene TSSs and the alternative
splicing of exons involve differences in H3K4me1 and RNA pol
II (Luco et al 2010 2011 Cheng et al 2014 Stasevich et al
2014) thus highlighting the possibility that the regulation of
genic chromatin domains may help to explain DNA methyla-
tionrsquos link with alternative splicing in insects (Lyko et al 2010
Bonasio et al 2012 Herb et al 2012)
Differential DNA Methylation Is Associated withDifferential Histone Modification Enrichment
We next sought to examine whether regions exhibiting signif-
icant differences in levels of DNA methylation between
C floridanus castes also exhibited significant differences in
hPTM enrichment Thus we compared DMRs to a set of re-
gions exhibiting significantly different hPTM enrichment (dif-
ferentially bound regions DBRs) between males and female
workers
We found that DMRs were significantly enriched for
several DBRs (hPTMs H3K27ac H3K4me1 H3K4me3 and
H3K9me3) relative to methylated regions not displaying sig-
nificant differences between males and workers (table 2)
Thus even at the coarse resolution provided by whole body
samples DMRs exhibit significantly more DBRs than non-DMR
genes
Moreover we found that DNA methylation biased to either
males or workers was significantly associated with hPTM en-
richment in the opposite phenotype for H3K4me3 and RNA
pol II (fig 5 and supplementary table S5 Supplementary
Material online) This is again consistent with a hypothesized
functional link between DNA methylation and the patterning
of genic chromatin wherein DNA methylation exhibits spatial
antagonism with RNA pol II and H3K4me3
In Arabidopsis thaliana (Zilberman et al 2008 Coleman-
Derr and Zilberman 2012) and likely vertebrates (Zemach
-04 -02 0 02 04
H3
H3K4me3
H3K4me1
H3K27me3
H3K27acH3K36me3
H3K9me3
H3K9ac
PolII
upstreamHMRdownstream
Spearmanrsquos rank correlation coefficient with HMR methylation level
00 075
-1kb
+1kb
fractional DNA methylation
FIG 4mdashDistinct associations between DNA methylation and hPTMs
upstream and downstream of HMRs Spearmanrsquos rank correlation coeffi-
cients between methylation level for HMRs and histone posttranslational
modification enrichment within HMRs and 1kb up- and downstream of
HMRs
Table 2
Association Tests between a Genomic Regionrsquos Differential
Methylation Status and Differential ChIP Enrichment as Assessed
between Castes
hPTM Methylation
Status
Non-DBR DBR Fold
Enrichment
P-Value
H3K27ac Non-DMR 5559 1754 110 00002
DMR 2754 980
H3K27me3 Non-DMR 10 82 123 00184
DMR 11 29
H3K36me3 Non-DMR 1878 2782 102 NS
DMR 1148 1607
H3K4me1 Non-DMR 1158 480 124 00006
DMR 466 267
H3K4me3 Non-DMR 4640 3502 139 lt00001
DMR 1950 2912
H3K9ac Non-DMR 4460 857 100 NS
DMR 3349 641
H3K9me3 Non-DMR 166 104 120 00386
DMR 172 147
RNA Pol II Non-DMR 1266 426 102 NS
DMR 647 213
NOTEmdashThe numbers of genomic regions falling into each pairwise categoryfor the different hPTMs are provided along with fold enrichment of DMRs coin-ciding with DBRs relative to regions not differentially associated by either epige-netic signal (negative fold enrichment represents hPTM for which DMRs areunderrepresented among DBRs) P-values derived from a Fisherrsquos exact test(Plt 005 in bold)
DNA Methylation and Chromatin in Insects GBE
Genome Biol Evol 7(4)931ndash942 doi101093gbeevv039 Advance Access publication February 26 2015 939
at Georgia Institute of T
echnology on July 9 2015httpgbeoxfordjournalsorg
Dow
nloaded from
et al 2010) DNA methylation is known to play a role in
altering chromatin within and directly surrounding methylated
regions Specifically methylation acts as a boundary to H2AZ
an important TSS-associated histone variant that is linked to
chromatin activation (Zilberman et al 2008 Zemach et al
2010 Coleman-Derr and Zilberman 2012) Because H2AZ is
a highly conserved component of the epigenome of active
genes and has been shown to strongly correlate with DNA
methylation and promoter-proximal active gene hPTMs
(Zilberman et al 2008) it is possible many of our observations
are reflective of the conserved mechanism of H2AZ exclusion
by DNA methylation operating in insects However because
this histone variant was not tested directly in our study addi-
tional research will be required to test this hypothesis
Conclusion
Our results provide several important insights into insect DNA
methylation By assessing for the first time the relationship
between DNA methylation and hPTMs within a single insect
taxon we provide a foundation for understanding the greater
epigenome in insects In particular our results suggest that the
function of intragenic DNA methylation is linked to the func-
tion of key active histone modifications with over 90 of
methylated genes also featuring the hPTMs H3K4me3 or
H3K36me3 As additional support to this claim we provide
evidence that DNA methylation and active hPTM enrichment
covary between distinct phenotypes in C floridanus suggest-
ing that changes to DNA methylation are coupled with
changes in chromatin modifications Despite the striking con-
cordance between DNA methylation and hPTMs however
our results suggest the function of DNA methylation is not
entirely redundant to hPTMsmdashDNA methylation retains ex-
planatory power for gene expression levels when controlling
for numerous hPTMs
Studies in plants and animals have shown that variation
in gene body DNA methylation affects gene regulation by
altering local chromatin and the rate of elongation of RNA
pol II (Zilberman et al 2007 Maunakea et al 2013)
Likewise our findings are consistent with a functional link
between DNA methylation and the organization of chroma-
tin Our spatial analysis of DNA methylation and hPTMs re-
veals a strong patterning of multiple functionally distinct
hPTMs and RNA pol II relative to methylated regions
Most notably RNA pol II is depleted and H3K4me1 en-
riched within HMRs We hypothesize that intragenic DNA
methylation contributes to changes in chromatin and
chromatin boundaries within active insect genes particularly
those that differentiate states of transcriptional initiation
and elongation occurring near the transcription start site
This hypothesis may help to explain why DNA methylation
is preferentially targeted to 50-regions of genes in most
investigated insects (Bonasio et al 2012 Hunt et al
2013a) Furthermore as both alternative splicing and TSS-
proximal chromatin organization have been linked to the
dynamics of RNA pol II and H3K4me1 (among other
hPTMs) (Luco et al 2010 2011 Cheng et al 2014) it is
possible that the previously observed link between DNA
methylation and alternative splicing in insects (Lyko et al
2010 Bonasio et al 2012 Herb et al 2012) is influenced
by hPTMs
As we look to the future it is clear that studies seeking
to establish the epigenetic basis for developmental regula-
tion in insects as with environmental caste determination
(Kucharski et al 2008) will benefit from investigating both
DNA methylation and hPTMs In doing so a meaningful
exploration of the causal links between epigenetic modifica-
tions chromatin boundary formation gene regulation and
developmental fate will require extensive advancement of
reverse genetic approaches to the perturbation of enzymatic
mediators of epigenetic modifications in previously nonmo-
del insects
H3
K3
6m
e3
H3
K4
me
3H
3K
4m
e1
H3
K2
7a
c
Po
lII
-02
00
02
-01
00
01
-01
00
01
-02
00
02
-02
-01
00
01
02
NS
NS
NS
P lt 00001P gt 005
log
2(m
ale
wo
rke
r)
log
2(m
ale
wo
rke
r)
log
2(m
ale
wo
rke
r)
log
2(m
ale
wo
rke
r)lo
g2
(ma
lew
ork
er)
male workerNA
male workerNA
male workerNA
male workerNA
male workerNA
FIG 5mdashDMRs show significantly different directional hPTM enrich-
ment between male and worker phenotypes Active histone posttransla-
tional modification (hPTM and RNA pol II) log2 fold differences between
males andworkers as they relate to regions of significant directional dif-
ferential methylation (positive values on y axes indicate male-biased ChIP
enrichment whereas negative values indicate worker bias x axes ldquomalerdquo
male hypermethylated ldquoworkerrdquo worker hypermethylated NA not dif-
ferentially methylated between phenotypes)
Glastad et al GBE
940 Genome Biol Evol 7(4)931ndash942 doi101093gbeevv039 Advance Access publication February 26 2015
at Georgia Institute of T
echnology on July 9 2015httpgbeoxfordjournalsorg
Dow
nloaded from
Supplementary Material
Supplementary tables S1ndashS5 and figures S1ndashS7 are available
at Genome Biology and Evolution online (httpwwwgbe
oxfordjournalsorg)
Acknowledgments
This work was supported by the US National Science
Foundation (DEB-0640690) and the Georgia Tech-Elizabeth
Smithgall Watts endowment
Literature CitedBadeaux AI Shi Y 2013 Emerging roles for chromatin as a signal inte-
gration and storage platform Nat Rev Mol Cell Biol 14211ndash224
Bannister AJ Kouzarides T 2011 Regulation of chromatin by histone
modifications Cell Res 21381ndash395
Benjamini Y Hochberg Y 1995 Controlling the false discovery rate a
practical and powerful approach to multiple testing J R Stat Soc B
57289ndash300
Berger SL Kouzarides T Shiekhattar R Shilatifard A 2009 An operational
definition of epigenetics Genes Dev 23781ndash783
Bird AP Wolffe AP 1999 Methylation-induced repressionmdashbelts braces
and chromatin Cell 99451ndash454
Bolger AM Lohse M Usadel B 2014 Trimmomatic a flexible trimmer for
Illumina sequence data Bioinformatics 302114ndash2120
Bonasio R et al 2010 Genomic comparison of the ants Camponotus
floridanus and Harpegnathos saltator Science 3291068ndash1071
Bonasio R et al 2012 Genome-wide and caste-specific DNA methylomes
of the ants Camponotus floridanus and Harpegnathos saltator Curr
Biol 221755ndash1764
Brookes E Pombo A 2009 Modifications of RNA polymerase II are
pivotal in regulating gene expression states EMBO Rep 10
1213ndash1219
Cedar H Bergman Y 2009 Linking DNA methylation and histone
modification patterns and paradigms Nat Rev Genet 10
295ndash304
Cheng J et al 2014 A role for H3K4 monomethylation in gene repression
and partitioning of chromatin readers Mol Cell 53979ndash992
Coleman-Derr D Zilberman D 2012 Deposition of histone variant H2AZ
within gene bodies regulates responsive genes PLoS Genet 8
e1002988
Ecker JR Davis RW 1986 Inhibition of gene expression in plant cells
by expression of antisense RNA Proc Natl Acad Sci U S A 83
5372ndash5376
Flores K et al 2012 Genome-wide association between DNA methylation
and alternative splicing in an invertebrate BMC Genomics 13480
Glastad KM Hunt BG Yi SV Goodisman MAD 2011 DNA methylation in
insects on the brink of the epigenomic era Insect Mol Biol 20
553ndash565
Henikoff S 2008 Nucleosome destabilization in the epigenetic regulation
of gene expression Nat Rev Genet 915ndash26
Herb BR et al 2012 Reversible switching between epigenetic states in
honeybee behavioral subcastes Nat Neurosci 151371ndash1373
Hunt BG Glastad KM Yi SV Goodisman MAD 2013a The function of
intragenic DNA methylation insights from insect epigenomes Integr
Comp Biol 53319ndash328
Hunt BG Glastad KM Yi SV Goodisman MAD 2013b Patterning and
regulatory associations of DNA methylation are mirrored by histone
modifications in insects Genome Biol Evol 5591ndash598
Kharchenko PV et al 2011 Comprehensive analysis of the chromatin
landscape in Drosophila melanogaster Nature 471480ndash485
Klose RJ Bird AP 2006 Genomic DNA methylation the mark and its
mediators Trends Biochem Sci 3189ndash97
Kolasinska-Zwierz P et al 2009 Differential chromatin marking of
introns and expressed exons by H3K36me3 Nat Genet 41
376ndash381
Kucharski R Maleszka J Foret S Maleszka R 2008 Nutritional control of
reproductive status in honeybees via DNA methylation Science 319
1827ndash1830
Langmead B Trapnell C Pop M Salzberg S 2009 Ultrafast and memory-
efficient alignment of short DNA sequences to the human genome
Genome Biol 10R25
Li H et al 2009 The Sequence AlignmentMap format and SAMtools
Bioinformatics 252078ndash2079
Li-Byarlay H et al 2013 RNA interference knockdown of DNA methyl-
transferase 3 affects gene alternative splicing in the honey bee Proc
Natl Acad Sci U S A 11012750ndash12755
Lorincz MC Dickerson DR Schmitt M Groudine M 2004 Intragenic DNA
methylation alters chromatin structure and elongation efficiency in
mammalian cells Nat Struct Mol Biol 111068ndash1075
Luco RF Allo M Schor IE Kornblihtt AR Misteli T 2011 Epigenetics in
alternative Pre-mRNA splicing Cell 14416ndash26
Luco RF et al 2010 Regulation of alternative splicing by histone modifi-
cations Science 327996ndash1000
Lyko F et al 2010 The honey bee epigenomes differential methylation of
brain DNA in queens and workers PLoS Biol 8e1000506
Maunakea AK Chepelev I Cui K Zhao K 2013 Intragenic DNA methyl-
ation modulates alternative splicing by recruiting MeCP2 to promote
exon recognition Cell Res 231256ndash1269
Maunakea AK et al 2010 Conserved role of intragenic DNA methylation
in regulating alternative promoters Nature 466253ndash257
Nanty L et al 2011 Comparative methylomics reveals gene-body
H3K36me3 in Drosophila predicts DNA methylation and CpG land-
scapes in other invertebrates Genome Res 211841ndash1850
Negre N et al 2011 A cis-regulatory map of the Drosophila genome
Nature 471527ndash531
Ooi SKT et al 2007 DNMT3L connects unmethylated lysine 4 of histone
H3 to de novo methylation of DNA Nature 448714ndash717
Park PJ 2009 ChIP-seq advantages and challenges of a maturing tech-
nology Nat Rev Genet 10669ndash680
R Development Core Team 2011 R a language and environment for statis-
tical computing Vienna Austria R Foundation for Statistical Computing
Roberts A Pimentel H Trapnell C Pachter L 2011 Identification of novel
transcripts in annotated genomes using RNA-Seq Bioinformatics 27
2325ndash2329
Shao Z Zhang Y Yuan G-C Orkin S Waxman D 2012 MAnorm a robust
model for quantitative comparison of ChIP-Seq data sets Genome
Biol 131ndash17
Shukla S et al 2011 CTCF-promoted RNA polymerase II pausing links
DNA methylation to splicing Nature 47974ndash79
Simola DF et al 2013 A chromatin link to caste identity in the carpenter
ant Camponotus floridanus Genome Res 23486ndash496
Stasevich TJ et al 2014 Regulation of RNA polymerase II activation by
histone acetylation in single living cells Nature 516272ndash275
Suzuki MM Bird A 2008 DNA methylation landscapes provocative in-
sights from epigenomics Nat Rev Genet 9465ndash476
Trapnell C Pachter L Salzberg SL 2009 TopHat discovering splice junc-
tions with RNA-Seq Bioinformatics 251105ndash1111
Venkatesh S et al 2012 Set2 methylation of histone H3 lysine36
suppresses histone exchange on transcribed genes Nature 489
452ndash455
Weber M et al 2007 Distribution silencing potential and evolutionary
impact of promoter DNA methylation in the human genome Nat
Genet 39457ndash466
DNA Methylation and Chromatin in Insects GBE
Genome Biol Evol 7(4)931ndash942 doi101093gbeevv039 Advance Access publication February 26 2015 941
at Georgia Institute of T
echnology on July 9 2015httpgbeoxfordjournalsorg
Dow
nloaded from
Yi SV Goodisman MAD 2009 Computational approaches for under-
standing the evolution of DNA methylation in animals Epigenetics
4551ndash556
Zemach A McDaniel IE Silva P Zilberman D 2010 Genome-wide evolu-
tionary analysis of eukaryotic DNA methylation Science 328916ndash919
Zentner GE Henikoff S 2013 Regulation of nucleosome dynamics by
histone modifications Nat Struct Mol Biol 20259ndash266
Zhang Y et al 2008 Model-based analysis of ChIP-Seq (MACS) Genome
Biol 9R137
Zilberman D Coleman-Derr D Ballinger T Henikoff S 2008 Histone
H2AZ and DNA methylation are mutually antagonistic chromatin
marks Nature 456125ndash129
Zilberman D Gehring M Tran RK Ballinger T Henikoff S 2007 Genome-
wide analysis of Arabidopsis thaliana DNA methylation uncovers an
interdependence between methylation and transcription Nat Genet
3961ndash69
Associate editor Maria Costantini
Glastad et al GBE
942 Genome Biol Evol 7(4)931ndash942 doi101093gbeevv039 Advance Access publication February 26 2015
at Georgia Institute of T
echnology on July 9 2015httpgbeoxfordjournalsorg
Dow
nloaded from
13 113
DNA methylation and chromatin organization in insects insights from the ant Camponotus floridanus
Karl M Glastad Brendan G Hunt Michael A D Goodisman
Supplementary tables and figures
Table S1 Percentages of genes that were significantly methylated and also marked by a given hPTM as well as over- or under-representation of hPTM enrichment among methylated genes as determined by a Fisherrsquos exact test (all Fisherrsquos exact test P values ltlt 00001)
methylated that are also marked by hPTM
marked by hPTM that are also methylated
Fishers exact test significant direction
H3 811 708 over H3K4me3 806 79 over H3K4me1 272 80 over
H3K27me3 12 234 under H3K27ac 858 695 over
H3K36me3 796 796 over H3K9me3 15 33 under
H3K9ac 673 421 over PolII 495 661 over
13 213
Table S2 Spearmanrsquos rank correlations between fractional DNA methylation and histone modification normalized tag enrichment at genic features (ldquoTSS-proximalrdquo represents a 2kb length-normalized gene measure 500bp upstream of TSS to 15kb downstream of gene start) P lt 00001 for all listed correlations
TSS-proximal Exon Intron H3 0599 0307 0185
H3K4me3 0621 0417 0290 H3K4me1 0158 0361 0182
H3K27me3 0162 -0086 -0143 H3K27ac 0596 0376 0349
H3K36me3 0617 0459 0202 H3K9me3 -0564 -0448 -0319
H3K9ac 0272 -0153 -0052 PolII 0464 0121 0134
13 313
Table S3 Numbers of HMRs associated with specific gene features Genic intersecting any gene annotation (gene set model or valid cufflinks transcript) Proximal falling within 2kb either up- (5rsquo) or downstream (3rsquo) of any gene annotation Non-genic HMRs not falling within 2kb of a gene annotation Non-genic HMRs were further divided into those which showed experimental evidence of expression (gt4 RNA-sequencing reads mapped to HMR) despite the lack of a gene annotation and those without (without RNA-seq)
Feature HMR count Genic 6927 exonic 4447 Intronic 2480 Proximal 433 5rsquo 100 3rsquo 333 Non-genic 22 with RNA-seq 8 without RNA-seq 14 Total 7382
13 413
Table S4 Association tests between a genomic regionrsquos differential methylation status (whether it is a DMR or unchanging methylated region) and differential ChIP enrichment (differentially enriched between castes or not) for the 8 factors assessed in this study among windows with sufficient DNA methylation and differential enrichment data
NS non-significant
DMR
status
nonDiffChip
DiffChip N P value
H3K27ac nonDMR 4844 5156 5850
NS DMR 4798 5202 2728
H3K27me3 nonDMR 60 40 597
NS DMR 5588 4412 300
H3K36me3 nonDMR 2965 7035 5501
lt00001 DMR 2561 7439 2722
H3K4me1 nonDMR 859 141 2128 NS
DMR 8622 1378 849
H3K4me3 nonDMR 439 561 5917 lt00001
DMR 3863 6137 3219
H3K9ac nonDMR 6969 3038 2946 00031
DMR 6521 3479 1602
H3K9me3 nonDMR 5811 4189 101 NS
DMR 5556 4444 85
PolII nonDMR 4731 5269 4170
NS DMR 4815 5185 1942
13 513
Table S5 Comparisons between differentially methylated regions and overlapping differentially enriched ChIP calls (using standard data from lsquoconsolidatedClsrsquo file) P value from likelihood ratio test Percentages reflect the percent membership a given row shows in the associated column
Differential methylation call Male Worker NA P value
Diff
eren
tial C
hIP
enric
hmen
t cal
l
H3K27ac Male 4623 543 5078
00004 Worker 5377 457 4822
N 928 1606 4525
H3K27me3 Male 9552 9247 9233 NS
Worker 448 753 767
N 67 93 313
H3K36me3 Male 8825 895 874
00068 Worker 1175 105 126
N 2196 3112 7981
H3K4me1 Male 3077 3265 3121 NS
Worker 6923 6735 6879
N 91 147 487
H3K4me3 Male 7845 8497 7871 lt00001
Worker 2155 1503 2129
N 815 1942 5077
H3K9ac Male 9097 8085 831 00145
Worker 903 1915 169
N 144 329 728
H3K9me3 Male 4048 2683 3333 NS
Worker 5952 7317 6667
N 42 41 87
PolII Male 545 632 591
00010 Worker 455 368 409
N 556 1333 3579 NS non-significant
13 613
Figure S1 hPTM levels explain DNA methylation variation Model coefficients for multiple regression of hPTM enrichment levels against DNA methylation levels within the same feature for a) CDS and b) exons+introns (as distinct features) as the dependent variable Magnitude of bars represent estimated model coefficients Interaction terms not included Error bars represent standard error R2 values given represent adjusted R2 for full model fit
13 713
Figure S2 Methylated CpGs are strongly over- or under-represented among regions significantly enriched for different hPTMs For both a) within all gene bodies as well as b) within only methylated gene bodies the log2-transformed ratio of the proportion of methylated CpGs (mCGs) falling within the given hPTM-enriched regions to that of of all CpGs (allCGs) falling within the same regions is given
13 813
Figure S3 DNA methylation is correlated with hPTM enrichment at a fine spatial scale within genes The correlation coefficients for spearmanrsquos rank correlations between DNA methylation and hPTM enrichment for each hPTM for 500bp windows downstream of gene TSSs are shown Each point represents the correlation between DNA fractional methylation and the given hPTM tag fold enrichment within a 500bp window starting the given distance (x axis) from the TSS (eg TSS=0-500bp from start of TSS) Only genes longer than 25kb were used All correlations are significant (Plt005)
13 913
Figure S4 Levels of expression bias (average of absolute log2(FPKM) ratios for 3 comparisons) of genes associated with histone modifications Methylated genes exhibit consistently lower levels of expression bias relative to unmethylated genes
13 1013
Figure S5 Chip profiles as they relate to highly methylated regions (HMRs) localized to exons and introns Shown ChIP measures correspond to those in Figure 3 of the main text
13 1113
Figure S6 RNA polymerase II ChIP enrichment (log2 fold enrichment over input) within highly methylated regions (HMRs) as well as 1kb regions in the 5rsquo and 3rsquo directions (upS and dnS respectively) split both by HMR proximity to a gene start as well as grouped into 3 HMR length classes All comparisons are significant below the plt00001 level
13 1213
Figure S7 H3K4me1 is enriched within highly methylated regions (HMRs) independent of genic context H3K4me1 values shown for HMRs and 1kb bins up- and downstream (upS and dnS respectively) of HMR for HMRs overlapping the region -2kb-0kb from gene starts (5prox) exons and introns HMR DNA methylation levels were split into 4 equally-sized ascending quartiles to illustrate opposite relationship between DNA methylation level and H3K4me1 enrichment between regions upstream of HMRs and HMRs themselves
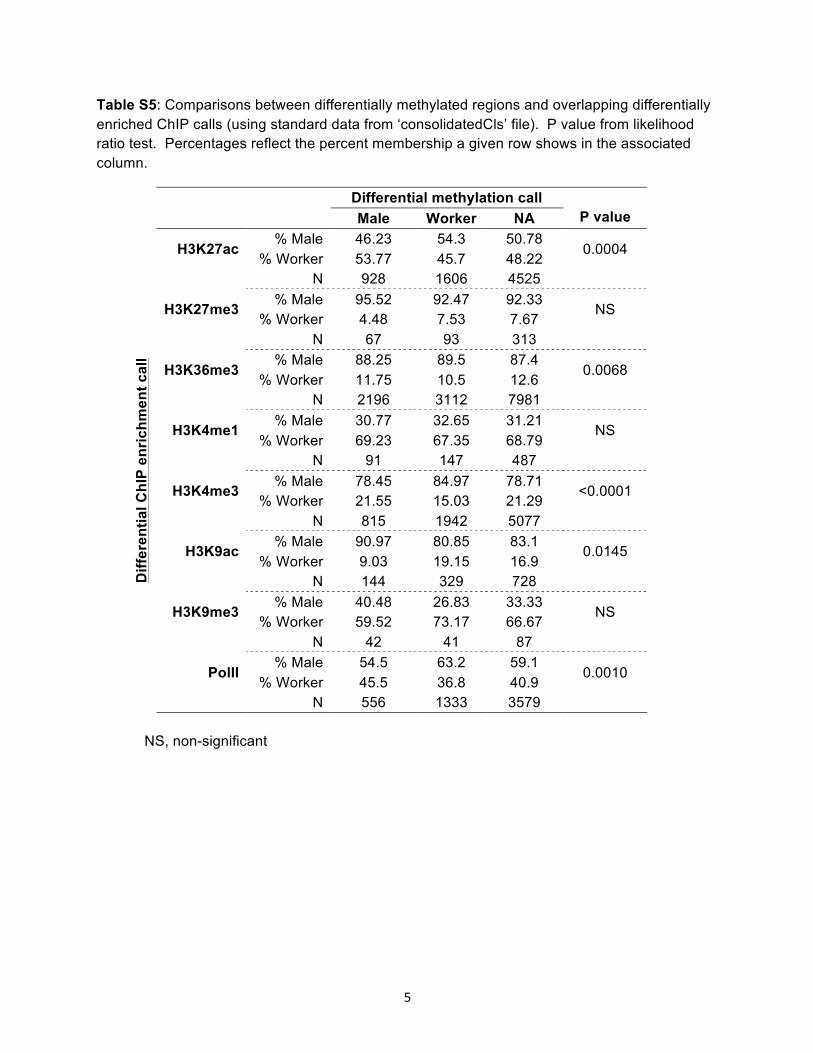